MARKET SUMMARY
Latest Situation in Crypto Assets
| Assets | Last Price | 24h Change | Dominance | Market Cap. |
|---|---|---|---|---|
| BTC | 96,486.20 | 0.11% | 55.36% | 1,91 T |
| ETH | 3,686.90 | -0.35% | 12.87% | 443,80 B |
| XRP | 2.440 | 29.64% | 4.04% | 139,29 B |
| SOLANA | 229.09 | -2.79% | 3.16% | 108,84 B |
| DOGE | 0.4390 | 2.93% | 1.87% | 64,62 B |
| CARDANO | 1.156 | 9.81% | 1.18% | 40,60 B |
| AVAX | 47.97 | 8.75% | 0.57% | 19,64 B |
| TRX | 0.2113 | 2.65% | 0.53% | 18,25 B |
| SHIB | 0.00003028 | -1.45% | 0.52% | 17,86 B |
| DOT | 9.178 | 4.50% | 0.41% | 14,03 B |
| LINK | 19.72 | 6.23% | 0.36% | 12,37 B |
*Prepared on 12.2.2024 at 07:00 (UTC)
WHAT’S LEFT BEHIND
Michael Saylor’s Bitcoin Proposal to Microsoft
In a short presentation to Microsoft’s board of directors, Michael Saylor suggested adopting Bitcoin as a core corporate strategy for the company. Saylor stated that Bitcoin, as digital capital, could revolutionize the approximately $900 trillion global asset market. He also predicted that Bitcoin’s market capitalization could rise from the current $2 trillion to $280 trillion by 2045, surpassing bonds and gold.
XRP Leaves SOL Behind to Take Fourth Place in Market Cap Rankings
According to CoinGecko data, XRP temporarily traded at $2.28, up 17.6%, and its market capitalization reached approximately $130.1 billion. With this rise, XRP moved into fourth place in the crypto market with a market capitalization of $112.7 billion, surpassing SOL, which fell 0.3%.
Ethereum Returns to the Top 30 in Global Asset Market Value
Ethereum’s market capitalization has risen to 29th place in the ranking of the world’s largest assets, overtaking giants such as Costco and Vanguard Group. According to data released by Cointelegraph, Ethereum is once again gaining attention in the global financial competition.
Ripple Locks 1 Billion XRP in Custody Wallet
According to Whale Alert data, Ripple locked 1 billion XRP worth $1.546 billion into custody wallets in the morning hours. While the transactions took place at 02:21 and 02:22, this move was considered an important step towards Ripple’s supply control strategy.
HIGHLIGHTS OF THE DAY
Important Economic Calender Data
Today’s Key Events and Economic Indicators
| Time | News | Expectation | Previous |
|---|---|---|---|
| All Day | ApeCoin (APE): AIP Votes | – | – |
| All Day | Numeraire (NMR): Signals V2 | – | – |
| All Day | Xai (XAI): Xai Airdrop | – | – |
| 14:45 | US Final Manufacturing PMI (Nov) | 48.8 | 48.8 |
| 15:00 | US ISM Manufacturing PMI (Nov) | 47.7 | 46.5 |
| 20:15 | US FOMC Member Waller Speaks | – | – |
| 21:30 | US FOMC Member Williams Speaks | – | – |
INFORMATION
*The calendar is based on UTC (Coordinated Universal Time) time zone. The economic calendar content on the relevant page is obtained from reliable news and data providers. The news in the economic calendar content, the date and time of the announcement of the news, possible changes in the previous, expectations and announced figures are made by the data provider institutions. Darkex cannot be held responsible for possible changes that may arise from similar situations.
MARKET COMPASS
Starting the first trading day of the last month of the year, traditional markets continue to monitor macro indicators and the statements of policymakers, especially Trump. Expectations that China may take new steps to support the economy kept Asian stock markets up, while European indices, where the political agenda dominates, are expected to start the day on the negative side.
This time, US President-elect Trump used the tariff weapon to threaten the BRICS countries. The president said that these countries could face 100% tariffs if they move away from the dollar. After the statement, the dollar appreciated in the first transactions in Asia and the dollar index rose around 106.36.
On the digital assets front, it was noteworthy that ETF inflows reached a record high in November, revealing that the interest of institutional investors continued to increase. In addition, XRP’s market cap surpassed SOL after its recent gains. While major digital assets retreated in the first transactions of the Asian session, we think this may continue during European transactions. With the opening of the US session, we will watch whether we will see a settlement in the pullbacks.
From the short term to the big picture.
The victory of former President Trump on November 5, which was one of the main pillars of our bullish expectation for the long-term outlook in digital assets, produced a result in line with our forecasts. In the aftermath, the president-elect’s appointments to Congress and the increased regulatory expectations for the crypto ecosystem in the US remained in our equation as a positive variable. Although Powell gave cautious messages in his last speech, the fact that the FED continued its interest rate cut cycle and the volume in BTC ETFs indicates an increase in institutional investor interest (in addition, MicroStrategy’s BTC purchases, Microsoft’s start to evaluate the purchase issue, BlackRock’s BTC ETF options start trading …) supports our upward forecast for the big picture for now.
For the short term, given the nature of the market and pricing behavior, we think it would not be surprising to see occasional respite or pullbacks in digital assets. However, at this point, it would be useful to underline again that the fundamental dynamics continue to be bullish.
TECHNICAL ANALYSIS
BTC/USDT
Ahead of Microsoft’s shareholder vote on the purchase of Bitcoin on December 10, Michael Saylor made a Bitcoin proposal. In a short presentation to the Microsoft board of directors, Saylor suggested that Bitcoin be adopted as a core corporate strategy for the company. With a market capitalization of over $3 trillion, Microsoft, the third largest company in the US, could become a leader in this field, leaving companies such as Tesla and MicroStrategy behind if it invests in Bitcoin.
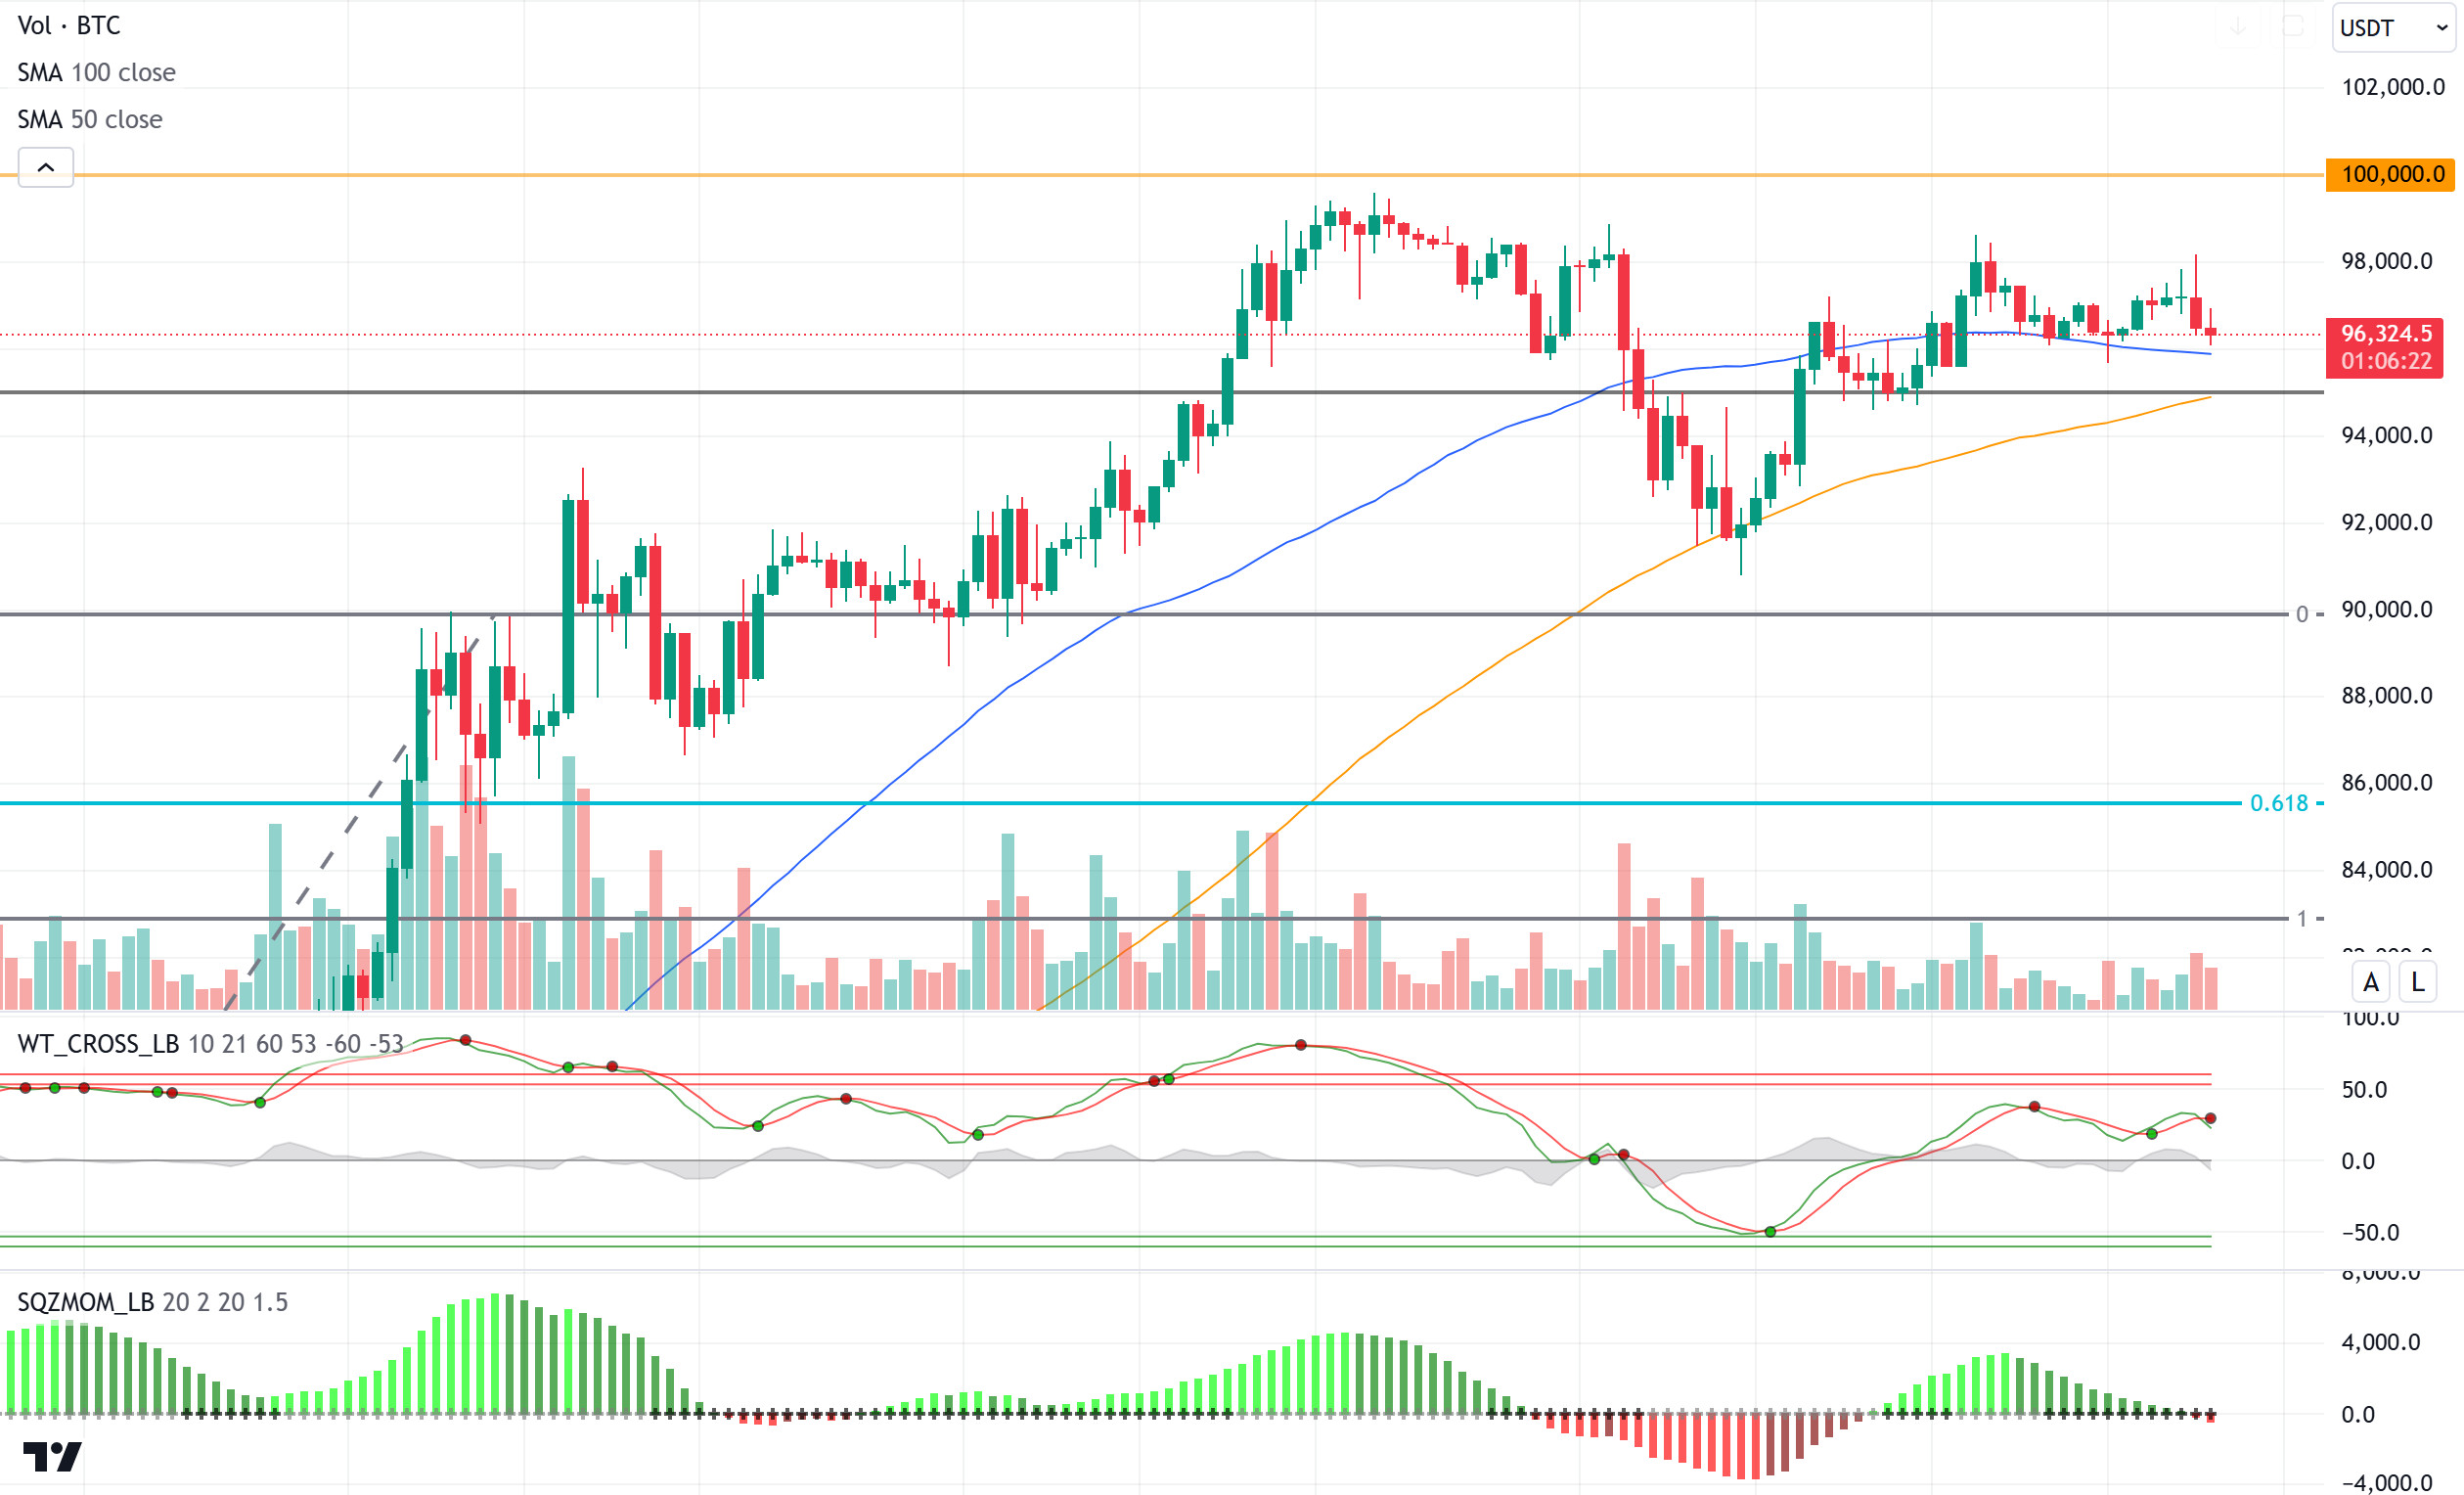
When we look at the BTC technical outlook before this development, which will be closely followed in the coming period, we see that the price is consolidating between 95,000 and 100,000 levels. Currently trading at 96,300, BTC is pricing above the 50 and 100-day SMA lines. With our technical oscillators giving a sell signal, the momentum indicator is weakening. In the event of a possible pullback, we see that the 100-day SMA line has risen to the support level, although we are again monitoring the 95,000 support level. In the continuation of the upward trend, crossing six-digit levels may bring a new bullish wave by strengthening momentum again.
Supports 95,000 – 92,500 – 90,000
Resistances 99,655 – 100,000 – 105,000

ETH/USDT
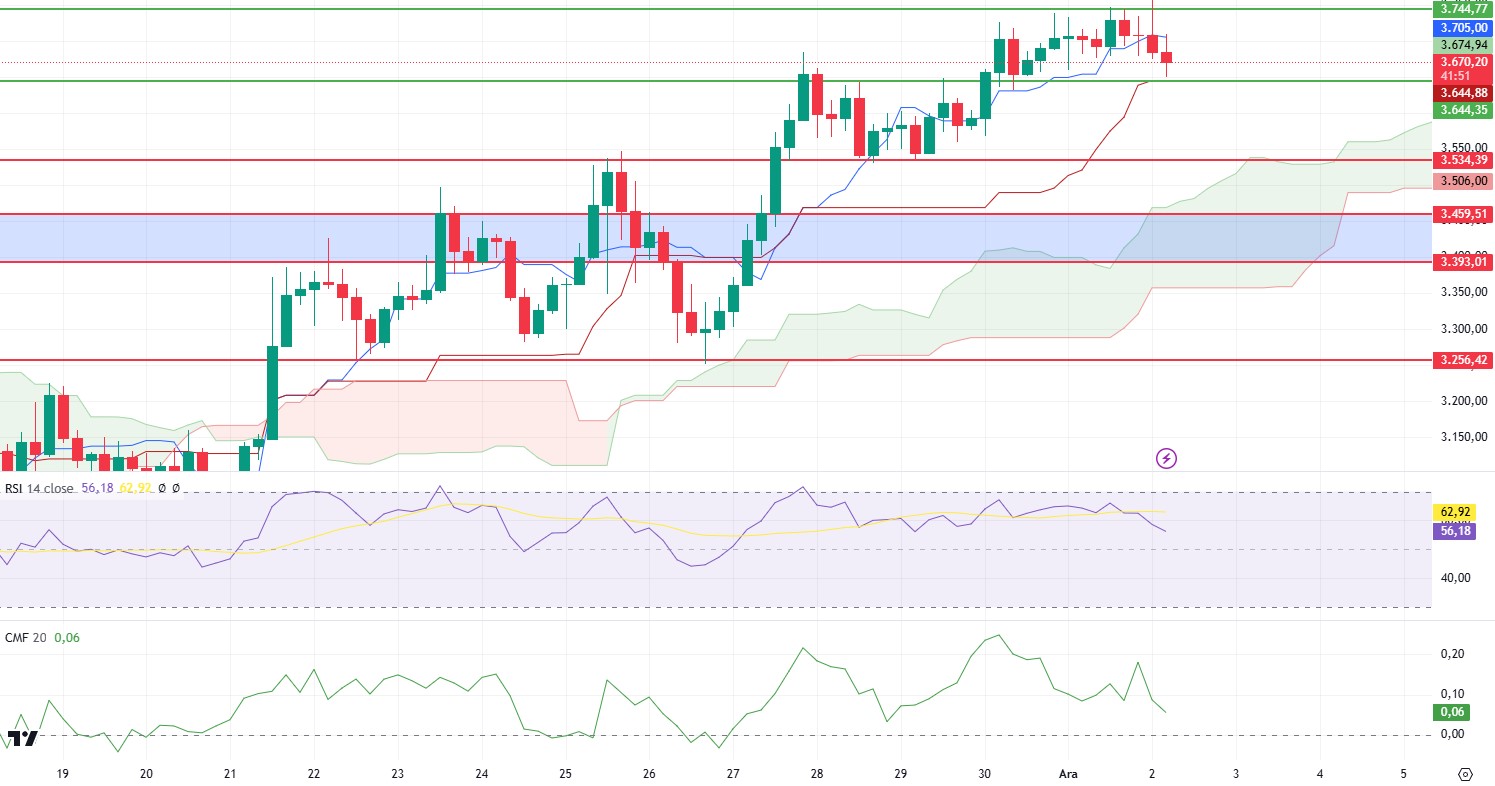
ETH has started to move sideways in the 2,653 – 2,744 area after managing to rise above the 2,600 level over the weekend. Looking at the Ichimoku indicator, we see a rising kumo cloud and a price squeezed between the tenkan and kijun levels. The fact that the kijun level is not lost indicates that the rise may continue. Chaikin Money Flow (CMF) is moving horizontally in the positive area while Relative Strength Index (RSI) is in a downward trend. . When we look at the Cumulative Volume Delta (CVD), we see that the sharp needle that came to 2.653 at night was realized due to the sales on the futures side, while spot purchases remained strong. On the negative side, funding ratios rose very high to 0.0435. With all this data. Provided that the price does not fall below 3,644 support, which is also the kijun level, we can see new highs in ETH during the day. If it falls below this support, we may see corrections up to 3,534.
Supports 3,644 – 3,534 – 3,459
Resistances 3,744- 3,839 – 3,973

XRP/USDT
XRP has been on a strong uptrend in the market. It has performed remarkably, reaching a three-year high. According to current data, XRP is trading at $1.84 and has increased by more than 267% this month. There are several important factors behind this rapid rise. XRP’s active role, especially in cryptocurrency payment solutions, is attracting the attention of institutional investors. This also increases confidence in XRP’s long-term potential and keeps investors’ interest alive.
XRP is on a strong bullish momentum. However, since it is in the overbought zone, profit sales may be seen in the short term. However, both the Relative Strength Index (RSI) level hovering in the overbought zone and the mismatches on the Commodity Channel Index (CCI) and Money Flow Index (MFI) formed on the daily timeframe indicate that possible correction movements may occur sharply.
Supports 1.9101- 1.6309 – 1.2870
Resistances 3.105
“XRPUSDT Image to be Added”
SOL/USDT
Today’s US manufacturing data index may lead to price fluctuations. In the Sol ecosystem, a significant decline in SOL’s price momentum caused pessimism among traders. The Solana Long/Short ratio highlights the pessimism, with short traders accounting for more than 54% of market positions. This suggests that many traders expect a drop in SOL’s price. Moreover, a look at Open Interest revealed a worrying trend. The indicator value continues to fall. Last week, it dropped from 6 billion to 5 billion. This kind of decline usually signifies an exit from positions and shows a loss of confidence among investors. On the other hand, memecoin launchpad platform Pump.fun suffered a 33% revenue loss after shutting down live streams. After canceling the live streaming feature, the platform’s revenues decreased by $1.4 million.
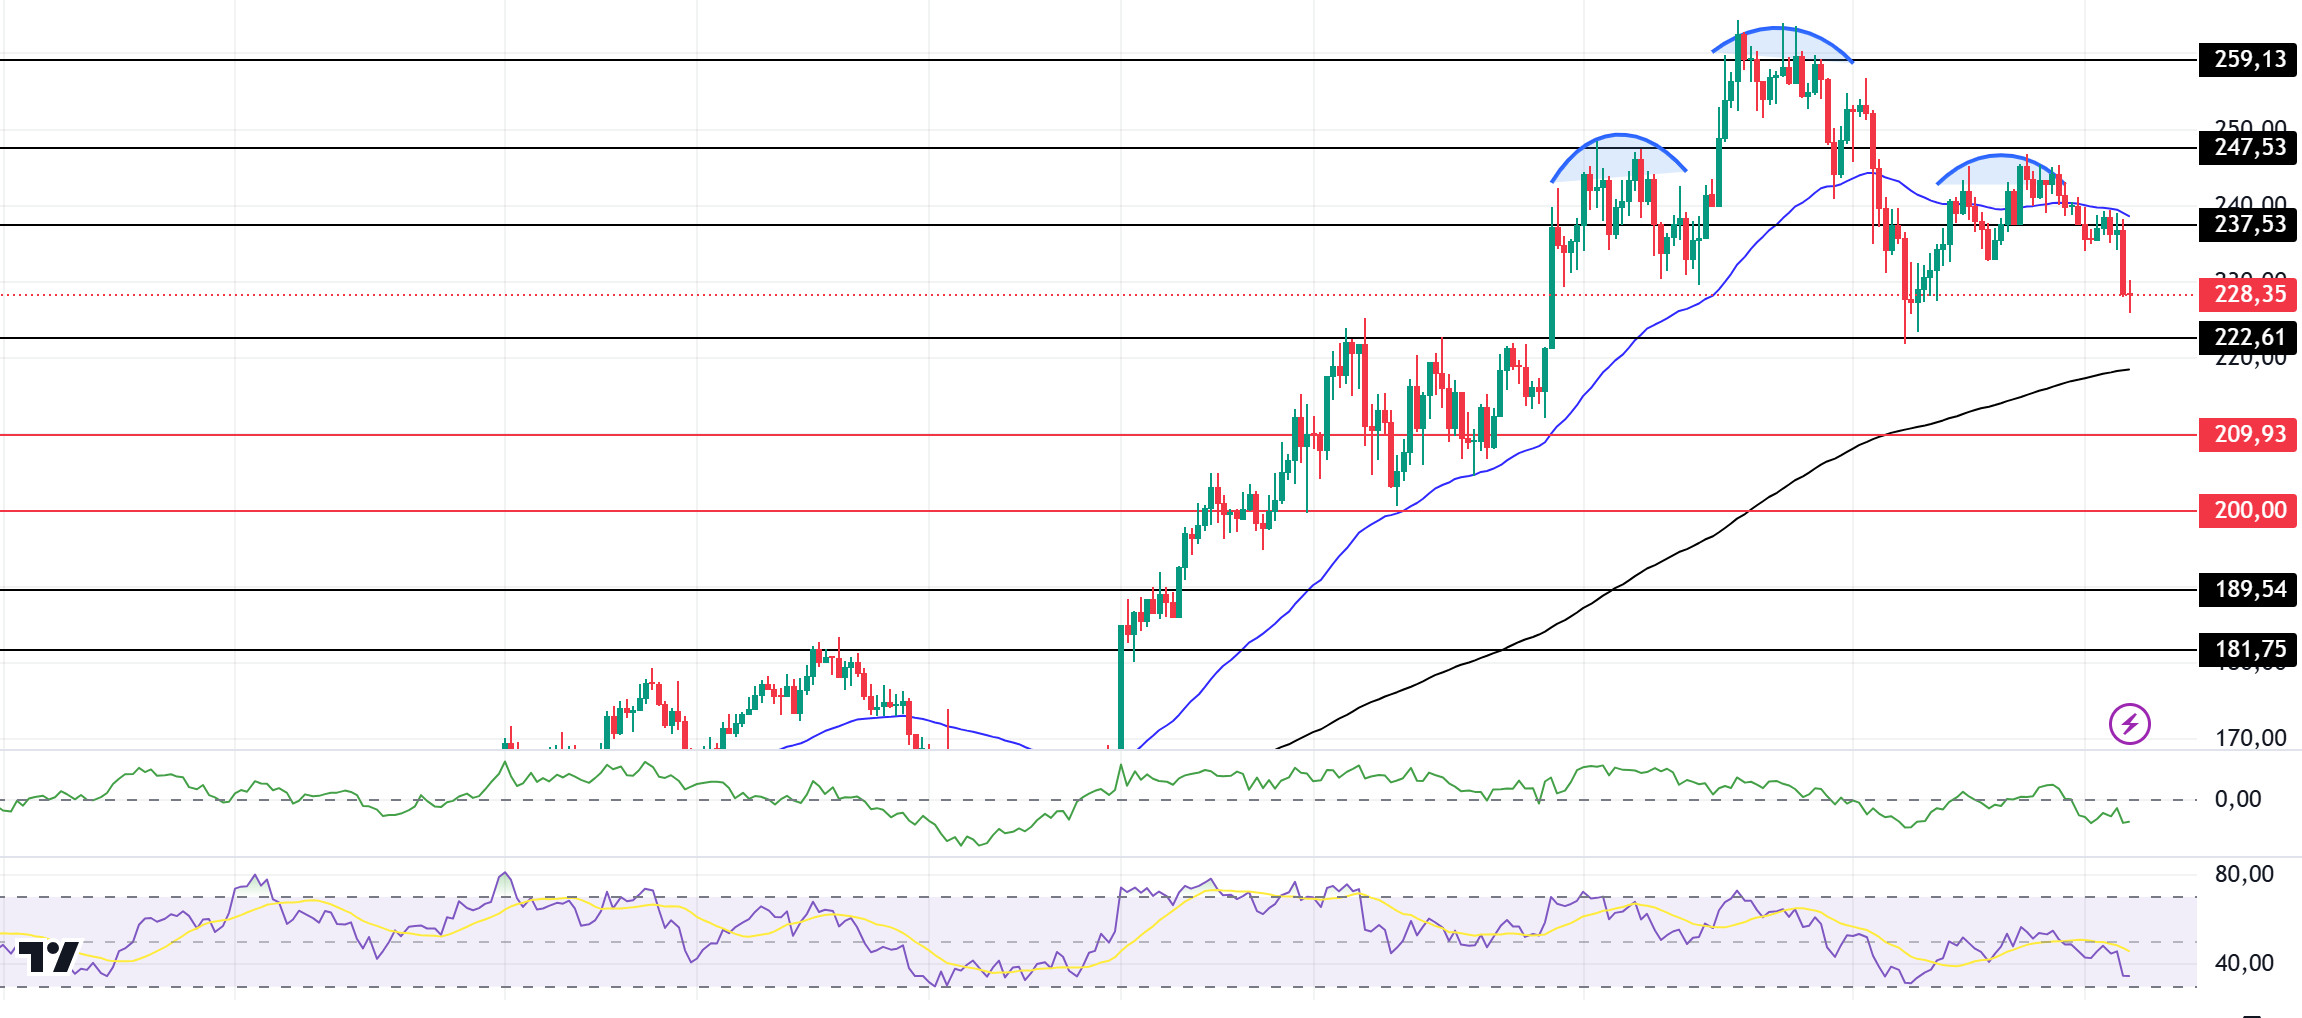
On the 4-hour timeframe, the 50 EMA (Blue Line) is above the 200 EMA (Black Line). Since November 22, SOL, which has been in a downtrend since November 22, broke the downtrend last week and moved upwards. However, this did not last long and it rejoined the downtrend. However, when we examine the Chaikin Money Flow (CMF)20 indicator, we see that there is a great decrease in money inflows. At the same time, Relative Strength Index (RSI)14 is in the oversold zone. This can be shown as a bullish signal. Another potential directional indicator on the chart is the head and shoulders pattern. If this pattern works, a decline to 189.54 may occur. The 247.53 level stands out as a very strong resistance point in the rises driven by both macroeconomic conditions and innovations in the Solana ecosystem. If it breaks here, the rise may continue. In case of retracements due to possible macroeconomic reasons or profit sales, support levels 222.61 and 189.54 may be triggered again. If the price reaches these support levels, a potential bullish opportunity may arise if momentum increases.
Supports 222.61 – 209.93 – 200.00
Resistances 237.53 – 247.53 – 259.13

DOGE/USDT
The manufacturing data index coming from the US today may lead to price fluctuations. In the Doge ecosystem, Dogecoin’s consolidation or profit sales continue. But when we look at onchain data, Open Interest data, which has increased in the last 24 days, has increased from $ 3 billion to about $ 4 billion. This increased open interest shows the strong faith and confidence of traders in the token and has led to an increase in new open positions. In addition to the strong participation of traders, the volume of large trades by whales increased by 41.15%, according to data by on-chain analytics firm IntoTheBlock, indicating increased activity from long-term holders. On the other hand, Elon Musk and Vivek Ramaswamy will visit Capitol Hill next week. This could boost the price.
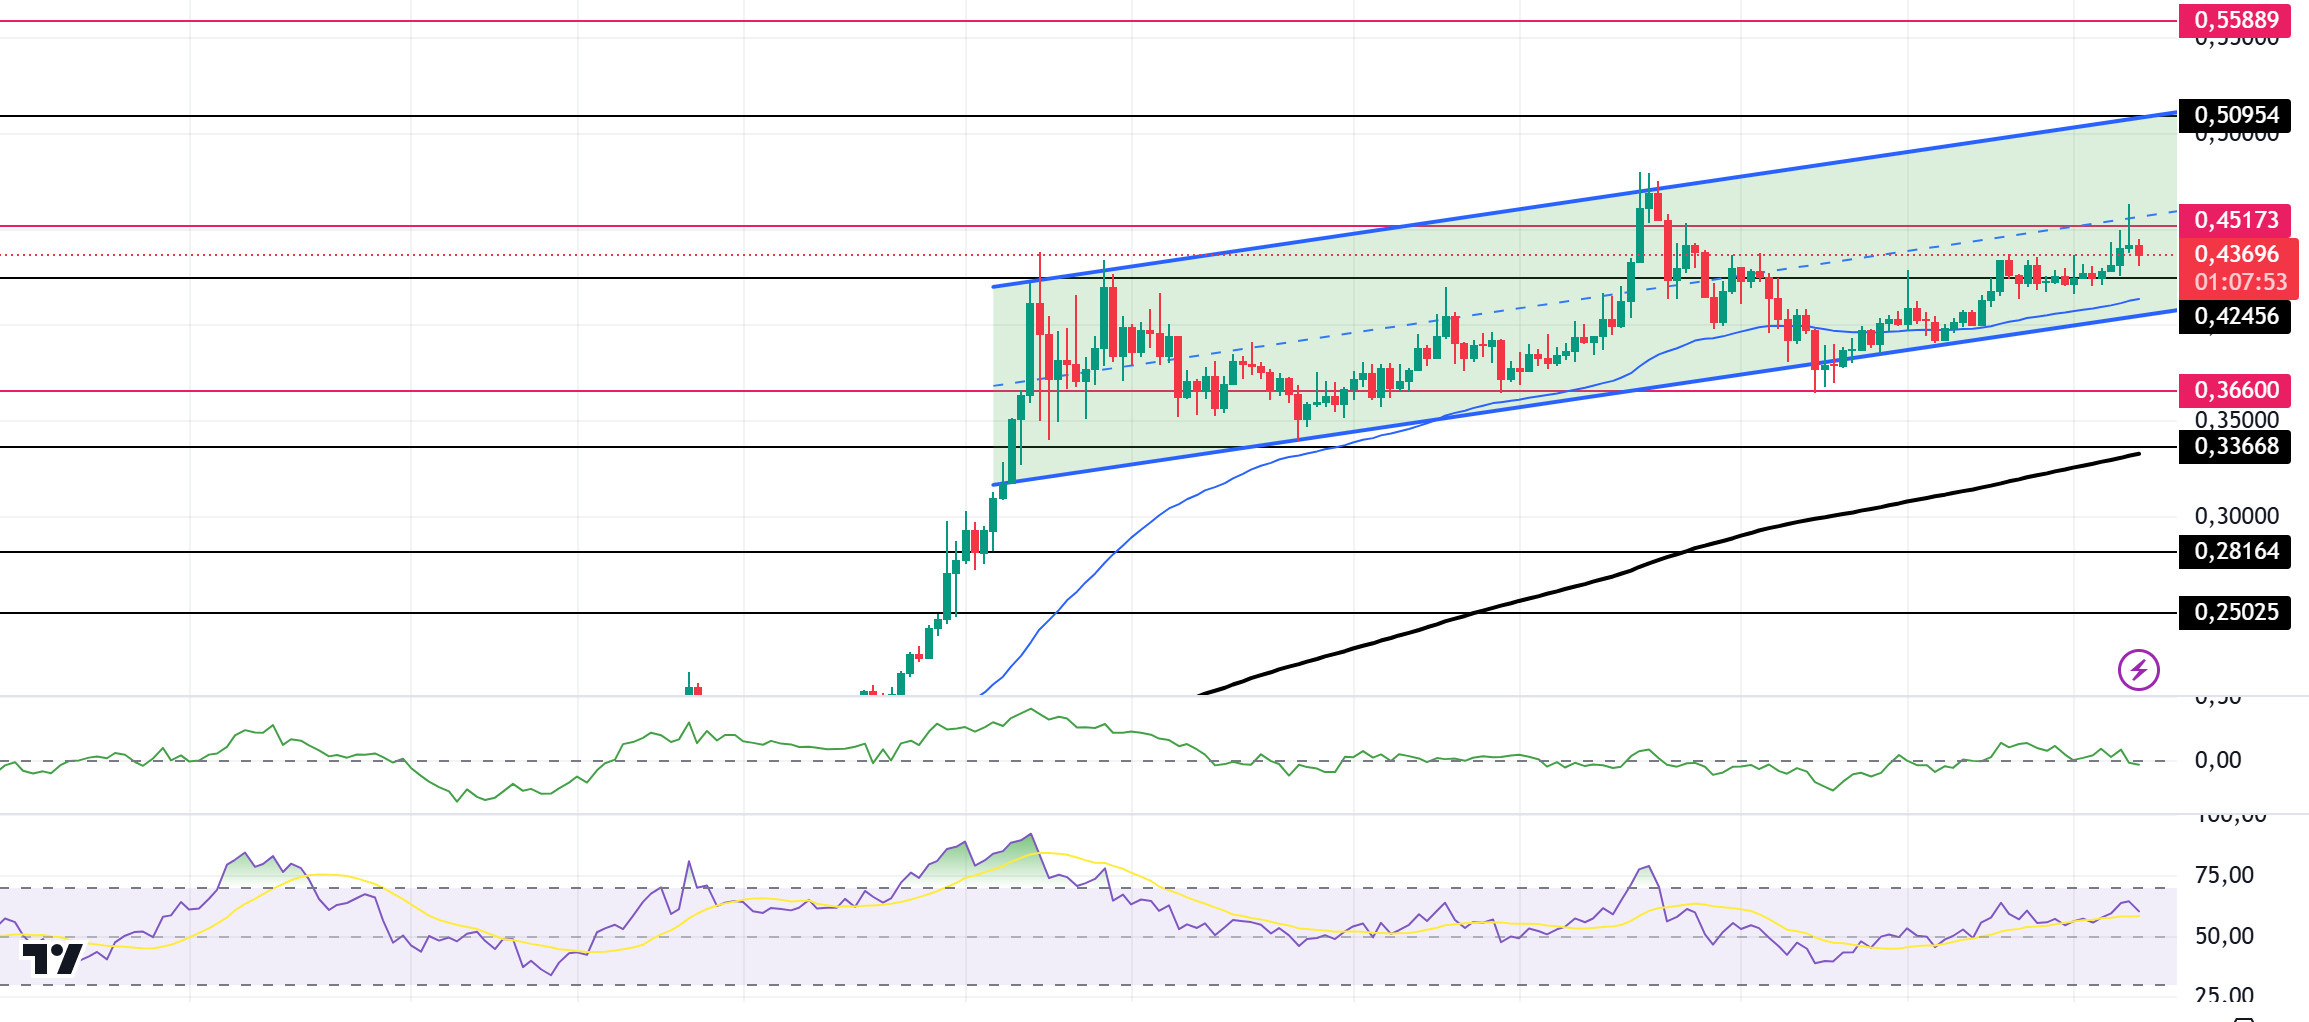
When we look at the chart, the asset, which has been in an uptrend since November 11, is priced at the middle levels of the trend. If the upward acceleration is strong, the 0.50954 level may be triggered. On the 4-hour timeframe, the 50 EMA (Blue Line) is above the 200 EMA (Black Line). But the gap between the two averages is still too wide. This may cause pullbacks. On the other hand, when we look at the RSI 14 indicator, it is about to come from the overbought zone to the neutral level. However, when we examine the Chaikin Money Flow (CMF)20 indicator, we see that there are money outflows. The 0.50954 level appears to be a very strong resistance point in the rises driven by both macroeconomic conditions and innovations in Doge coin. If DOGE maintains its momentum and rises above this level, the rise may continue strongly. In case of retracements due to possible macroeconomic reasons or profit sales, the support levels of 0.42456 and 0.36600 can be triggered again. If the price hits these support levels, a potential bullish opportunity may arise if momentum increases.
Supports 0.42456 – 0.36600 – 0.33668
Resistances 0.45173 – 0.50954 – 0.55889

LEGAL NOTICE
The investment information, comments and recommendations contained herein do not constitute investment advice. Investment advisory services are provided individually by authorized institutions taking into account the risk and return preferences of individuals. The comments and recommendations contained herein are of a general nature. These recommendations may not be suitable for your financial situation and risk and return preferences. Therefore, making an investment decision based solely on the information contained herein may not produce results in line with your expectations.


