MARKET SUMMARY
Latest Situation in Crypto Assets
| Assets | Last Price | 24h Change | Dominance | Market Cap |
|---|---|---|---|---|
| BTC | 94,750.25 | -1.97% | 57.37% | 1,88 T |
| ETH | 3,277.79 | -1.95% | 12.09% | 394,79 B |
| XRP | 2.162 | -2.95% | 3.79% | 123,82 B |
| SOLANA | 180.88 | -1.30% | 2.66% | 86,91 B |
| DOGE | 0.3102 | -1.63% | 1.40% | 45,71 B |
| CARDANO | 0.8808 | -1.29% | 0.95% | 30,93 B |
| TRX | 0.2454 | 0.06% | 0.65% | 21,15 B |
| AVAX | 36.00 | -4.10% | 0.45% | 14,75 B |
| LINK | 22.42 | 1.67% | 0.44% | 14,30 B |
| SHIB | 0.0000214 | -0.62% | 0.39% | 12,58 B |
| DOT | 6.847 | -1.99% | 0.32% | 10,45 B |
*Prepared on 12.23.2024 at 07:00 (UTC)
WHAT’S LEFT BEHIND
Trump Appoints Bo Hines as Executive Director of the Digital Asset Advisory Council
US President Donald Trump has appointed Bo Hines as the executive director of the President’s Digital Asset Advisory Council. In this new role, Hines will collaborate with David Sacks to promote innovation in the digital asset sector.
Trump Nominates Sriram Krishnan as Senior Policy Advisor in the White House
US President-elect Trump has appointed former a16z partner Sriram Krishnan as senior policy advisor on artificial intelligence in the White House Office of Science and Technology Policy.
Jeff Bezos and Bitcoin Rumors
Jeff Bezos dismissed rumors that he was planning a $600 million wedding. Meanwhile, Michael Saylor and other billionaires drew attention with statements about Bitcoin’s rise in value. The increase in MicroStrategy’s Bitcoin assets was also on the agenda during this period.
Hut 8’s Strategic Bitcoin Reserve Strategy
NASDAQ-listed Bitcoin miner Hut 8 aims to build a strategic Bitcoin reserve backed by capital and operational strategies, according to its CEO Asher Genoot. The company plans to provide long-term returns to shareholders through low-cost production and strategic market acquisitions.
UAE’s $40 Billion Bitcoin Reserve Sparks Controversy
The claim that the UAE owns $40 billion worth of Bitcoin has become a hot topic. Binance CEO CZ questioned the accuracy of this data and stated that the figures are higher than estimated.
HIGHLIGHTS OF THE DAY
Important Economic Calender Data
| Time | News | Expectation | Previous |
|---|---|---|---|
| – | General Event (CRYPTO): MemeWave 2025 | – | – |
| – | Space ID (ID): Reward Distribution | – | – |
| – | Delysium (AGI): AMA Podcast | – | – |
| – | BNB: MemeWave 2025 Conference | – | – |
| 15:00 | US CB Consumer Confidence (Dec) | 112.9 | 111.7 |
INFORMATION
*The calendar is based on UTC (Coordinated Universal Time) time zone.
The economic calendar content on the relevant page is obtained from reliable news and data providers. The news in the economic calendar content, the date and time of the announcement of the news, possible changes in the previous, expectations and announced figures are made by the data provider institutions. Darkex cannot be held responsible for possible changes that may arise from similar situations.
MARKET COMPASS
Traditional markets have started the Christmas week. Stock exchanges will be closed in the US on Wednesday and in many countries with major stock exchanges on Wednesday and Thursday due to holidays. Accordingly, volumes can be expected to decline and this may last until the second week of January.
Asian stock markets and European and US index futures started the new week on a positive note. After the US government shutdown was averted and the Federal Reserve (FED) adopted a hawkish stance at its last meeting, the PCE Index, an inflation indicator, fell below expectations, which played a role in these rises. The dollar index is flat.
As we noted in last week’s analysis, major digital assets continued to be under pressure, despite brief rebounds. The FED’s latest stance did not change the main dynamics of the equation, but it caused a shift in their weighting. In line with this, expectations that financial conditions in the coming period will be slightly tighter than previously thought, led to sales in cryptocurrencies and outflows from ETFs. Since we do not expect the pricing brought about by this trend to stabilize in a short time, we mentioned that the downward pressure in the short-term outlook may continue in our analysis, assuming that the effect of this course will continue. However, we do not yet see enough reason to change our long-term expectation and underline that it is important to see the process that will follow after Trump officially takes office on January 20.
For the rest of today, we think that the volume will be relatively low and the consumer confidence data from the US (albeit slightly) may be effective. We maintain our expectation that the pressured outlook will continue for the short term with interim rebounds.
From the short term to the big picture.
The victory of former President Trump on November 5, which was one of the main pillars of our bullish expectation for the long-term outlook in digital assets, produced a result in line with our predictions. Afterwards, the appointments made by the president-elect and the expectations of increased regulation of the crypto ecosystem in the US continued to be a positive variable in our equation. Although it is expected to continue at a slower pace, the FED’s signal that it will continue its interest rate cut cycle and the volume in BTC ETFs indicating an increase in institutional investor interest (in addition to MicroStrategy’s BTC purchases, BlackRock’s BTC ETF options start trading…) support our upward forecast for the big picture for now.
In the short term, given the nature of the market and pricing behavior, we think it would not be surprising to see occasional pauses or pullbacks in digital assets. However, at this point, it is worth emphasizing again that the fundamental dynamics continue to be bullish. After the FED’s recent announcements, we think that the declines, which took place with short-term recoveries and are still ongoing, are in line with the market texture and are necessary for healthier potential rises for the long term.
TECHNICAL ANALYSIS
BTC/USDT
As the new year approaches, falling risk appetite has caused Bitcoin to retreat slightly from its all-time high of 108,000. However, with the change in market sentiment, declines in this bull market have been limited. On the other hand, the management team of Donald Trump, who will take office in January, continues to be clarified. Trump appointed Bo Hines as the executive director of the “President’s Digital Asset Advisory Council”. In this role, Hines will work with David Sacks to support innovation in the digital asset sector.
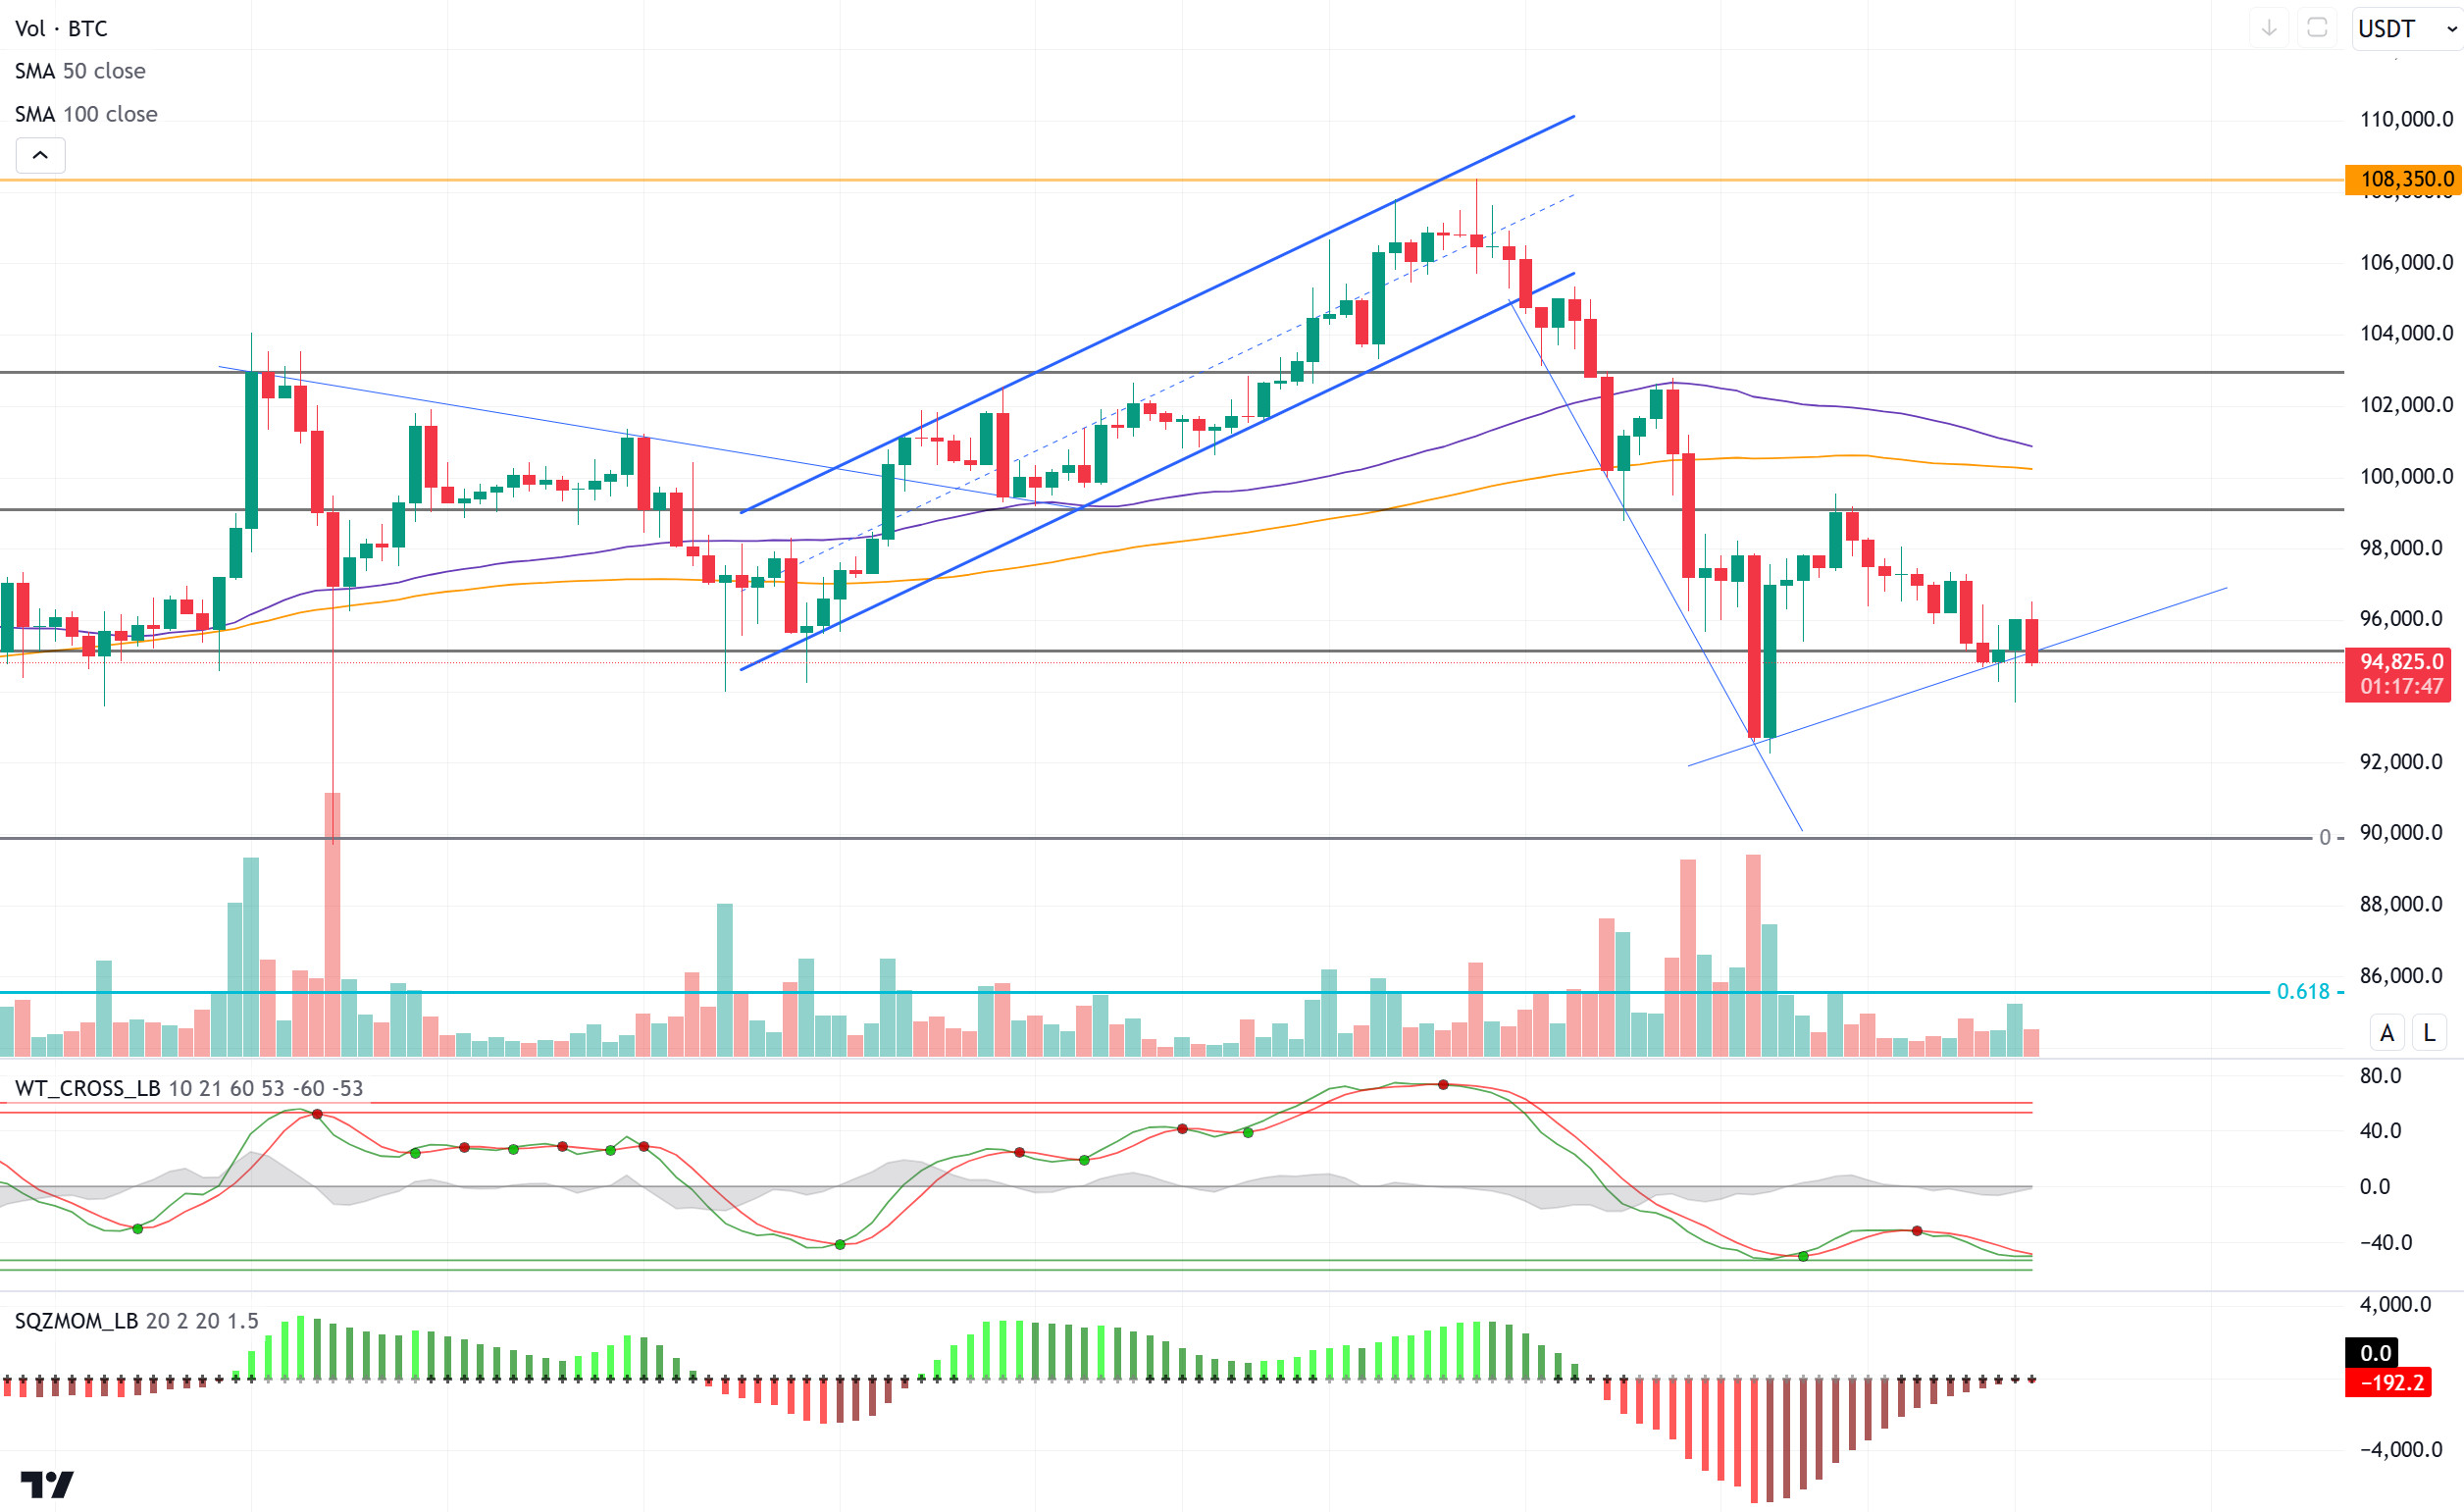
When we look at the technical outlook after the weekend with the latest developments, BTC, which fell to 92,000 after the FED meeting, could not exceed this level, although it compensated for some of the losses by coming to the 99,100 resistance level at the weekend. Turning down again before Christmas, BTC is currently trading at 95,000. Technical oscillators continue to maintain the sell signal in the oversold zone for the time being, while the momentum indicator is observed to weaken well in the negative zone. In BTC, which is correcting its recent decline, closures below the 95,000 level in the continuation of the retreat may increase selling pressure and create a double bottom formation by allowing it to test the 92,550 level again. Persistence above the 95,000 level, which is the support level, continues to support the minor uptrend and the intermediate resistance level of 97,200 can be targeted again after the 99,100 level. It should be noted that the US markets are closed on Tuesday and Wednesday due to the Christmas holiday, which may reduce volatility in the market.
Supports 95,000 – 92,550 – 91,450
Resistances 97,200 – 98,000 – 99,100
ETH/USDT
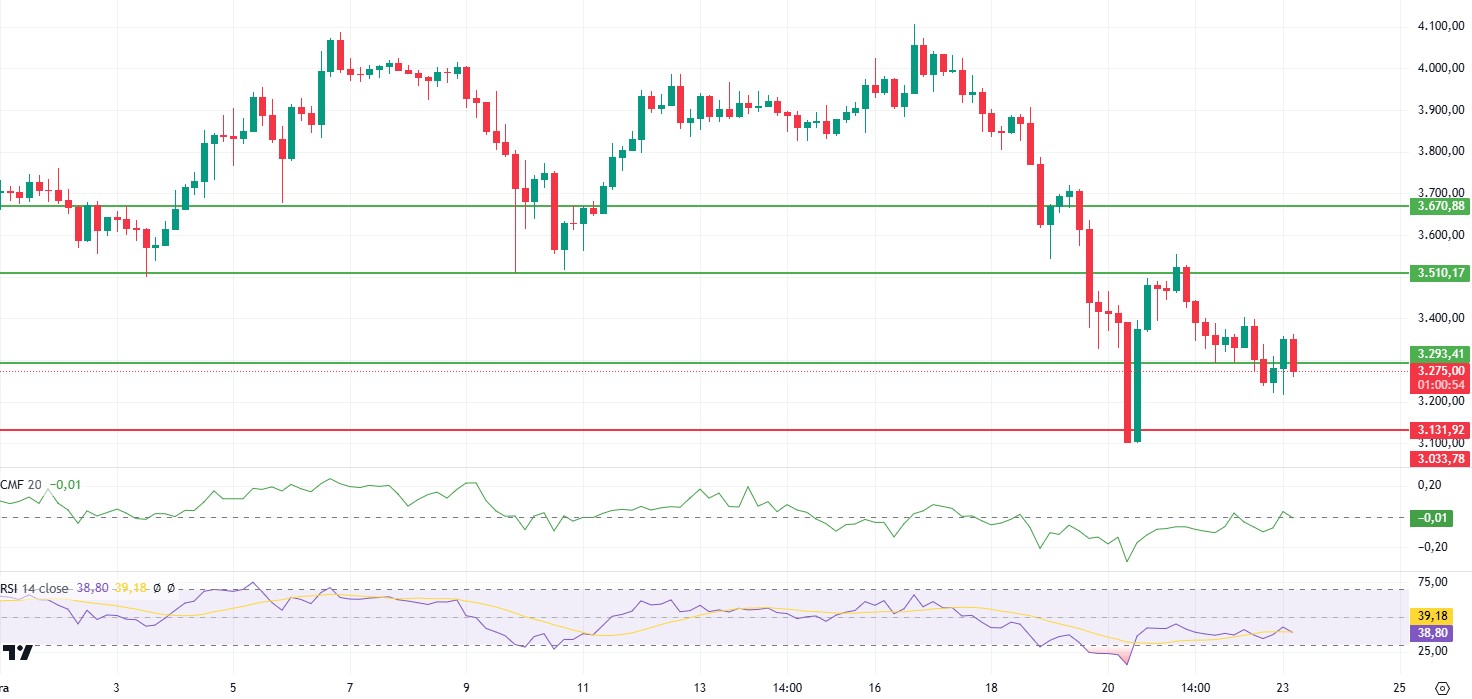
Ethereum managed to rise above the 3,500 level over the weekend after the recent decline, but fell back below the 3,293 level after the weekly close. During this retreat, a significant decrease in the number of open positions (open interest) is also observed. An analysis of Cumulative Volume Delta (CVD) data reveals that selling pressure continued in both spot and future markets. This indicates that market participants continued their short-term selling tendencies.
Technical indicators also confirm the bearish impact. The negative divergence on the Relative Strength Index (RSI) is one of the main factors causing the price to decline. The negative outlook on the RSI following the divergence suggests that market momentum has weakened and selling pressure has increased. The Chaikin Money Flow (CMF) indicator also moved back into negative territory and moved downwards, indicating that capital outflows accelerated and the downward trend strengthened.
It is evaluated that the price may retreat a little more in the short term. However, a rebound above the 3,293 level could slow the downward momentum and allow the price to exhibit a more horizontal movement. On the other hand, it is of great importance for Ethereum to permanently exceed the 3,510 level in order to bring a positive scenario to the agenda. A close above this level could help buyers regain control and accelerate the upward movement.
Supports 3,293 – 3,131- 3,033
Resistances 3,510 – 3,670 – 3,798
XRP/USDT
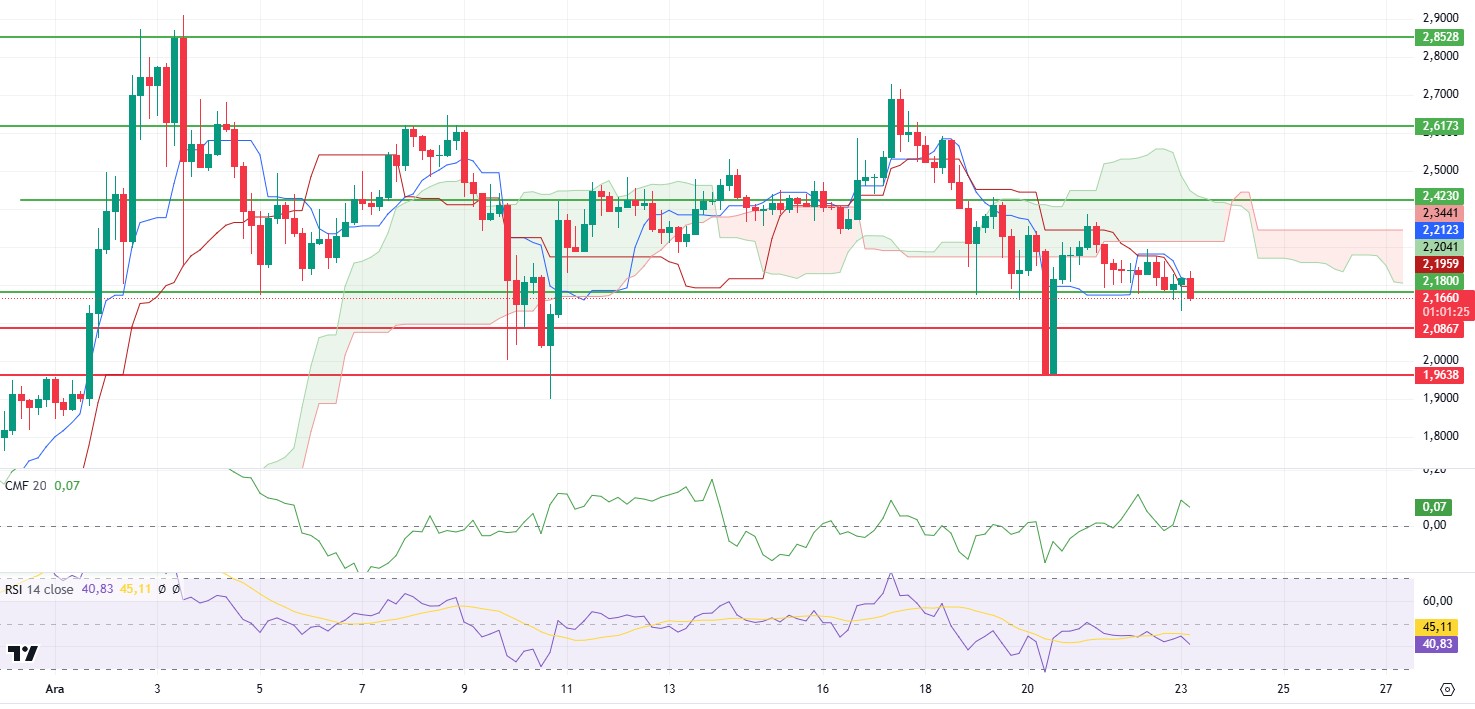
Although XRP managed to rise to 2.38 with a strong reaction from the 1.96 level with the recent decline, it has been affected by the general market pullbacks over the weekend and has fallen to 2.16 levels. During this decline, the Chaikin Money Flow (CMF) indicator turned down again, indicating that the selling pressure on the market has strengthened. At the same time, the negative picture on the Relative Strength Index (RSI) indicates that momentum is weakening and downside risks are increasing in the price action. From a technical point of view, although there has not yet been a sell signal in the Ichimoku indicator, the downtrend of the kumo cloud level is considered as a situation to be considered.
In light of all this data, the failure to regain the 2.18 level may cause the price to retreat further during the day. On the other hand, if the 2.18 level is exceeded with a voluminous breakout, it can be said that XRP has the potential to rise up to 2.31 levels. This area stands out as an important resistance area in the short term and the direction of price action will depend on the closures above these levels.
Supports 2.0867 – 1.9638- 1.6309
Resistances 2.1800 – 2.4230 – 2.6173
SOL/USDT
SOL, the 5th largest crypto by market capitalization, continued to exhibit lackluster performance over the weekend, extending its month-long bearish trajectory within a narrow price channel. Developments in the Solana ecosystem have further boosted the potential recovery, with Sendaifun recently unveiling the Solana Agent Kit. It was introduced as an innovative open source tool designed to integrate artificial intelligence with the Solana blockchain. According to data from crypto analytics platform Token Terminal, SOL has captured 53% of global crypto users, surpassing all other blockchains. Solana’s total locked value (TVL) fell to its lowest point this month, reflecting a decline in activity on the Layer 1 network. Over $1 billion has been withdrawn from Solana’s DeFi ecosystem since the beginning of the month. In the weekly whale inflows, those who took advantage of the crypto market decline raised $1.7 million SOL. In addition, Sol Strategies will acquire 3 more validators in a $6.5 million deal
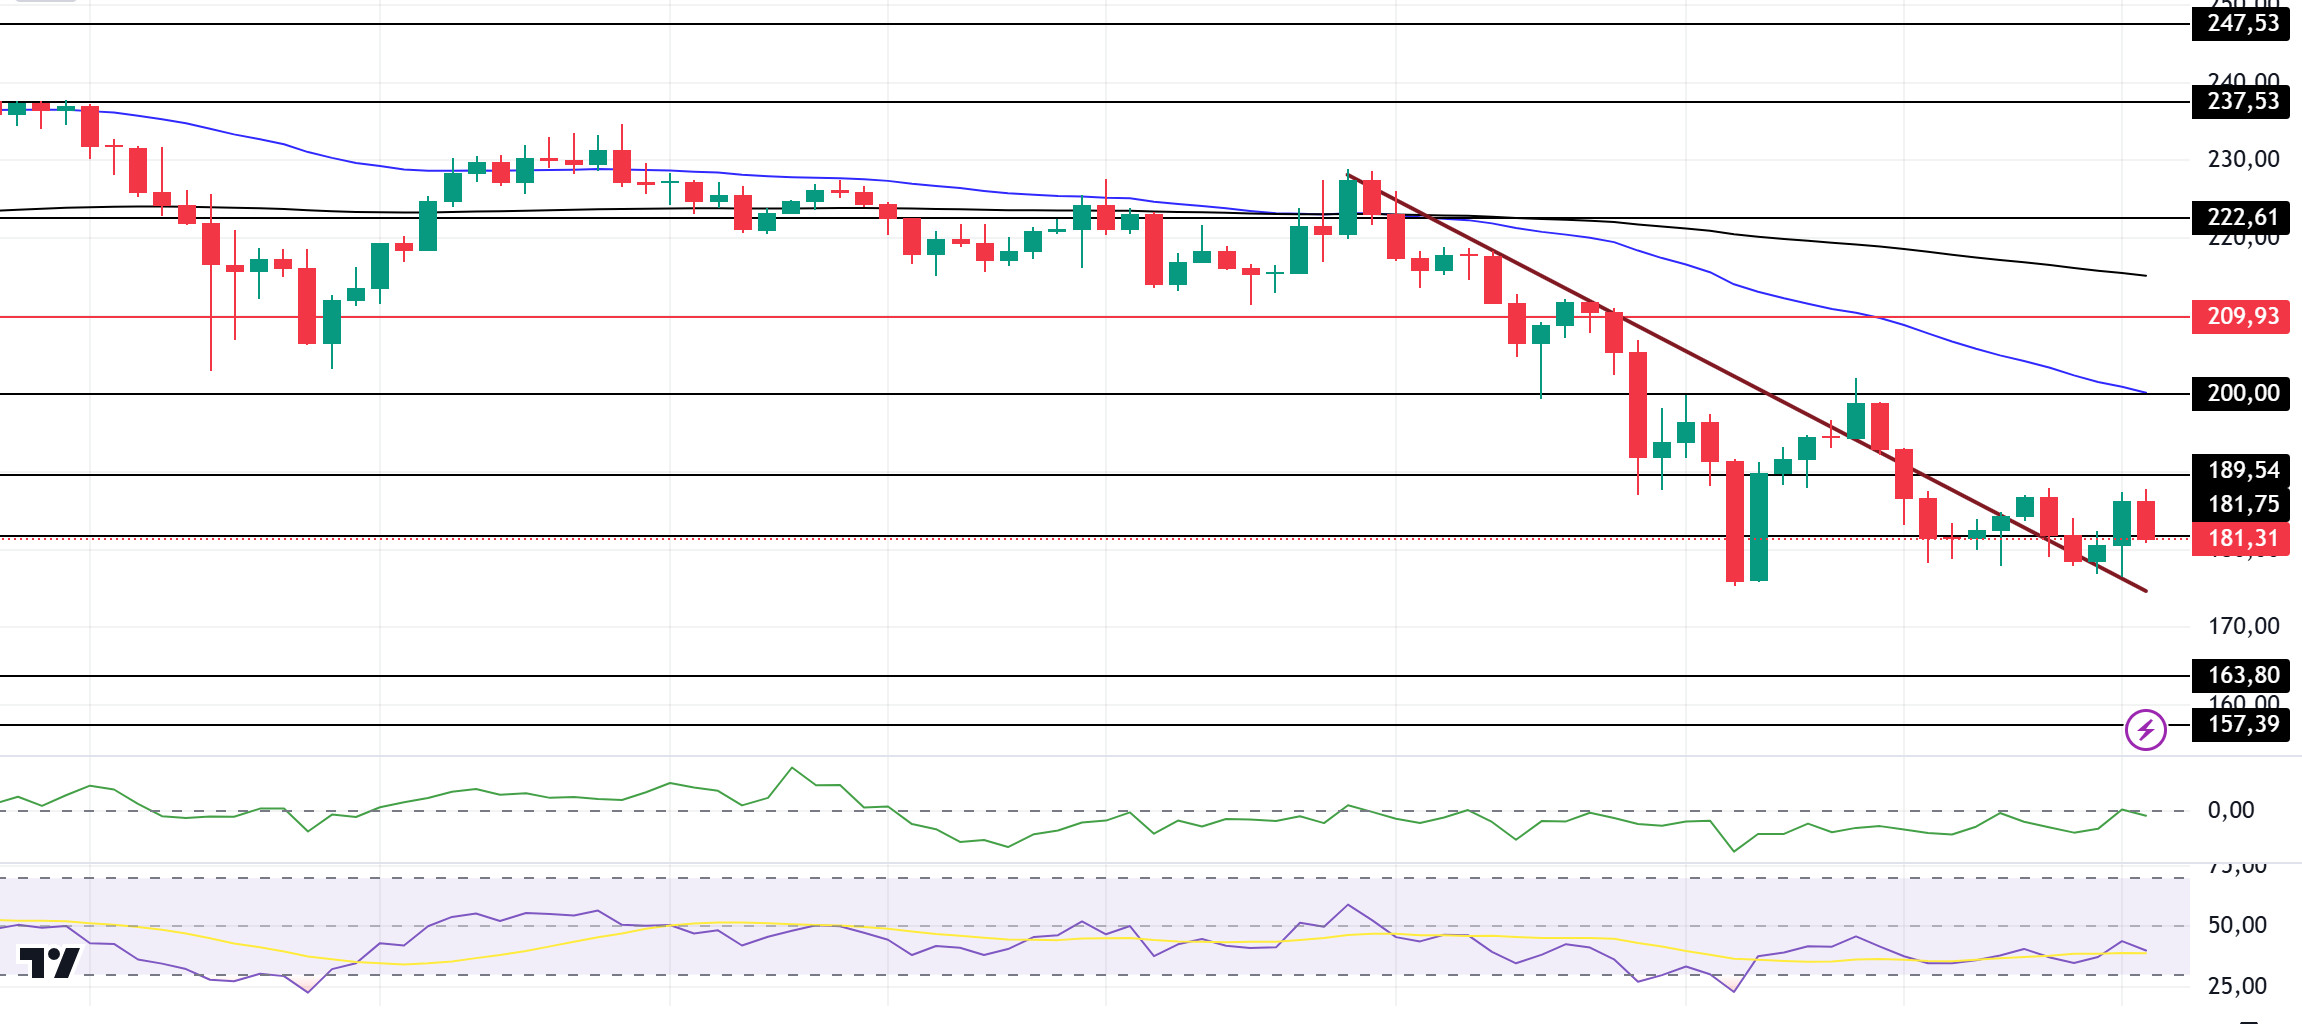
The Solana price chart is pointing to an early rebound and is currently trading at $182.60 after a 0.71% increase today. Solana technical charts point to further recovery with key resistance supporting the bullish move. The asset, which moved with slight pullbacks for a long time, could not withstand the selling pressure. The downward movement of BTC, the cryptocurrency leader, further shook the asset. The price of the asset, which is in a broad downtrend, also broke the support point of the trend. On the 4-hour timeframe, the 50 EMA (Blue Line) is below the 200 EMA (Black Line). When we examine the Chaikin Money Flow (CMF)20 indicator, the increase in money outflows increases selling pressure. However, Relative Strength Index (RSI)14 is between the neutral zone level and the oversold zone. The 200.00 level appears to be a very strong resistance point in the rises driven by both the upcoming macroeconomic data and the news in the Solana ecosystem. If it breaks here, the rise may continue. In case of retracements for the opposite reasons or due to profit sales, the 163.80 support level can be triggered. If the price comes to these support levels, a potential bullish opportunity may arise if momentum increases.
Supports 181.75 – 163.80 – 157.39
Resistances 189.54 – 200.00 – 209.93
DOGE/USDT
DOGE lost about 23% of its value last week. However, with Trump’s appointment of Katie Miller to the Department of State Productivity, it experienced a slight recovery. On the other hand, founder Billy Markus reacted to the sharp declines in the cryptocurrency markets with an ironic and humorous message, saying, “It’s the 3rd day of quitting my job and I’m happy.” Obviously, this ironic approach caused different reactions among investors. While some interpreted Markus’ message as a buying opportunity pointing to market lows, others saw it as just a fun exit. Oncahin data shows that on December 21, 2024, crypto whales accumulated a significant amount of 250 million DOGE in the last few days. In data shared by CoinGlass, we see a significant DOGE outflow worth $519.19 million in the last 7 days.
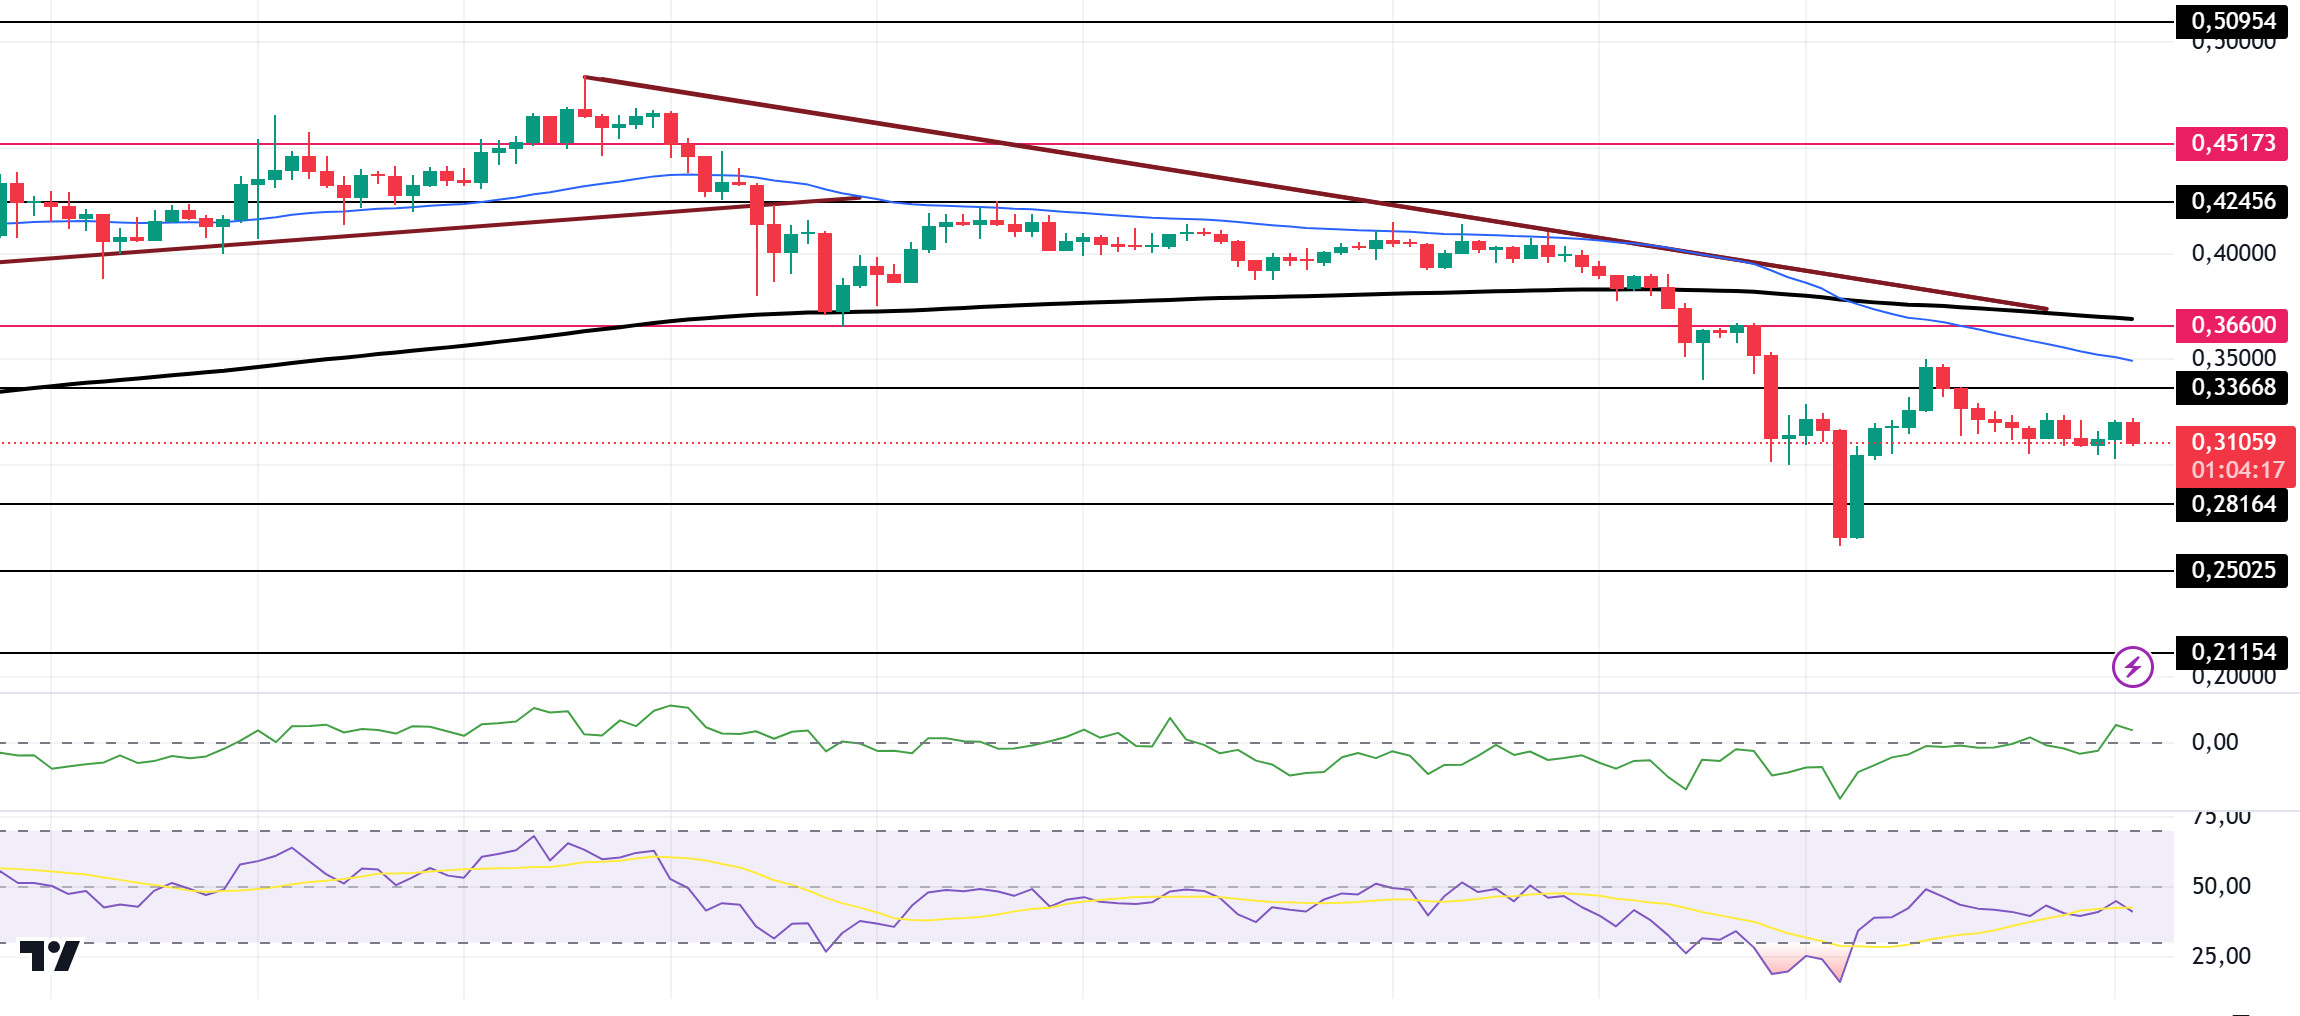
When we look at the chart, DOGE, which has been in a downtrend since December 8, broke the support of this trend and deepened the decline and started to recover by finding support from the 0.2800 and 0.2600 band. In the 4-hour timeframe, the 50 EMA (Blue Line) started to hover below the 200 EMA (Black Line). When we examine the Chaikin Money Flow (CMF)20 indicator, although it is positive, money inflows have decreased slightly. However, Relative Strength Index (RSI)14 is between the neutral zone level and the oversold level. The 0.36600 level appears as a very strong resistance level in the rises due to both the upcoming macroeconomic data and the innovations in the Doge coin. If DOGE catches a new momentum and rises above this level, the rise may continue strongly. In case of possible pullbacks due to macroeconomic reasons or negativity in the ecosystem, the 0.25025 level is an important support. If the price reaches these support levels, a potential bullish opportunity may arise if momentum increases.
Supports 0.28164 – 0.25025 – 0.21154
Resistances 0.33668 – 0.36600 – 0.42456
LEGAL NOTICE
The investment information, comments and recommendations contained herein do not constitute investment advice. Investment advisory services are provided individually by authorized institutions taking into account the risk and return preferences of individuals. The comments and recommendations contained herein are of a general nature. These recommendations may not be suitable for your financial situation and risk and return preferences. Therefore, making an investment decision based solely on the information contained herein may not produce results in line with your expectations.


