
MARKET SUMMARY
Latest Situation in Crypto Assets
| Assets | Last Price | 24h Change | Dominance | Market Cap |
|---|---|---|---|---|
| BTC | 94,047.89 | -0.76% | 56.24% | 1,86 T |
| ETH | 3,398.26 | 3.74% | 12.36% | 409,83 B |
| XRP | 2.241 | 3.63% | 3.87% | 128,48 B |
| SOLANA | 190.54 | 5.07% | 2.76% | 91,53 B |
| DOGE | 0.3203 | 3.17% | 1.43% | 47,28 B |
| CARDANO | 0.9010 | 2.22% | 0.96% | 31,71 B |
| TRX | 0.2515 | 2.51% | 0.65% | 21,71 B |
| AVAX | 38.51 | 7.02% | 0.48% | 15,82 B |
| LINK | 23.89 | 6.70% | 0.46% | 15,29 B |
| SHIB | 0.00002227 | 4.43% | 0.40% | 13,15 B |
| DOT | 7.211 | 5.63% | 0.33% | 11,05 B |
*Prepared on 12.24.2024 at 07:00 (UTC)
WHAT’S LEFT BEHIND
Elon Musk Targets the Fed
Elon Musk stated that the number of employees at the Fed is too high and pointed out that changes could be made to the Fed under Donald Trump’s presidency. Musk is known for his support for Trump during the US election process.
South Korea Delays Crypto Taxation Plan
Interim President Han Duck-soo plans to enact a tax change that includes delaying the taxation plan for crypto assets for two years.
Moon Pay Plans to Acquire Helio
Crypto payment services provider Moon Pay is in talks to acquire Helio, a payment platform for content creators and e-commerce merchants, for $150 million.
Robinhood Doesn’t Plan to Hold Bitcoin
Robinhood CEO Vladimir Tenev announced that the company currently has no plans to hold Bitcoin for investment purposes. Despite the growing interest in cryptocurrencies, no definitive steps have been taken in this regard, he said.
Meme Coin to Make Up 31% of Crypto Narrative
According to a CoinGecko report, the share of meme coins in the crypto narrative has increased nearly 4-fold to 31% in 2024. The theme continues to grow with dog, animal and personality-themed tokens, which only accounted for 8.32% last year.
HIGHLIGHTS OF THE DAY
Important Economic Calender Data
| Time | News | Expectation | Previous |
|---|---|---|---|
| – | Delysium (AGI): Year-End Community Reward Campaign | – | – |
INFORMATION
*The calendar is based on UTC (Coordinated Universal Time) time zone.
The economic calendar content on the relevant page is obtained from reliable news and data providers. The news in the economic calendar content, the date and time of the announcement of the news, possible changes in the previous, expectations and announced figures are made by the data provider institutions. Darkex cannot be held responsible for possible changes that may arise from similar situations.
MARKET COMPASS
In global markets preparing for the Christmas holiday, there is a mixed picture in Asian stock markets this morning after the rise in Wall Street indices yesterday. Buying in the US, especially in technology companies, has been the driving force for upward movements on the Chinese front, with the impact of current stimulus expectations. Other Far East indices have a flat outlook, similar to that of European futures. Markets are beginning to embrace the fact that the US Federal Reserve (FED) continues to stay in an interest rate cut cycle, albeit at a slower pace. In line with this, we can say that the rises in technology companies and treasury yields are remarkable.
It has been a relatively quiet period for major digital assets. While ETH recovered slightly due to the divergence in cash flows in ETFs, BTC did not follow suit. We maintain our view that the pressure on cryptocurrencies may continue in the last days of the year, with intermittent rebounds from time to time.
From the short term to the big picture.
The victory of former President Trump on November 5, which was one of the main pillars of our bullish expectation for the long-term outlook in digital assets, produced a result in line with our predictions. Afterwards, the appointments made by the president-elect and the expectations of increased regulation of the crypto ecosystem in the US continued to be a positive variable in our equation. Although it is expected to continue at a slower pace, the FED’s signal that it will continue its interest rate cut cycle and the volume in crypto asset-based ETFs indicating an increase in institutional investor interest (in addition to MicroStrategy’s BTC purchases, BlackRock’s BTC ETF options start trading…) support our upward forecast for the big picture for now.
In the short term, given the nature of the market and pricing behavior, we think it would not be surprising to see occasional pauses or pullbacks in digital assets. However, at this point, it is worth emphasizing again that the fundamental dynamics continue to be bullish.
TECHNICAL ANALYSIS
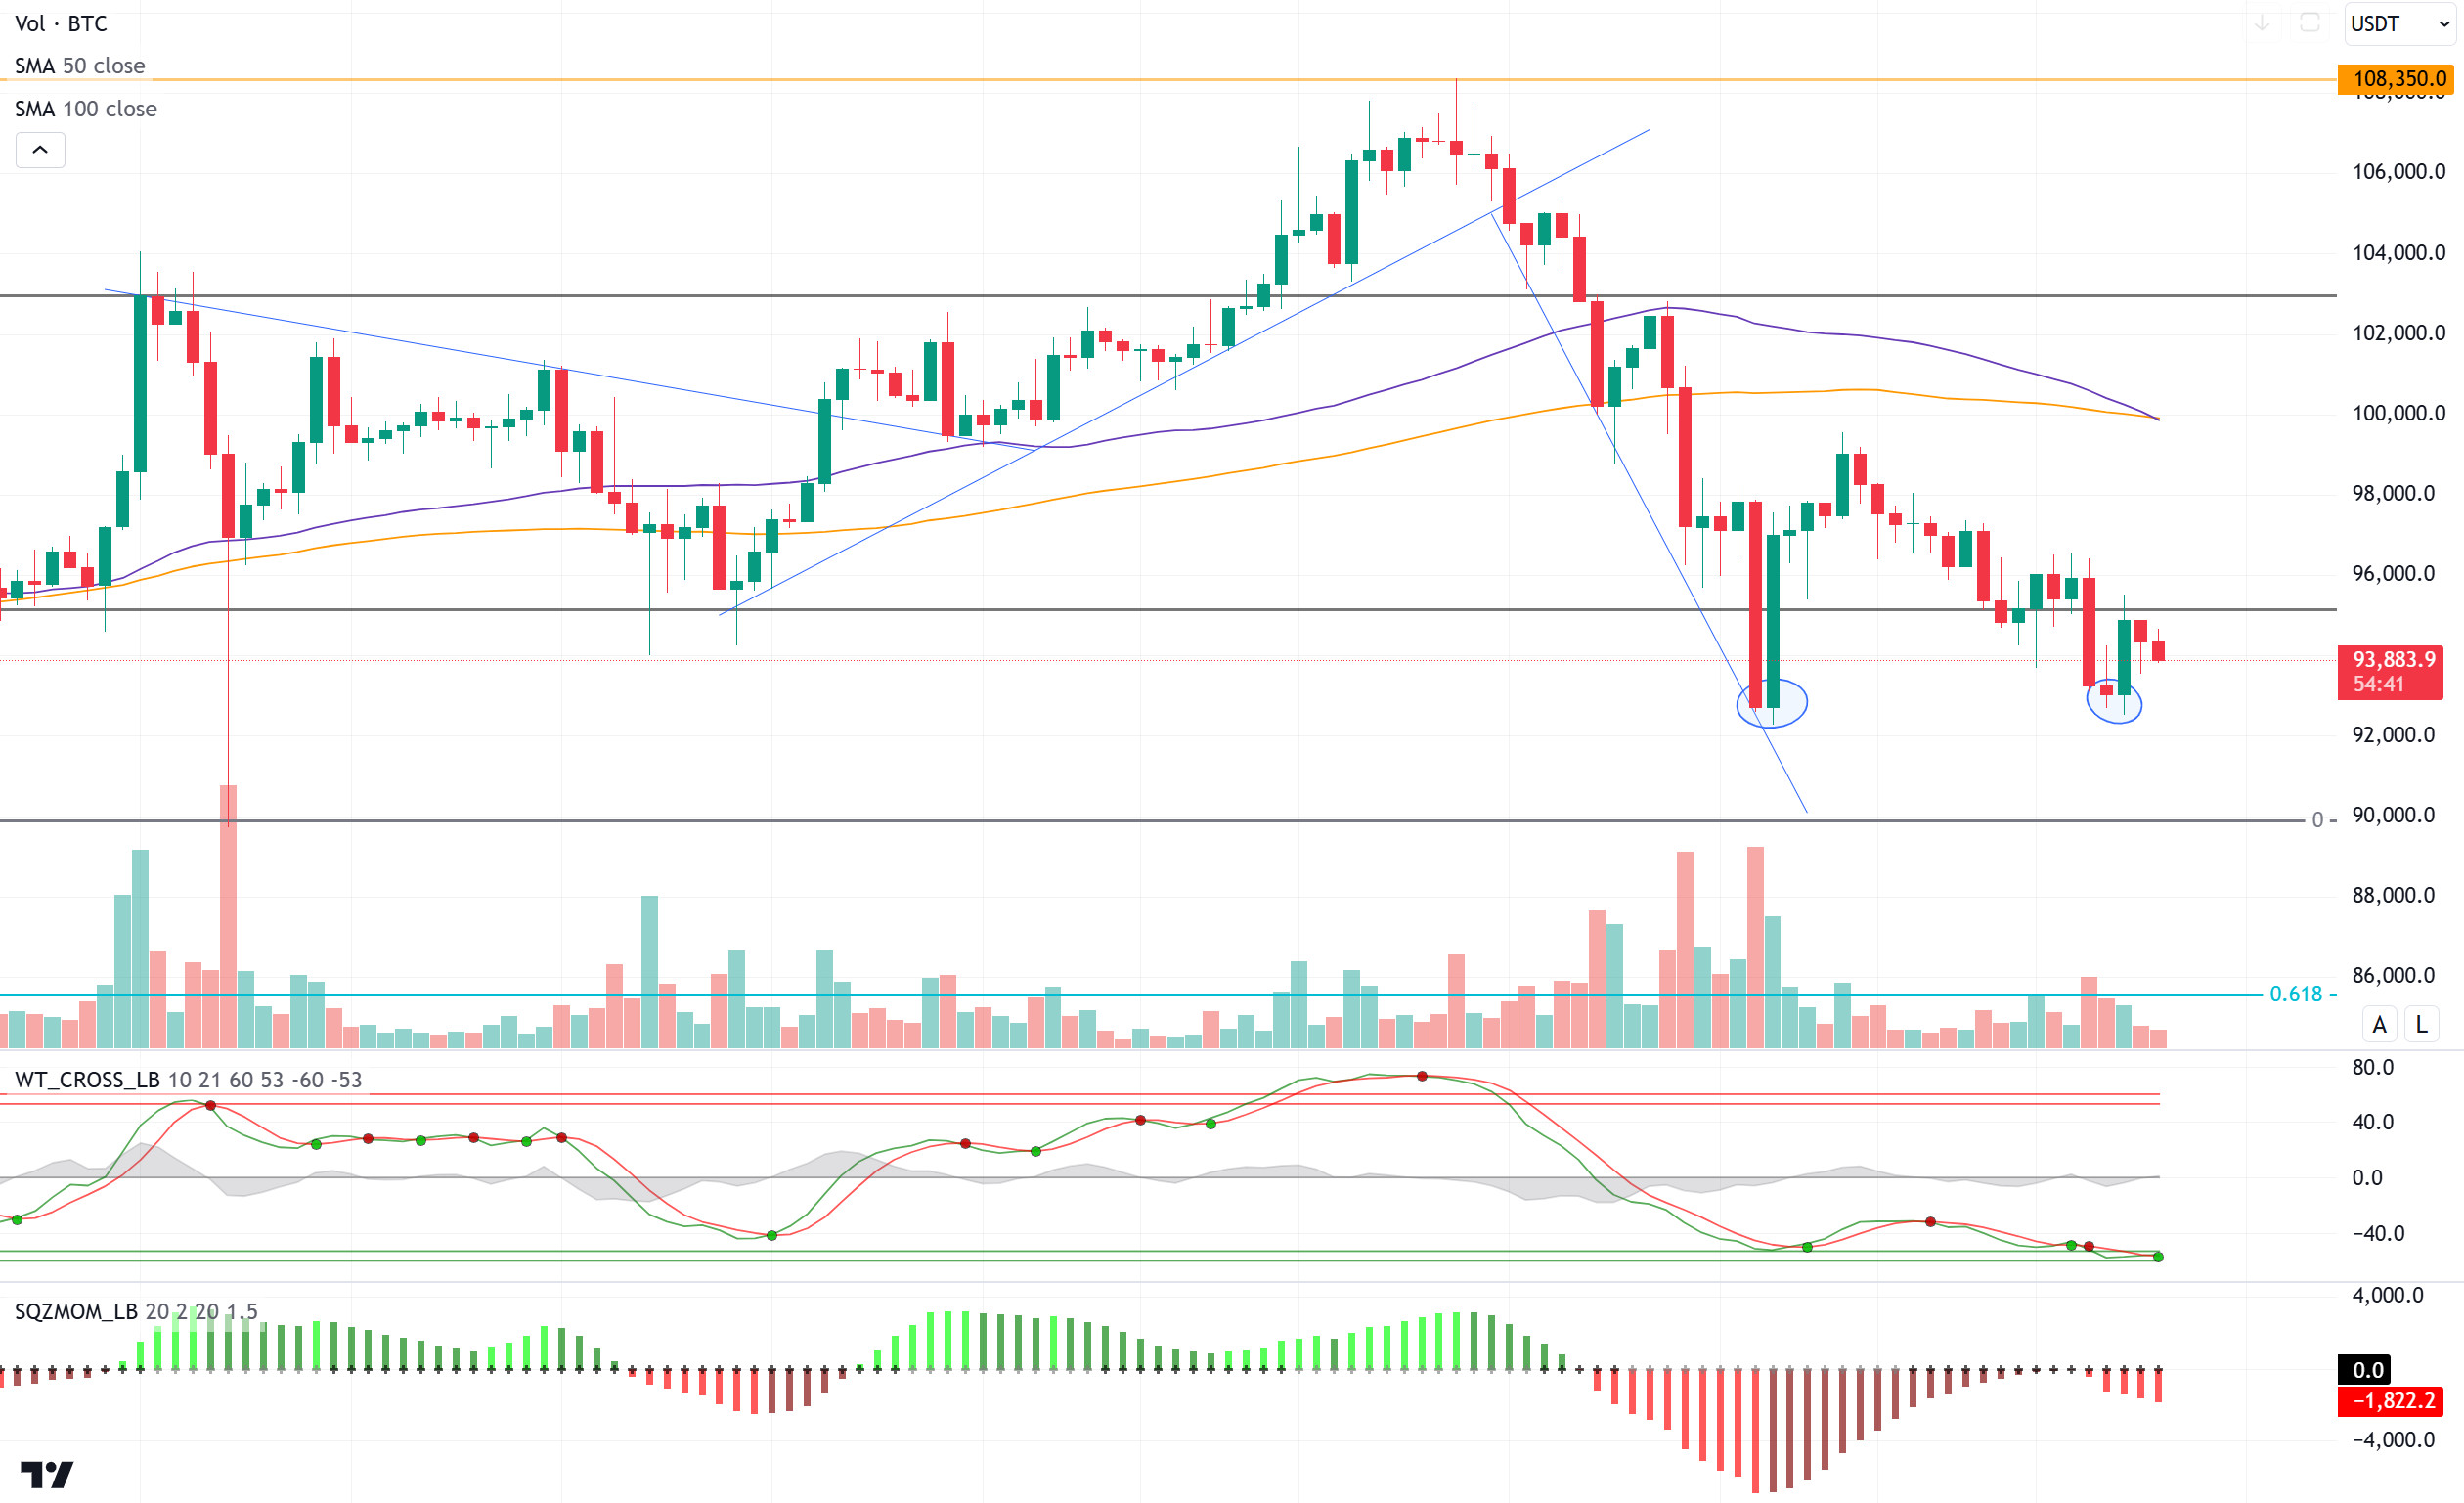
BTC/USDT
US Bitcoin spot ETFs experienced a total net outflow of $ 227 million, while the ETF net asset ratio was 5.7 percent. Grayscale ETF GBTC had an outflow of $ 38.3853 million, while BlackRock ETF IBIT recorded the largest inflow with a net inflow of $ 31.6575 million. The total net asset value of Bitcoin spot ETFs was $105.084 billion, while the historical cumulative net inflow reached $35.825 billion.
When we look at the technical outlook with the spot ETF data, we see that as of yesterday, the price could not hold above the 95,000 support level and retreated to 92,550. In previous analyzes, we stated that with the break of the 95,000 level, the price may form a double bottom formation. After the double bottom pattern, which is a trend reversal pattern, the continuation of the major trend can be expected with the price rebound. As a matter of fact, with the recovery of the price from the second bottom, we see that the 95,000 level, which previously worked as support, was retested as resistance. In BTC, which is currently trading at 94,000, technical oscillators are generating a buy-sell signal in the oversold zone, while the momentum indicator has turned negative again with the downward breakout of the price. In the continuation of the rise, the persistence above the 95,000 level will be followed, and in a possible pullback, we can say that the 92,550 level is the support point.
Supports 92,550 – 91,450 – 90,000
Resistances 95,00 – 97,200 – 98,000
ETH/USDT
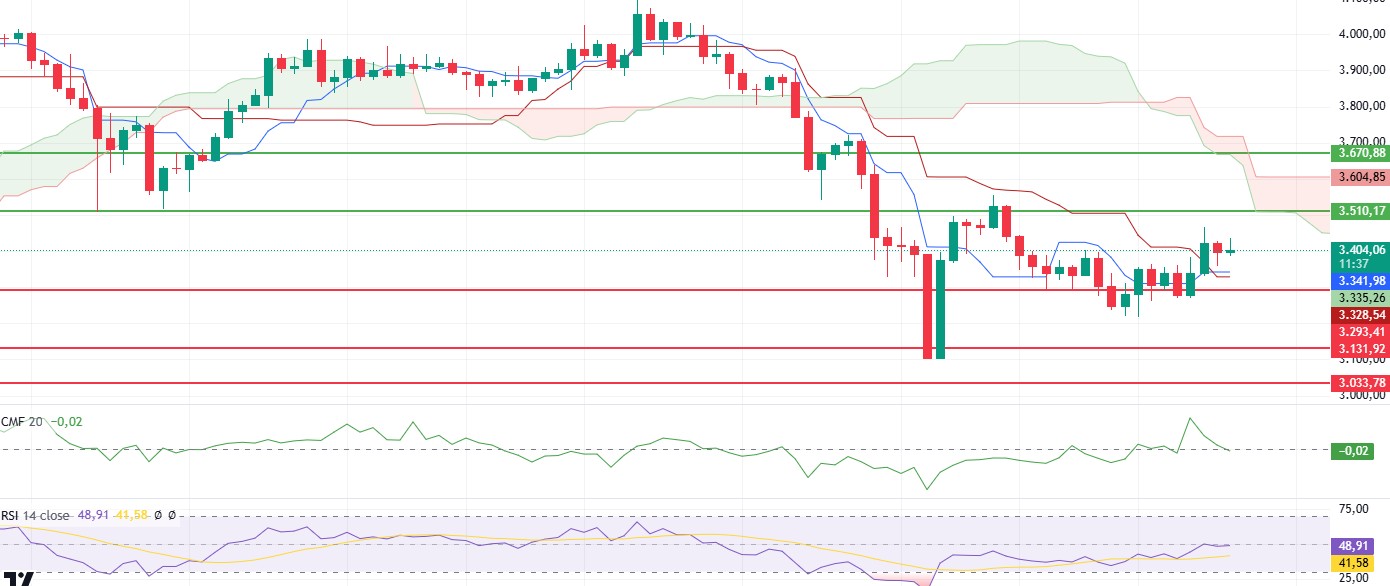
Ethereum (ETH) has successfully broken above the $3,400 level, surpassing the Kijun and Tenkan levels outlined in previous analyses. This movement may signal strengthening upward momentum. However, the continuation of the negative outlook on the Relative Strength Index (RSI) suggests that the market is still struggling to sustain upward movements. Meanwhile, the Chaikin Money Flow (CMF) remains flat at the zero level, indicating no clear trend in capital inflows or outflows among market participants.
According to the current technical data, maintaining a position above $3,400 could trigger a rally toward the $3,500 region. However, the bearish signals from RSI, selling pressure from cumulative volume delta (CVD) in spot markets, and an increase in funding rates suggest that losing this level may deepen the bearish trend. In such a scenario, Ethereum’s price may test lower support levels.
Ethereum is trading within a critical zone. Sustained movement above the $3,400 level is crucial for further upward momentum.
Supports: 3,293 – 3,131– 3,033
Resistances: 3,510 – 3,670 – 3,798
XRP/USDT
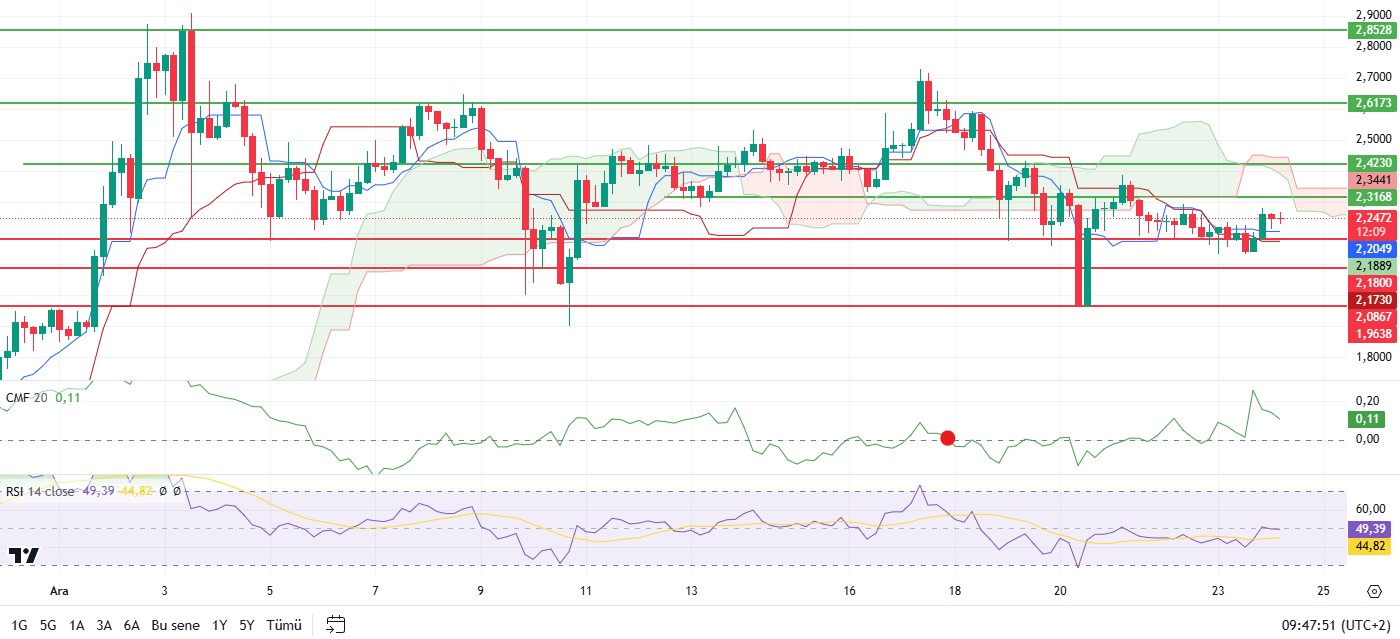
XRP has risen to the 2.24 level, breaking out of its recent narrow trading range. The current price action indicates sustained stability above the critical 2.18 support level and suggests strengthening upward momentum.
Technical indicators support a positive trend. The Tenkan level remaining above the Kijun level indicates that the market is under short-term buying pressure. This increases the likelihood of the price testing higher levels. The 2.31 level holds significant importance as both a psychological and technical resistance. Breaking through this level could accelerate XRP’s upward movement, potentially initiating a short-term bullish trend.
However, a pullback below the 2.18 support level could increase selling pressure, potentially driving the price down to the 2.10 level. Therefore, it is crucial for investors to closely monitor the 2.18 support level and the 2.31 resistance level.
With XRP trading at the 2.24 level, the conditions are favorable for further upward movement. While 2.18 remains a strong support level, 2.31 is a critical resistance point.
Supports 2.1800 – 2.0867– 1.9638
Resistances 2.3168 – 2.4230 – 2.6173
SOL/USDT
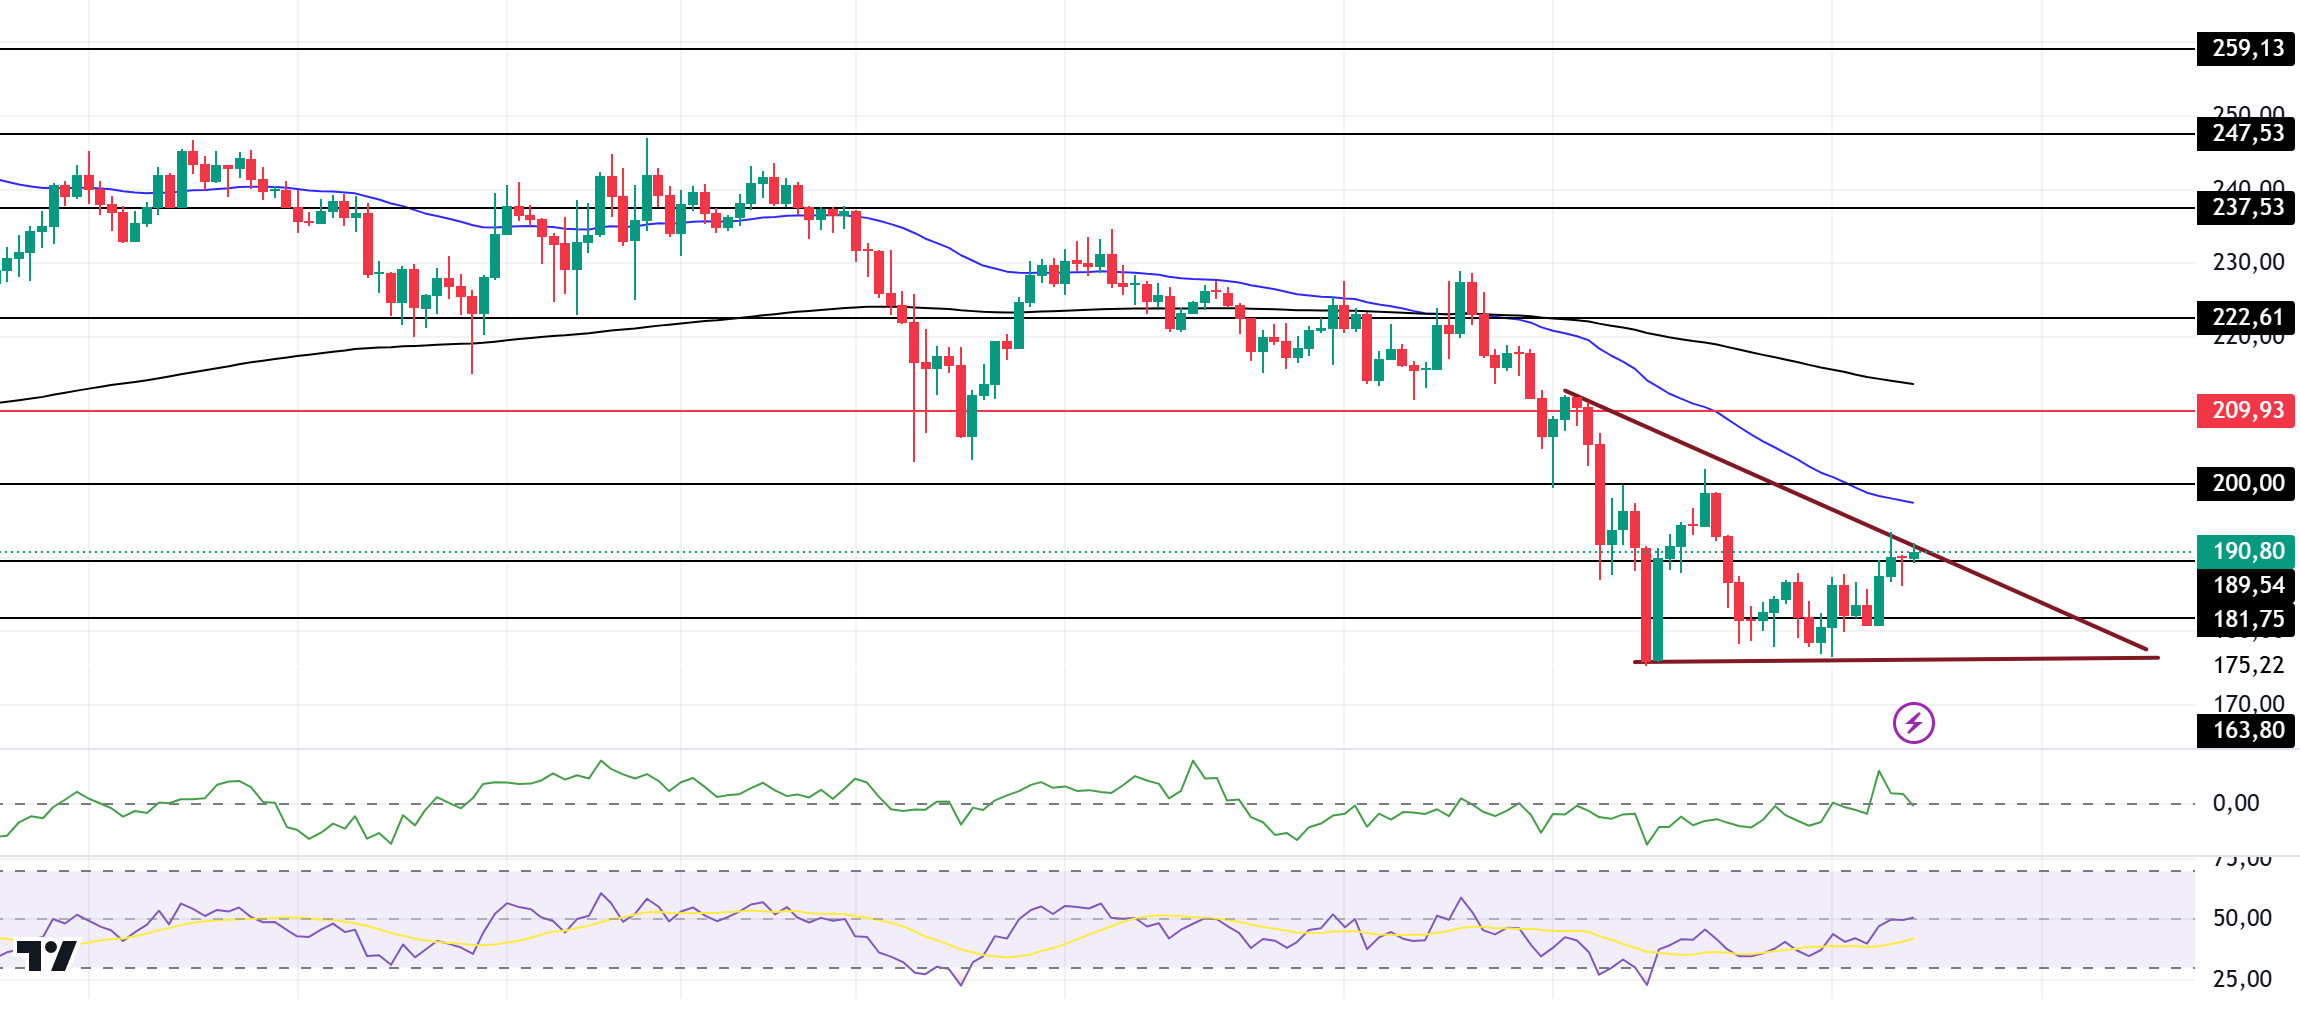
Bloomberg analysts recently suggested that a Solana ETF could be launched at some point next year, although the exact timing remains unclear due to some complex legal issues. On the other hand, long-term holders have shown strong interest in SOL, according to Coinglass, an on-chain analytics firm. SOL spot inflows and outflows revealed that exchanges witnessed a significant SOL outflow worth $105.5 million in the last three days. This significant outflow points to potential upside momentum
On the 4-hour timeframe, the 50 EMA (Blue Line) is below the 200 EMA (Black Line). Although there is a rise, there is currently no volume to break the 200.00 level, which is a strong resistance. When we analyze the Chaikin Money Flow (CMF)20 indicator, money inflows are decreasing and accelerating towards the neutral level. This seems to create selling pressure. On the other hand, the descending triangle pattern should be taken into consideration. However, Relative Strength Index (RSI)14 continued to be in the neutral zone. The 200.00 level appears to be a very strong resistance point in the rises driven by both the upcoming macroeconomic data and the news in the Solana ecosystem. If it breaks here, the rise may continue. In case of retracements for the opposite reasons or due to profit sales, the 163.80 support level can be triggered. If the price comes to these support levels, a potential bullish opportunity may arise if momentum increases.
Supports 189.54 – 181.75 – 163.80
Resistances 200.00 – 209.93 – 222.61
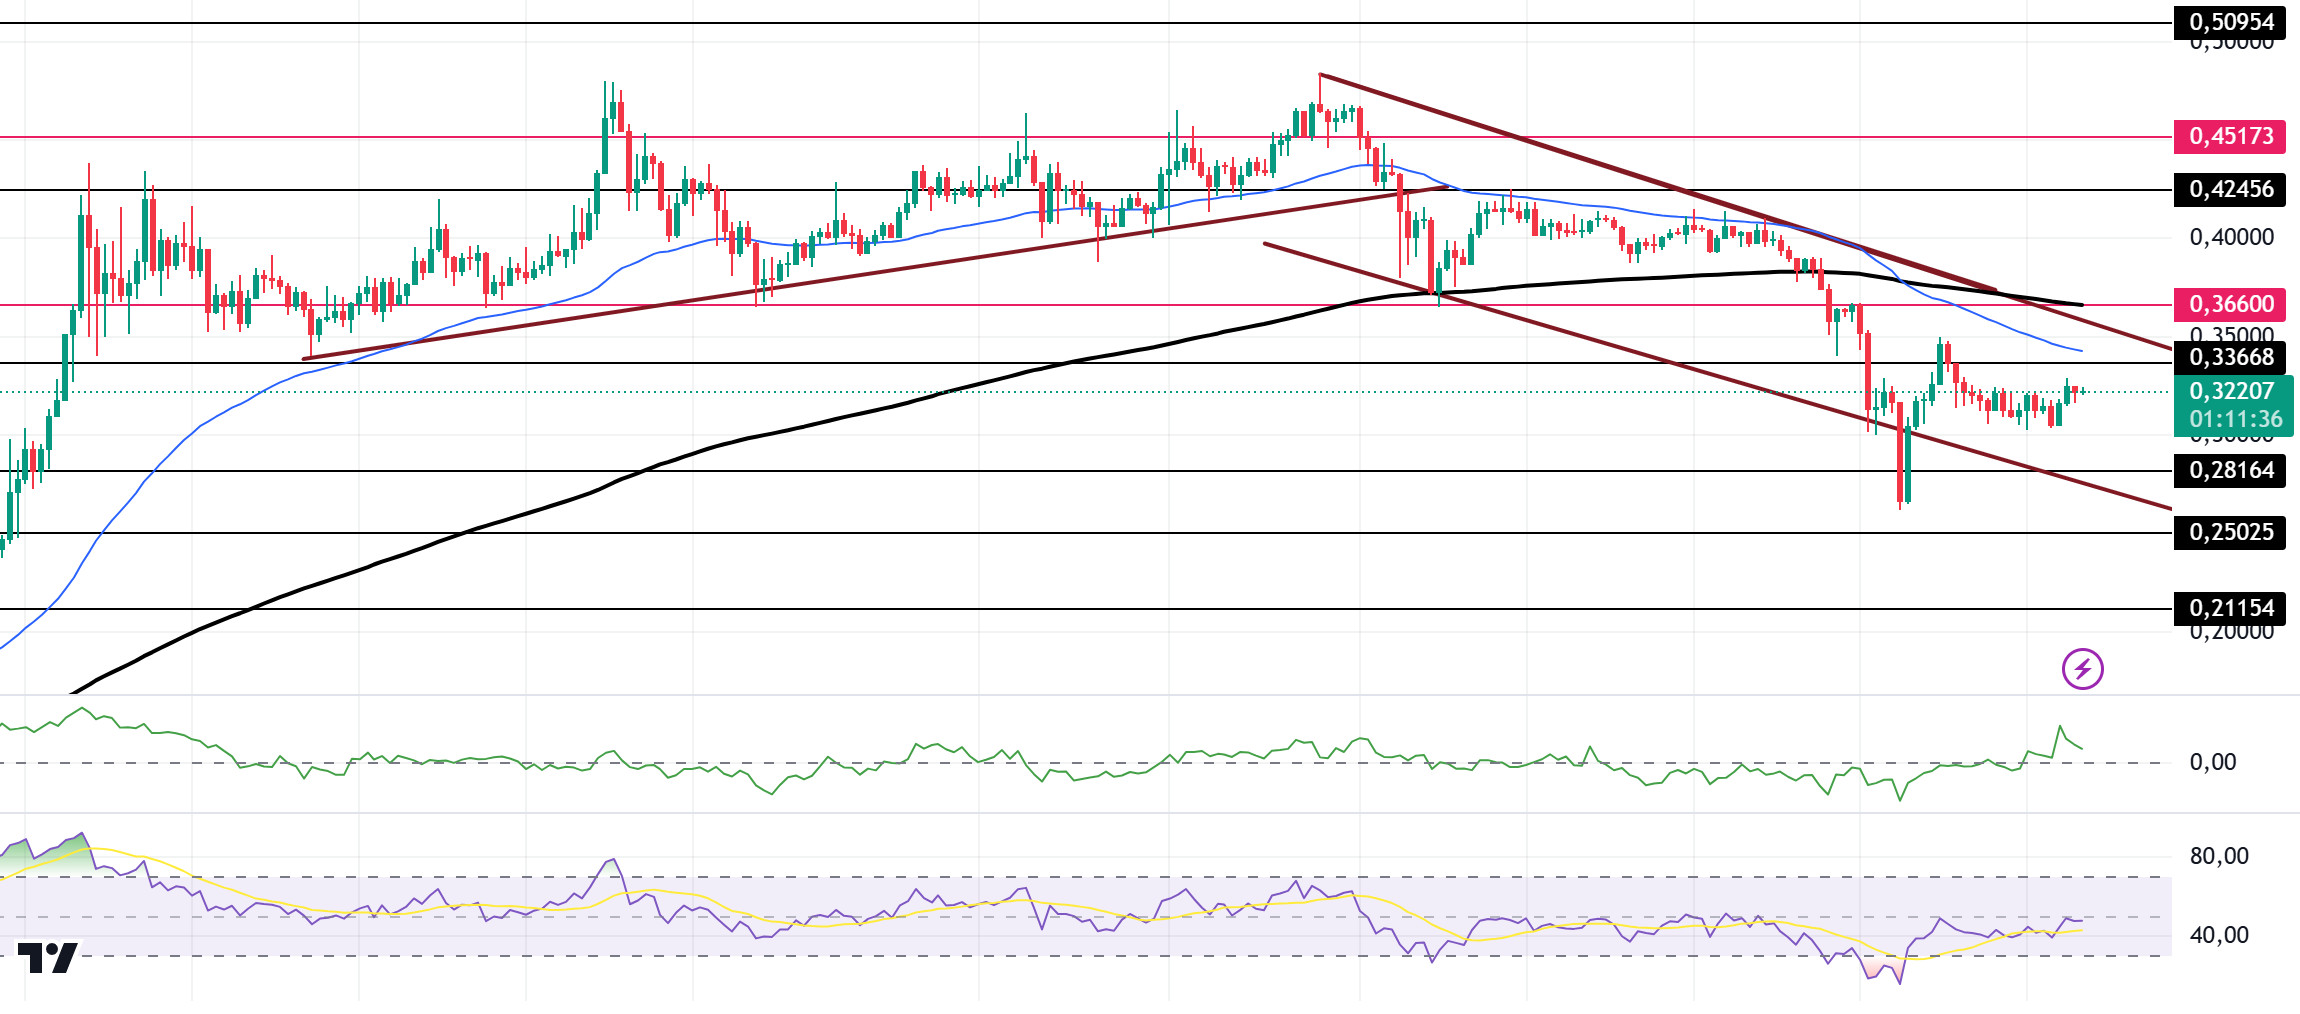
DOGE/USDT
Speculation about the Dogecoin spot ETF filing was fueled by comments from Bloomberg senior ETF analyst Eric Balchunas. Balchunas suggested that the chances of a Dogecoin ETF filing could increase under the administration of President-elect Donald Trump. Data from IntoTheBlock shows an increase in network activity. As of November 11, the number of active addresses reached 136,850, while 58,990 new addresses were created. According to Coinglass’ market data, trading volume fell 44% to $7.42 billion since December 21, while open interest in futures contracts fell 36% to $1.95 billion.
Doge continues its horizontal course in recent days. When we look at the chart, DOGE, which has been in a downtrend since December 8, broke the support of this trend and deepened the decline and found support from the 0.2800 and 0.2600 band and found itself in the middle of the trend again. In the 4-hour timeframe, the 50 EMA (Blue Line) started to hover below the 200 EMA (Black Line). When we examine the Chaikin Money Flow (CMF)20 indicator, although it is positive, money outflows are decreasing. However, Relative Strength Index (RSI)14 is between the neutral zone level and the oversold level. The 0.36600 level appears as a very strong resistance level in the rises due to both the upcoming macroeconomic data and the innovations in the Doge coin. If DOGE catches a new momentum and rises above this level, the rise may continue strongly. In case of possible pullbacks due to macroeconomic reasons or negativity in the ecosystem, the 0.25025 level is an important support. If the price reaches these support levels, a potential bullish opportunity may arise if momentum increases.
Supports 0.28164 – 0.25025 – 0.21154
Resistances 0.33668 – 0.36600 – 0.42456
LEGAL NOTICE
The investment information, comments and recommendations contained herein do not constitute investment advice. Investment advisory services are provided individually by authorized institutions taking into account the risk and return preferences of individuals. The comments and recommendations contained herein are of a general nature. These recommendations may not be suitable for your financial situation and risk and return preferences. Therefore, making an investment decision based solely on the information contained herein may not produce results in line with your expectations.
