MARKET SUMMARY
Latest Situation in Crypto Assets
| Assets | Last Price | 24h Change | Dominance | Market Cap |
|---|---|---|---|---|
| BTC | 98,036.38 | 0.19% | 57.14% | 1,94 T |
| ETH | 3,438.10 | -1.31% | 12.20% | 414,36 B |
| XRP | 2.248 | -1.94% | 3.79% | 128,67 B |
| SOLANA | 193.96 | -2.39% | 2.74% | 93,12 B |
| DOGE | 0.3250 | -2.13% | 1.41% | 47,94 B |
| CARDANO | 0.8903 | -3.44% | 0.92% | 31,32 B |
| TRX | 0.2544 | -0.92% | 0.65% | 21,94 B |
| AVAX | 38.85 | -5.36% | 0.47% | 15,96 B |
| LINK | 23.52 | -5.23% | 0.44% | 15,03 B |
| SHIB | 0.00002223 | -3.72% | 0.39% | 13,10 B |
| DOT | 7.203 | -2.89% | 0.32% | 11,04 B |
*Prepared on 12.26.2024 at 07:00 (UTC)
WHAT’S LEFT BEHIND
SEC Changes Its Attitude Towards the Crypto Industry
The US Securities and Exchange Commission (SEC) will make significant changes in 2025 under presidential candidate Donald Trump. With the departure of SEC Chairman Gary Gensler and the leadership of Republican members Hester Peirce and Mark Uyeda, a reduction in enforcement actions against the crypto industry is expected. This change has raised expectations that the commission will take a friendlier approach to the crypto market.
Huge Increase in OTC Crypto Trading Volume
Cryptocurrency over-the-counter (OTC) trading volumes have increased significantly in recent months. Tim Ogilvie, Kraken’s head of institutional business, stated that OTC trading has increased by 220% year-over-year and that this increase was triggered by the election results. This shows that institutional investors’ interest in the crypto market continues to grow.
Floki ETP Comes to SIX Swiss Exchange
Floki plans to launch an ETP based on the FLOKI token on the SIX Swiss Exchange in the first quarter of 2025. The DAO community is voting to allocate $2.8 million worth of FLOKI tokens to provide early liquidity to the ETP. If approved, FLOKI will be the second meme token to launch an institutional product in Europe.
Big Ethereum Transfer
According to Whale Alert, the BTCTurk exchange transferred 20,000 Ethereum worth approximately $69.87 million to an unknown wallet. This transaction took place during a period marked by high-volume transfers.
HIGHLIGHTS OF THE DAY
Important Economic Calender Data
| Time | News | Expectation | Previous |
|---|---|---|---|
| Delysium (AGI): Year-End Community Reward Campaign | |||
| 13:30 | US Unemployment | 223K | 220K |
INFORMATION
*The calendar is based on UTC (Coordinated Universal Time) time zone.
The economic calendar content on the relevant page is obtained from reliable news and data providers. The news in the economic calendar content, the date and time of the announcement of the news, possible changes in the previous, expectations and announced figures are made by the data provider institutions. Darkex cannot be held responsible for possible changes that may arise from similar situations.
MARKET COMPASS
As we start the new day with many major stock markets remaining closed due to holidays, we can state that there is a positive mood in global markets. In the open Asia-Pacific stock markets, the rises in Japan are noteworthy. It is rumored that the government will approve a major economic stimulus package for next year. There is also a softening of relations with China. In Europe, markets in major economies such as the UK, Germany, France, Italy and Spain are closed today. Wall Street futures are flat.
Major digital assets are seeing some pullback and a relatively sideways movement after the rally ahead of the Christmas holidays. Traditional markets are expecting a “Santa Claus” rally, but as we mentioned in our previous analysis, we think that horizontal price changes in cryptocurrencies may continue in the short term. In the long term, as mentioned below, we maintain our bullish outlook.
From the short term to the big picture.
The victory of former President Trump on November 5, which was one of the main pillars of our bullish expectation for the long-term outlook in digital assets, produced a result in line with our predictions. Afterwards, the appointments made by the president-elect and the expectations of increased regulation of the crypto ecosystem in the US continued to be a positive variable in our equation. Although it is expected to continue at a slower pace, the FED’s signal that it will continue its interest rate cut cycle and the volume in crypto asset ETFs indicating an increase in institutional investor interest (in addition to MicroStrategy’s BTC purchases, BlackRock’s BTC ETF options start trading…) support our upward forecast for the big picture for now.
In the short term, given the nature of the market and pricing behavior, we think it would not be surprising to see occasional pauses or pullbacks in digital assets. However, at this point, it is worth emphasizing again that the fundamental dynamics continue to be bullish.
TECHNICAL ANALYSIS
BTC/USDT
Bitcoin accumulation addresses showed strong demand growth, with nearly 225K BTC added to their wallets despite selling pressure in December. According to CryptoQuant data, total selling liquidity on exchanges and ETFs decreased by 590K BTC. The supply of BTC on the OTC market fell from 421K to 403K, and this reduced supply appeared to meet investor demand. Wallets holding Bitcoin short-term accumulated 641K BTC over the past year, bringing their holdings to 3.81 million BTC.
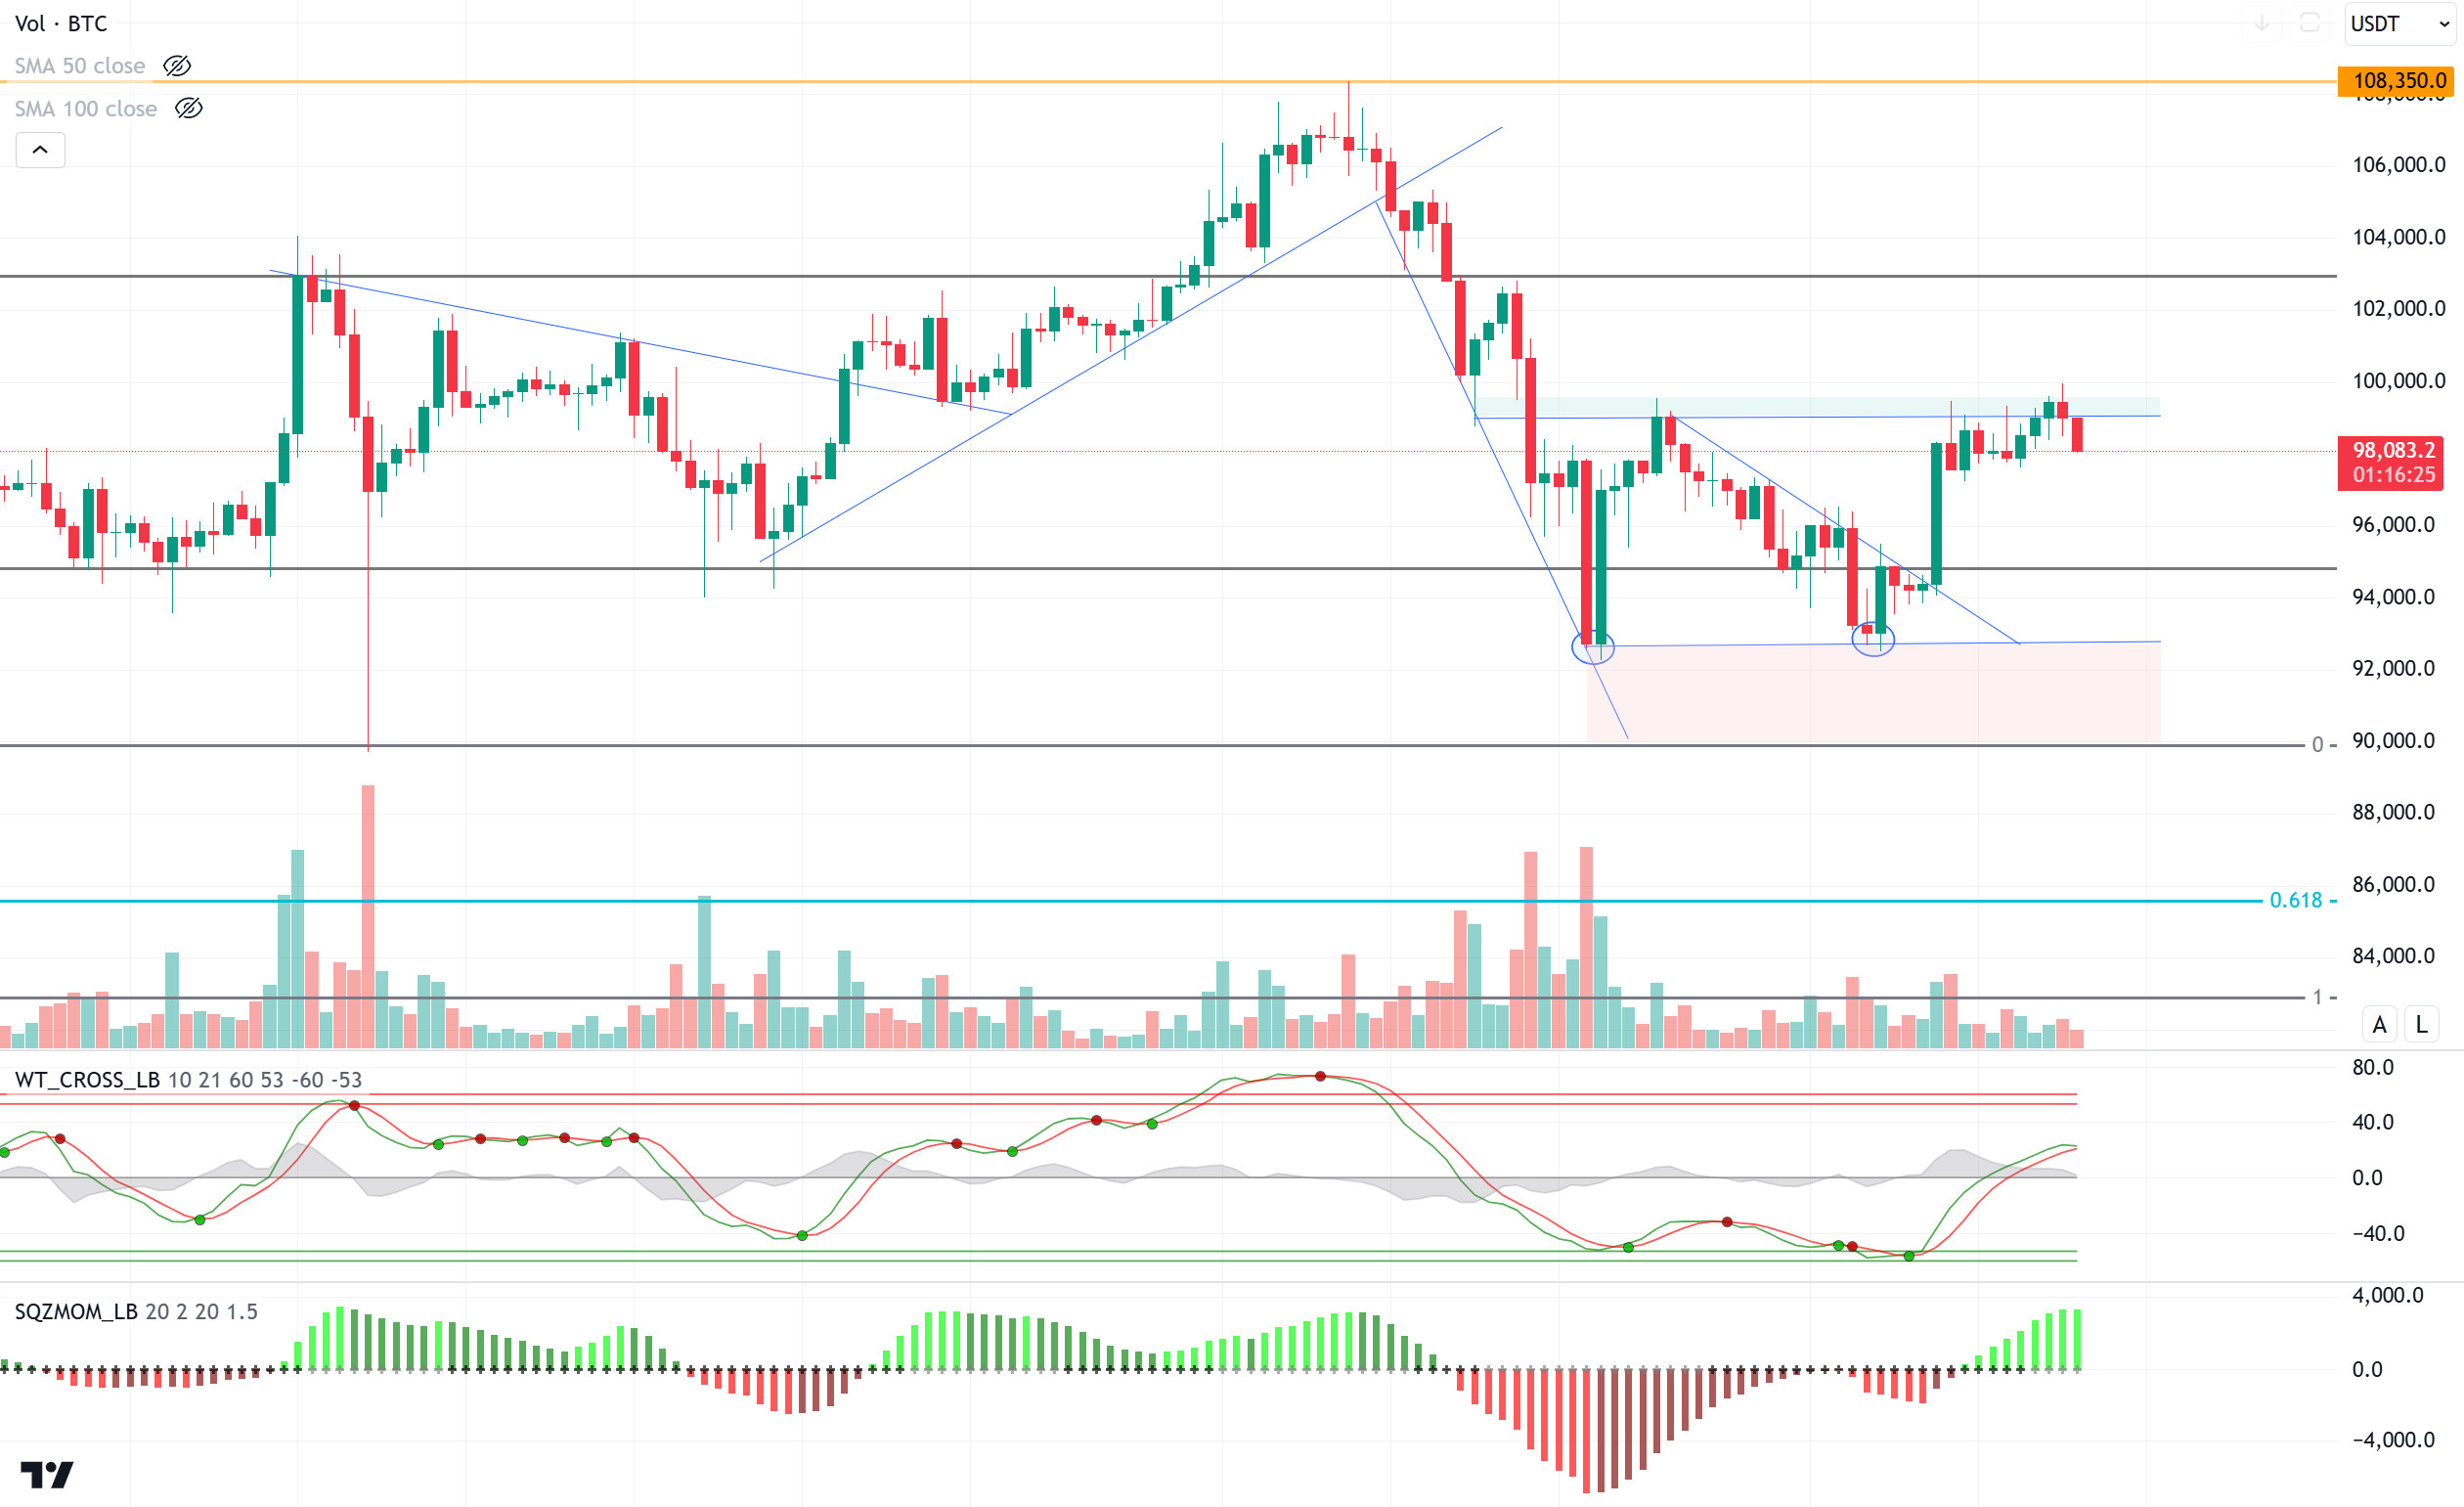
When we look at the technical outlook with Onchain reports, BTC, which fell from the ATH level of 108,000 to 92,500 with selling pressure, is trying to erase its losses. The price, which corrected the decline and then fell again, tested the 99,800 level yesterday, with a double bottom above the 95,000 level. In BTC, which is currently trading at 98,000, technical oscillators have not yet reached the overbought zone but are in a weakening picture, while the momentum indicator shows a weakening in the upward momentum. With the increased risk appetite in the markets after the Christmas holiday, hourly closes above the 99,100 resistance level could bring the price back to six-digit levels. In a possible new selling pressure, we will follow the 95,000 support point with the rectangle formation.
Supports 97,200 – 95,000 – 92,550
Resistances 99,100 – 102,500- 104,450
ETH/USDT
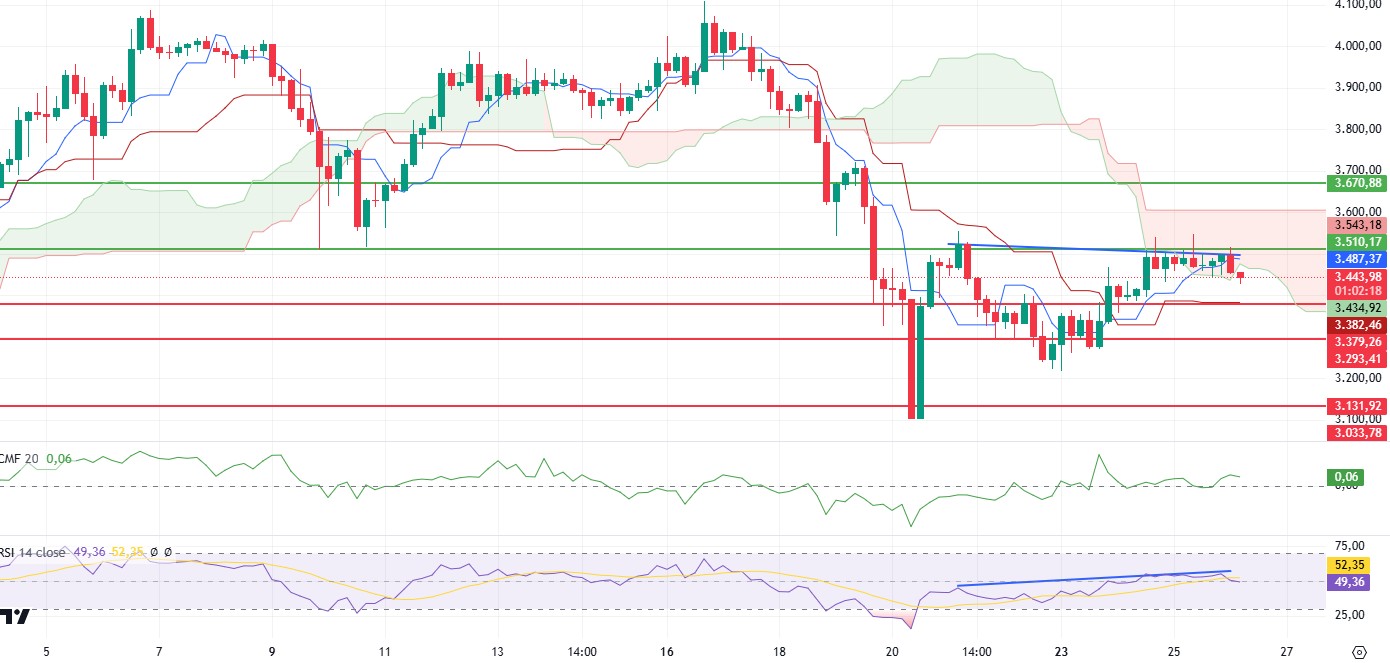
Ethereum tested the 3,510 level three times yesterday but faced intense selling pressure on each attempt. This caused the price to fall as low as 3,430 after the last test. While the price action brought the Ichimoku indicator to dip below the kumo cloud, the current “buy” signal is not completely outdated. However, market dynamics remain indecisive in the short term.
On the Ichimoku indicator, the loss of the tenkan sen level makes the kijun sen level a stronger support point. This is a critical point that should be carefully monitored in the downside movements of the price. However, if the price re-enters the kumo cloud, it will be a factor that increases the bullish potential. A negative divergence is noticeable in the RSI (Relative Strength Index) indicator. This divergence indicates that the indicator is moving downwards in parallel with the price decline and that the current selling pressure continues. This trend in the RSI suggests that the strength of buyers is waning and the market is in a short-term correction. Chaikin Money Flow (CMF) and momentum indicators paint a more neutral picture. Both indicators are flat, suggesting that the market is in the decision phase and no clear trend is emerging. This suggests that both buyers and sellers are cautious at current levels.
In the short term, the kijun sen at 3,382 stands out as an important support point to follow on declines. A move below this level could increase the downside momentum and set the stage for a deeper retracement. In upward movements, first of all, the price needs to re-enter the kumo cloud. In particular, a breakout above the 3,510 level will support the upward movement and enable the market to transition to a buyer structure again. Although the current technical indicators for Ethereum indicate that selling pressure may continue in the short term, the support at 3,382 creates a critical barrier for the price to recover. In upward movements, a close above 3,510 may signal a stronger uptrend.
Supports 3,379 – 3,293- 3,131
Resistances 3,510 – 3,670 – 3,798
XRP/USDT
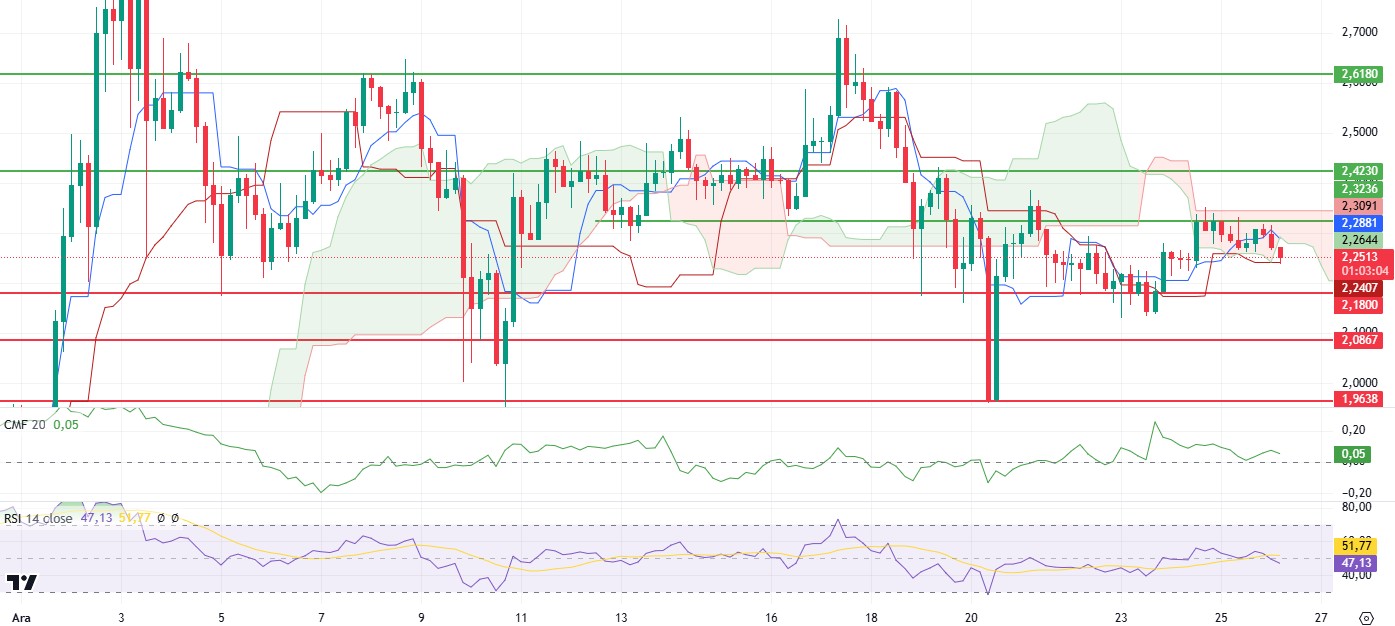
A similar technical outlook is evident in XRP. After testing the resistance at 2.32, the price was rejected and fell back outside the kumo cloud and is currently finding support at the kijun level. This support level stands out as an important barrier for the price to hold in the short term. However, indicators suggest that the market is still showing a weak outlook.
The Chaikin Money Flow (CMF) indicator is showing a negative trend again, indicating increased outflows from the market. This suggests that buyers are losing strength and selling pressure is continuing. Likewise, the downward trend in the Relative Strength Index (RSI) indicator supports the continued negative outlook on the price. This situation in the RSI strengthens the possibility that the current selling pressure may continue for a while.
In the short term, the price has the potential to retreat to the 2.18 support. In the event of a close below this level, a deeper correction could be seen in XRP. However, it will be critical for the price to maintain this support and react upwards to create a positive outlook. For a positive scenario, the 2.32 resistance must first be overcome. This level is considered a key threshold for XRP’s upward movements. If this resistance is broken strongly, a turnaround in market dynamics could take place and a bullish movement could be triggered. In particular, re-entry into the kumo cloud would be an indication that buyers are starting to dominate the market.
Although XRP displays a weak technical outlook for the moment, a sustained break above the 2.18 support may increase the possibility of a recovery. However, breaking the 2.32 resistance is vital for a positive momentum. Persistence above this level may pave the way for higher price movements by invalidating the current negative picture.
Supports 2.1800 – 2.0867- 1.9638
Resistances 2.3268 – 2.4230 – 2.6173
SOL/USDT
The US economy continues to perform very well. Solana, on the other hand, continues to remain in a downtrend. But things could change quickly in early 2025 as the focus intensifies on the incoming pro-crypto US Trump administration. On the other hand, data from glassnode shows that liquidity entering the ecosystem is $776 million per day, emphasizing growing investor confidence.
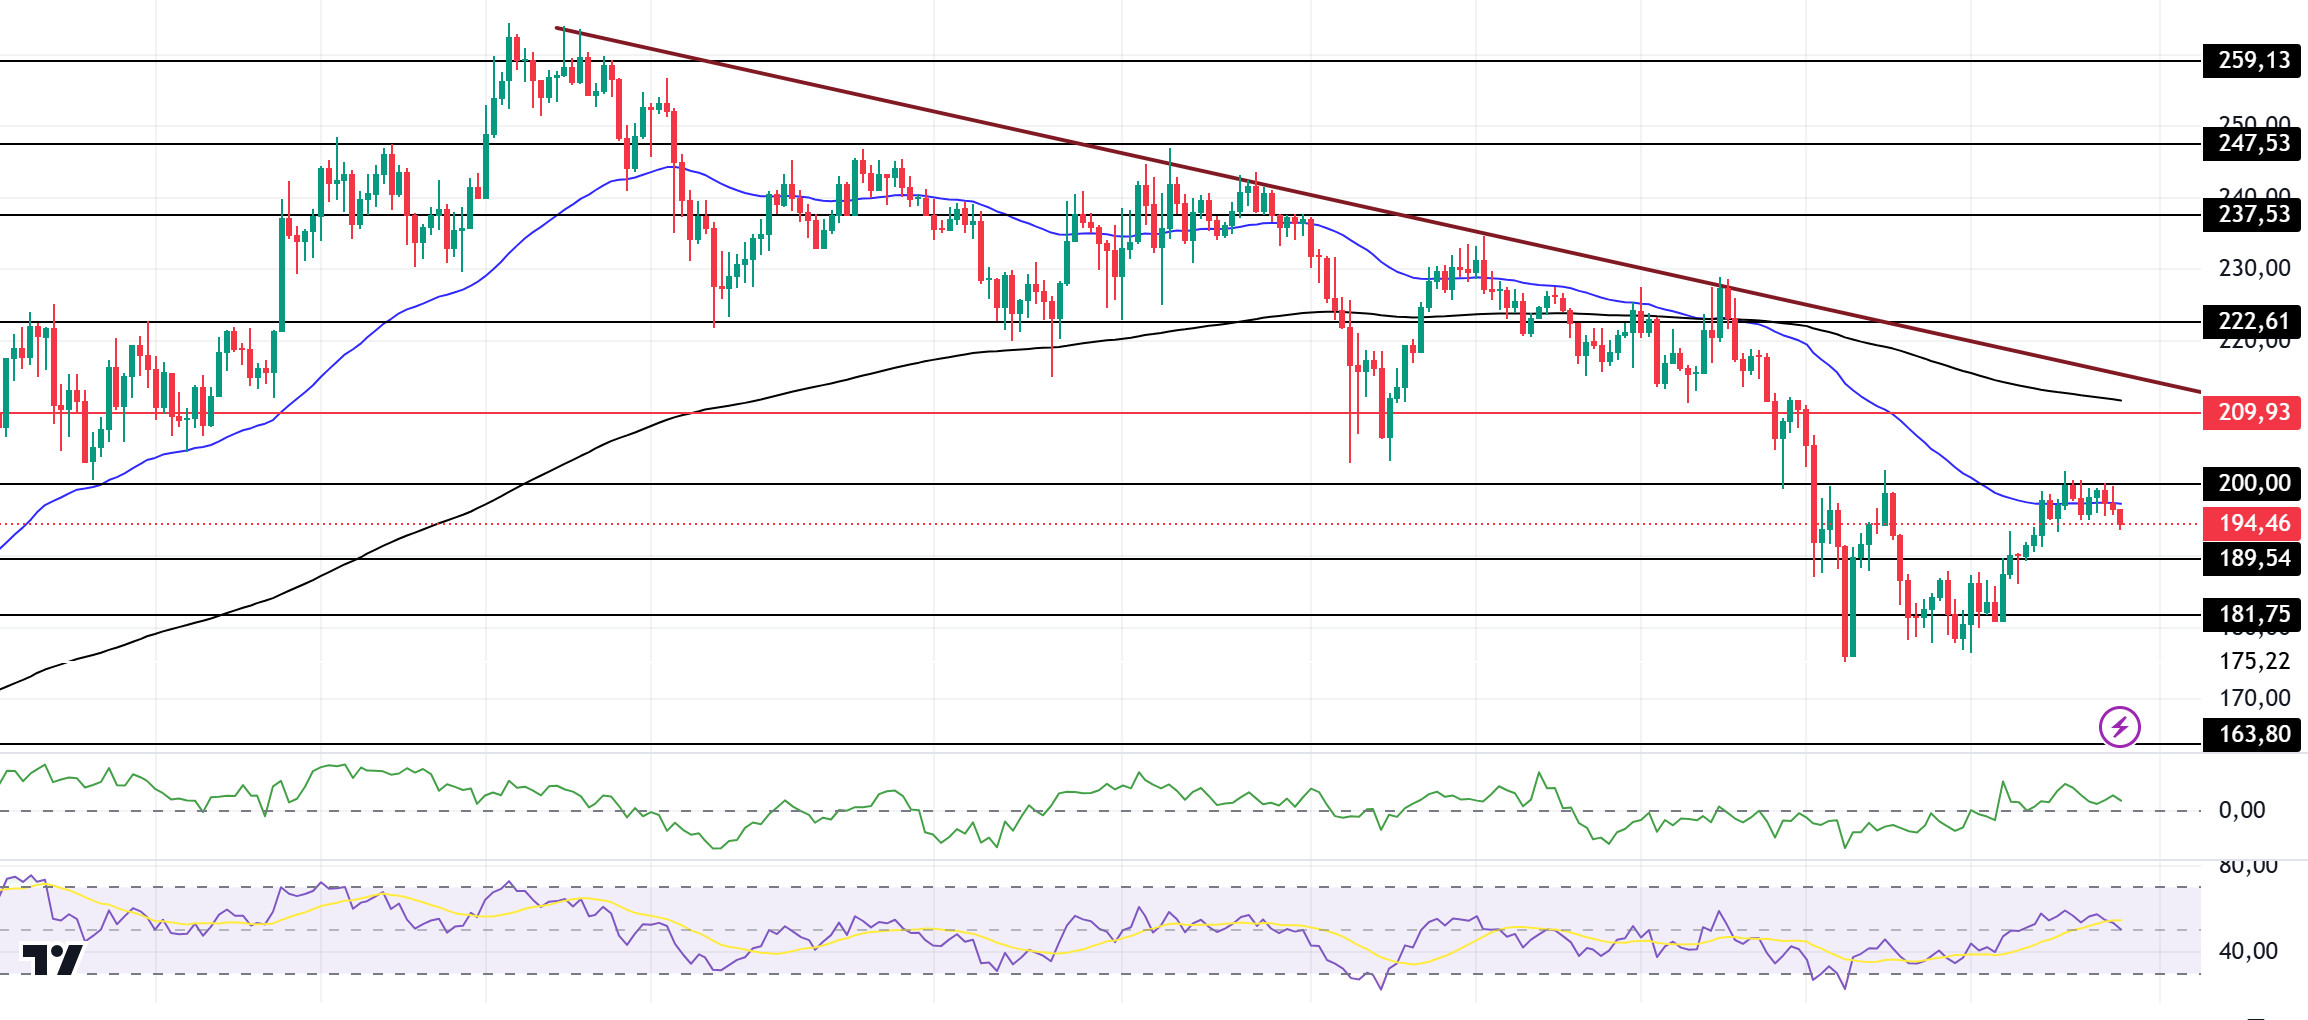
On the 4-hour timeframe, the 50 EMA (Blue Line) is below the 200 EMA (Black Line). The asset tested the 200.00 level, which is a strong resistance, but failed to break it and retreated slightly. If it breaks here, the rise may continue. When we examine the Chaikin Money Flow (CMF)20 indicator, although positive, money inflows started to decrease. This seems to have increased the selling pressure again. However, Relative Strength Index (RSI)14 is in the neutral zone. The 209.93 level appears to be a very strong resistance point in the rises driven by both the upcoming macroeconomic data and the news in the Solana ecosystem. If it breaks here, the rise may continue. In case of retracements for the opposite reasons or due to profit sales, the 163.80 support level can be triggered. If the price reaches these support levels, a potential bullish opportunity may arise if momentum increases.
Supports 189.54 – 181.75 – 163.80
Resistances 200.00 – 209.93 – 222.61
DOGE/USDT
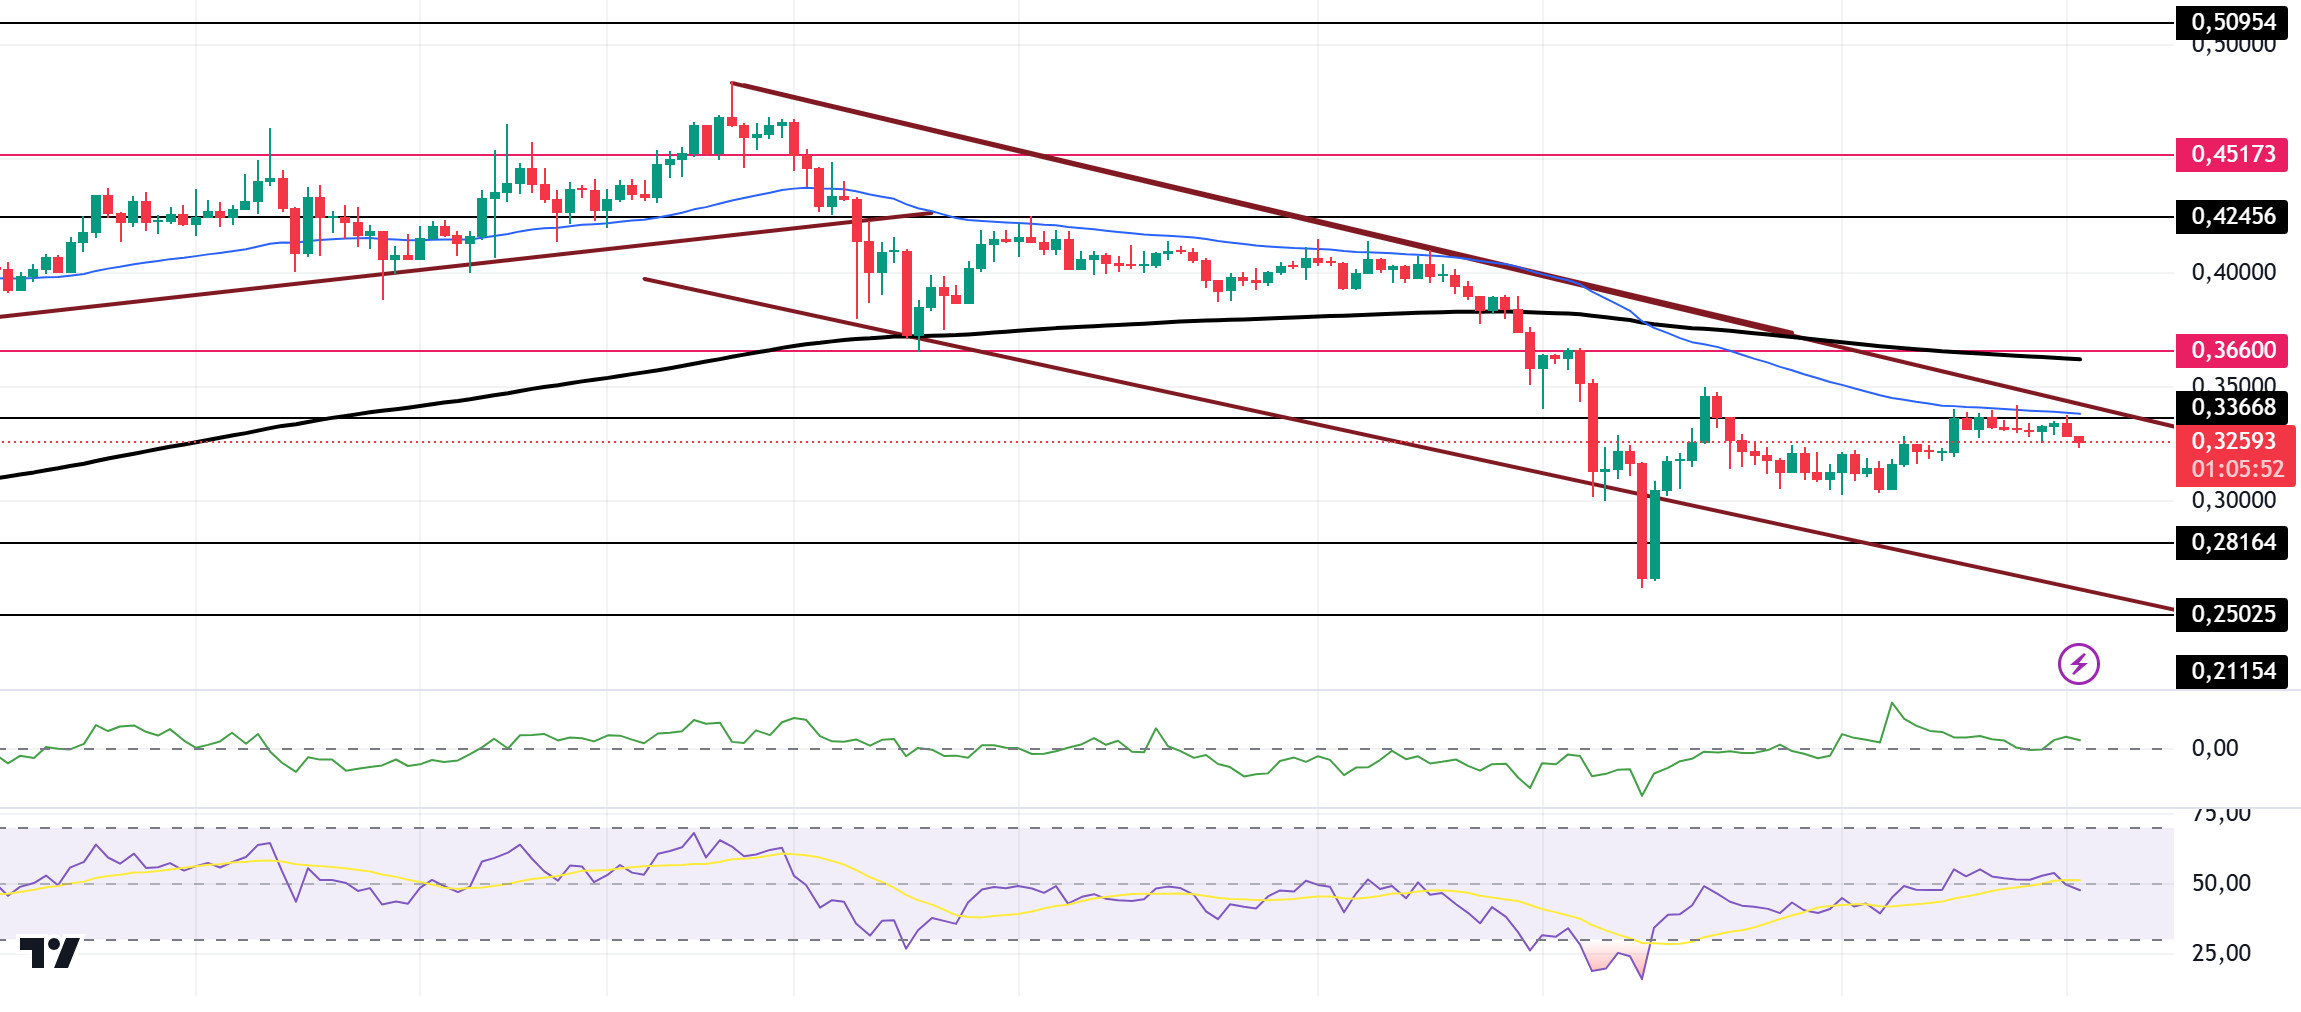
When we look at the chart, DOGE, which has been in a downtrend since December 8, gained momentum from the support of this trend and after consolidating in the middle of the trend, it tested the 50 EMA as resistance but could not break it and showed a slight decline. On the 4-hour timeframe, the 50 EMA (Blue Line) continues to be below the 200 EMA (Black Line). When we examine the Chaikin Money Flow (CMF)20 indicator, it moved into the negative zone. At the same time, money outflows started to increase. However, Relative Strength Index (RSI)14 continues to move at the neutral zone level. The 0.36600 level stands out as a very strong resistance point in the rises due to both the upcoming macroeconomic data and the innovations in the Doge coin. If DOGE catches a new momentum and rises above this level, the rise may continue strongly. In case of possible pullbacks due to macroeconomic reasons or negativity in the ecosystem, the 0.25025 level is an important support. If the price reaches these support levels, a potential bullish opportunity may arise if momentum increases.
Supports 0.28164 – 0.25025 – 0.21154
Resistances 0.33668 – 0.36600 – 0.42456
LEGAL NOTICE
The investment information, comments and recommendations contained herein do not constitute investment advice. Investment advisory services are provided individually by authorized institutions taking into account the risk and return preferences of individuals. The comments and recommendations contained herein are of a general nature. These recommendations may not be suitable for your financial situation and risk and return preferences. Therefore, making an investment decision based solely on the information contained herein may not produce results in line with your expectations.


