MARKET SUMMARY
Latest Situation in Crypto Assets
| Assets | Last Price | 24h Change | Dominance | Market Cap |
|---|---|---|---|---|
| BTC | 96,410.21 | -1.69% | 57.04% | 1,91 T |
| ETH | 3,391.27 | -1.36% | 12.20% | 408,03 B |
| XRP | 2.180 | -2.98% | 3.74% | 125,15 B |
| SOLANA | 190.47 | -1.84% | 2.73% | 91,28 B |
| DOGE | 0.3167 | -2.62% | 1.39% | 46,59 B |
| CARDANO | 0.8814 | -1.14% | 0.92% | 30,89 B |
| TRX | 0.2592 | 1.84% | 0.67% | 22,34 B |
| AVAX | 38.00 | -2.35% | 0.46% | 15,55 B |
| LINK | 23.02 | -2.23% | 0.44% | 14,67 B |
| SHIB | 0.00002192 | -1.51% | 0.39% | 12,93 B |
| DOT | 7.080 | -1.88% | 0.33% | 10,88 B |
*Prepared on 12.27.2024 at 07:00 (UTC)
WHAT’S LEFT BEHIND
Strive Files for “Bitcoin Bond” ETF
Strive Asset Management Company, founded by Vivek Ramaswamy, filed an application with the US Securities and Exchange Commission (SEC) on December 26 to list an ETF that will invest in Bitcoin convertible bonds. These bonds will be issued by MicroStrategy and other Bitcoin-focused companies.
Bitwise Files for Bitcoin Standard ETF
Bitwise has filed an application with the SEC for the Bitcoin Standard Corporations ETF. This fund aims to invest in the stocks of companies that hold at least 1,000 BTC in their portfolio. This step is considered an important development for corporate structures that adopt Bitcoin.
BlackRock Doubles IBIT Spot ETFs
According to Cryptoslate’s report, BlackRock’s filing with the SEC reveals that as of October 31, the Global Allocation Fund held 430,770 IBIT Bitcoin spot ETF shares. The total value of the fund has exceeded $17 million.
Marathon Digital Increases Bitcoin Holdings to 44,394
Marathon Digital achieved significant success in Bitcoin mining during 2024. The company increased its total computing power to 50 EH/s and capacity to 2 GW. Bitcoin holdings reached 44,394 units through convertible bonds. The company aims to position itself as a leader in the industry with innovations in its mining infrastructure.
KULR Buys $21 Million Bitcoin
US-based technology company KULR made an investment of $21 million by purchasing 217.18 Bitcoin at an average price of USD 96,556.53. The company’s Bitcoin purchase represents an increase in institutional investments using digital assets as strategic reserves.
HIGHLIGHTS OF THE DAY
Important Economic Calender Data
Time News Expectation Previous
Immutable (IMX): 24.52MM Token Unlock
INFORMATION
*The calendar is based on UTC (Coordinated Universal Time) time zone.
The economic calendar content on the relevant page is obtained from reliable news and data providers. The news in the economic calendar content, the date and time of the announcement of the news, possible changes in the previous, expectations and announced figures are made by the data provider institutions. Darkex cannot be held responsible for possible changes that may arise from similar situations.
MARKET COMPASS
On the last working day of the Christmas week for traditional markets, Asian markets were generally positive. The Japanese Cabinet’s approval of a record budget and China’s steps to support its economy provided the backdrop for the rises in stock markets. European and Wall Street futures, on the other hand, are pointing to a sell-off opening.
After the recent pressure in digital assets, the declines were somewhat limited and we generally observed horizontal price changes during Asian transactions. In the rest of the day, a session with low volume, but occasionally momentary sharp price movements may be waiting for us.
From the short term to the big picture.
The victory of former President Trump on November 5, which was one of the main pillars of our bullish expectation for the long-term outlook in digital assets, produced a result in line with our predictions. Afterwards, the president-elect’s appointments and expectations of increased regulation of the crypto ecosystem in the US continued to be a positive variable in our equation. Although it is expected to continue at a slower pace, the FED’s signal that it will continue its interest rate cut cycle and the volume in crypto asset ETFs indicating an increase in institutional investor interest (in addition to MicroStrategy’s BTC purchases, BlackRock’s BTC ETF options start trading…) support our upward forecast for the big picture for now.
In the short term, given the nature of the market and pricing behavior, we think it would not be surprising to see occasional pauses or pullbacks in digital assets. However, at this point, it is worth emphasizing again that the fundamental dynamics continue to be bullish.
TECHNICAL ANALYSIS
BTC/USDT
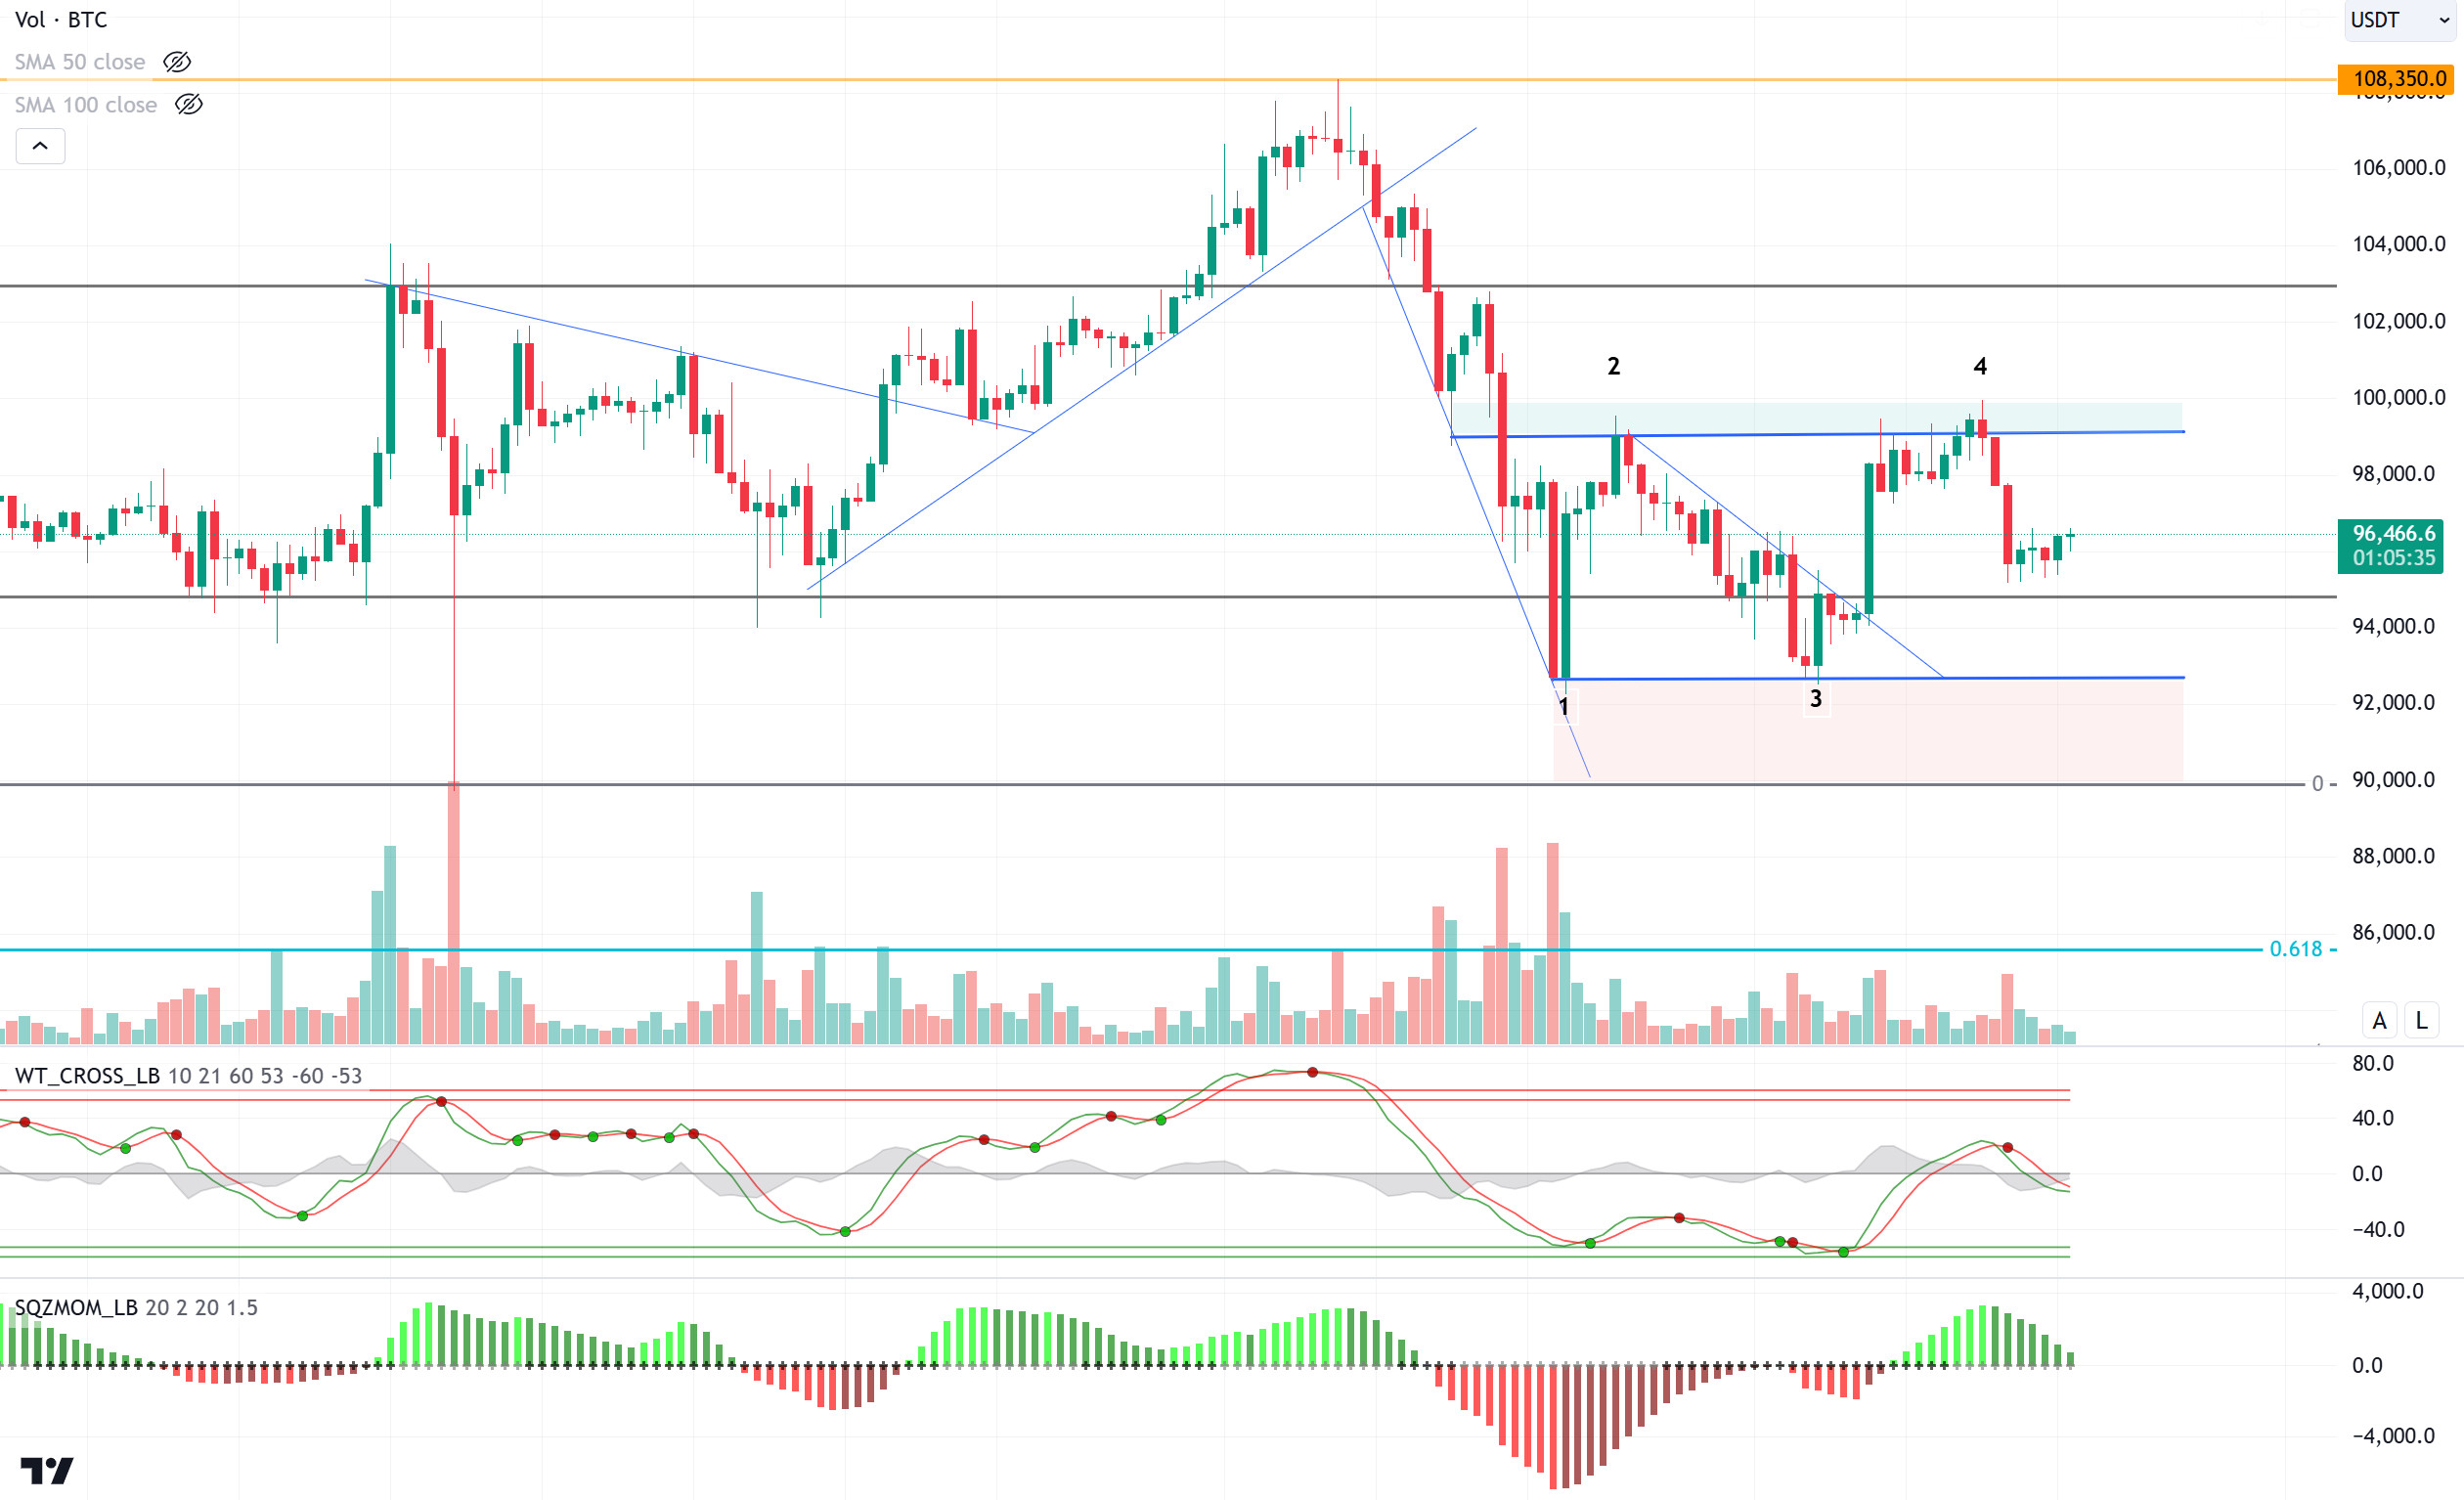
Four days of outflows in the US Bitcoin Spot ETFs after a fifteen-day positive streak led to a correction in the Bitcoin price from the $108,000 ATH level. Positive inflows were observed again with the opening of the markets after the Christmas holidays. Yesterday, Bitcoin spot ETFs saw net inflows totaling $475.15 million. The largest inflow was $254 million into Fidelity’s FBTC ETF, bringing FBTC’s total net inflows to $12.048 billion.
When we look at the technical outlook after the spot ETF data, the price, which received support from the double lows at 1 and 3, encountered resistance at the double highs at 2 and 4. The price, which moves in a horizontal band range, is in search of direction with the rectangle pattern. In BTC, which is currently trading at 96,500, the 95,000 support zone, which is the major resistance level in the pattern, is critical. While pricing above this level continues to support upward movements, 97,200 and then 99,100 levels may appear as target points, while closures below it may enable the price to test the 92,500 support level. When we look at the technical oscillators, we can say that it gives a weakening sell signal on the hourly chart, but the momentum is getting weaker.
Supports 95,000 – 92,550 – 90,000
Resistances 97,200 – 99,100 – 102,500
ETH/USDT
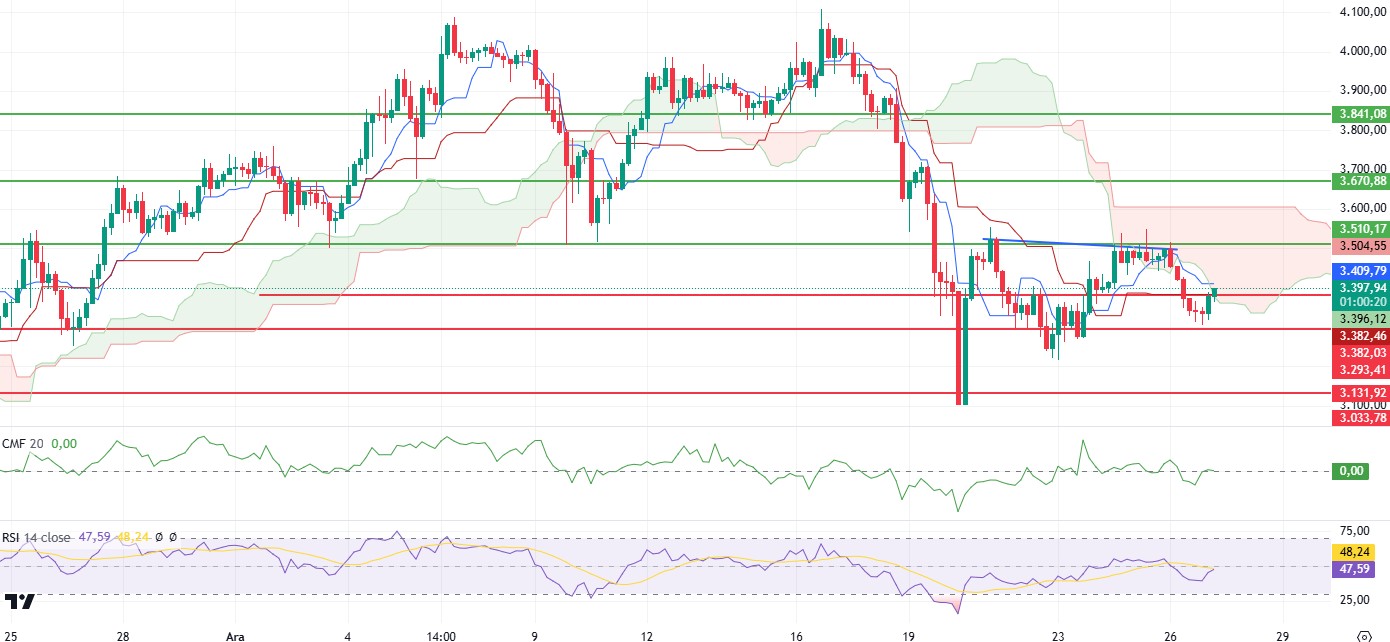
Ethereum fell to the critical 3,293 support with its recent decline. However, it recovered with a strong reaction from this level and managed to rise to the lower band of the kumo cloud. This move strengthened the bullish potential as the price rose above the kijun level.
In terms of technical indicators, the Relative Strength Index (RSI) is giving a positive signal with its upward movement, pointing to a market recovery in favor of buyers. The Chaikin Money Flow (CMF) indicator rose from negative territory to the zero line, confirming an improvement in capital flows. This indicates that the market is facing renewed buyer interest. The upward trend of the momentum indicator suggests that the uptrend may continue if the price holds above the kumo cloud boundaries. In this context, the price has the potential to move up to 3,510 levels during the day.
However, resistance and support points at current levels need to be considered. In particular, the 3,382 level, which coincides with the kijun level and the lower band of the kumo cloud, constitutes a critical threshold for the short-term outlook. Closes above this level may allow the price to maintain its bullish momentum. However, in case of a break below 3,382, there is a risk that Ethereum could retrace back to 3,293 support.
Supports 3,382 – 3,293- 3,131
Resistances 3,510 – 3,670 – 3,841
XRP/USDT
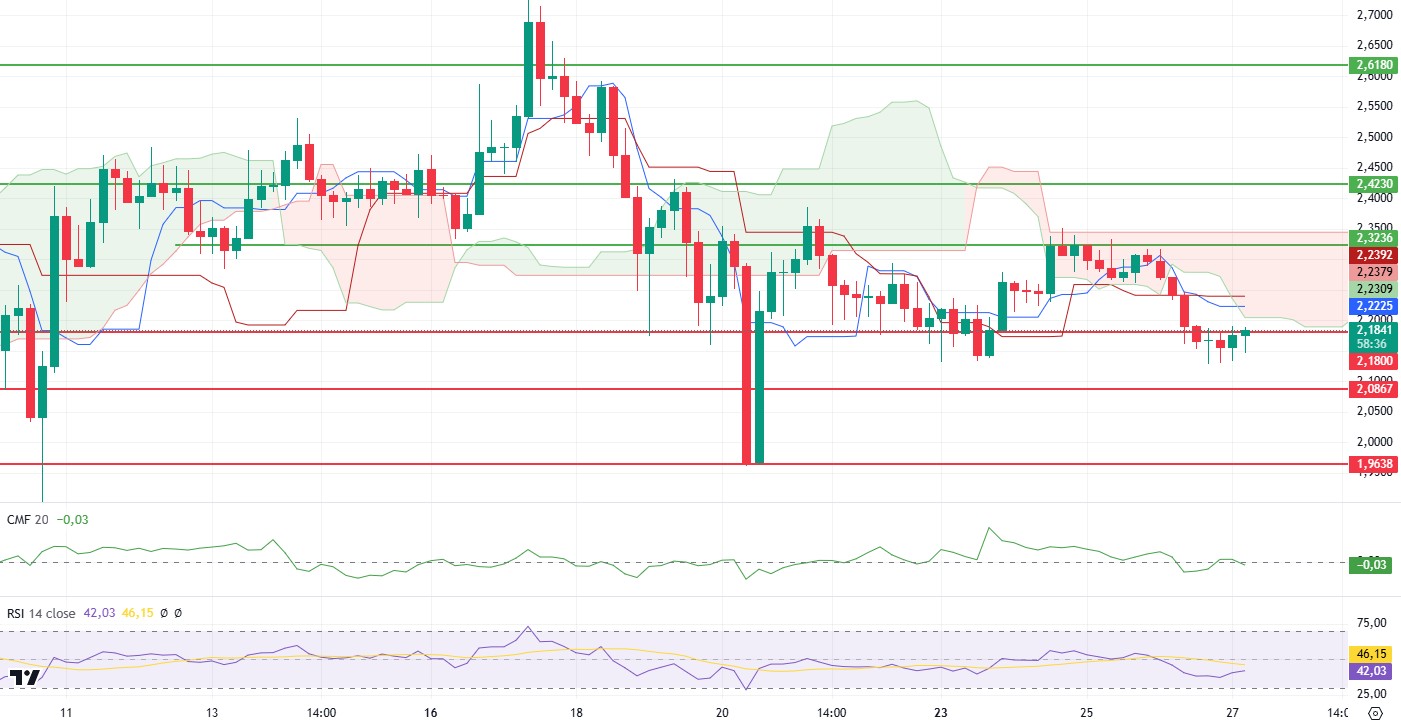
XRP displayed a downward movement, losing the critical 2.18 support level with its recent decline. However, with the recovery movements that took place overnight, it is seen that it is trying to hold on to this level by rising again. Price movements and technical indicators reveal the importance of critical levels as well as short-term uncertainty.
Looking at the Ichimoku indicator, it is observed that the sell signal formed by the intersection of kijun and tenkan levels is still in effect. In order to invalidate this signal, it stands out as a critical threshold for the price to rise above the 2.20 level and enter the Kumo cloud. A return into the Kumo cloud may increase the possibility of the price entering the uptrend. The Relative Strength Index (RSI) is showing signs of recovery, indicating a strengthening on the buy side of the market. The upward rebound in the Chaikin Money Flow (CMF) indicator suggests a positive shift in capital flows. This suggests that upward movements may be supported.
The fact that the price remains above 2.18 and especially above 2.20 levels increases the possibility of upside attacks. However, a close below 2.18 may bring the risk of a pullback towards lower support levels. In terms of the short-term outlook, the price’s movements around these critical levels seem to be decisive for the market direction. In particular, holding above the 2.20 level may make it easier for the buy side to control the market.
Supports 2.1800 – 2.0867- 1.9638
Resistances 2.3236 – 2.4230 – 2.6180
SOL/USDT
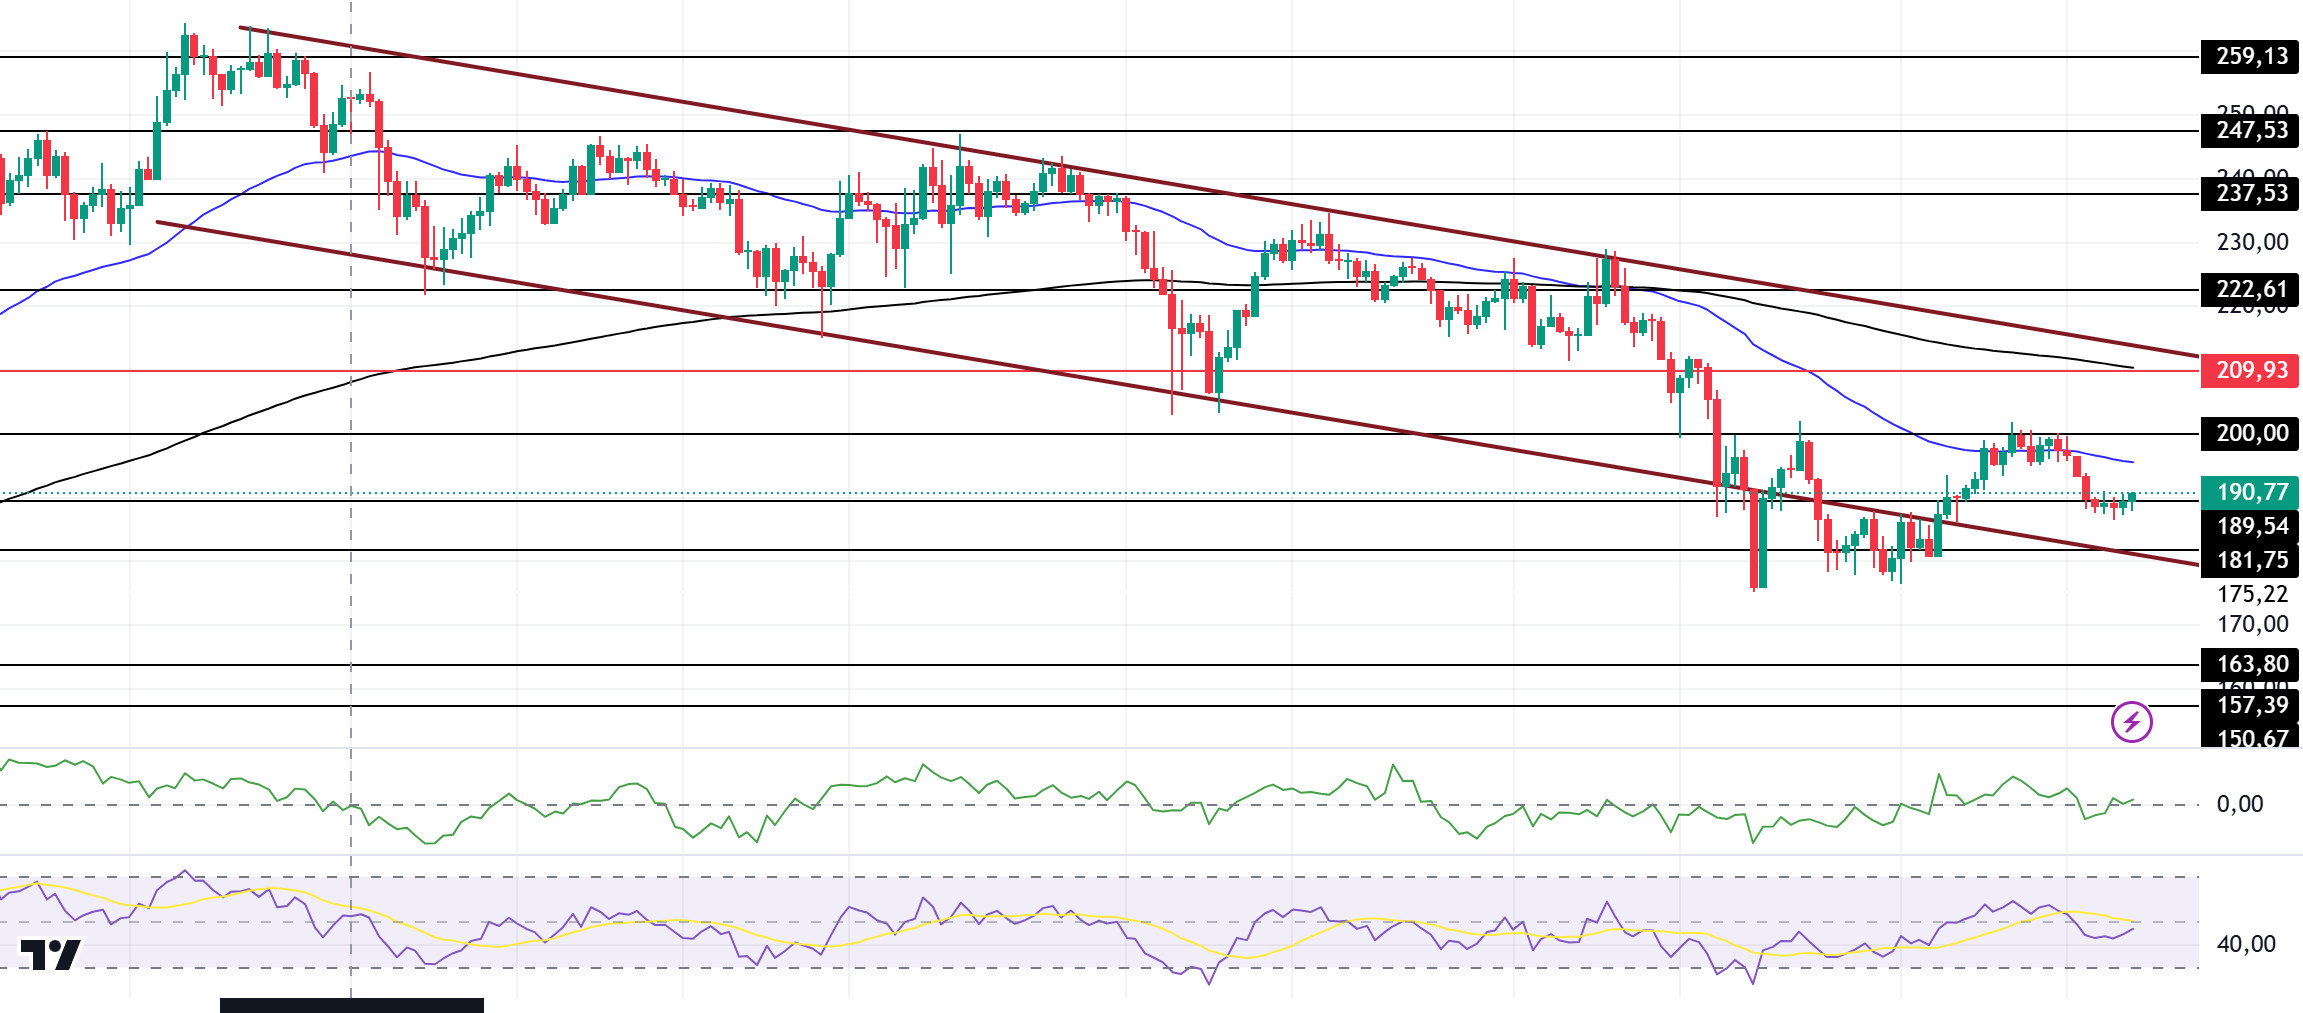
Solana continued its bearish move horizontally. On the 4-hour timeframe, the 50 EMA (Blue Line) is below the 200 EMA (Black Line). As a matter of fact, the asset tested but failed to break the 50 EMA resistance and the strong resistance at 200.00. If it retests and breaks here again, the rise may continue. When we analyze the Chaikin Money Flow (CMF)20 indicator, although it is in the negative zone, money inflows and outflows are balanced. However, Relative Strength Index (RSI)14 is at a negative level. The 209.93 level stands out as a very strong resistance point in the rises driven by both the upcoming macroeconomic data and the news in the Solana ecosystem. If it breaks here, the rise may continue. In case of retracements for the opposite reasons or due to profit sales, the 163.80 support level can be triggered. If the price comes to these support levels, a potential bullish opportunity may arise if momentum increases.
Supports 189.54 – 181.75 – 163.80
Resistances 200.00 – 209.93 – 222.61
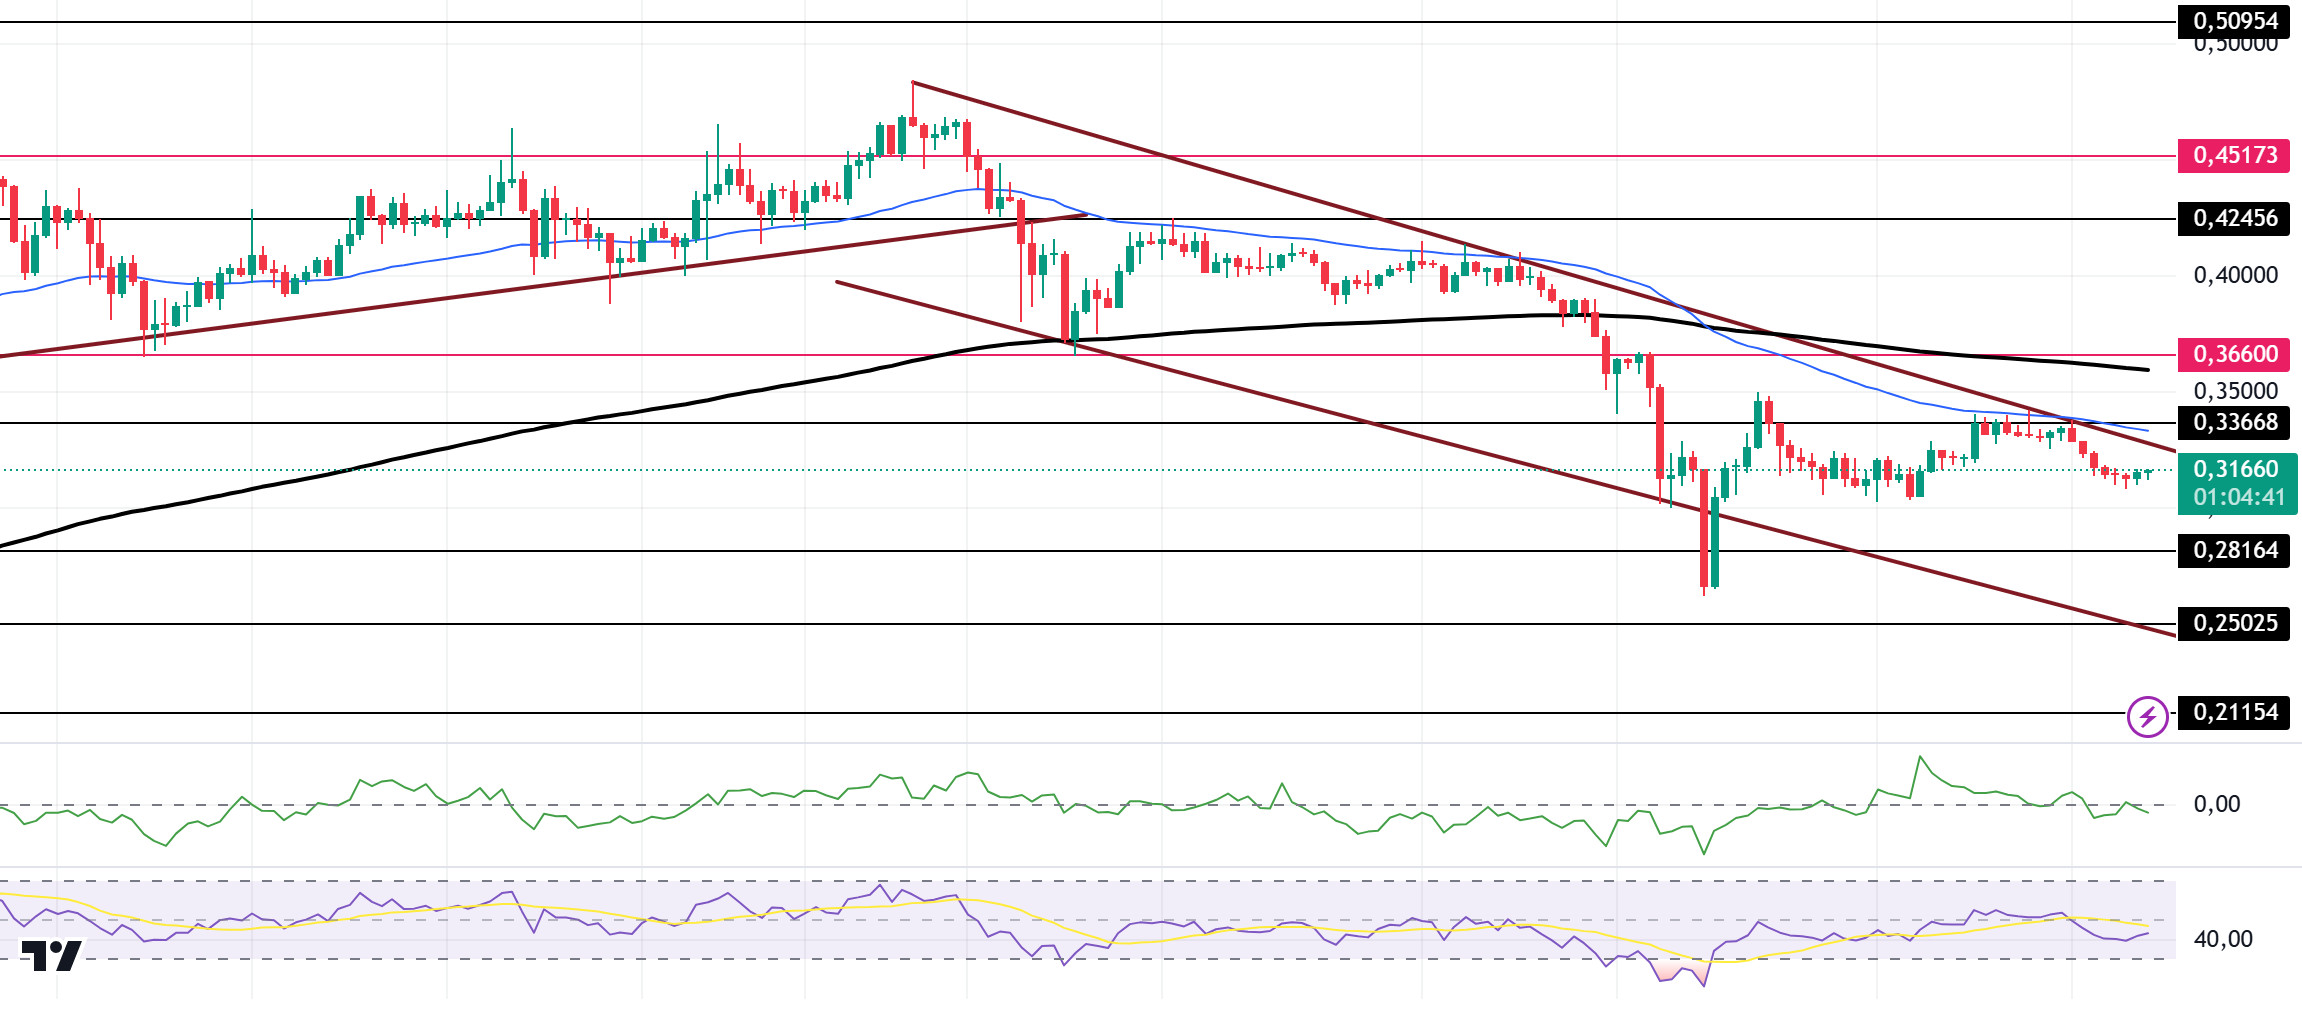
DOGE/USDT
When we look at the chart, DOGE, which has been in a downtrend since December 8, gained momentum from the support of this trend and after consolidating in the middle of the trend, it tested the 50 EMA as resistance but could not break it and the decline deepened. The asset is trending horizontally after the fall. On the 4-hour timeframe, the 50 EMA (Blue Line) continues to be below the 200 EMA (Black Line). When we examine the Chaikin Money Flow (CMF)20 indicator, it moved into the negative zone. As a matter of fact, money outflows started to increase. However, Relative Strength Index (RSI)14 continues to move from the neutral zone to the oversold zone. The 0.36600 level stands out as a very strong resistance level in the rises driven by both the upcoming macroeconomic data and the innovations in the Doge coin. If DOGE catches a new momentum and rises above this level, the rise may continue strongly. In case of possible pullbacks due to macroeconomic reasons or negativity in the ecosystem, the 0.25025 level, which is the base level of the trend, is an important support. If the price reaches these support levels, a potential bullish opportunity may arise if momentum increases.
Supports 0.28164 – 0.25025 – 0.21154
Resistances 0.33668 – 0.36600 – 0.42456
LEGAL NOTICE
The investment information, comments and recommendations contained herein do not constitute investment advice. Investment advisory services are provided individually by authorized institutions taking into account the risk and return preferences of individuals. The comments and recommendations contained herein are of a general nature. These recommendations may not be suitable for your financial situation and risk and return preferences. Therefore, making an investment decision based solely on the information contained herein may not produce results in line with your expectations.