
MARKET SUMMARY
Latest Situation in Crypto Assets
| Assets | Last Price | 24h Change | Dominance | Market Cap. |
|---|---|---|---|---|
| BTC | 97,343.20 | 0.34% | 60.85% | 1,93 T |
| ETH | 2,643.31 | -0.68% | 10.04% | 318,43 B |
| XRP | 2.402 | -2.66% | 4.37% | 138,72 B |
| SOLANA | 203.68 | -0.45% | 3.13% | 99,36 B |
| DOGE | 0.2510 | -1.99% | 1.17% | 37,16 B |
| CARDANO | 0.6955 | -1.11% | 0.77% | 24,47 B |
| TRX | 0.2325 | -0.52% | 0.63% | 20,02 B |
| LINK | 18.64 | -0.17% | 0.37% | 11,90 B |
| AVAX | 25.29 | 0.53% | 0.33% | 10,42 B |
| SHIB | 0.00001589 | -2.03% | 0.30% | 9,37 B |
| DOT | 4.824 | 1.26% | 0.24% | 7,47 B |
*Prepared on 2.10.2025 at 07:00 (UTC)
WHAT’S LEFT BEHIND
Michael Saylor: Bitcoin Is Becoming the World’s Backup Capital Network
Michael Saylor, founder of MicroStrategy, stated that Bitcoin has become a global reserve capital network. Saylor emphasized that Bitcoin is worth holding longer term than real estate, stocks and other traditional assets.
Transaction Fees on Bitcoin and Ethereum Networks Decline
Transaction fees on the Bitcoin network have dropped to 1 satoshi/byte (around $0.14), according to Mempool.space. Ethereum gas fees are trading below 1 gwei at around $0.05, according to Etherscan data.
Circle Issues New USDC Worth $250 Million at Solana
Circle minted $250 million in new USDC on the Solana blockchain early this morning, according to Onchain Lens data. Since 2025, Circle has minted a total of 7 billion USDC on Solana.
France Announces More Than 100 Billion Euros Investment in Artificial Intelligence
Ahead of the Artificial Intelligence Action Summit, French President Emmanuel Macron announced that the country will invest 109 billion euros in artificial intelligence in the coming years. Macron stated that 100,000 young people will be trained in this project.
ChatGPT Ranked Sixth in the World in Web Traffic
According to Similarweb, ChatGPT (chatgpt.com) was the sixth most visited website in the world in January 2025, with an increase of 5.91%. Google and YouTube took the top two spots. Sam Altman, CEO of OpenAI, commented on this success by saying, “There is still a long way to go to catch Google.”
HIGHLIGHTS OF THE DAY
Important Economic Calender Data
| Time | News | Expectation | Previous |
|---|---|---|---|
| Aptos (APT) | 11.31 Million Token Unlock | ||
| Lido DAO (LDO) | Scheduled Maintenance | ||
| BitTensor (TAO) | Mainnet Upgrade |
INFORMATION
*The calendar is based on UTC (Coordinated Universal Time) time zone.
The economic calendar content on the relevant page is obtained from reliable news and data providers. The news in the economic calendar content, the date and time of the announcement of the news, possible changes in the previous, expectations and announced figures are made by the data provider institutions. Darkex cannot be held responsible for possible changes that may arise from similar situations.
MARKET COMPASS
The “tariffs” agenda, which accelerated after Trump took over the Oval Office, continues to be at the center of global markets. Trump, who caused turbulence in the financial markets with his statements early last week, started the new week with new statements. The President’s announcement of a 25% tariff on steel and aluminum imports made headlines. Stating that he will announce tariffs on Tuesday or Wednesday on the basis of reciprocity, Trump said, “If they are taxing us 130 percent and we are not buying anything from them, this will not stay like this.” Apart from China, statements came from the European front, another economic unit that is concerned about the issue. German Chancellor Olaf Scholz stated that the EU is ready to respond “within an hour” if the US imposes tariffs on European goods.
However, we see that the markets have started to adapt to Trump’s unpredictable management style and reacted less as they tried to digest the tariffs issue. Wall Street, which closed last week negatively due to the macro data, is expected to make a positive start to the new week. We also see green colors in futures contracts linked to European indices. There is a mixed picture in Asian markets. Trump’s new statements on tariffs seem to find more response in the currency and fixed income markets. Digital assets are relatively more volatile reactions to news flows.
Bitcoin, the largest cryptocurrency, first lost value after the President’s tariff announcements, but regained its losses as investors’ sensitivity to the issue was seen to have decreased. Similar changes were observed in other major digital asset prices.
Although there is no significant data flow in the economic calendar today, the US agenda will continue to be decisive in asset prices. Expectations regarding the interest rate cut course of the country’s Central Bank (FED) will continue to be under the scrutiny of investors, especially with the statements and developments on tariffs.
From the short term to the big picture.
Trump’s victory on November 5, one of the main pillars of our bullish expectation for the long-term outlook in digital assets, produced a result in line with our predictions. In the process that followed, the appointments made by the president-elect and the increasing regulatory expectations for the crypto ecosystem in the US, as well as the emergence of BTC as a reserve, continued to take place in our equation as positive variables. Then, 4 days after the new President took over the White House, he signed the “Cryptocurrency Working Unit” decree, which was among his election promises, and we think that the positive reflection of the outputs it will produce in the coming days on digital assets may continue.
On the other hand, the expectations that the FED will continue its interest rate cut cycle, albeit on hiatus for now, and the volume in crypto-asset ETFs indicating an increase in institutional investor interest support our upside forecast for the big picture. In the short term, given the nature of the market and pricing behavior, we think it would not be surprising to see occasional pause or pullbacks in digital assets. However, at this point, it is worth underlining again that we think the fundamental dynamics continue to be bullish.
TECHNICAL ANALYSIS
BTC/USD
Michael Saylor, founder of MicroStrategy, which stands out with its pro-Bitcoin stance, stated that Bitcoin has become a global reserve capital network, describing it as a more valuable long-term investment tool than traditional assets such as real estate and stocks. MicroStrategy, which regularly buys Bitcoin every Monday, also released a new tracker. On the other hand, the drop-in transaction fees on the Bitcoin network to 1 Satoshi/byte (about $0.14) is in line with the low volatility in its price.
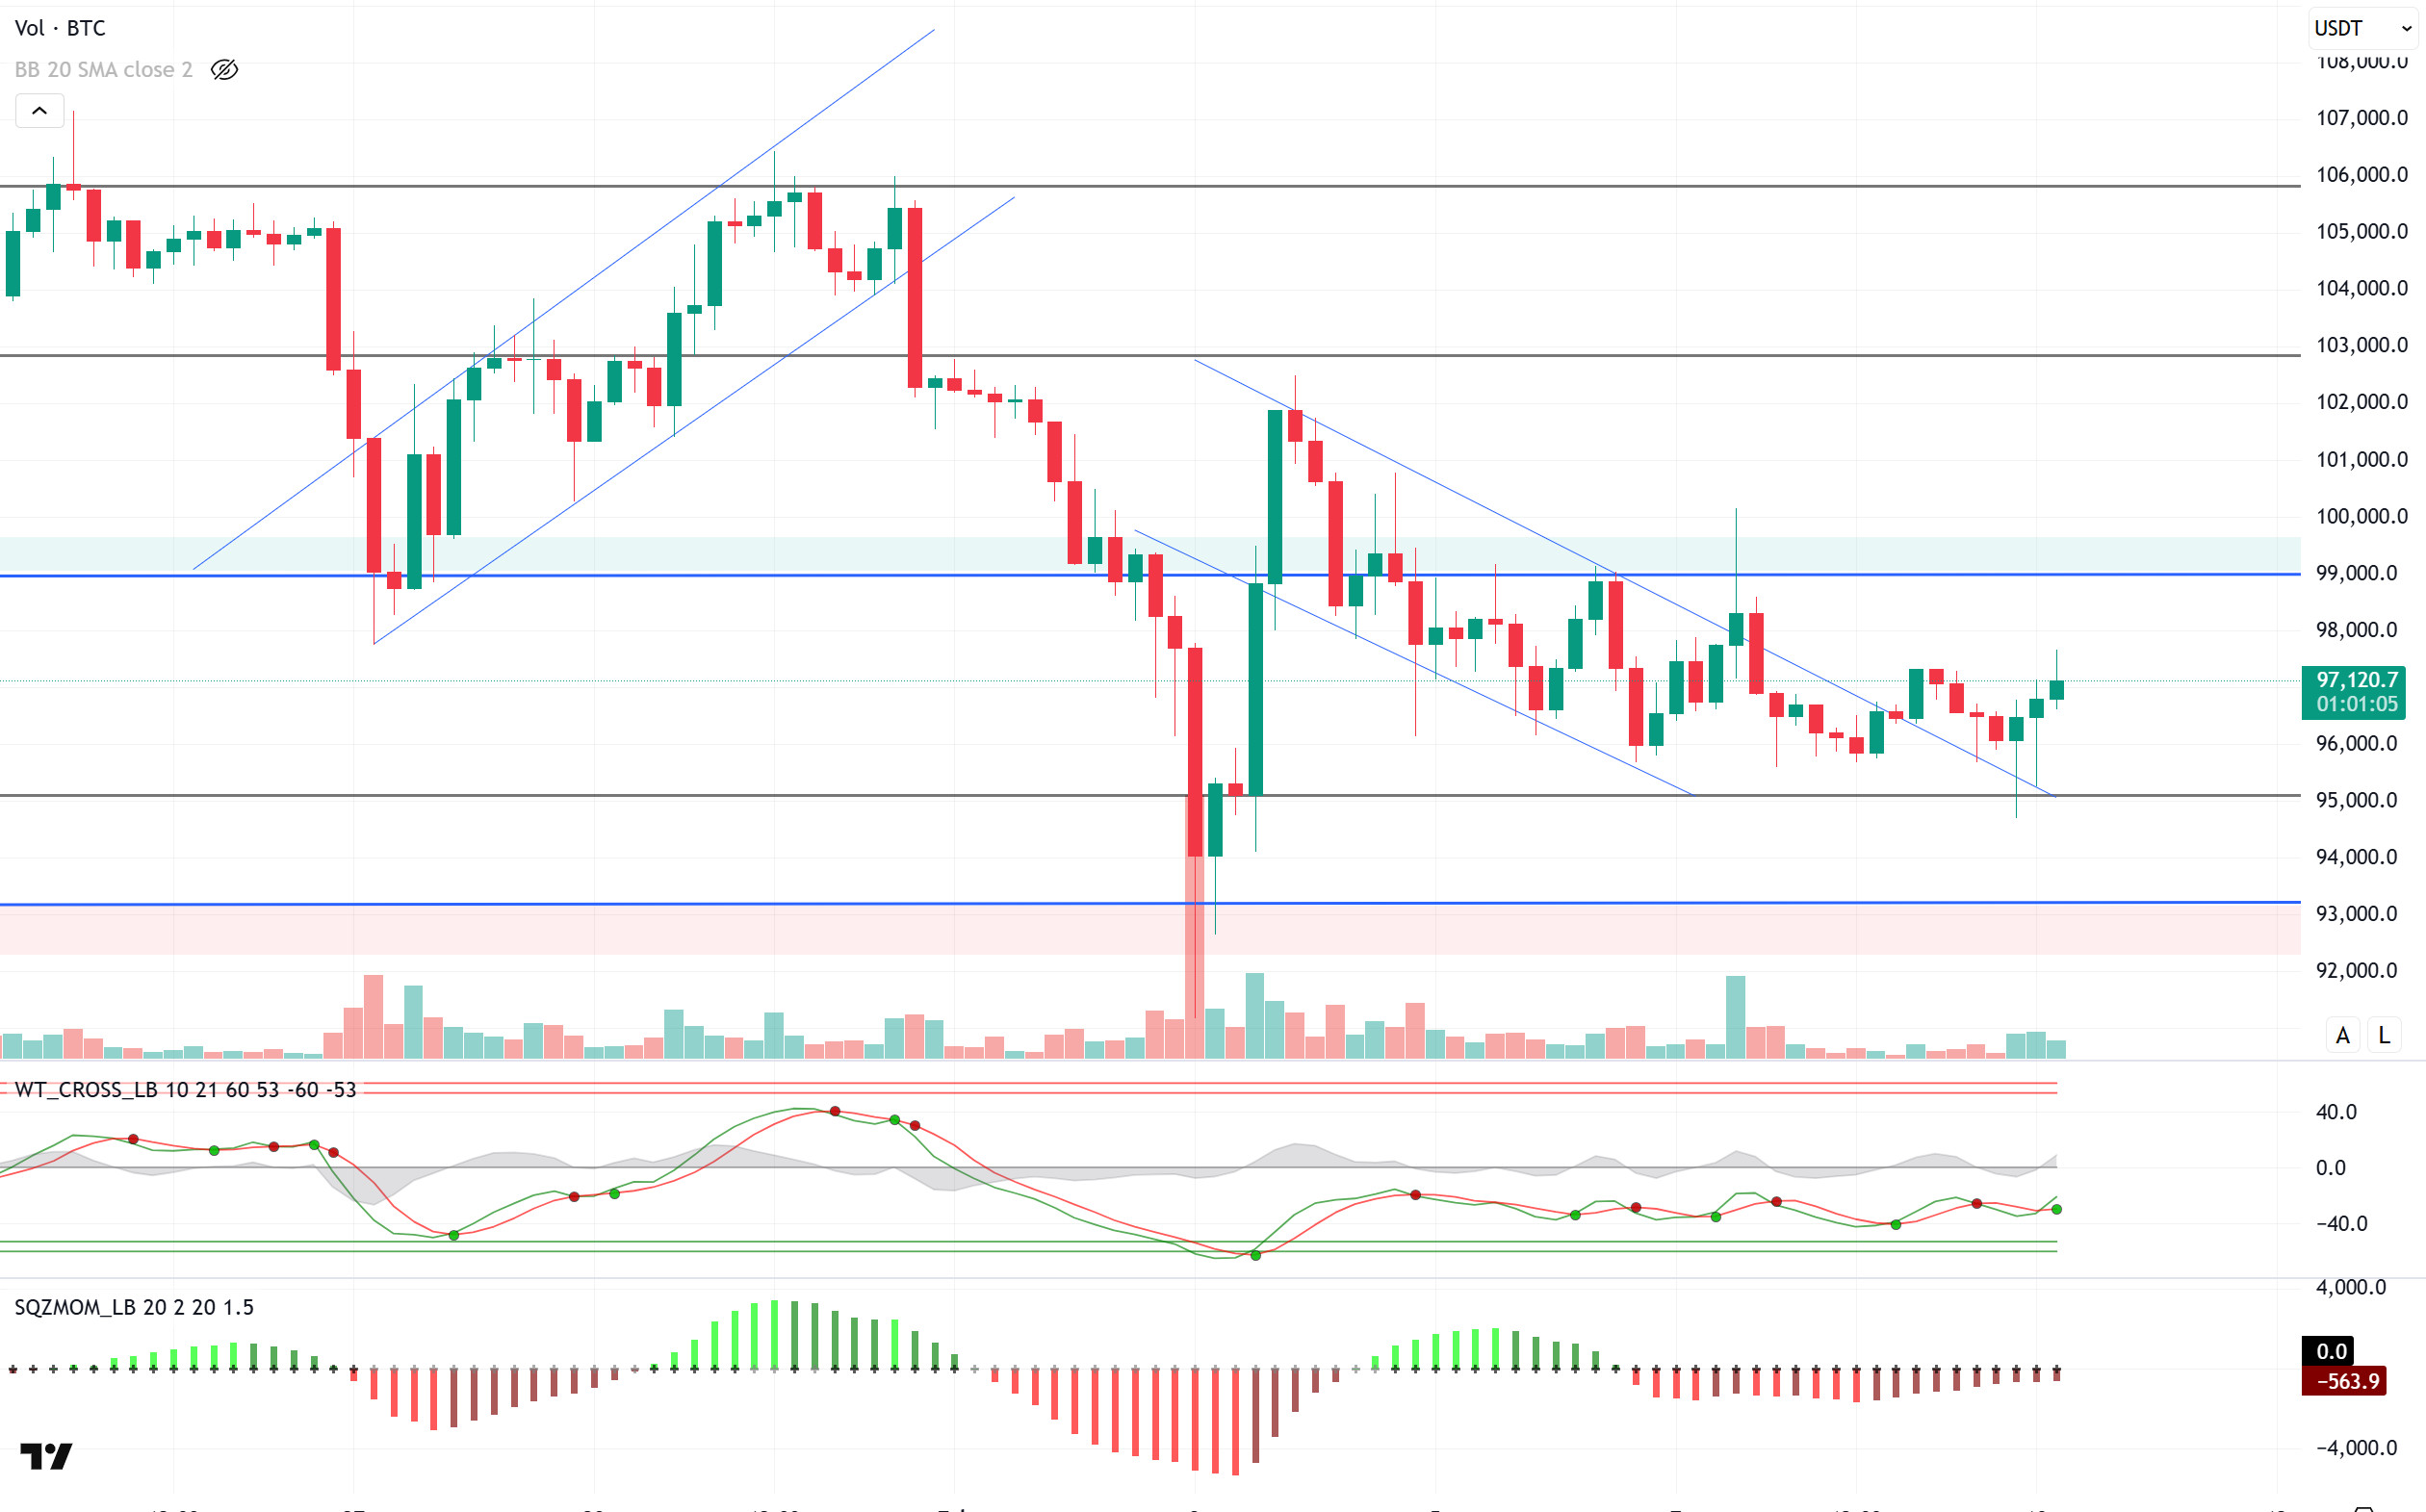
Looking at the technical outlook, we observe that BTC is moving in a horizontal band range, breaking out of the falling trend channel. The price, which has twice pinned the 95,000 level, which is the major support zone, found buyers at this point and turned its direction upwards. Technical oscillators are showing an indecisive outlook while generating trading signals near the oversold zone. On the other hand, the momentum indicator is trying to gain strength to move into positive territory. In general, moving averages and oscillators are neutral for now and a breakout may occur depending on market dynamics. If the uptrend continues, short positions at and above the 99,000 level will be targeted, while the 95,000-support level will again be a critical monitoring point in a possible pullback.
Supports 95,000 – 92,800 – 90,400
Resistances 98,000 – 99,100 -101,400
ETH/USDT
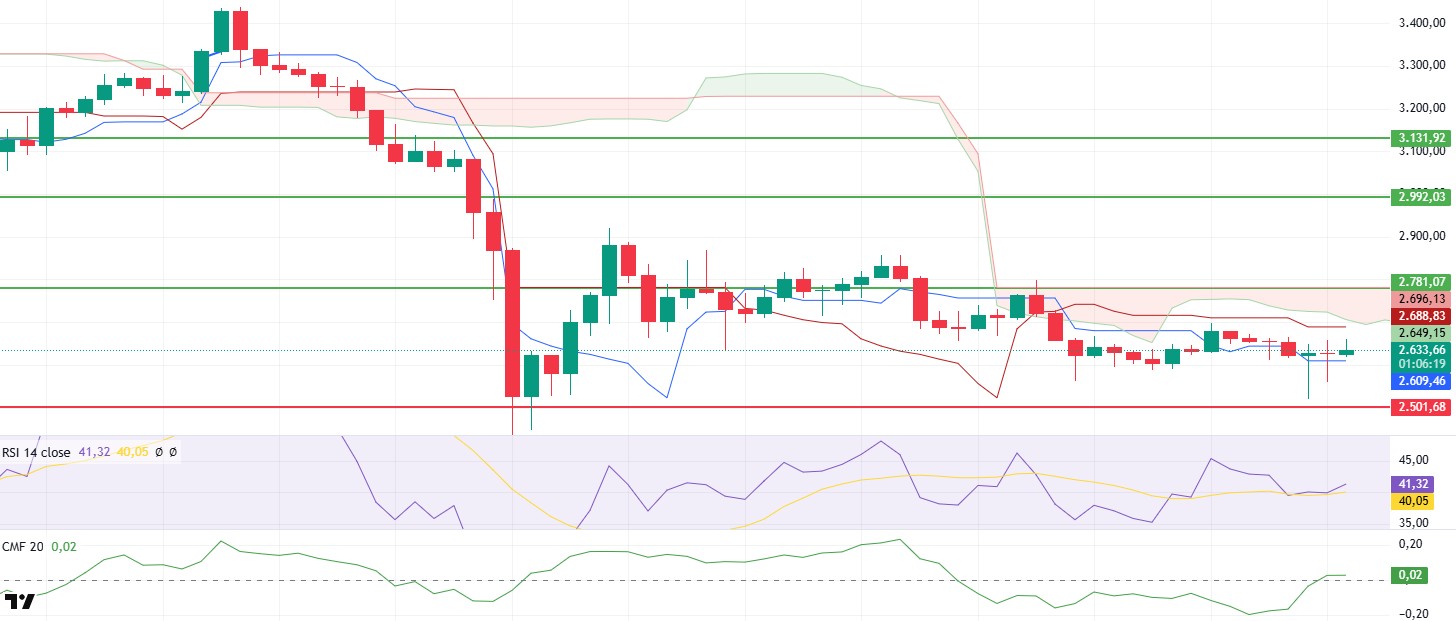
ETH managed to rise to the critical resistance level of $2,781 on Friday. However, it faced intense selling pressure at this level and retreated to around $2,500 as expected. Over the weekend, news that China would impose tariffs on the US and developments that the US would impose a 25% tariff on steel and aluminum imports increased uncertainty in the markets. This reduced risk appetite, causing the ETH price to fall back to around $2,500. However, there was a strong recovery with the purchases from this level and the price rose above the $2,600 level and started to be priced here.
Despite the high volatility in the market, the price stabilized at certain levels, causing technical indicators to display a horizontal and neutral outlook. Relative Strength Index (RSI) continues to move sideways with support from the based MA line, indicating that momentum is in search of a balance. The Chaikin Money Flow (CMF) indicator, on the other hand, moved back into positive territory after the weekend decline, revealing that liquidity has increased and there are money inflows back into the market. When the Ichimoku indicator is analyzed, it is seen that the price remains between the tenkan and kijun levels, suggesting that the market is following a neutral course and the price may remain in the accumulation process for a while. In particular, the upper limit of the Ichimoku cloud, the $2,781 level, stands out as a critical resistance.
Overall, ETH is currently neutral, with no significant breakout to the upside or downside. However, considering the technical indicators and price movements, a breakout above the $2,781 level could trigger a strong momentum in the price and the start of sharp bullish movements. On the other hand, the $2,501 level remains important as the main support point. In case of a downside break of this level , a larger correction may occur as the selling pressure deepens.
Supports 2,501 – 2,368 – 2,114
Resistances 2,781 – 2,992 – 3,131
XRP/USDT
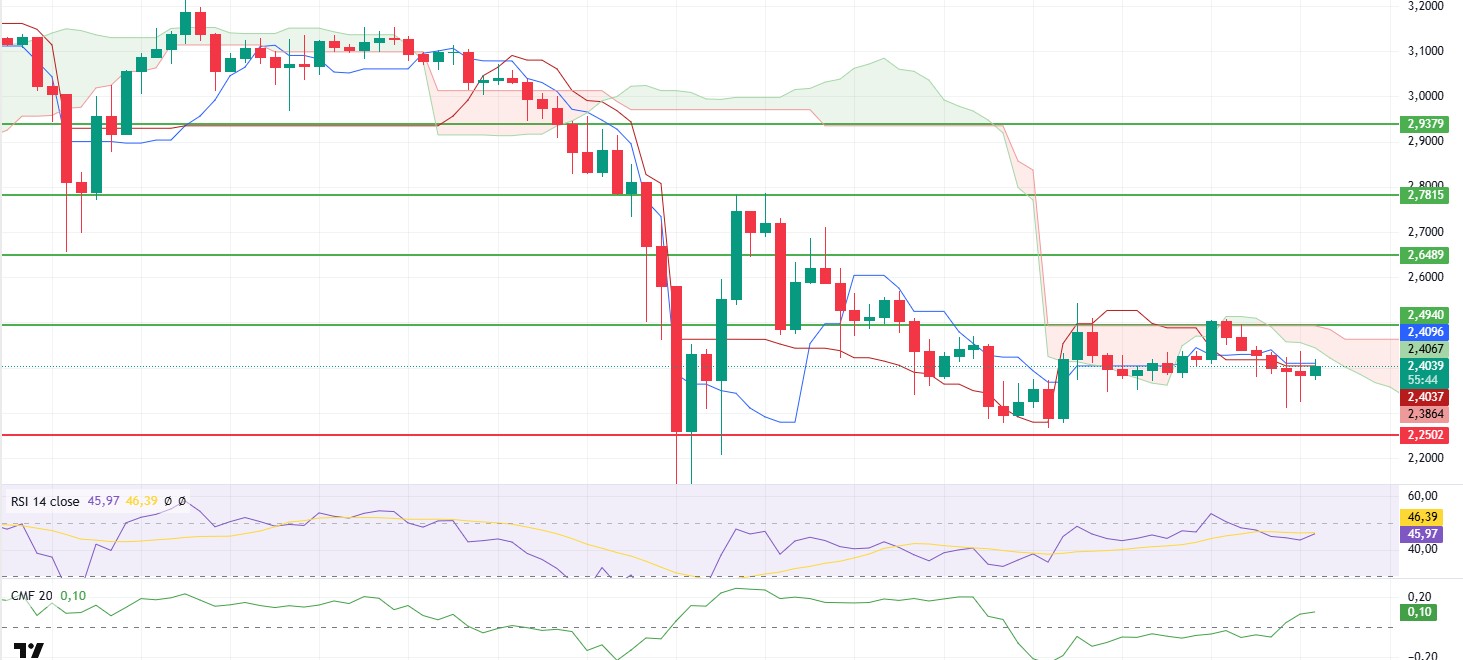
Although XRP made two attacks above the $2.49 level on Friday and Sunday, it faced intense selling pressure in this region and experienced pullbacks. On Sunday, the price, which fell as low as $ 2.30 with the news flow on tariffs that created uncertainty in global markets, has stabilized at $ 2.39, showing a rapid recovery with the support it received from here.
The Chaikin Money Flow (CMF) indicator crossed into positive territory, indicating that liquidity inflows to the market are increasing and buyers see declines as opportunities. In particular, the price holding at certain levels indicates that buying pressure may strengthen. On the Relative Strength Index (RSI) side, a recovery is observed after the recent decline. The upward movement of the indicator suggests that the price is trying to gain strength and momentum may turn positive.
XRP is currently pricing at the tenkan and kijun levels according to the Ichimoku indicator. This shows that there is no clear direction in the market yet, but a certain breakout could trigger a new move. The $2.49 level still stands as a strong resistance point. If this level is exceeded and sustained above it, a rapid upward movement can be seen up to $2.68. On the other hand, the $2.25 level is a critical support point. If it sags below this region, the price may enter a deeper correction process with increasing selling pressure.
Supports 2.2502 – 2.0201 – 1.6309
Resistances 2.4940 – 2.6489 – 2.7815
SOL/USDT
Polymarket predicts only a 35% chance of Solana spot ETF approval by July 31, based on changing SEC dynamics. According to Block Beats, it reported on February 8 that a large on-chain whale staked 39,344 SOL (about $7.61 million) with Solayer. On the other hand, data on spot inflows and outflows revealed that SOL witnessed over $25 million in SOL token outflows from centralized exchanges when the price of SOL reached the important support level of $190. According to data from Glassnode, more than 5 million new addresses are created on the chain every day.
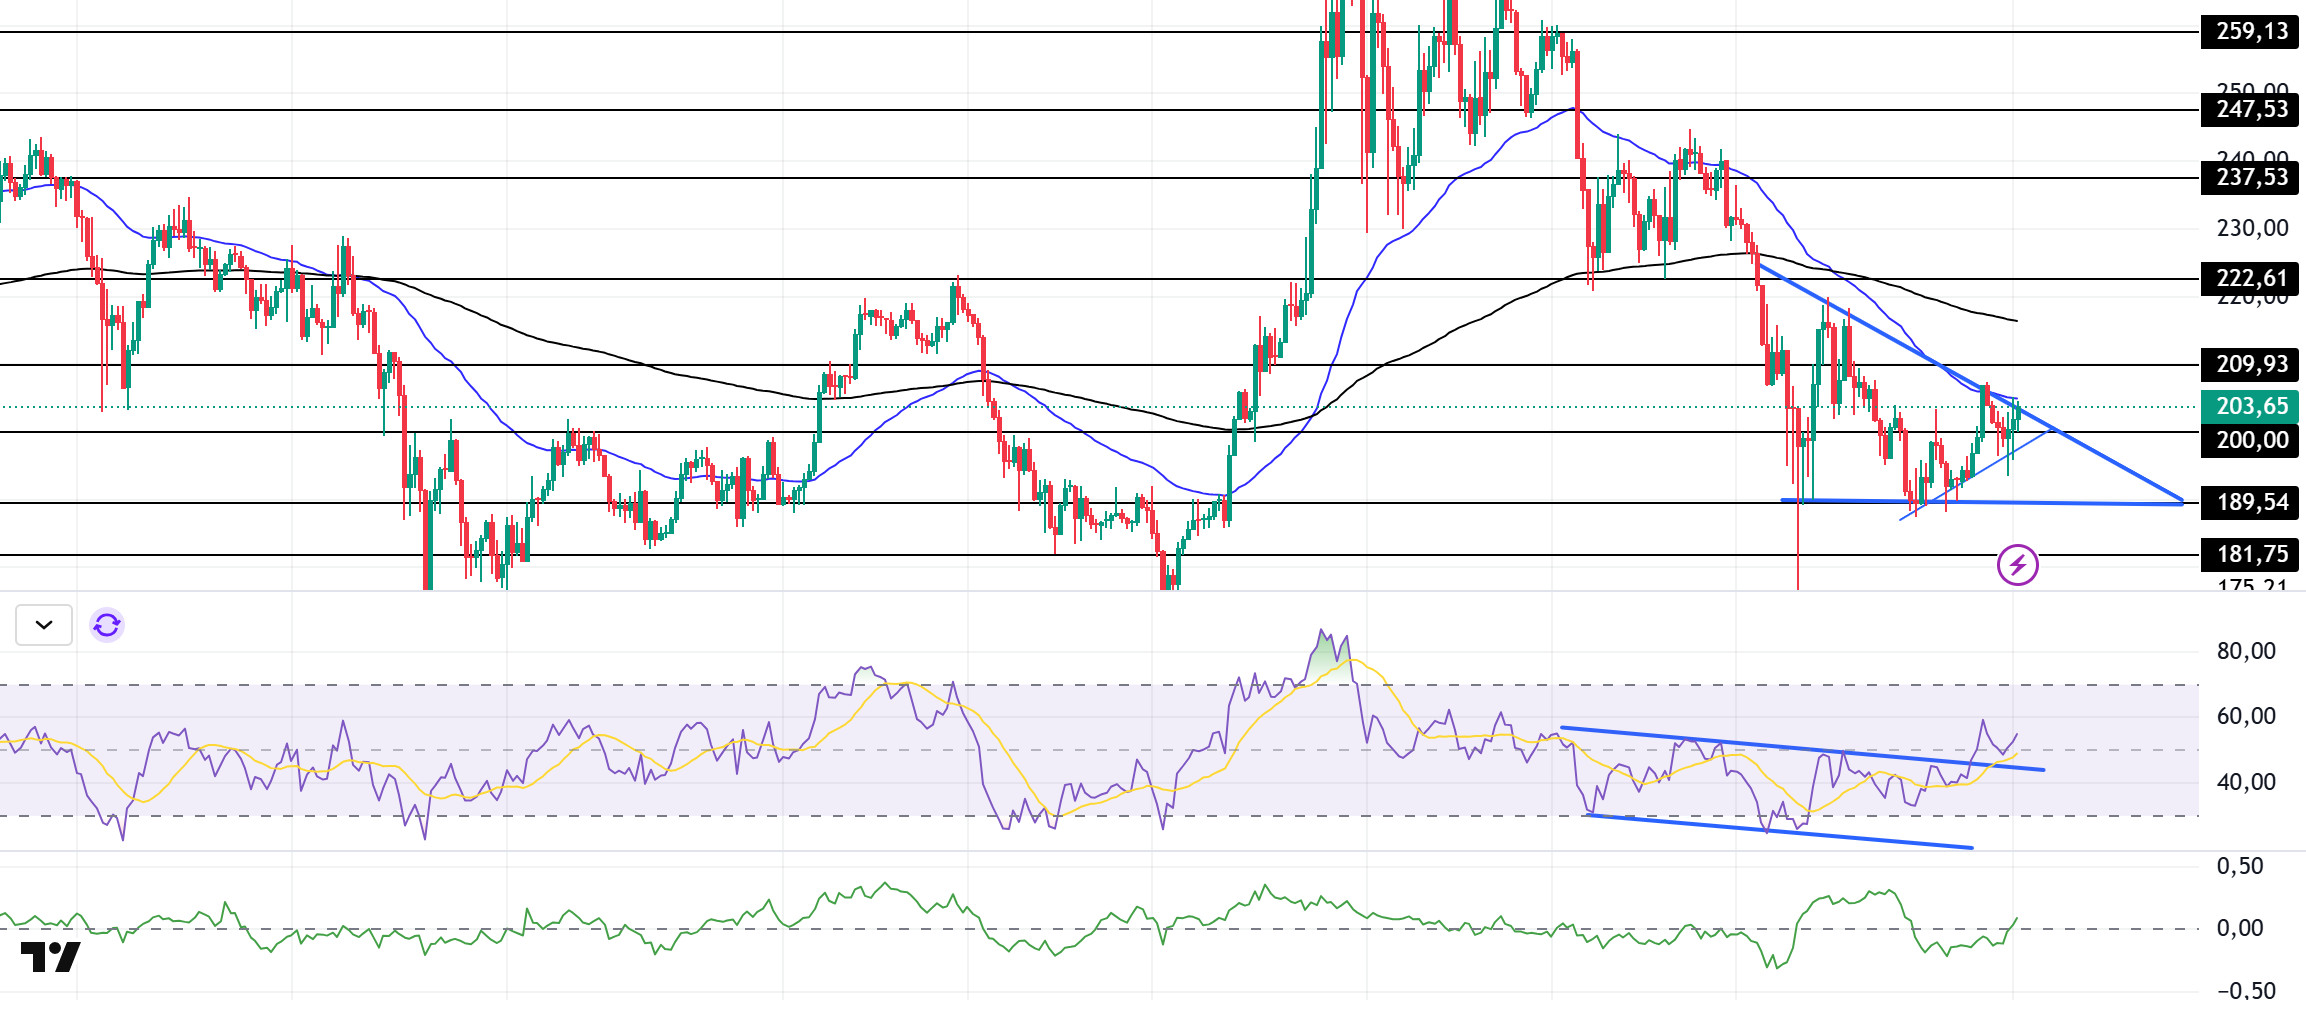
SOL has turned the downtrend slightly sideways by moving sideways. On the 4-hour timeframe, the 50 EMA (Blue Line) continues to be below the 200 EMA (Black Line). This could deepen the decline in the medium term. At the same time, the asset is priced below the 50 EMA and 200 EMA. On February 6, the uptrend that started to form continues. At the same time, the asset is testing the 50 EMA as resistance. When we examine the Chaikin Money Flow (CMF)20 indicator, it has moved into the positive zone and money inflows have started to increase. However, the Relative Strength Index (RSI)14 indicator is at the lower level of the positive zone and the price has broken the ceiling of the downtrend that started on the RSI on January 19. This could initiate a bullish breakout. Also, the descending triangle pattern should be monitored. The $237.53 level stands out as a very strong resistance point in the rises driven by both the upcoming macroeconomic data and the news in the Solana ecosystem. If it breaks here, the rise may continue. In case of retracements for the opposite reasons or due to profit sales, the support level of $ 181.75 can be triggered again. If the price comes to these support levels, a potential bullish opportunity may arise if momentum increases.
Supports 200.00 – 189.54 – 181.75
Resistances 209.93 – 222.61 – 237.53
DOGE/USDT
Brian Armstrong, CEO of a US-based exchange, called for blockchain-based transparency at the US Treasury after DOGE revealed a $100 billion spending gap. In Onchain, whales have accumulated another 100 million DOGE in the last 24 hours. Dogecoin funding rate was 0.0062. Open interest is seen as 2.21 billion dollars. When we look at the liquidation map, it shows us that a rise above $ 0.2760 could trigger the liquidation of over $ 94 million in short positions.
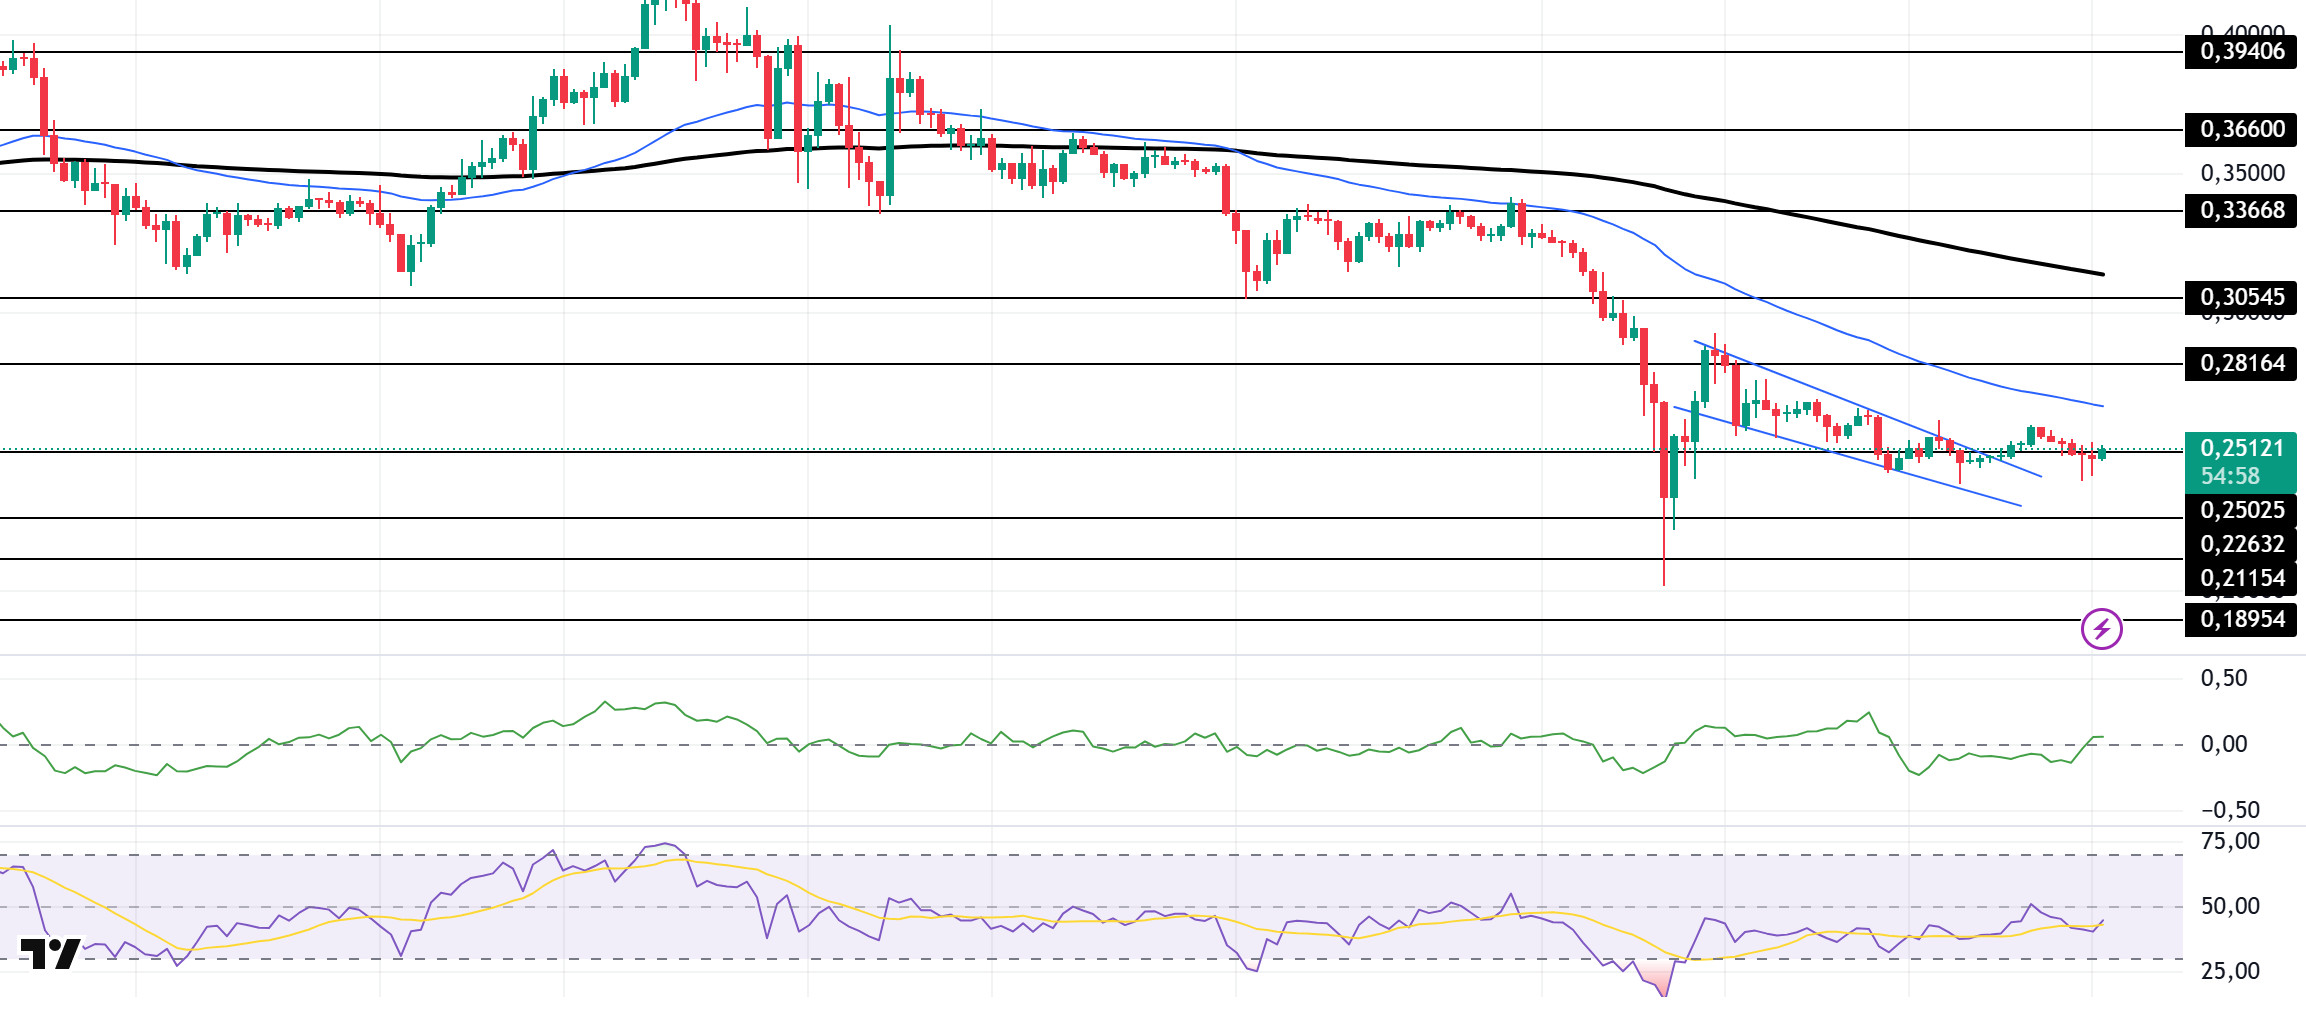
DOGE continued its sideways movement and moved in a narrow range. On the 4-hour timeframe, the 50 EMA (Blue Line) remained below the 200 EMA (Black Line). This could mean that the decline could deepen further in the medium term. At the same time, the price is below the 50 EMA (Blue Line) and the 200 EMA (Black Line). However, the large gap between the two moving averages may increase the probability of the DOGE rising. The descending wedge pattern is broken by horizontal movements. This may bring bullishness. When we analyze the Chaikin Money Flow (CMF)20 indicator, it is in the neutral zone and money inflows and outflows are balanced. At the same time, Relative Strength Index (RSI)14 is at the middle level of the negative zone. The $0.33668 level stands out as a very strong resistance point in the rises due to political reasons, macroeconomic data and innovations in the DOGE coin. In case of possible pullbacks due to political, macroeconomic reasons or negativities in the ecosystem, the $0.22632 level, which is the base level of the trend, is an important support. If the price reaches these support levels, a potential bullish opportunity may arise if momentum increases.
Supports 0.22632 – 0.21154 – 0.18954
Resistances 0.25025 – 0.28164 – 0.30545
LEGAL NOTICE
The investment information, comments and recommendations contained herein do not constitute investment advice. Investment advisory services are provided individually by authorized institutions taking into account the risk and return preferences of individuals. The comments and recommendations contained herein are of a general nature. These recommendations may not be suitable for your financial situation and risk and return preferences. Therefore, making an investment decision based solely on the information contained herein may not produce results in line with your expectations.

