
MARKET SUMMARY
Latest Situation in Crypto Assets
| Assets | Last Price | 24h Change | Dominance | Market Cap. |
|---|---|---|---|---|
| BTC | 97,510.35 | 1.35% | 60.70% | 1,93 T |
| ETH | 2,648.62 | 0.30% | 10.02% | 318,89 B |
| XRP | 2.420 | 0.34% | 4.39% | 139,82 B |
| SOLANA | 204.15 | 2.46% | 3.13% | 99,63 B |
| DOGE | 0.2502 | -0.81% | 1.16% | 37,05 B |
| CARDANO | 0.6979 | 1.25% | 0.77% | 24,57 B |
| TRX | 0.2365 | 0.40% | 0.64% | 20,37 B |
| LINK | 18.62 | 1.54% | 0.37% | 11,89 B |
| AVAX | 25.50 | 2.86% | 0.33% | 10,50 B |
| SHIB | 0.00001580 | -0.62% | 0.29% | 9,33 B |
| DOT | 4.803 | 0.89% | 0.23% | 7,44 B |
*Prepared on 2.11.2025 at 07:00 (UTC)
WHAT’S LEFT BEHIND
US to Impose 25% Tariff on Steel and Aluminum Imports
US President Donald Trump signed an executive order imposing a 25% tariff on all steel and aluminum imports into the US. Trump stated that this regulation does not include any exceptions or exemptions. This decision indicates that exemptions previously granted to certain countries have been removed.
SEC Accepts Physical Redemption Application for 21Shares Bitcoin and Ethereum Spot ETFs
The US Securities and Exchange Commission (SEC) accepted 21Shares’ application to allow the physical redemption of Bitcoin and Ethereum spot ETFs. This development is considered an important step in the crypto ETF market.
NYSE Arca Files Cardano (ADA) Spot ETF Application on Behalf of Grayscale
NYSE Arca filed a 19b-4 application with the SEC for a Cardano (ADA) spot ETF on behalf of Grayscale. This application will be the first ADA-based ETF in the market. Coinbase Custody Trust Company will provide custody services for the ETF, while BNY Mellon will provide asset management.
Nasdaq Submits CoinShares’ LTC and XRP ETF Applications
Nasdaq has filed CoinShares’ Litecoin (LTC) and XRP spot ETF applications with the SEC. The 19b-4 filings are an important step necessary to initiate the listing process for these financial products.
HIGHLIGHTS OF THE DAY
Important Economic Calender Data
| Time | News | Expectation | Previous |
|---|---|---|---|
| io.net (IO): 3.22 Million Token Unlock | |||
| Tezos (XTZ): Paris Meetup Event | |||
| Axie Infinity (AXS): 815.63K Token Unlock | |||
| Conflux (CFX): Conflux Network Vote | |||
| Aethir (ATH): 630 Million Token Unlock | |||
| 13:50 | FOMC Member Hammack Speaks | ||
| 15:00 | FED Chair Powell Testifies | ||
| 20:30 | FOMC Member Williams Speaks | ||
| 20:30 | FOMC Member Bowman Speaks |
INFORMATION
*The calendar is based on UTC (Coordinated Universal Time) time zone.
The economic calendar content on the relevant page is obtained from reliable news and data providers. The news in the economic calendar content, the date and time of the announcement of the news, possible changes in the previous, expectations and announced figures are made by the data provider institutions. Darkex cannot be held responsible for possible changes that may arise from similar situations.
MARKET COMPASS
As before, President Trump’s unpredictable stance continues to be on the agenda of the markets with tariff tensions. Most recently, Trump signed two executive orders imposing tariffs on US steel and aluminum imports from all countries without exception. However, as we mentioned in our previous analysis, investors’ sensitivity to the issue seems to be waning. Still, the dollar appreciated while indices in Asia-Pacific, where Japan is on holiday, seem to have been affected by the negative news flow on tariffs. Europe and Wall Street futures indices are slightly negative. On the digital assets side, the direction seems to have diverged positively with the effect of the SEC’s steps. Today, US Federal Reserve Chairman (FED) Powell’s evaluations may be important for price changes.
Powell’s Defenses
FED Chair Powell will make two defenses this week. The first one will be today in Washington DC before the Senate Banking Committee on the Semiannual Monetary Policy Report. The other will be tomorrow to the House of Representatives Financial Services Committee and as usual, the text of the speech will remain unchanged.
Markets will be looking for clues from the Fed’s top official about the timing and path of the Bank’s rate cuts in 2025. The Chairman’s test against questions from members of the relevant Committees about the tight labor market and the recent rise in inflation will be as important as it is twice a year.
We do not expect Powell to provide any major new information on the rate cut path, but he may feel the need to update his rhetoric in the wake of recent macro indicators. Accordingly, if the chairman hints at a relatively faster or earlier-than-priced rate cut (25 basis points in June, according to CME FedWatch), there could be an opportunity for a rally in digital assets. In the opposite scenario, cryptocurrencies could come under pressure. Our expectation is that we will not see a major change of stance, as we have underlined before, but the surprise could be a stronger speech that there will be no rush to cut rates.
From the short term to the big picture.
Trump’s victory on November 5, one of the main pillars of our bullish expectation for the long-term outlook in digital assets, produced a result in line with our predictions. In the aftermath, the appointments made by the president-elect and the increasing regulatory expectations for the crypto ecosystem in the US, as well as the emergence of BTC as a reserve, continued to take place in our equation as positive variables. Then, 4 days after the new President took over the White House, he signed the “Cryptocurrency Working Unit” decree, which was among his election promises, and we think that the positive reflection of the outputs it will produce in the coming days on digital assets may continue.
On the other hand, the expectations that the FED will continue its interest rate cut cycle, albeit on hiatus for now, and the fact that the volume in crypto-asset ETFs indicates an increase in institutional investor interest, support our upside forecast for the big picture. In the short term, given the nature of the market and pricing behavior, we think it would not be surprising to see occasional pause or pullbacks in digital assets. However, at this point, it is worth underlining again that we think the fundamental dynamics continue to be bullish.
TECHNICAL ANALYSIS
BTC/USD
Details about the tariffs that shook the crypto markets are starting to come. US President Donald Trump imposed a 25% tariff on steel and aluminum imports, removing previous exemptions and putting pressure on global trade balances. On the crypto side, the SEC marked an important milestone in the market by accepting 21Shares’ physical redemption application for Bitcoin and Ethereum spot ETFs. Today, eyes will be on the statements to be made by US President Powell, and we can say that volatility may increase in the market.
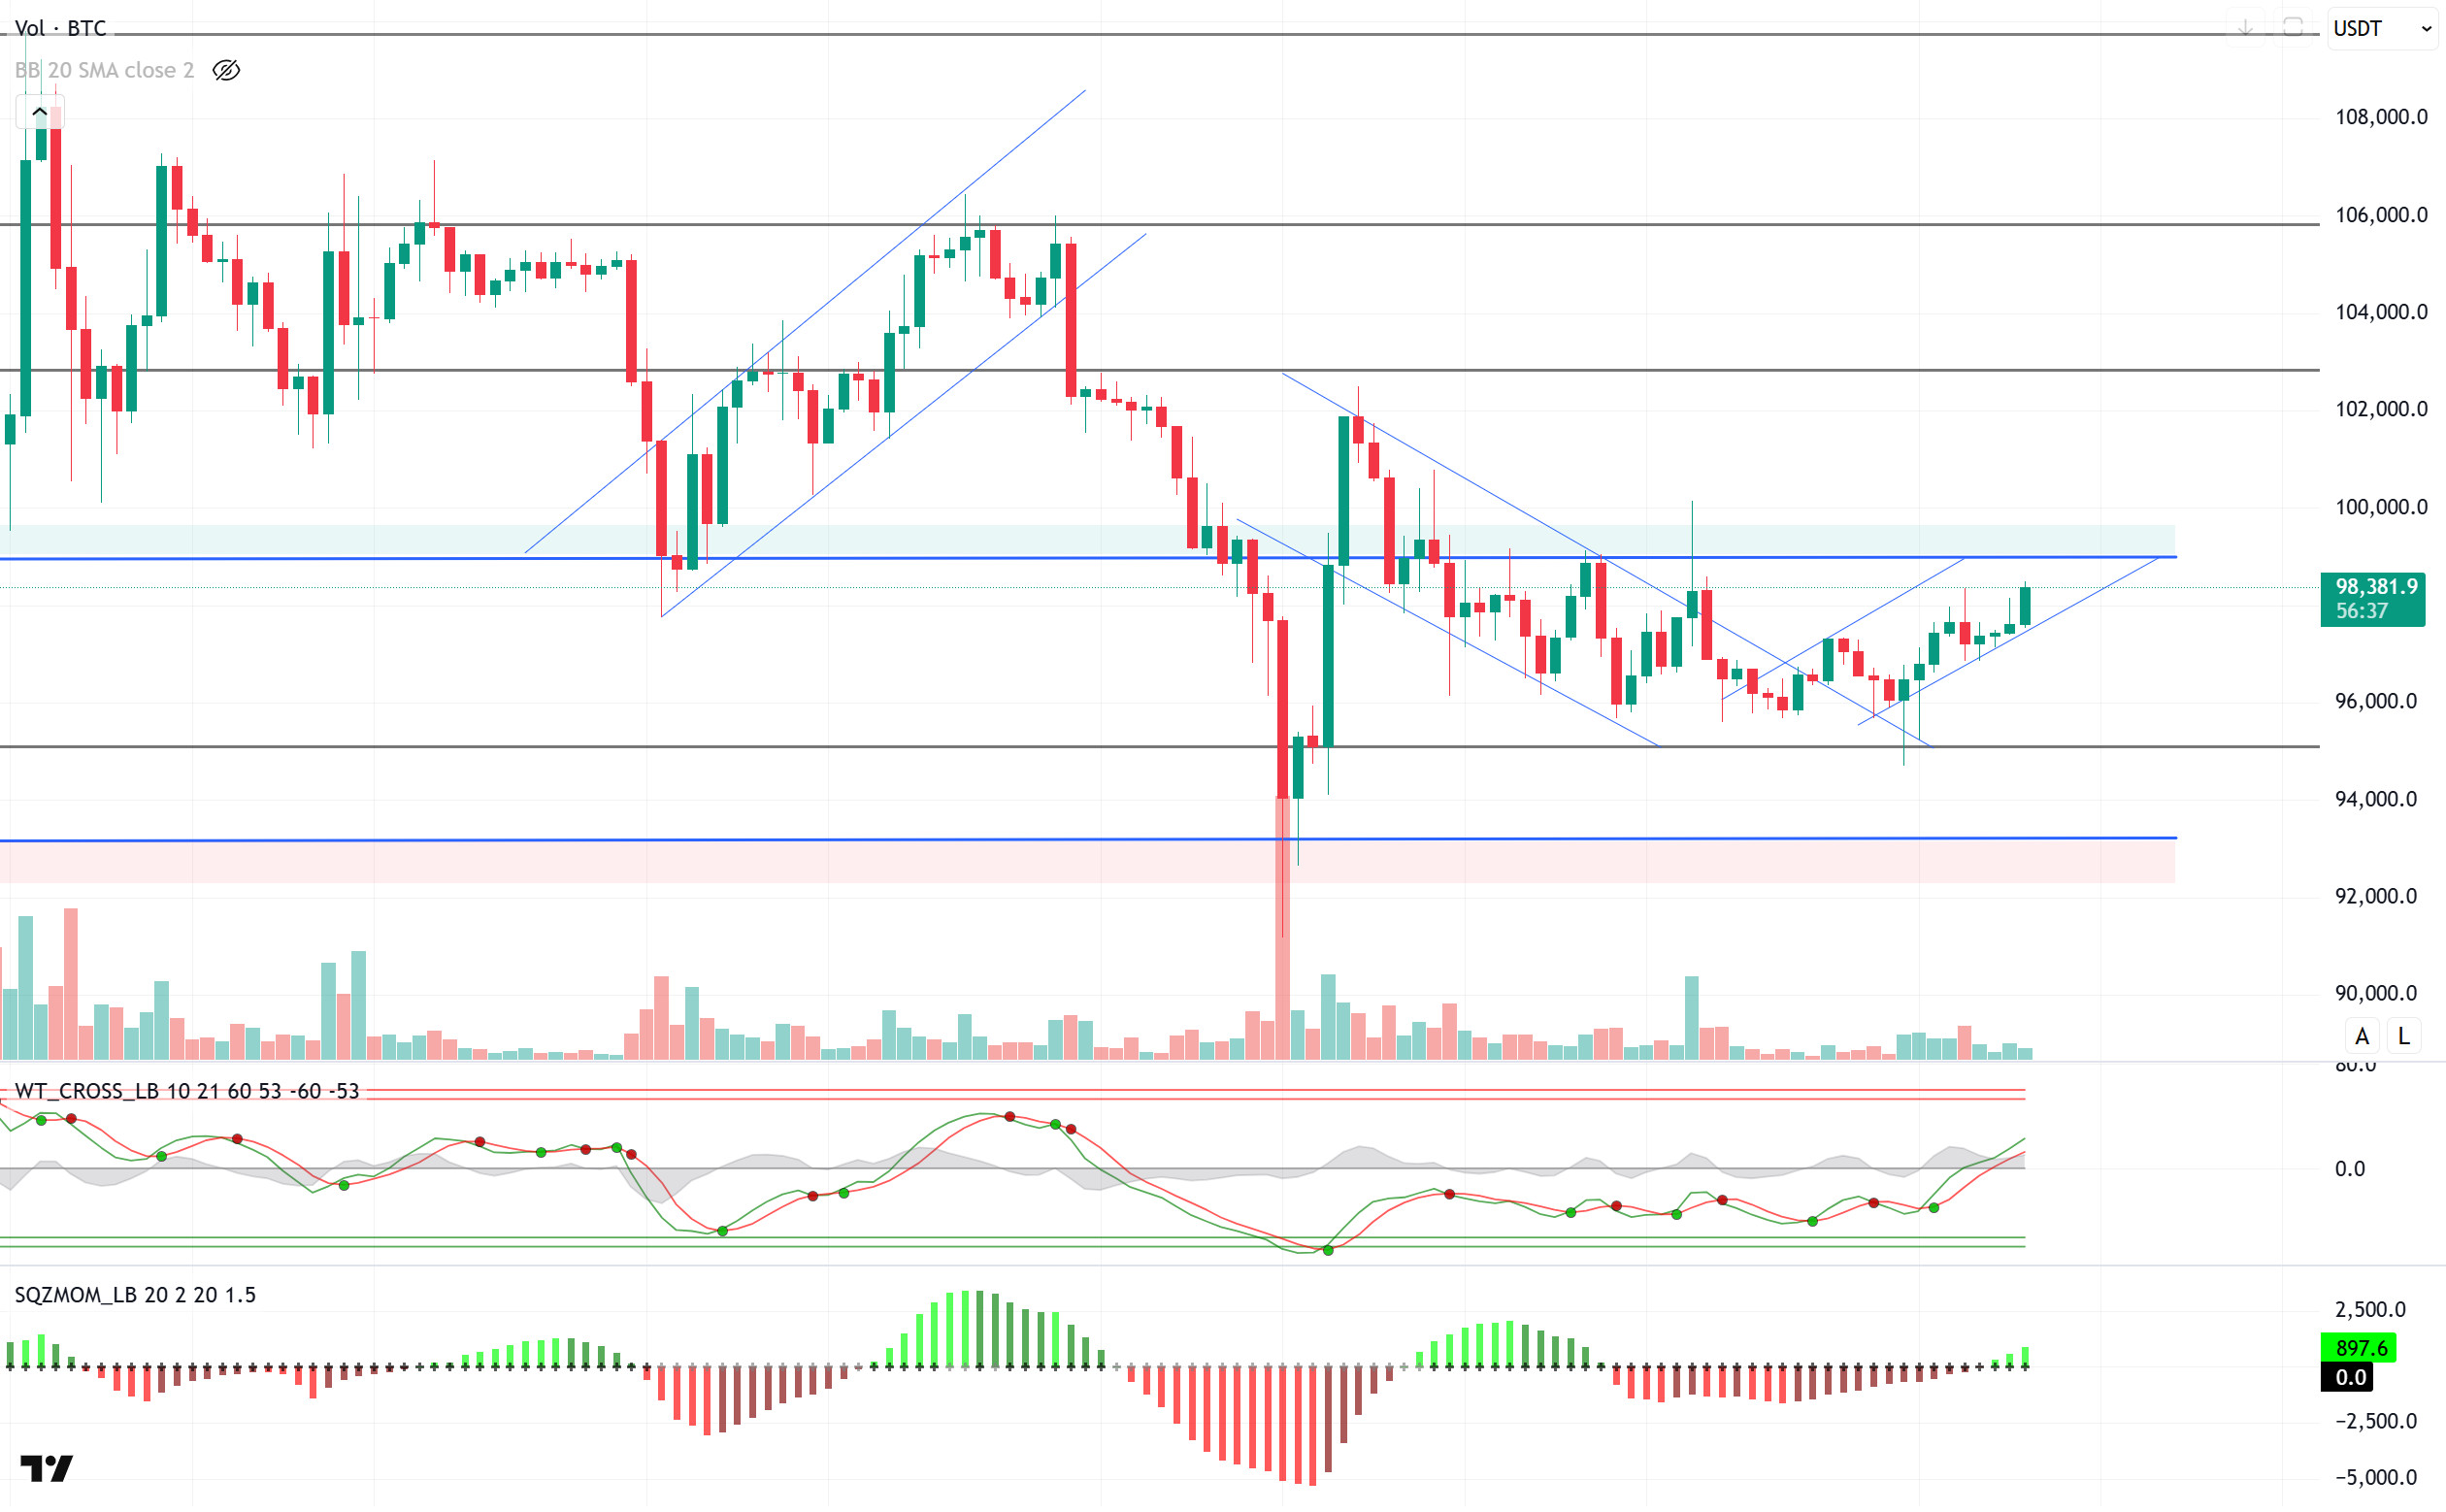
Looking at the technical outlook, BTC first exhibited a sideways movement after breaking the downtrend structure and then attempted to start a new uptrend. Currently trading at 98,400, technical oscillators and moving averages continue to maintain their buy signals. Momentum indicators are trying to regain strength. If the bullish movement continues, the resistance point at 99.100 will be followed as a critical threshold. Closes above this level may support the price to head towards six-digit levels again. On the other hand, in a possible pullback scenario, the 97,000 level will be monitored as an important support point.
Supports 97,000 – 95,000 – 92,800
Resistances 99,100 -101,400 – 102,800
ETH/USDT
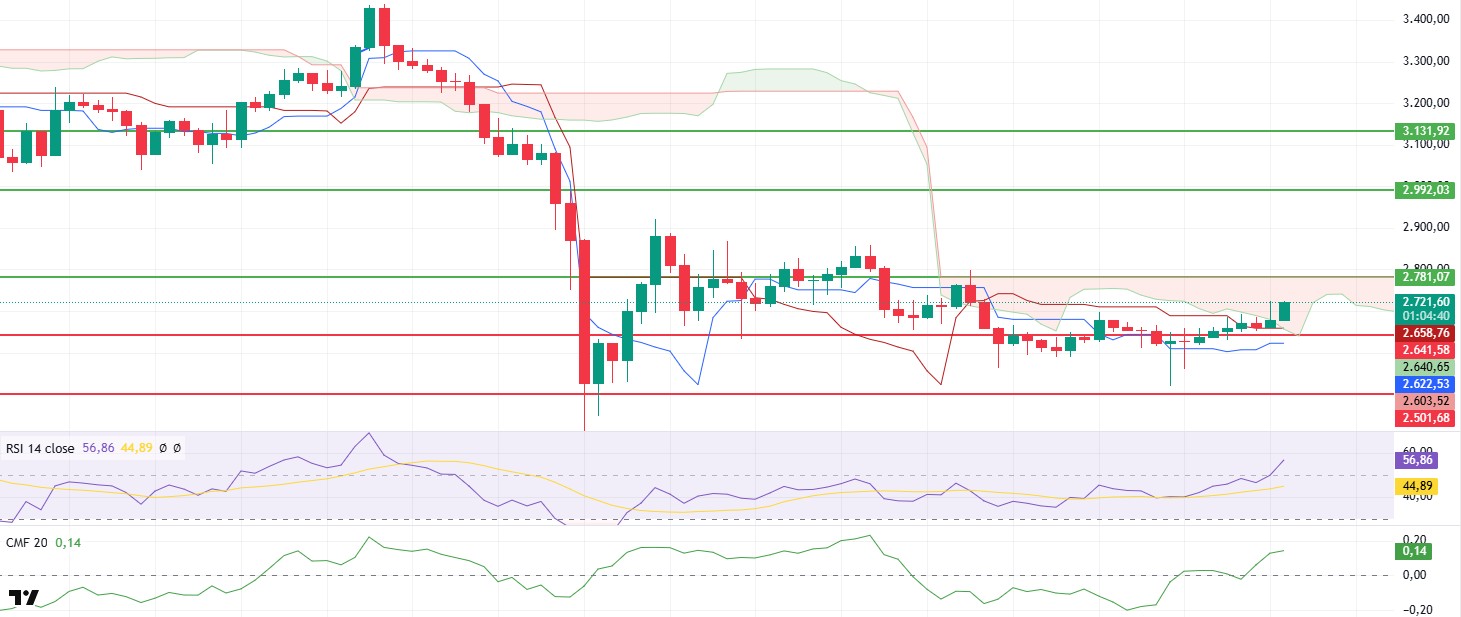
ETH managed to rise slightly overnight, rising above the $2,700 level. With this move, ETH, which entered the Ichimoku cloud, started to display a more positive outlook in terms of technical indicators.
In particular, the upward movement of the Relative Strength Index (RSI) indicator indicates that momentum is strengthening. However, in a scenario where the price stays below the $2.881 level, the possibility of a negative divergence may arise. Therefore, in order for ETH to maintain its current technical outlook and sustain its upward momentum, it is critical for ETH to break through the $2,781 resistance and then break the $2,881 level. The Chaikin Money Flow (CMF) indicator, on the other hand, continues to support the price increase, showing an upward acceleration without any negative divergence, indicating that buyers remain strong in the market and the upward trend is supported. On the Ichimoku indicator, the convergence of the tenkan and kijun lines contributes to the positive outlook in the market, supporting the bullish scenario.
In light of these technical indicators, the price is likely to reach the $2,781 level during the day. If this resistance level can be broken with a strong volume, there may be a rapid rise that could last up to the $2,991 level. On the other hand, the $2,641 level is in the intermediate support position in possible pullbacks. If this level is broken to the downside, the risk of ETH retracing to the $2,501 level may increase.
Supports 2,641 – 2,501 – 2,368
Resistances 2,781 – 2,881 – 2,992
XRP/USDT
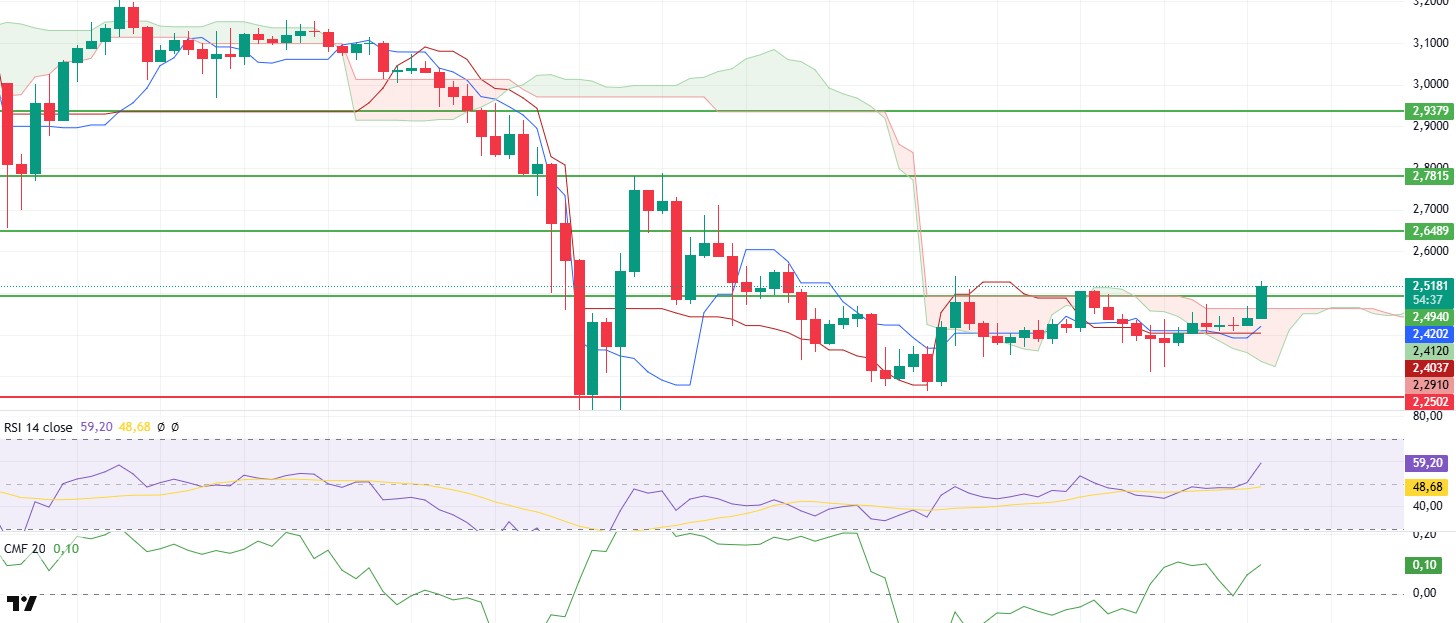
XRP managed to break through the critically important $2.49 resistance level with its upside move in the morning hours. Following this move, the price also moved above the Ichimoku cloud, strengthening its positive technical outlook.
When the Ichimoku indicator is analyzed, XRP’s rise above the tenkan, kijun and kumo cloud upper resistance levels indicates that the uptrend is consolidating. In addition, the fact that the tenkan level cuts the kijun level upwards can be considered as a strong buy signal and indicates that the trend may continue. Technical indicators also support this bullish trend. Chaikin Money Flow (CMF) and Relative Strength Index (RSI) indicators continue their uptrend in line with the price action, indicating that market momentum and liquidity inflows are increasing. The RSI in particular continues to rise, indicating that buyers dominate the market and the current trend remains strong.
In line with the current technical data, if XRP maintains the $2.49 level, it is likely to rise to $2.64 in the short term. If this level is exceeded in volume, it may be possible for XRP to enter a strong uptrend and the price to move higher. However, if the $2.49 support is lost, the market is likely to see slight pullbacks again.
Supports 2.4940 – 2.2502 – 2.0201
Resistances 2.6489 – 2.7815 – 2.9379
SOL/USDT
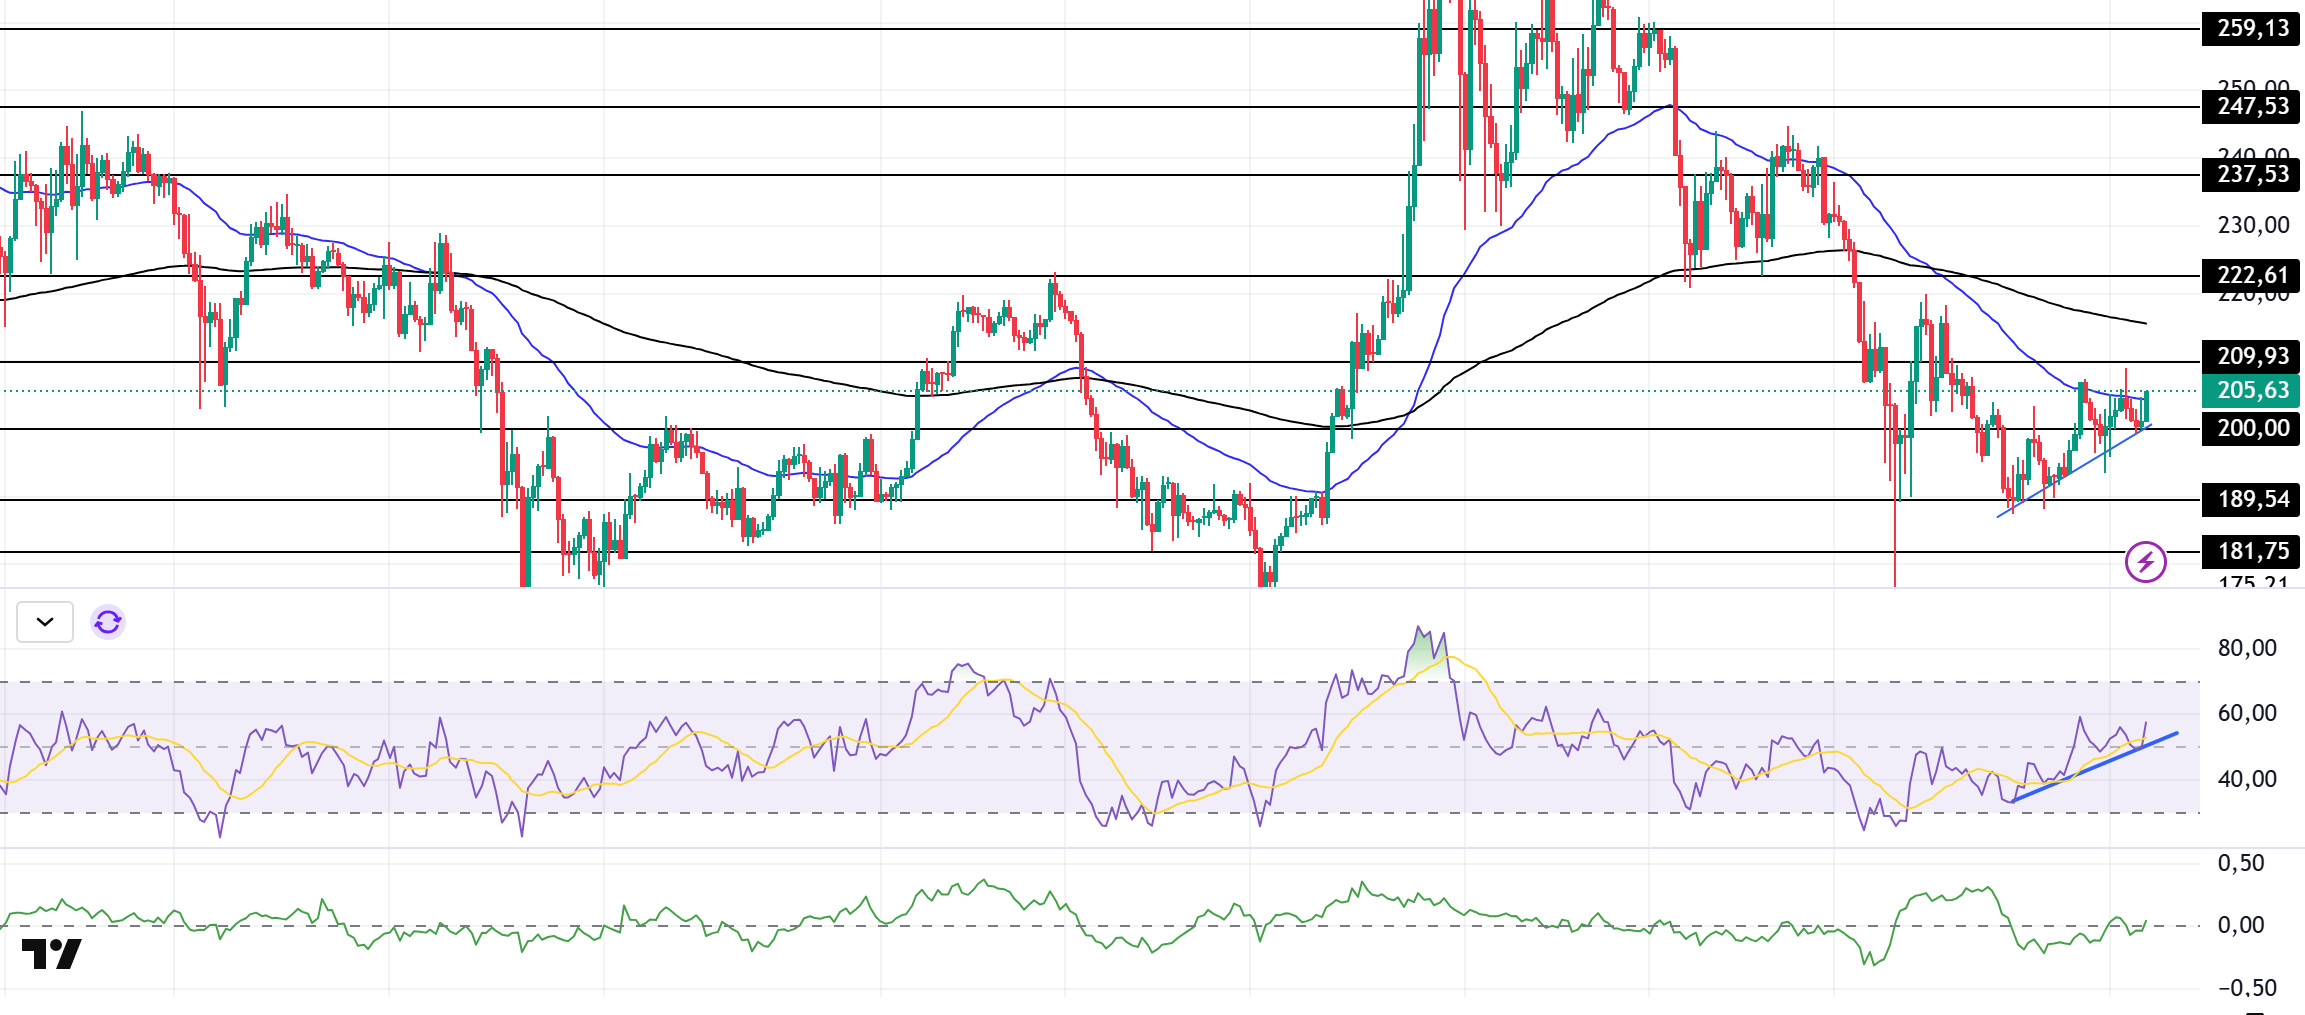
SOL has been slightly bullish since our analysis yesterday. On the 4-hour timeframe, the 50 EMA (Blue Line) continues to be below the 200 EMA (Black Line). This could deepen the decline in the medium term. At the same time, the asset is priced below the 50 EMA and 200 EMA. On February 6, the uptrend that started to form continues. At the same time, the asset is testing the 50 EMA as resistance. When we analyze the Chaikin Money Flow (CMF)20 indicator, it is in the neutral zone. However, the Relative Strength Index (RSI)14 indicator is at the mid-level of the positive zone and the price has gained momentum from the support level of the uptrend that started on February 6. This may accelerate the uptrend. The $237.53 level stands out as a very strong resistance point in the rises driven by both the upcoming macroeconomic data and the news in the Solana ecosystem. If it breaks here, the rise may continue. In case of retracements for the opposite reasons or due to profit sales, the support level of $ 181.75 can be triggered again. If the price comes to these support levels, a potential bullish opportunity may arise if momentum increases.
Supports 200.00 – 189.54 – 181.75
Resistances 209.93 – 222.61 – 237.53
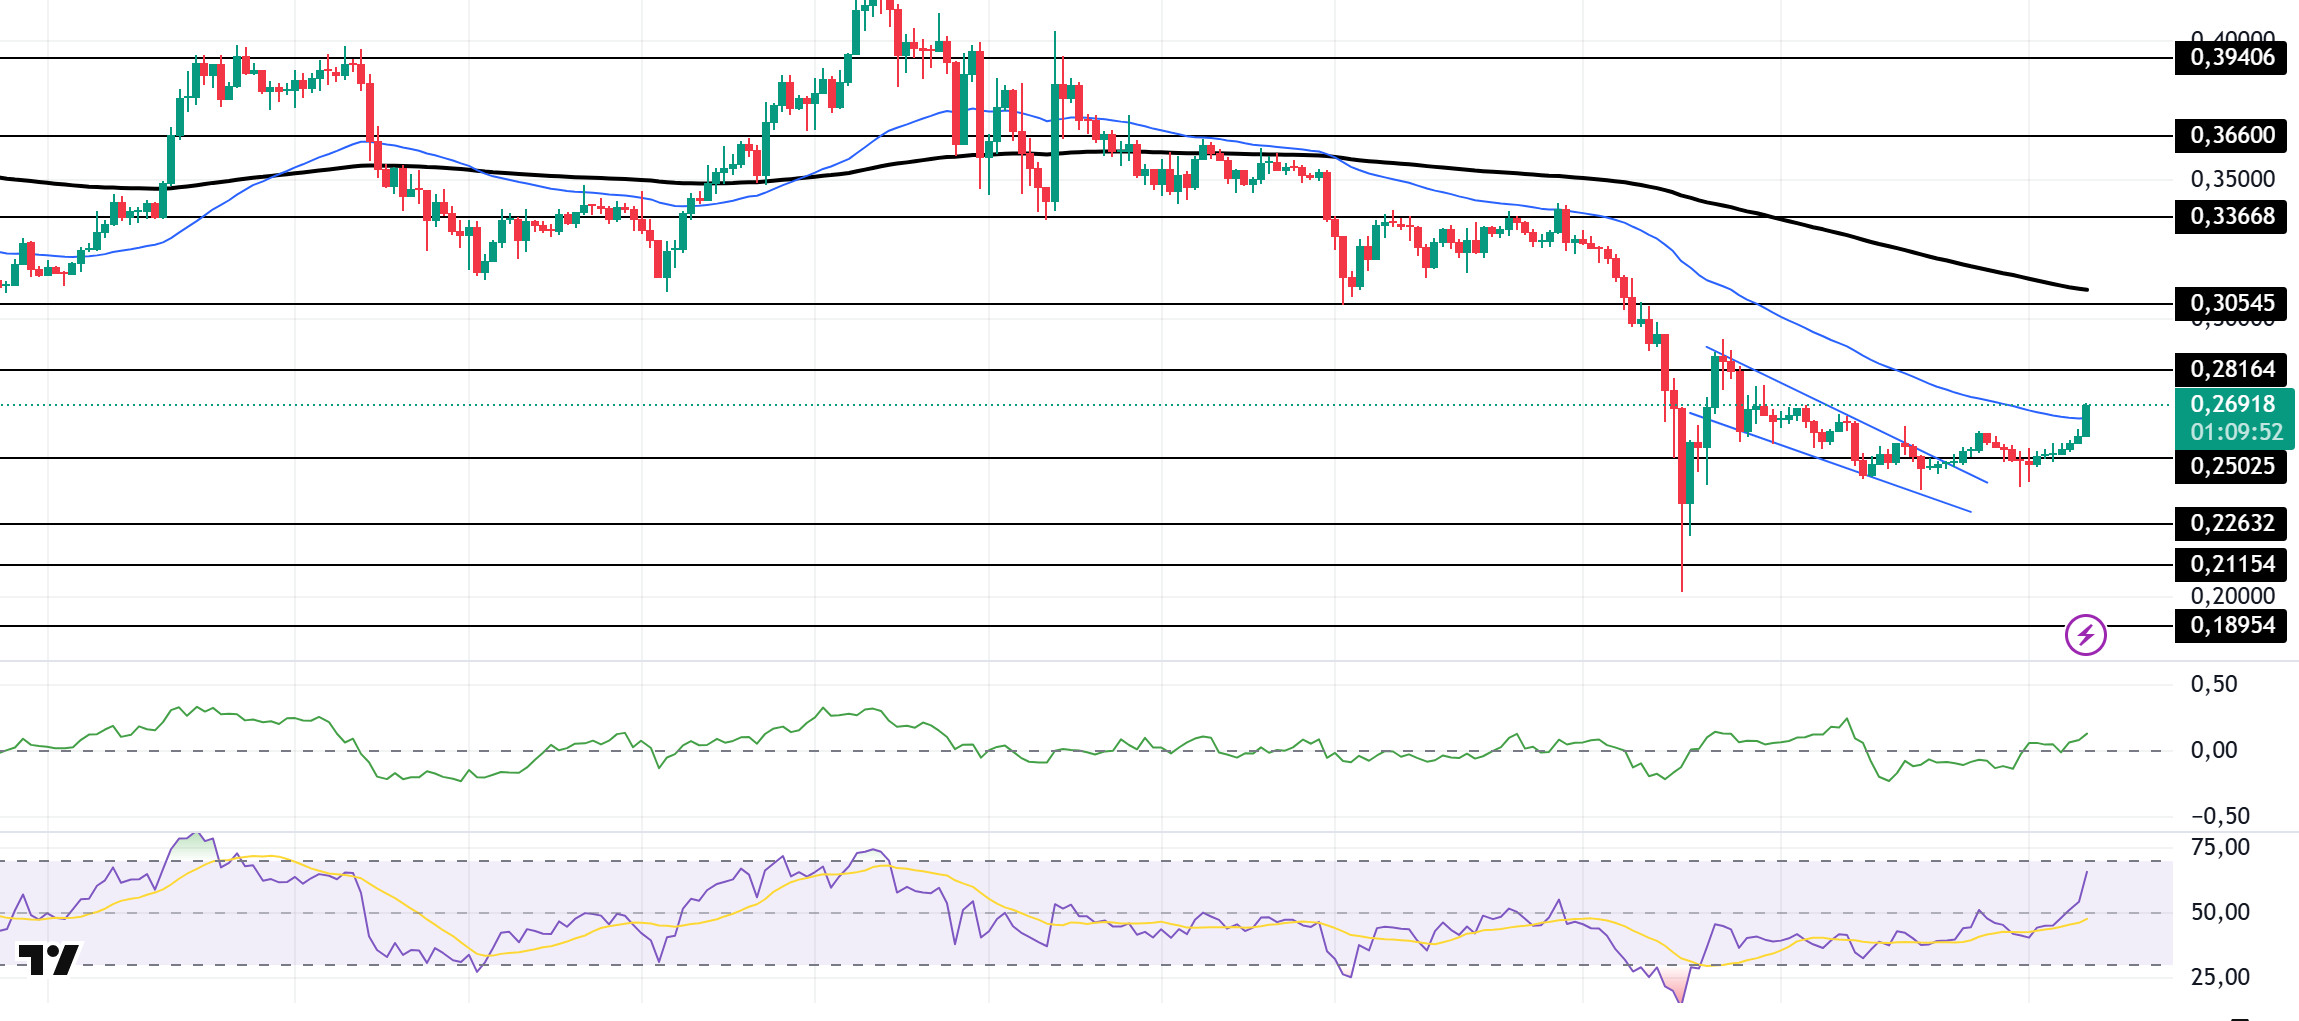
DOGE/USDT
DOGE has been on the rise since our analysis yesterday as inflows have increased. On the 4-hour timeframe, the 50 EMA (Blue Line) remained below the 200 EMA (Black Line). This could mean that the decline could deepen further in the medium term. At the same time, the price is below the 50 EMA (Blue Line) and the 200 EMA (Black Line). However, the large gap between the two moving averages may increase the probability of the DOGE rising. It is also testing the 50 EMA as of the time of writing. The descending wedge pattern is broken by horizontal movements. These may bring bullishness. When we examine the Chaikin Money Flow (CMF)20 indicator, it is in positive territory and money inflows have increased. At the same time, Relative Strength Index (RSI)14 is close to the overbought level of the positive zone. The level of 0.33668 dollars appears as a very strong resistance place in the rises due to political reasons, macroeconomic data and innovations in the DOGE coin. In case of possible pullbacks due to political, macroeconomic reasons or negativities in the ecosystem, the base level of the trend, the $ 0.22632 level, is an important support. If the price reaches these support levels, a potential bullish opportunity may arise if momentum increases.
Supports 0.25025 – 0.22632 – 0.21154
Resistances 0.28164 – 0.30545 – 0.33668
LEGAL NOTICE
The investment information, comments and recommendations contained herein do not constitute investment advice. Investment advisory services are provided individually by authorized institutions taking into account the risk and return preferences of individuals. The comments and recommendations contained herein are of a general nature. These recommendations may not be suitable for your financial situation and risk and return preferences. Therefore, making an investment decision based solely on the information contained herein may not produce results in line with your expectations.
