
MARKET SUMMARY
Latest Situation in Crypto Assets
| Assets | Last Price | 24h Change | Dominance | Market Cap. |
|---|---|---|---|---|
| BTC | 95,838.85$ | -2.65% | 60.50% | 1,90 T |
| ETH | 2,601.76$ | -4.41% | 9.98% | 313,76 B |
| XRP | 2.399$ | -4.95% | 4.41% | 138,57 B |
| SOLANA | 193.81$ | -5.85% | 3.01% | 94,62 B |
| DOGE | 0.2522$ | -6.23% | 1.19% | 37,34 B |
| CARDANO | 0.7592$ | -4.83% | 0.85% | 26,73 B |
| TRX | 0.2381$ | -3.04% | 0.65% | 20,51 B |
| LINK | 18.48$ | -6.45% | 0.38% | 11,81 B |
| AVAX | 24.96$ | -6.68% | 0.33% | 10,29 B |
| SHIB | 0.00001556$ | -5.13% | 0.29% | 9,17 B |
| DOT | 4.800$ | -7.64% | 0.24% | 7,43 B |
*Prepared on 2.12.2025 at 07:00 (UTC)
WHAT’S LEFT BEHIND
Highlights of Jerome Powell’s Statements
Call for a Re-Examination of the Crypto Industry’s Exclusion from Banking
- He expressed concern about the exclusion of the crypto sector from banking services.
- He emphasized that this situation should be reconsidered.
- He pledged to work with lawmakers to prevent regulations from creating excessive burdens.
He Said There Would Be No Hurry to Adjust Interest Rates
- He said there was no rush to change interest rates.
- He stated that the inflation target will remain unchanged at 2%.
- He said current policies can be maintained as long as the economy remains strong.
Support for a Regulatory Framework for Stablecoins
- He announced that he supports the creation of a regulatory framework around stablecoins.
- He stated that he will not introduce a central bank digital currency (CBDC) during his tenure.
Trump Family Crypto Project WLFI Partners with Ondo Finance
World Liberty Financial (WLFI), the Trump family’s crypto project, has formed a strategic partnership with Ondo Finance to promote the adoption of tokenized real-world assets. This collaboration aims to integrate tokenized assets such as USDY and OUSG into the WLFI network.
US and UK Refuse to Sign Ethical Artificial Intelligence Treaty
The US and the UK have refused to sign an international ethical AI agreement on the grounds that over-regulation of the AI sector could stifle innovation.
Tether Selects Arbitrum for On-Chain Stablecoin USDT0
Tether has selected Arbitrum as the infrastructure provider for its new cross-chain stablecoin USDT0. Arbitrum One will be the main hub for connecting USDT distributions on different blockchains to USDT0.
USDC Treasury Prints Over $88 Million in New USDC
The USDC Treasury has minted approximately 88.37 million USDC on the Ethereum network. This move further increases the circulating supply of USDC.
FTX/Alameda Distributes 184,000 SOLs to 23 Addresses
FTX/Alameda transferred approximately 184,000 SOL ($37.73 million) in the last 6 hours, distributing it to 23 different addresses. Most of these transfers went to major exchanges such as Coinbase and Binance. The company still has about $1.25 billion worth of SOL in its wallet.
HIGHLIGHTS OF THE DAY
Important Economic Calender Data
| Time | News | Expectation | Previous |
|---|---|---|---|
| – | Aptos (APT): AIP Community Review | – | – |
| – | Render (RENDER): Weekly AI Scout AMA | – | – |
| – | Holo (HOT): Livestream on Upcoming Delivery and Future | – | – |
| 13:30 | US Core CPI (MoM) (Jan) | 0.3% | 0.2% |
| 13:30 | US CPI (MoM) (Jan) | 0.3% | 0.4% |
| 13:30 | US CPI (YoY) (Jan) | 2.9% | 2.9% |
| 13:30 | US Core CPI (YoY) (Jan) | 3.1% | 3.2% |
| 15:00 | FED Chair Powell Testifies | – | – |
| 17:00 | FOMC Member Bostic | – | – |
| 22:05 | FOMC Member Waller Speaks | – | – |
INFORMATION
*The calendar is based on UTC (Coordinated Universal Time) time zone.
The economic calendar content on the relevant page is obtained from reliable news and data providers. The news in the economic calendar content, the date and time of the announcement of the news, possible changes in the previous, expectations and announced figures are made by the data provider institutions. Darkex cannot be held responsible for possible changes that may arise from similar situations.
MARKET COMPASS
Last night, the US Federal Reserve’s (FED) Powell’s messages in his presentation to the Senate were on the agenda of global markets. The chairman once again underlined his statements that they are in no hurry to cut interest rates. Treasuries rose and stocks fluctuated after Powell reiterated that the central bank is in no rush to cut rates. Bonds fell across the curve as money markets are still pricing in a Fed rate cut this year. The President will make another presentation for the House Financial Services Committee today, but the text of the speech is not expected to change. His answers to questions from members will again be under the scrutiny of investors.
In global markets, Powell’s statements and expectations regarding the FED and Trump’s unpredictable management style and the “tariffs” issue continue to be influential, while on the Asian front, the artificial intelligence theme stands out with a positive impact on indices. Europe (slightly positive) and Wall Street (slightly negative) indices are expected to start Wednesday flat. Digital assets were in the instrument group negatively affected by Powell’s interest rate message. Some recovery is observed after the losses. Today, we can say that inflation data from the US will be the main issue that may have an impact on the markets.
Eyes on Inflation After Employment Data
We received the first critical macro indicators of January on Friday with the US employment data. This week, the focus will shift to the Consumer Price Index (CPI) after Powell’s speech. In December, monthly CPI rose by 0.4% and core CPI by 0.2%, bringing annual headline inflation to 2.9% (November: 2.7%).
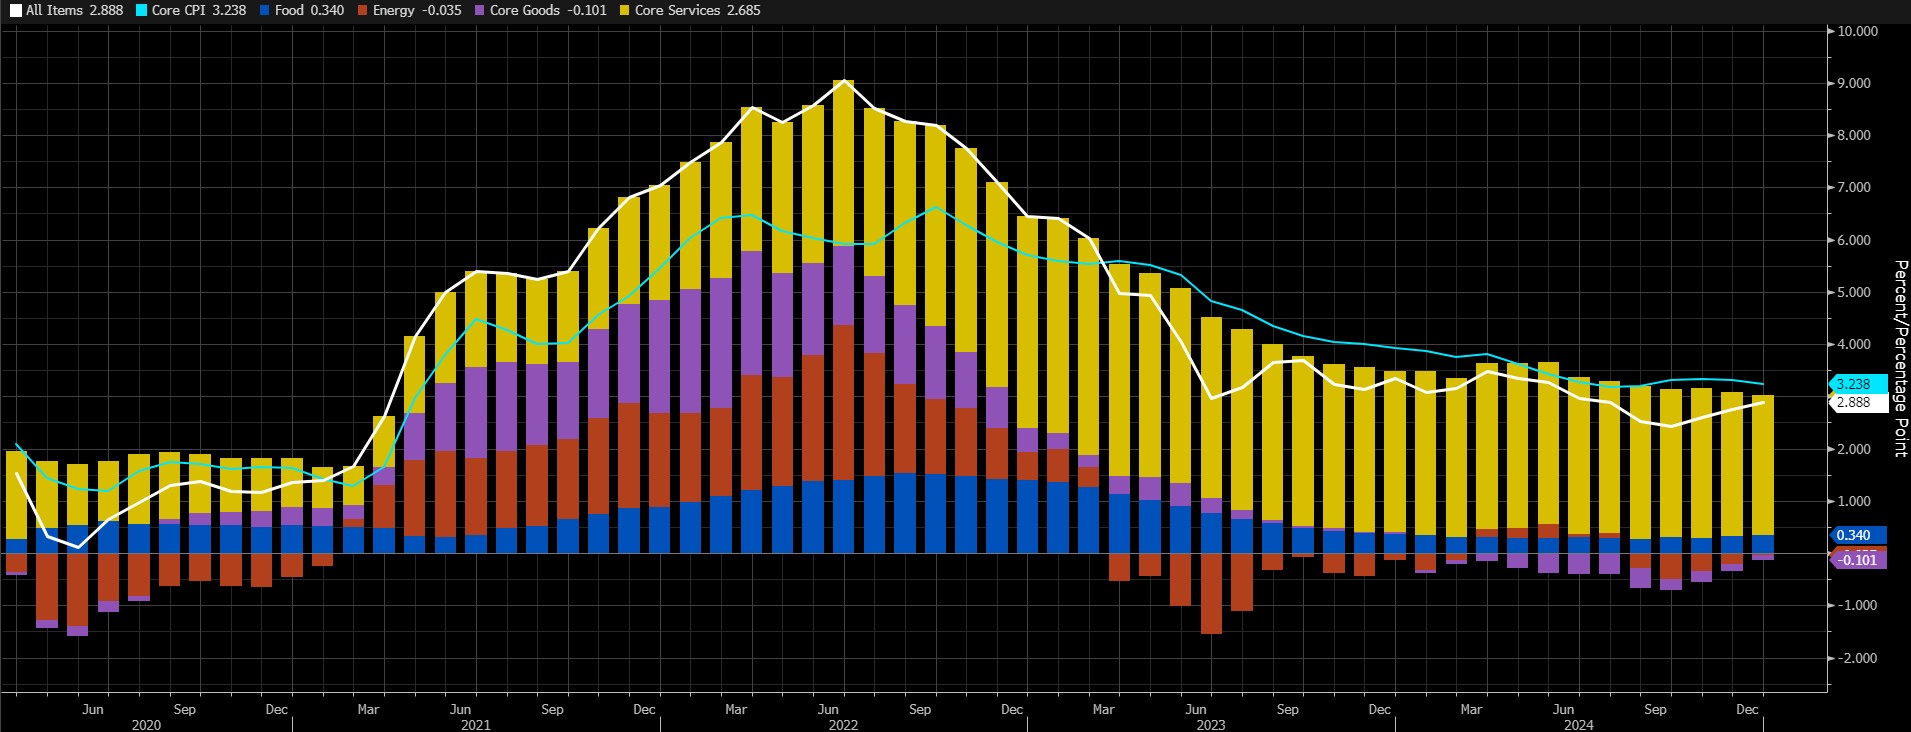
Source: Bloomberg
Inflation in the US is no longer falling as it was from June 2022 to early 2024. The change in the Consumer Price Index is more stable. This may also be due to the fact that the cycle in which the FED cut interest rates has come to an end. The importance of the inflation data lies in the fact that it may give clues about the timing and the extent to which the FED may cut interest rates in 2025.
A higher-than-expected CPI data set may strengthen expectations that the FED may extend the process of postponing interest rate cuts, leading to an appreciation of the dollar, a decrease in risk appetite and, consequently, a depreciation of cryptocurrencies. Also, if we see CPI data that is not as high as feared and below expectations, we can say that this will have the opposite effect. In such a scenario, digital assets could find a basis for a rally.
From the short term to the big picture…
Trump’s victory on November 5, one of the main pillars of our bullish expectation for the long-term outlook in digital assets, produced a result in line with our predictions. In the process that followed, the appointments made by the president-elect and the increasing regulatory expectations for the crypto ecosystem in the US, as well as the emergence of BTC as a reserve, continued to take place in our equation as positive variables. Then, 4 days after the new President took over the White House, he signed the “Cryptocurrency Working Unit” decree, which was among his election promises, and we think that the positive reflection of this output on digital assets may continue in the coming days.
On the other hand, the expectations that the FED will continue its interest rate cut cycle, albeit on hiatus for now, and the fact that the volume in crypto-asset ETFs indicates an increase in institutional investor interest, support our upside forecast for the big picture. In the short term, given the nature of the market and pricing behavior, we think it would not be surprising to see occasional pause or pullbacks in digital assets. However, at this point, it is worth underlining again that we think the fundamental dynamics continue to be bullish.
TECHNICAL ANALYSIS
BTC/USDT
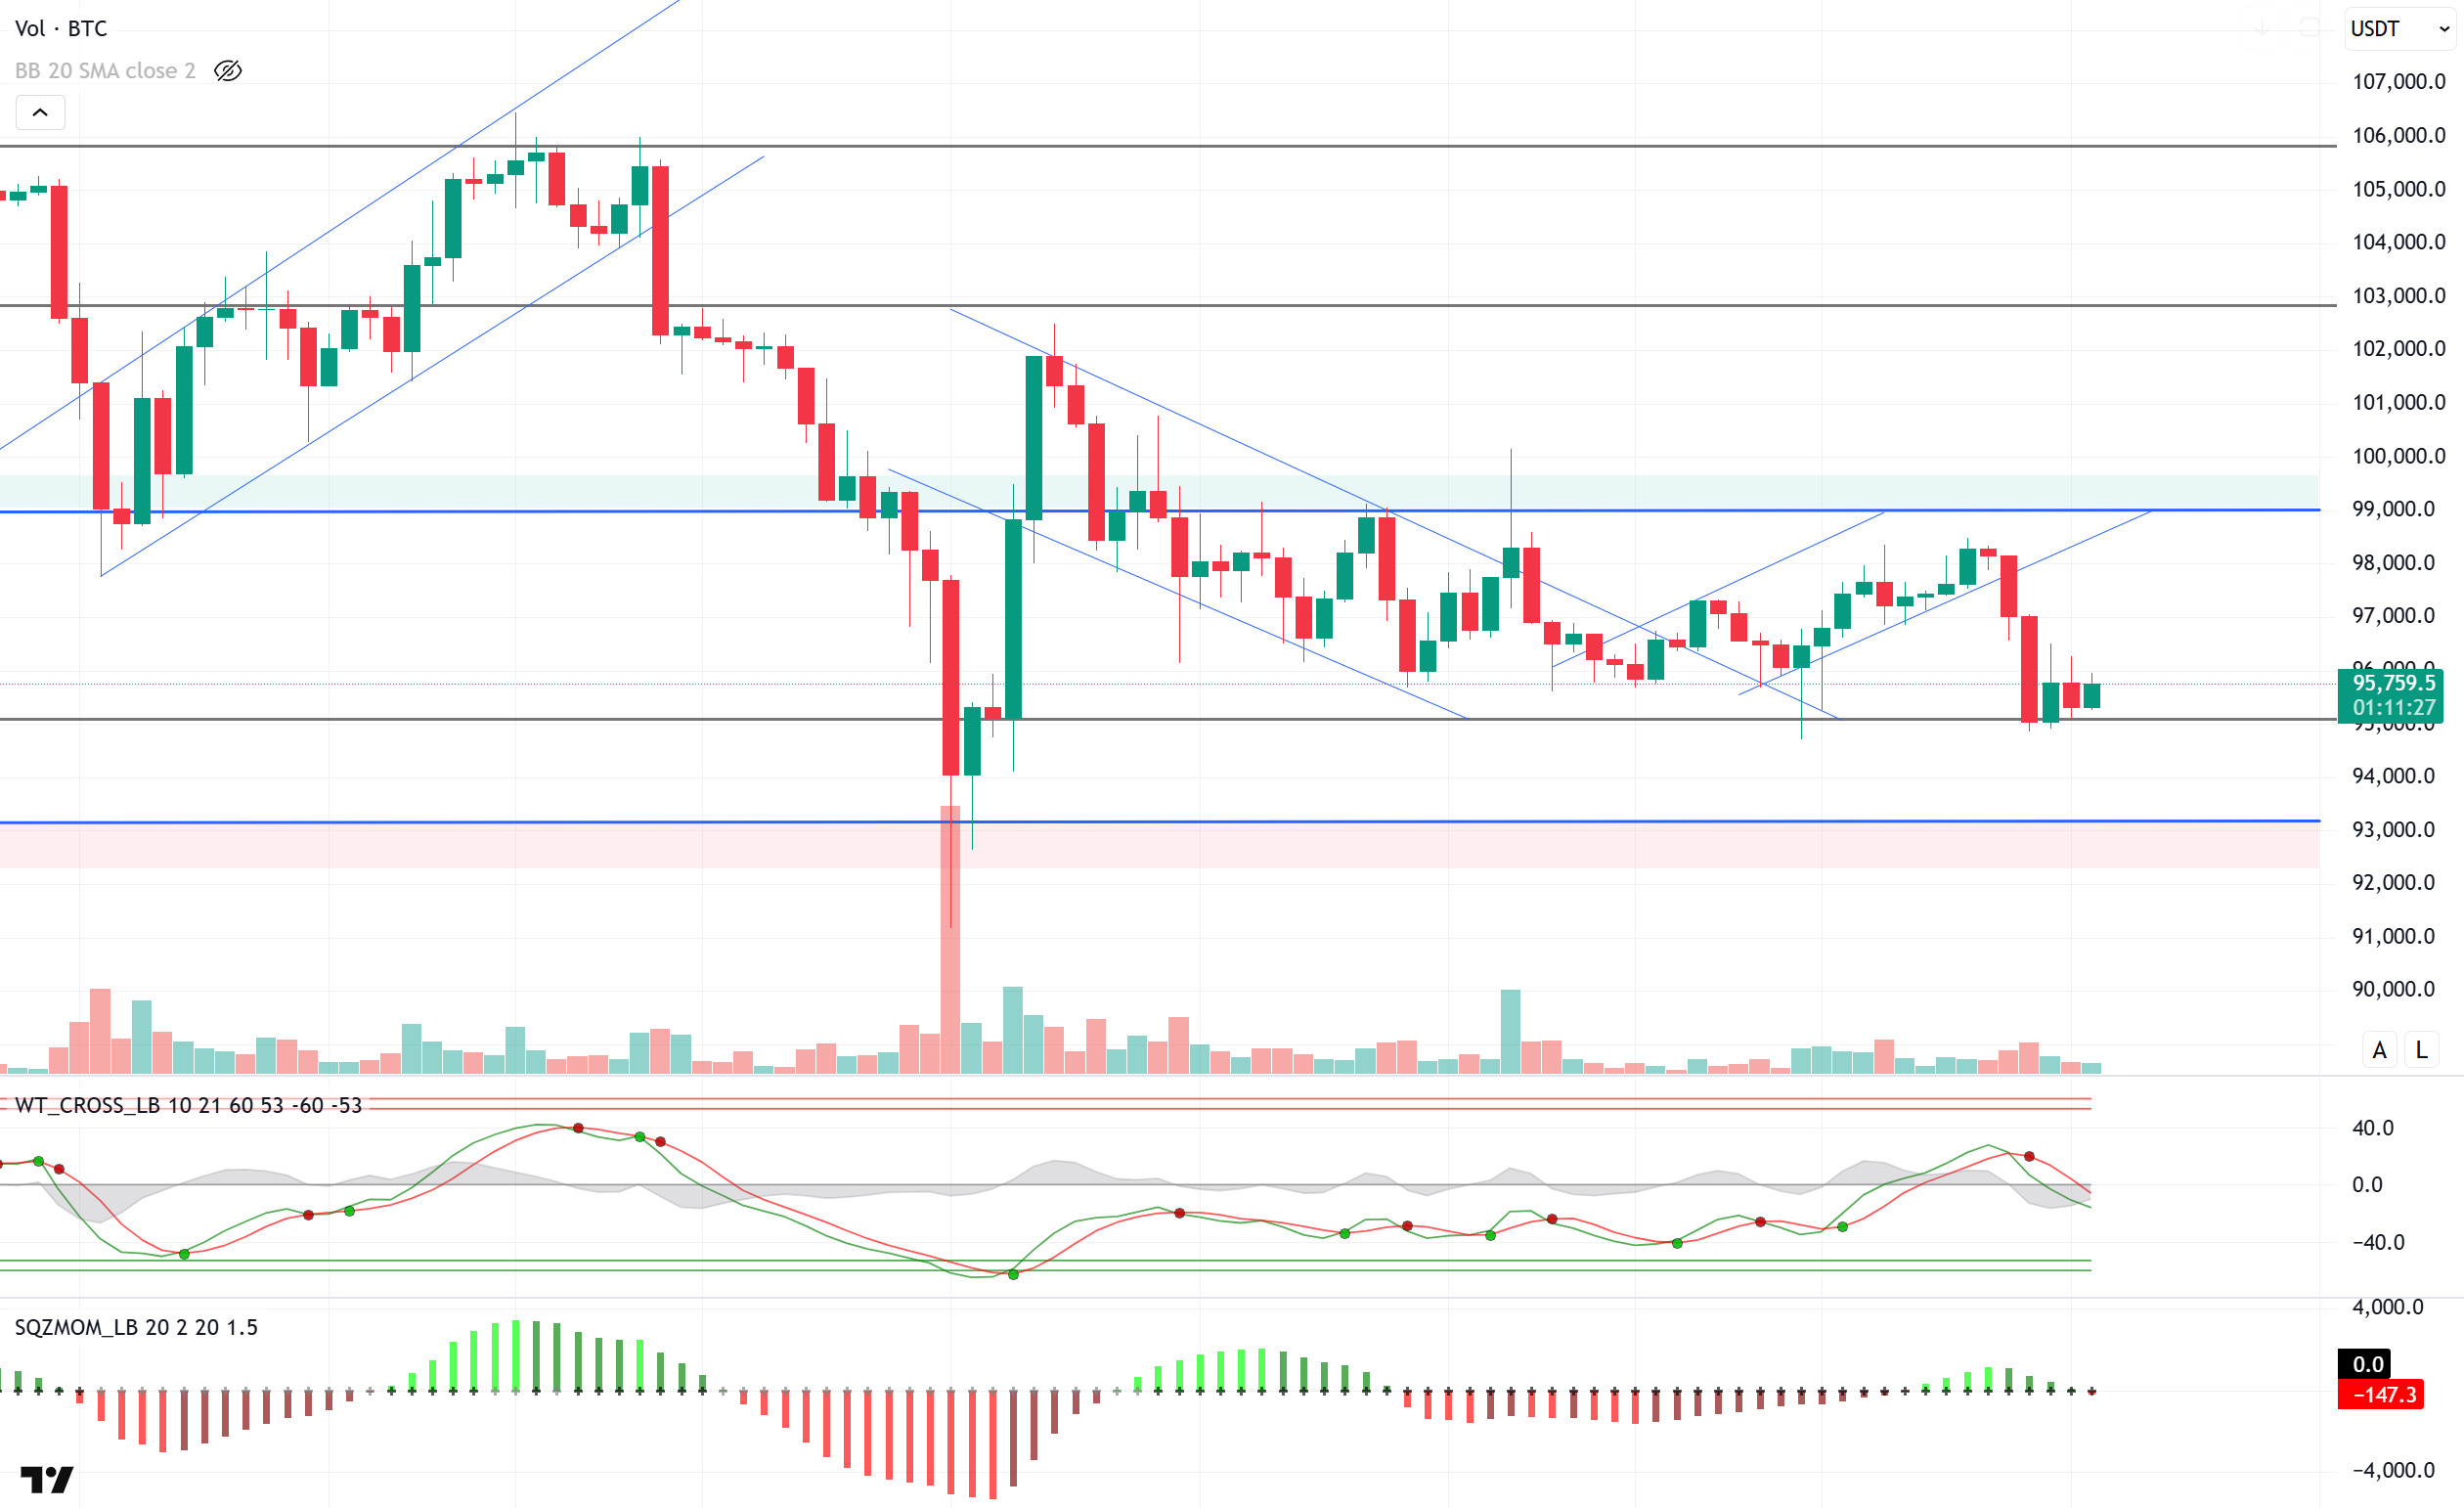
Global markets focused on the statements of FED Chairman Powell. US Federal Reserve Chairman Jerome Powell emphasized that the exclusion of the crypto industry from banking services should be re-examined and stated that they will cooperate with lawmakers to ease regulatory burdens. Powell also stated that there will be no rush to adjust interest rates, while expressing support for a regulatory framework for stablecoins and announced that he will not introduce the central bank digital currency (CBDC) during his tenure.
BTC lost its short-term uptrend structure and turned down, testing the major support point at 95,000. The price, which has recovered somewhat with the reaction it received from this level, is currently trading at 95,800. When the technical oscillators are analyzed, it is observed that selling signals continue to be maintained on the hourly and 4-hour charts, while buying signals are starting to form on the 30-minute charts. Momentum indicators show a weakening trend in the short term, but have the potential to regain strength during the day. In order to maintain the positive outlook, closures above the 95,000 level are critical, and persistence above this level may support the price recovery. However, closes below the 95,000 level may increase the downward pressure and reactivate the red band range. In case the decline deepens, price movements below 95,000 will be closely monitored, and in a possible recovery scenario, the 97,000 level will be monitored as a minor resistance point.
Supports 95,000 – 92,800 – 90,400
Resistances: : 97,000 – 99,100 -101,400
ETH/USDT
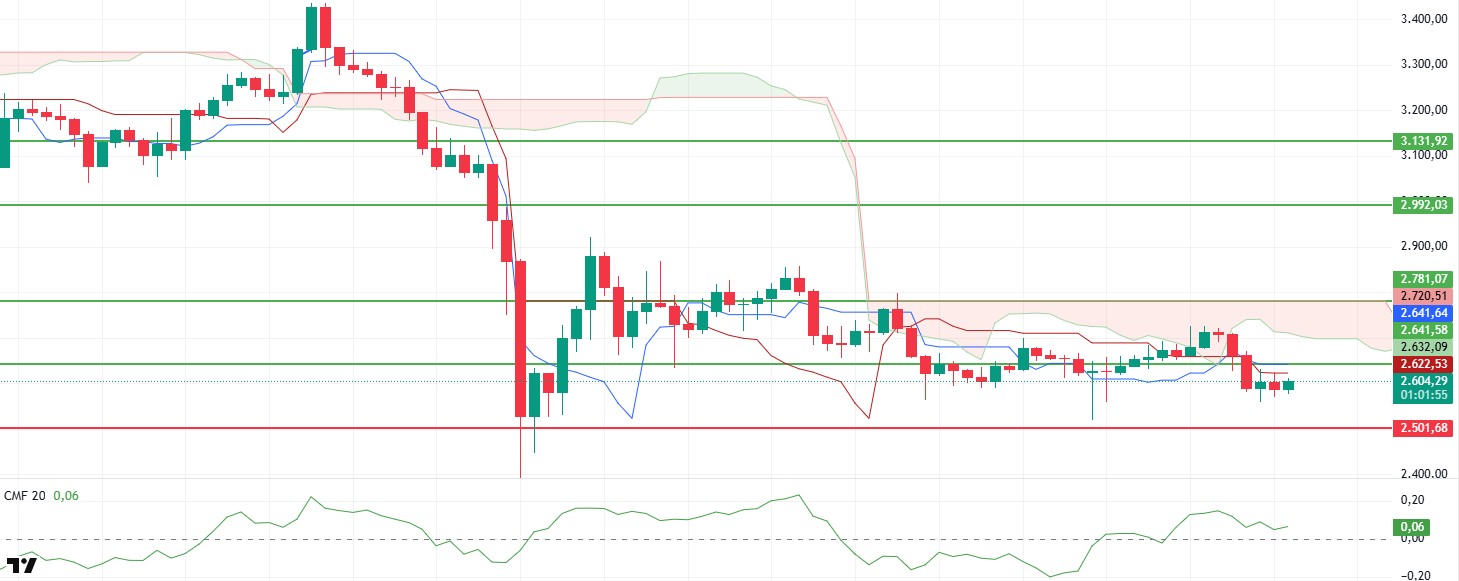
Yesterday, the retreat in the cryptocurrency market after FED Chairman Powell’s speech caused ETH to lose value. With the break of the support at $ 2,641, a decline to $ 2,550 was observed. After this price action, it was seen that ETH tried to exceed the kijun level in the morning hours, but retreated by encountering resistance here.
The continued positive inflows to ETFs and the increasing amount of ETH exiting the exchanges indicate that the market is experiencing a contraction on the supply side. An analysis of Cumulative Volume Delta (CVD) data reveals that selling pressure in the spot market is weaker than in futures. This shows that investors who buy ETH in the spot market are also opening short positions in futures for hedging purposes. In the short term, this trend suggests that the price may retreat a little more, but ETH may experience rapid rises as short positions close. This outlook is also supported by the Chaikin Money Flow (CMF) indicator. The fact that CMF remained strong during the downtrend indicates that there was no sharp liquidity outflow in the market. The flat course of CMF suggests that investors have not completely exited the market and buying interest continues. On the other hand, ETH’s rejection from the kumo cloud shows that the price action failed to break out to the upside, but the tenkan level remains above the kijun level, indicating that the price has not turned completely negative.
To summarize, a recovery can be seen in the short term if the price exceeds the $2,641 level again. However, selling pressure from this level may cause the price to exhibit a fluctuating movement in the region between $ 2,501 – $ 2,641. In this process, the gradual closing of short positions may accelerate the upward movement of the price.
Supports 2,501 – 2,368 – 2,127
Resistances 2,641 – 2,781 – 2,881
XRP/USDT
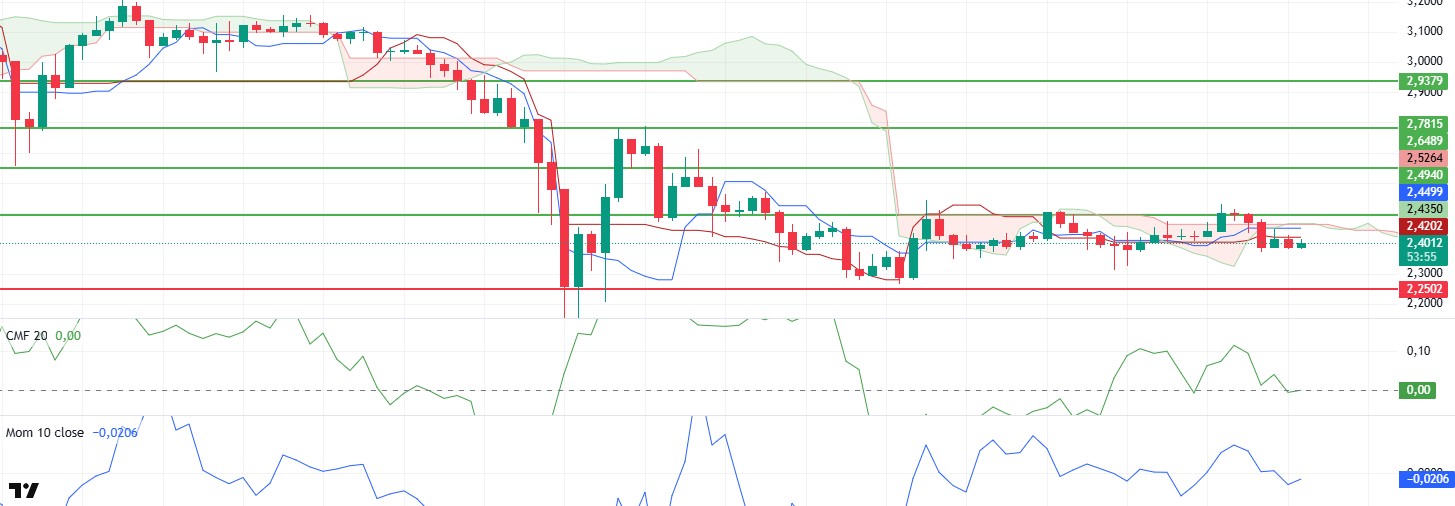
Yesterday, XRP broke through the critical resistance points of the kumo cloud and the $2.49 level with a very positive-looking move, but failed to hold in this region and quickly retreated back below the $2.40 level. Although this price action looks like a fake out, the momentum structure does not confirm this.
Chaikin Money Flow (CMF), on the other hand, fell to the zero zone with the decline and shows that sellers and buyers are rebalancing, unlike recent days. The positive outlook that emerged with yesterday’s price action has returned to a neutral outlook and it seems likely that XRP will continue to move sideways in this region. On the other hand, although the loss of the kumo cloud seems negative, the tenkan level remaining above the kijun level has not yet created a clear negative signal.
As a result, it seems likely that XRP will make slight up and down horizontal movements in these regions during the day. If the price exceeds the $ 2.49 level again, it may trigger rises. 2.25 dollars, on the other hand, maintains the most important support role and a violation of this region may bring very sharp declines.
Supports 2.2502 – 2.0201 – 1.6309
Resistances 2.4940 – 2.6486 – 2.7815
SOL/USDT
The US Securities and Exchange Commission (SEC) announced that it has formally accepted the listing application for the Spot Solana (SOL) ETF submitted by CBOE BZX Exchange and that the applicants are 21Shares, Bitwe, Canary Capital and Vaneck. On the other hand, Franklin Templeton, which manages more than $1.2 trillion in assets, has filed for a “Franklin Solana Trust” in Delaware.
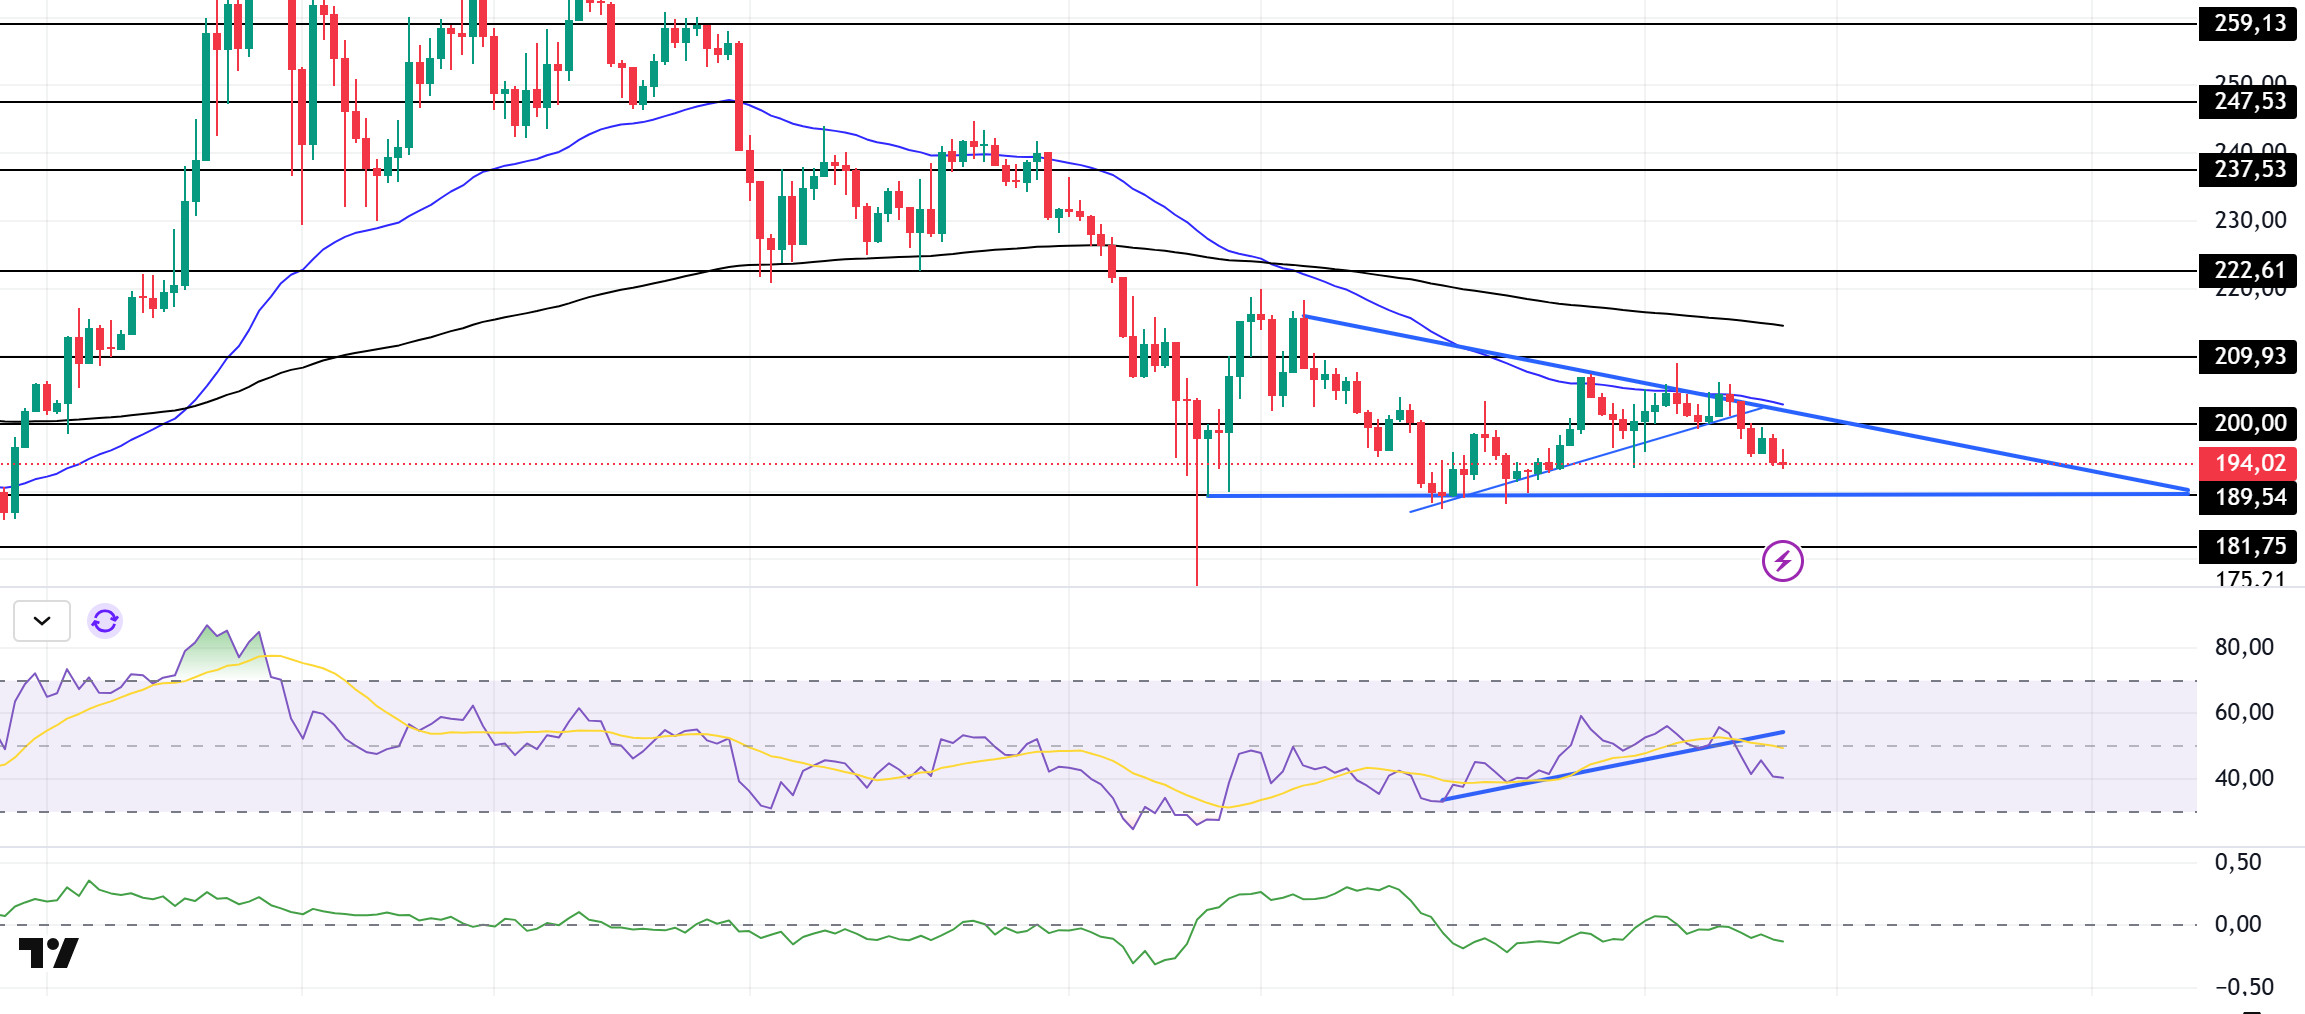
SOL continues to accumulate, maintaining its sideways movements within a limited band. On the 4-hour timeframe, the 50 EMA (Blue Line) continues to be below the 200 EMA (Black Line). This could deepen the decline in the medium term. At the same time, the asset is priced below the 50 EMA and 200 EMA. On February 6, it broke the uptrend to the downside and continued to be in a falling triangle pattern, deepening its decline. When we analyze the Chaikin Money Flow (CMF)20 indicator, it is in the negative zone and money outflows are increasing. However, the Relative Strength Index (RSI)14 indicator is at the mid-level of the negative zone and the price has broken the downward trend in the RSI that started on February 6. The $ 237.53 level stands out as a very strong resistance point in the uptrend driven by both the upcoming macroeconomic data and the news in the Solana ecosystem. If it breaks here, the rise may continue. In case of retracements for the opposite reasons or due to profit sales, the support level of $ 181.75 can be triggered again. If the price comes to these support levels, a potential bullish opportunity may arise if momentum increases.
Supports 189.54 – 181.75 – 171.82
Resistances 200.00 – 209.93 – 222.61
DOGE/USDT
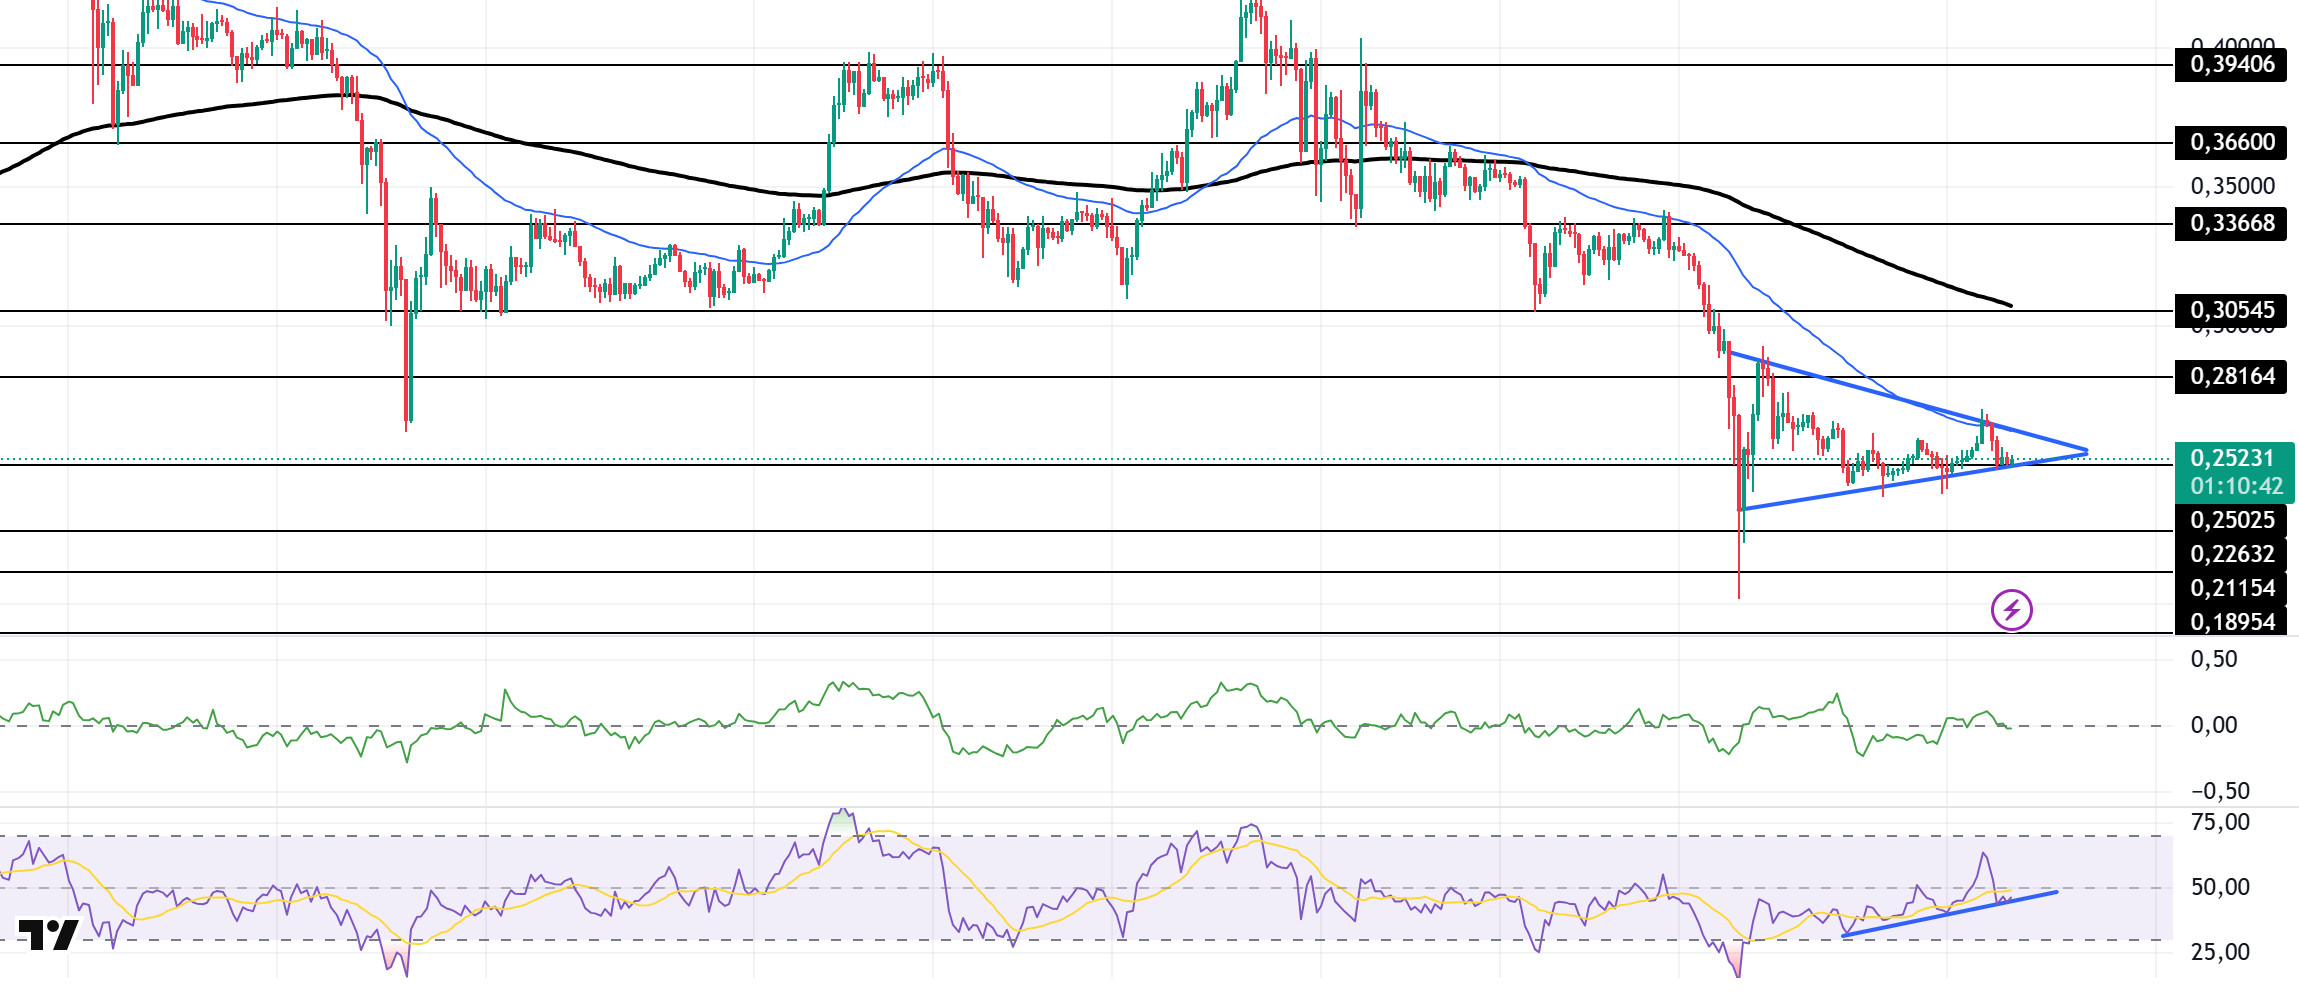
DOGE has declined since our analysis yesterday. On the 4-hour timeframe, the 50 EMA (Blue Line) remains below the 200 EMA (Black Line). This could mean that the decline could deepen further in the medium term. At the same time, the price is below the 50 EMA (Blue Line) and the 200 EMA (Black Line). However, the large gap between the two moving averages may increase the probability that DOGE will rise. After hitting resistance at the 50 EMA, the asset failed to break it and continued to decline and remained in a symmetrical triangle pattern. When we analyze the Chaikin Money Flow (CMF)20 indicator, it is in the neutral zone but money inflows and outflows are in balance. At the same time, Relative Strength Index (RSI)14 is close to the neutral level of the negative zone and the uptrend that started on February 6 continues. The $0.33668 level is a very strong resistance point in the uptrend due to political reasons, macroeconomic data and innovations in the DOGE coin. In case of possible pullbacks due to political, macroeconomic reasons or negativities in the ecosystem, the base level of the trend, the $ 0.22632 level, is an important support. If the price reaches these support levels, a potential bullish opportunity may arise if momentum increases.
Supports 0.25025 – 0.22632 – 0.21154
Resistances 0.28164 – 0.30545 – 0.33668
LEGAL NOTICE
The investment information, comments and recommendations contained herein do not constitute investment advice. Investment advisory services are provided individually by authorized institutions taking into account the risk and return preferences of individuals. The comments and recommendations contained herein are of a general nature. These recommendations may not be suitable for your financial situation and risk and return preferences. Therefore, making an investment decision based solely on the information contained herein may not produce results in line with your expectations.
