
MARKET SUMMARY
Latest Situation in Crypto Assets
| Assets | Last Price | 24h Change | Dominance | Market Cap. |
|---|---|---|---|---|
| BTC | 96,836.80 | -1.61% | 61.09% | 1,92 T |
| ETH | 2,695.77 | -5.41% | 10.33% | 324,73 B |
| XRP | 2.292 | -6.89% | 4.22% | 132,71 B |
| SOLANA | 190.78 | -6.41% | 2.96% | 93,04 B |
| DOGE | 0.2482 | -6.51% | 1.17% | 36,73 B |
| CARDANO | 0.7100 | -7.08% | 0.79% | 24,98 B |
| TRX | 0.2282 | 0.36% | 0.62% | 19,65 B |
| LINK | 18.63 | -6.30% | 0.38% | 11,87 B |
| AVAX | 24.68 | -7.91% | 0.32% | 10,15 B |
| SHIB | 0.00001486 | -7.65% | 0.28% | 8,76 B |
| DOT | 4.550 | -5.78% | 0.22% | 7,03 B |
*Prepared on 2.7.2025 at 07:00 (UTC)
WHAT’S LEFT BEHIND
Utah’s Bitcoin Investment Bill Passed in the House of Representatives
Utah has passed a Bitcoin investment bill in the House of Representatives. The bill will now go to the Senate for consideration.
Czech President Signs Law Exempting Holding Bitcoin for More Than 3 Years from Tax
The Czech President has approved a bill exempting Bitcoin from capital gains tax if held for more than 3 years.
Trump Media Group Files Trademark Application for “Truth.Fi Bitcoin Plus ETF”
Trump Media & Technology Group filed a trademark application for Bitcoin Plus ETF and other financial products under the Truth.Fi brand.
Trump Family Crypto Project WLFI Plans to Create Strategic Token Reserve
Trump’s DeFi project World Liberty Financial (WLFI) announced plans to create a strategic token reserve.
SEC Advances ETF Filings for XRP, LTC and SOL
The SEC has started considering new ETF applications for XRP, Litecoin and Solana. This development signals that the SEC is adopting a crypto-friendly approach.
SEC Seeks Public Comments on Conversion of Grayscale Litecoin Trust to ETF
The SEC is seeking public comment on Grayscale’s application to convert its Litecoin Trust into an ETF. The comment period will last 21 days after publication in the Federal Register.
SEC Considers Proposal to Open BlackRock’s Spot Bitcoin ETF to Physical Redemptions
BlackRock’s proposal to modify its spot Bitcoin ETF to allow physical redemptions is under review by the SEC. The comment period will be completed in 21 days.
Cboe BZX Exchange Files 19b-4 Application for XRP Spot ETFs
Cboe BZX Exchange filed a 19b-4 application with the SEC for the listing of XRP spot ETFs on behalf of Bitwise, 21Shares and Canary Capital.
Franklin Templeton Seeks SEC Approval for New Cryptocurrency Index ETF
Franklin Templeton has requested SEC approval to launch a new cryptocurrency index ETF to capitalize on the crypto boom in the US.
Ethereum Pectra Upgrade Enters Test Phase
Ethereum developers will start testing the Pectra upgrade on the Holesky testnet on February 26 and on the Sepolia testnet on March 5. If successful, it is scheduled to launch on the mainnet in April.
HIGHLIGHTS OF THE DAY
Important Economic Calender Data
| Time | News | Expectation | Previous |
|---|---|---|---|
| 13:30 | US Average Hourly Earnings (MoM) (Jan) | 0.0% | 0.3% |
| 13:30 | US Nonfarm Payrolls (Jan) | 169K | 256K |
| 13:30 | US Unemployment Rate (Jan) | 4.1% | 4.1% |
| 15:00 | US Michigan Consumer Sentiment (Feb) | 71.0 | 71.1 |
INFORMATION
*The calendar is based on UTC (Coordinated Universal Time) time zone.
The economic calendar content on the relevant page is obtained from reliable news and data providers. The news in the economic calendar content, the date and time of the announcement of the news, possible changes in the previous, expectations and announced figures are made by the data provider institutions. Darkex cannot be held responsible for possible changes that may arise from similar situations.
MARKET COMPASS
In global markets, Trump’s stance on tariffs and foreign policies, Treasury Secretary Bessent’s statements, balance sheets of major companies and US macro indicators continue to be decisive in pricing behavior. Today we will see the critical January employment data and it will be important for the markets as it may give clues about the interest rate cut course of the Federal Reserve (FED).
This morning in Asia, we see that China is diverging positively and this is due to DeepSeek-driven optimism. European stock markets are expected to start the new day with some profit-taking after recent rises. Digital assets are also relatively tight and we can say that the US employment data is eagerly awaited.
NFP Could Be Decisive
In the last month of last year, the US economy added 256,000 jobs in the non-farm sector. This change was well above the expectations of 164 thousand and supported the expectations that the pace of interest rate cuts by the FED would slow down.
Recently we have seen a fluctuation in the NFP due to a number of external factors, strikes and natural disasters being the main ones. In the first months of the year, in order to understand whether things are on track in the world’s largest economy, we need data that is free from such effects. We think that the first of these could be the January data. NFP forecast of economists for the first month of the year is seen at 169 thousand.
Let us underline once again that not only the NFP data, but also indicators such as average hourly earnings and the unemployment rate, which will be released with this report, should be closely monitored, but this time, we think that the revisions to the NFP for the previous months should also be looked at. Potential large downward revisions could call into question the strength of the labor market.
Let’s turn to the NFP data for January. A lower-than-expected data may increase risk appetite as it may strengthen the FED’s hand for interest rate cuts, which may have a positive impact on digital assets. In the opposite case, we may see pressure on cryptocurrencies.
From the short term to the big picture.
Trump’s victory on November 5, one of the main pillars of our bullish expectation for the long-term outlook in digital assets, produced a result in line with our predictions. In the process that followed, the appointments made by the president-elect and the increasing regulatory expectations for the crypto ecosystem in the US, as well as the emergence of BTC as a reserve, continued to take place in our equation as positive variables. Then, 4 days after the new President took over the White House, he signed the “Cryptocurrency Working Unit” decree, which was among his election promises, and we think that the positive reflection of the outputs it will produce in the coming days on digital assets may continue.
On the other hand, the expectations that the FED will continue its interest rate cut cycle, albeit on hiatus for now, and the fact that the volume in crypto-asset ETFs indicates an increase in institutional investor interest, support our upside forecast for the big picture. In the short term, given the nature of the market and pricing behavior, we think it would not be surprising to see occasional pause or pullbacks in digital assets. However, at this point, it is worth underlining again that we think the fundamental dynamics continue to be bullish.
TECHNICAL ANALYSIS
BTC/USD
Utah approved a bill on Bitcoin investment in the House of Representatives, while the Czech President signed a law exempting those who hold Bitcoin for more than three years. On the other hand, the Trump family is on the agenda with crypto projects; Trump Media Group filed a trademark application for Bitcoin Plus ETF.
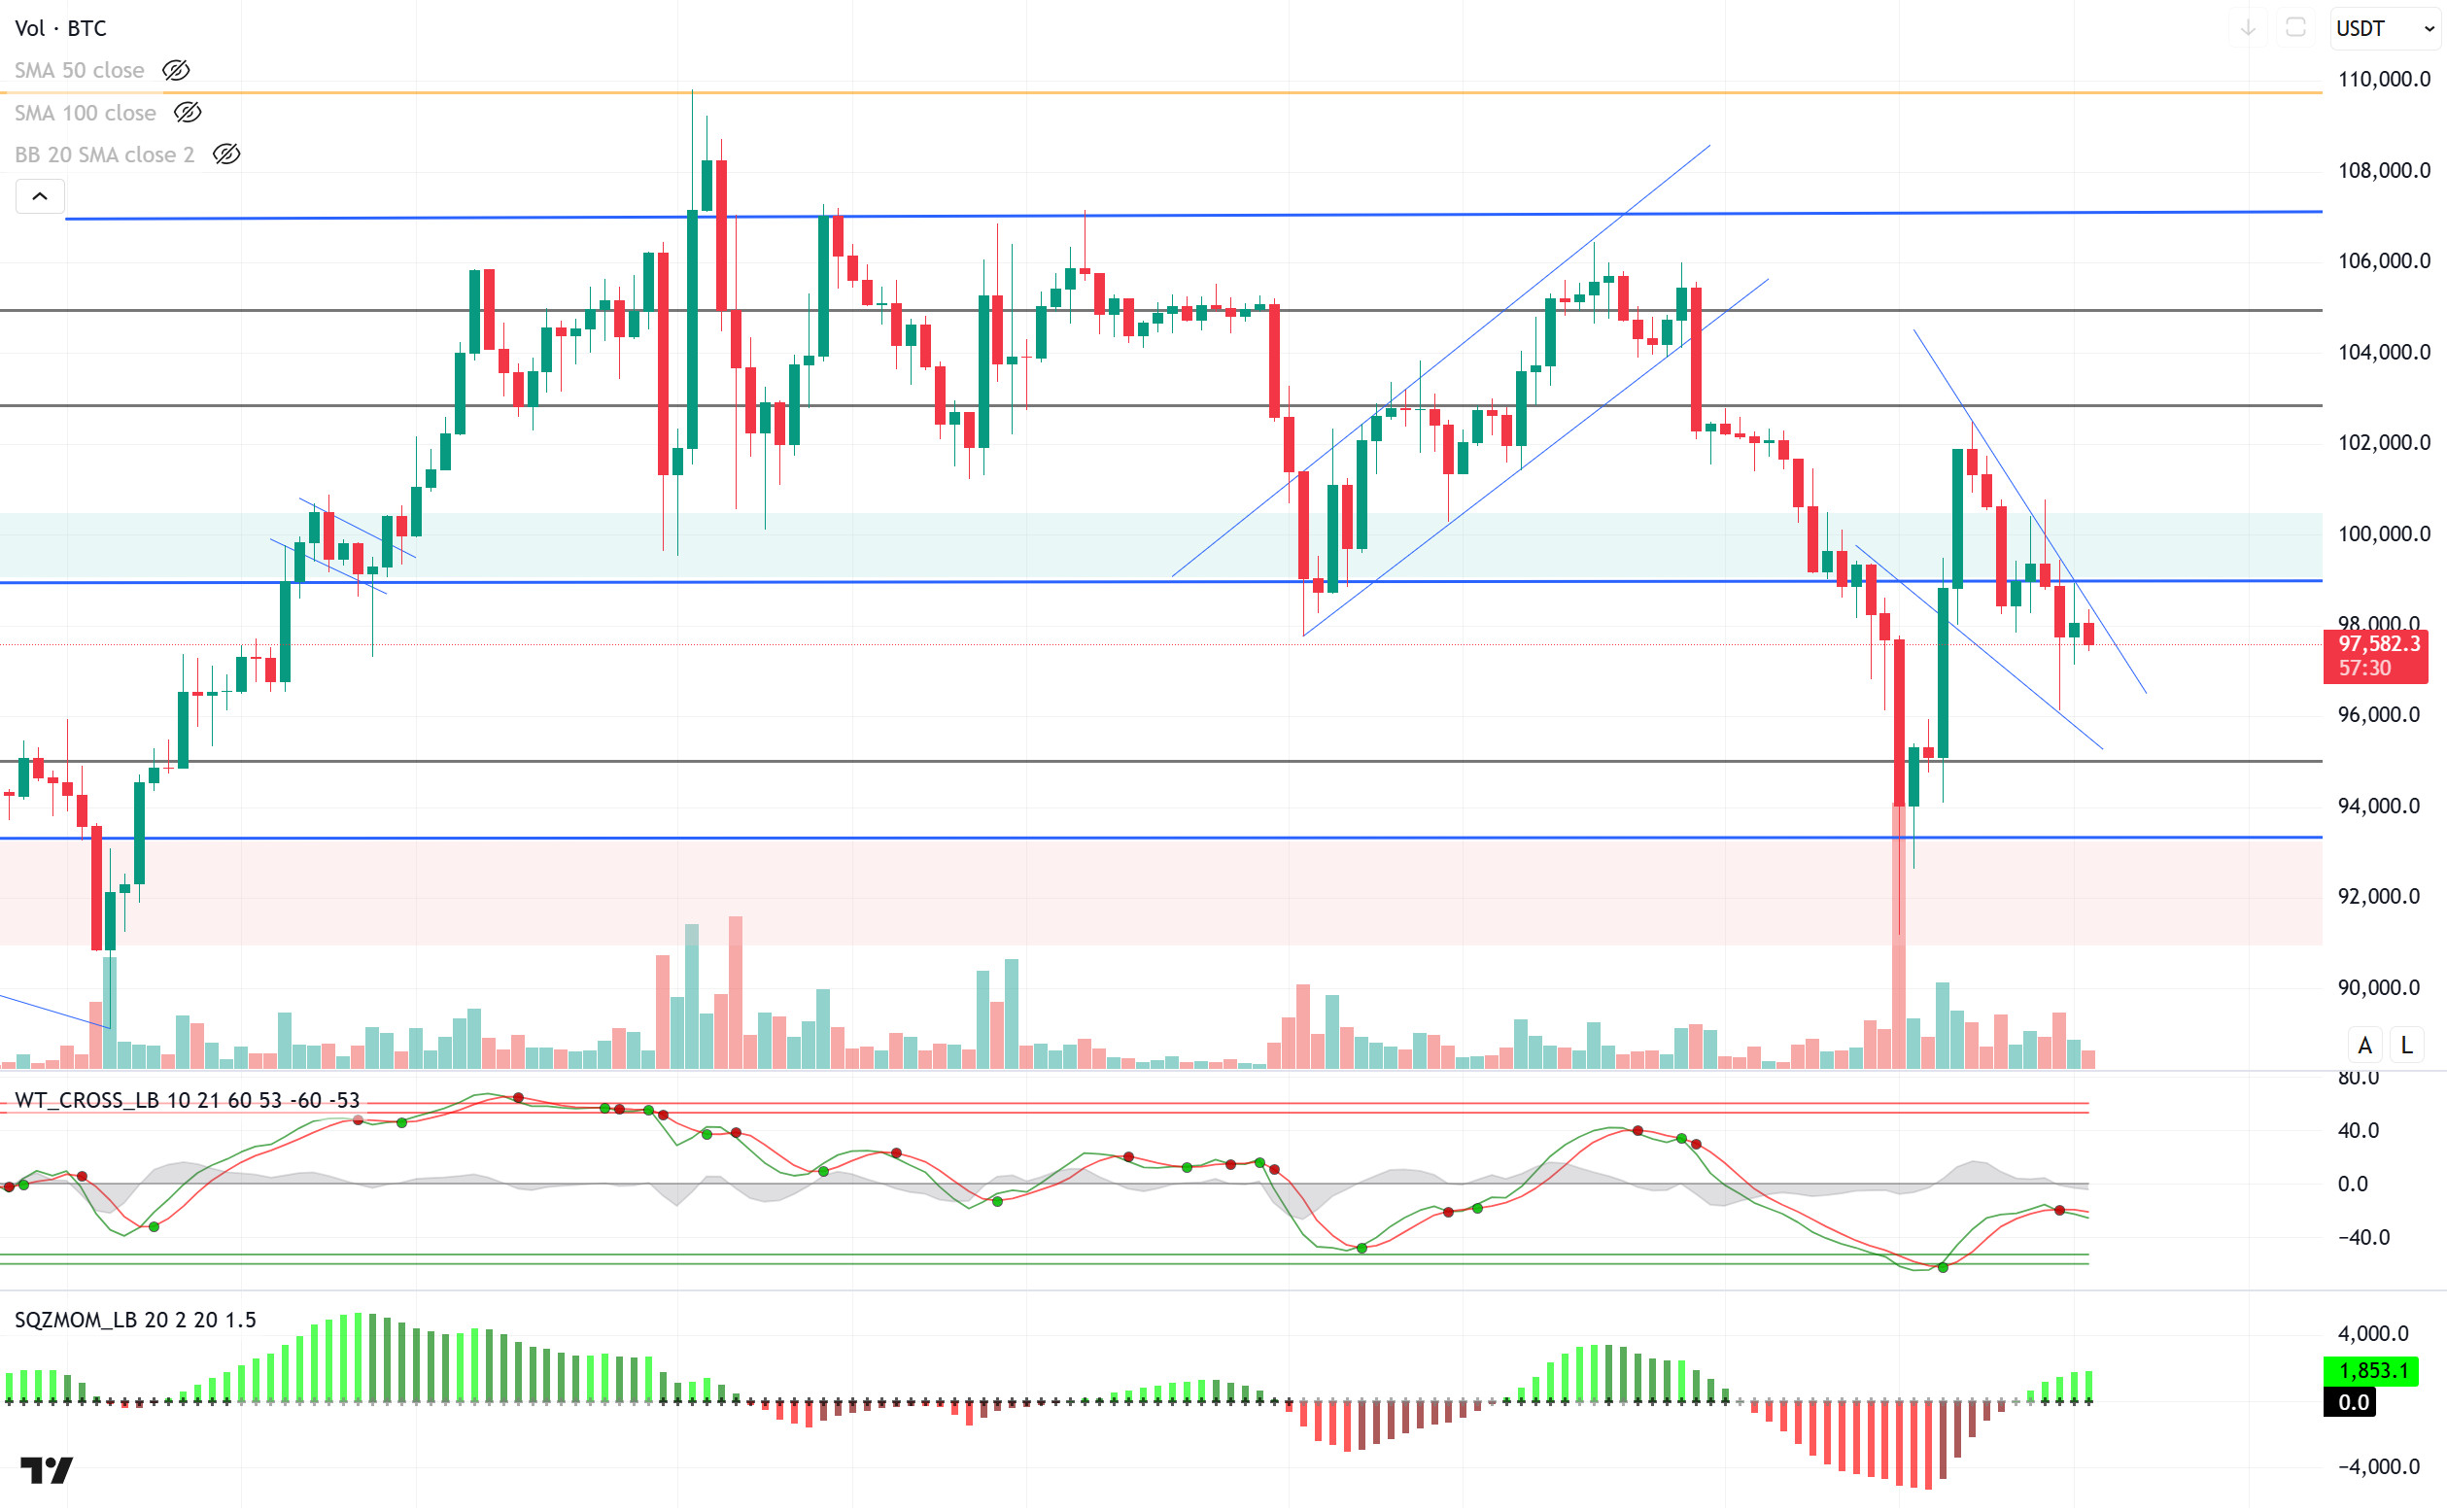
When we look at the technical outlook, it is seen that a retest occurred at the level of 91,100 after the upside break of the flag pattern formed in the BTC price. However, price movements continue to remain under the influence of the falling trend structure. BTC, which has difficulty in upward pricing, continues to fluctuate within the falling trend channel. Currently trading at 96,800, BTC’s technical oscillators are starting to generate buy signals near the oversold zone, while the weakness in the momentum indicator limits the price’s upward movements. In case the downtrend continues, the 95,000 level stands out as a strong major support point. On the other hand, it is critical to break the downtrend channel upwards in order for the uptrend to gain strength. If this breakout occurs, it may be possible for the price to catch a new bullish momentum towards six-digit levels.
Supports 95,000 – 92,800 – 92,800
Resistances 99,100 – 98,000 – 101,400
ETH/USDT
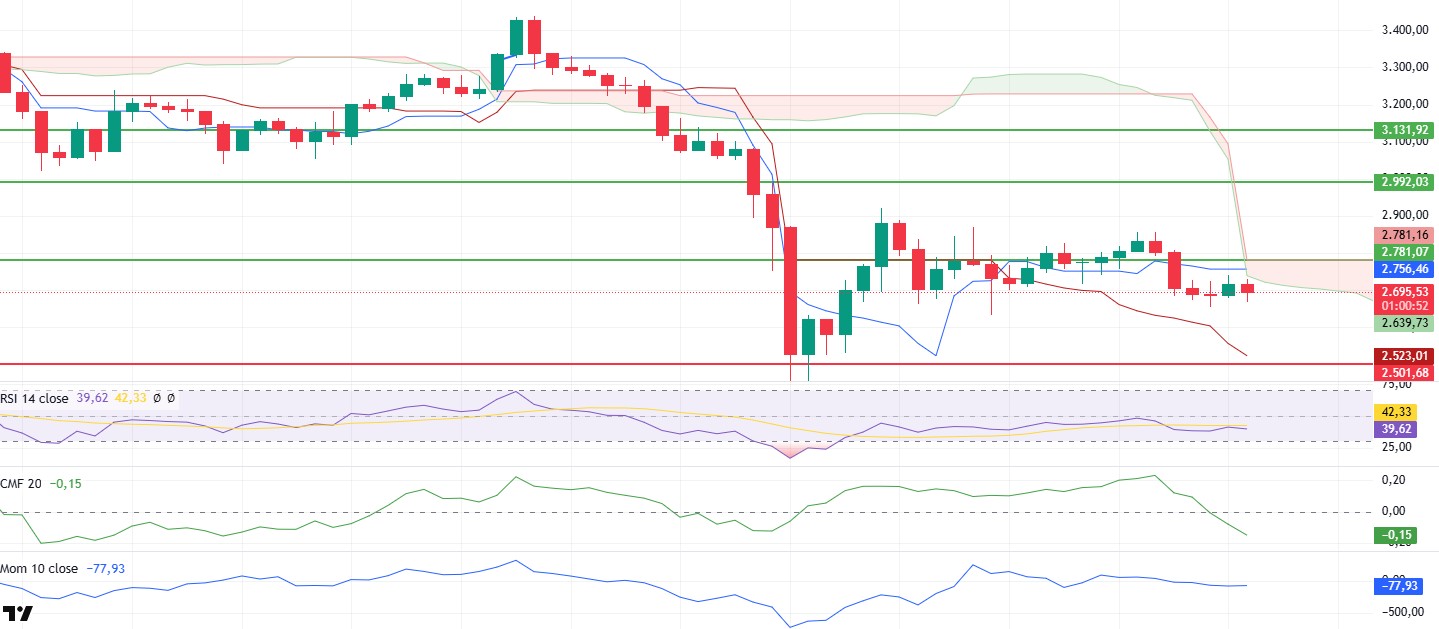
ETH experienced a sharp decline yesterday evening, losing its support at 2,781 and falling to 2,660. Significant changes are observed in the technical indicators of ETH, which is currently moving in a narrow price range.
First of all, the Chaikin Money Flow (CMF) indicator fell sharply into negative territory. This indicates that there is less money entering the market and selling pressure has increased significantly. Especially looking at the Cumulative Volume Delta (CVD) data, it is seen that sales in the spot market have increased significantly as of yesterday. This stands out as one of the main reasons for the downward pressure on the price. In addition, Relative Strength Index (RSI) and momentum indicators are also showing slight pullbacks. Although the RSI is not approaching the oversold zone, it is in a downtrend, indicating that buyers remain weak. On the momentum side, it can be said that the downtrend continues to be effective but has not deepened for now. Looking at the Ichimoku indicator, it is seen that the price remains below both the kumo cloud and the tenkan level. Unless there is a permanent price movement above these two levels, it seems difficult to achieve a strong upward momentum. However, regaining these areas may allow ETH to enter the recovery process.
Considering the current technical outlook, regaining the 2,781 level could create a positive structure for ETH and pave the way for the price to start a move towards the 2,992 level. However, continued price action below this level could lead to a weakening of ETH, increasing selling pressure and raising the possibility of a deeper decline towards 2,501 support.
Supports 2,501 – 2,368 – 2,114
Resistances 2,781 – 2,992 – 3,131
XRP/USDT
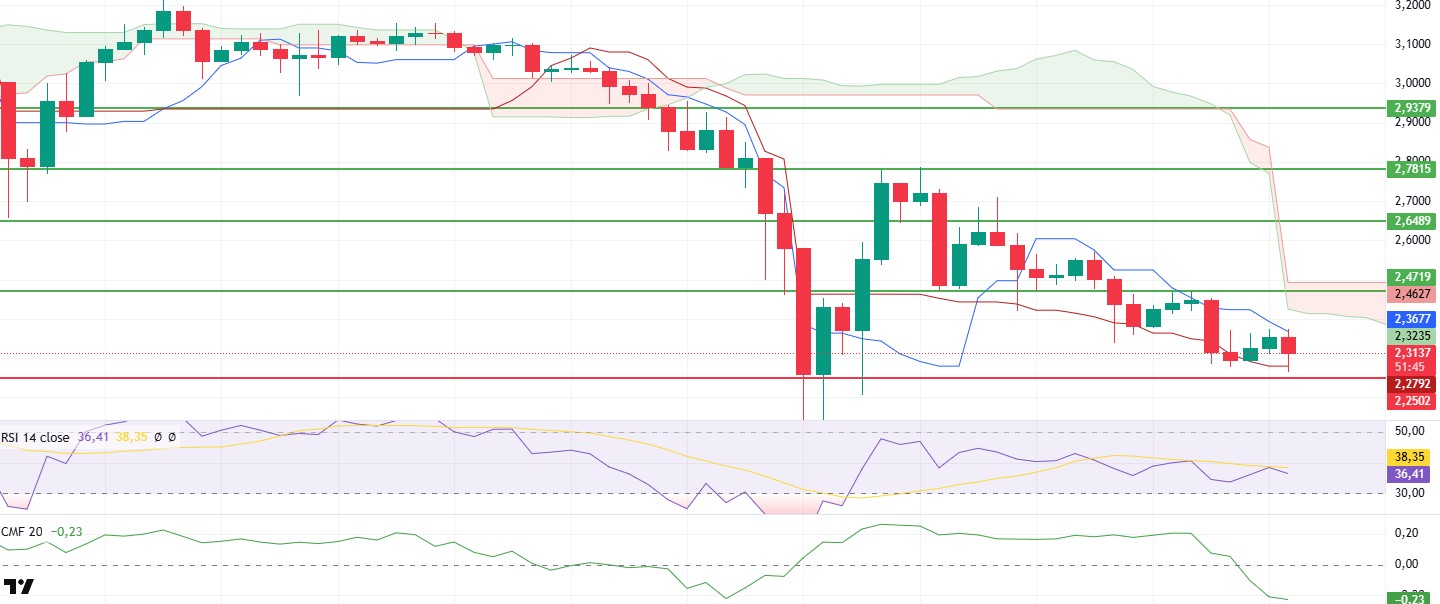
Although XRP tested the resistance at 2.47 twice, it was rejected from this area and retreated and fell to 2.25 support. For the moment, the price seems to be trying to hold at this level. However, current technical indicators do not give enough signals to determine a clear direction in the market.
As mentioned in previous analysis, XRP price continues to move between kijun and tenkan levels for the time being. This indicates that uncertainty persists in the short term and the market is struggling to find direction. Relative Strength Index (RSI) and momentum indicators also fluctuate in a narrow range, showing no clear trend. Chaikin Money Flow (CMF), on the other hand, showed a sharp decline and the indicator moved into negative territory. This indicates a high level of liquidity outflow from the market and increased selling pressure. The lack of a clear divergence in CMF indicates that the buy side remains weak, and the market has not yet signaled a recovery.
Considering the current technical structure, it seems likely that XRP will receive a reaction from this region as it is close to the 2.25 level. However, since the indicators have not yet produced a meaningful bullish signal, it is difficult to make a clear prediction about the permanence of an upward movement. If the price rebounds, the 2.47 level will remain an important resistance and breaking through it will be critical for XRP to gain upward momentum. On the other hand, if the 2.25 support is broken, it is possible that the selling pressure will deepen and the price may retreat to 2.02.
Supports 2.2502 – 2.0201 – 1.6309
Resistances 2.4719 – 2.6489 – 2.7815
SOL/USDT
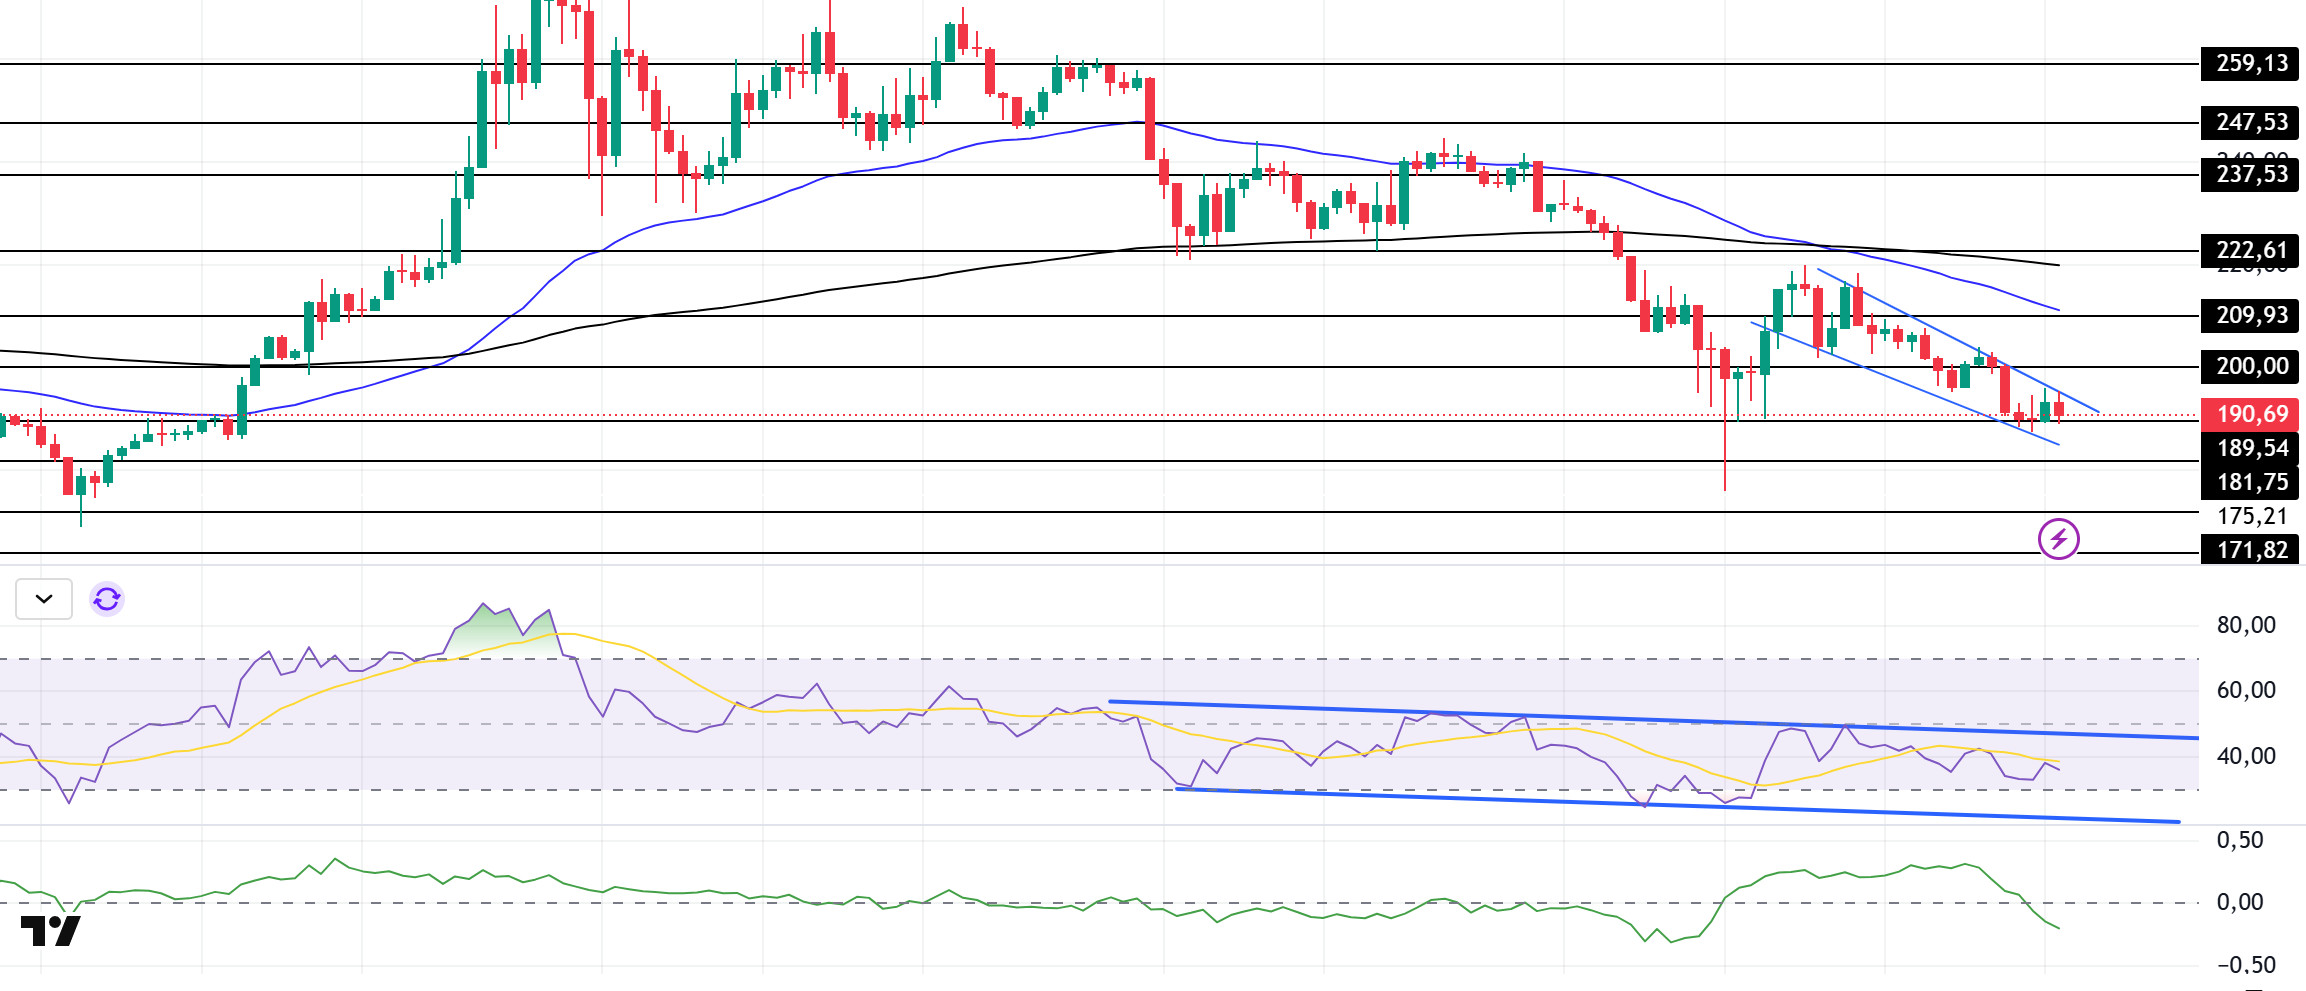
The SEC accepted Grayscale’s Solana 19b-4 application, reversing previous denials. Asset manager VanEck says Solana could rise to $520 per token by the end of 2025, according to its latest market report released today.
On the 4-hour timeframe, the 50 EMA (Blue Line) continues to be below the 200 EMA (Black Line). This could deepen the decline in the medium term. At the same time, the asset is priced below the 50 EMA and 200 EMA. On February 3, the descending wedge pattern that started to form is noteworthy. When we examine the Chaikin Money Flow (CMF)20 indicator, it is in the negative zone, but money outflows have started to increase. However, the Relative Strength Index (RSI)14 indicator is at the mid-level of the negative zone and the price continues to be at the mid-level of the downtrend in the RSI that started on January 19. This could push the price higher. The 237.53 level is a very strong resistance point in the uptrend driven by both the upcoming macroeconomic data and the news in the Solana ecosystem. If it breaks here, the rise may continue. In case of retracements for the opposite reasons or due to profit sales, the 181.75 support level can be triggered again. If the price reaches these support levels, a potential bullish opportunity may arise if momentum increases.
Supports 189.54 – 181.75 – 171.82
Resistances 200.00 – 209.93 – 222.61
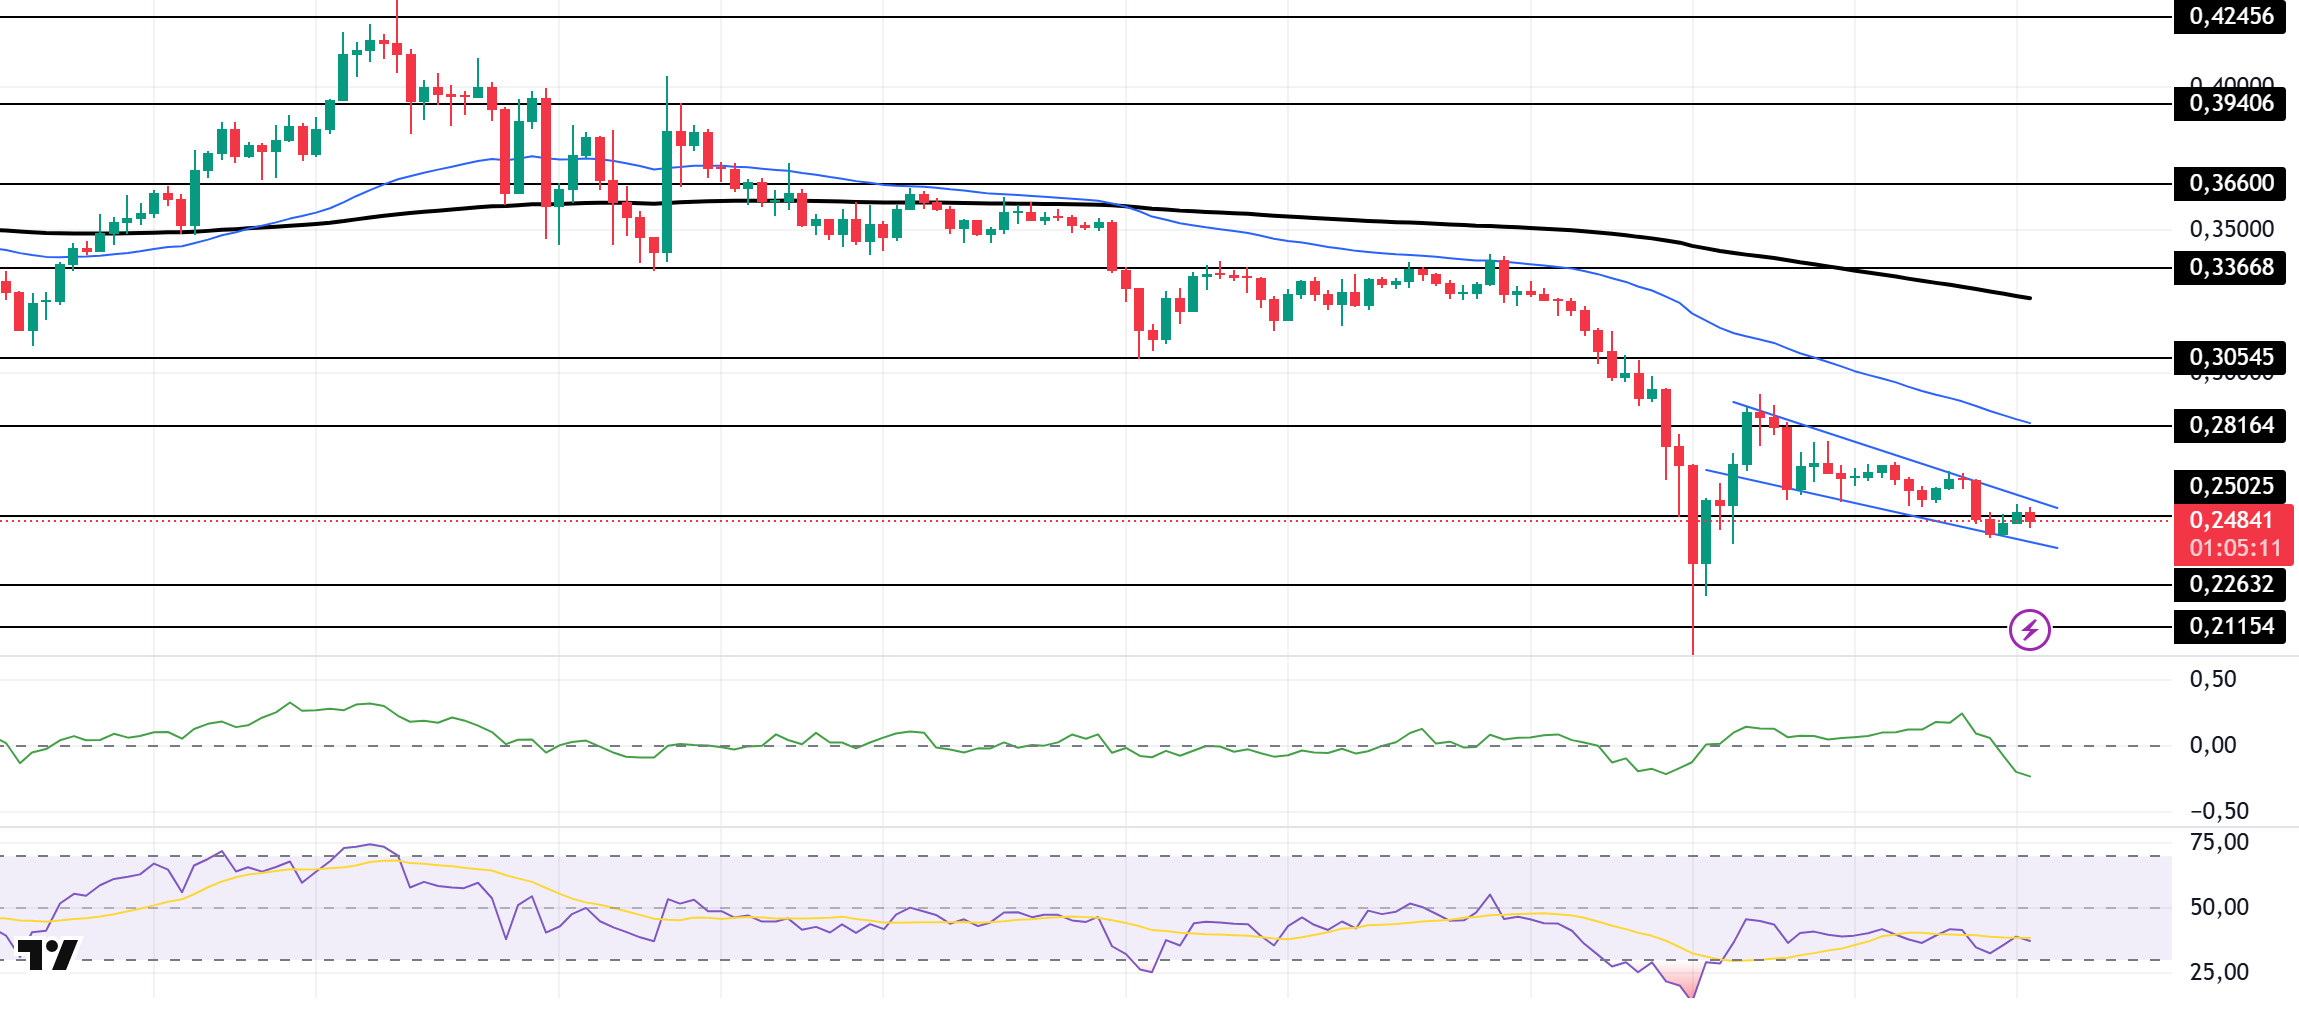
DOGE/USDT
Since our analysis yesterday, the price has experienced a downward trend. On the 4-hour timeframe, the 50 EMA (Blue Line) remained below the 200 EMA (Black Line). This could mean that the decline could deepen further in the medium term. At the same time, the price is below the 50 EMA (Blue Line) and the 200 EMA (Black Line). However, the large gap between the two moving averages may increase the probability of the DOGE rising. The descending wedge pattern should be followed. When we analyze the Chaikin Money Flow (CMF)20 indicator, it is in the negative zone and money outflows started to increase. At the same time, Relative Strength Index (RSI)14 is at the middle level of the negative zone. The 0.33668 level stands out as a very strong resistance point in the rises due to political reasons, macroeconomic data and innovations in the DOGE coin. In case of possible pullbacks due to political, macroeconomic reasons or negativities in the ecosystem, the 0.22632 level, which is the base level of the trend, is an important support. If the price reaches these support levels, a potential bullish opportunity may arise if momentum increases.
Supports 0.25025 – 0.22632 – 0.21154
Resistances 0.28164 – 0.30545 – 0.33668
LEGAL NOTICE
The investment information, comments and recommendations contained herein do not constitute investment advice. Investment advisory services are provided individually by authorized institutions taking into account the risk and return preferences of individuals. The comments and recommendations contained herein are of a general nature. These recommendations may not be suitable for your financial situation and risk and return preferences. Therefore, making an investment decision based solely on the information contained herein may not produce results in line with your expectations.

