
MARKET SUMMARY
Latest Situation in Crypto Assets
| Assets | Last Price | 24h Change | Dominance | Market Cap |
|---|---|---|---|---|
| BTC | 95,444.06 | 2.03% | 56.31% | 1,89 T |
| ETH | 3,403.30 | 1.99% | 12.21% | 409,81 B |
| XRP | 2.350 | 9.91% | 4.02% | 134,80 B |
| SOLANA | 205.07 | 8.01% | 2.95% | 99,00 B |
| DOGE | 0.3308 | 4.17% | 1.45% | 48,76 B |
| CARDANO | 0.9261 | 8.36% | 0.97% | 32,54 B |
| TRX | 0.2577 | 0.92% | 0.66% | 22,22 B |
| AVAX | 38.59 | 8.45% | 0.47% | 15,81 B |
| LINK | 22.02 | 10.13% | 0.42% | 14,06 B |
| SHIB | 0.00002205 | 4.50% | 0.39% | 13,01 B |
| DOT | 7.125 | 7.20% | 0.33% | 10,93 B |
*Prepared on 1.2.2025 at 07:00 (UTC)
WHAT’S LEFT BEHIND
HIGHLIGHTS OF THE DAY
Saga (SAGA): TournamentSaga
13:30 US Initial Jobless Claims 222K 219K
14:45 US Final Manufacturing PMI (Dec) 48.3 49.7
MARKET COMPASS
TECHNICAL ANALYSIS
BTC/USDT
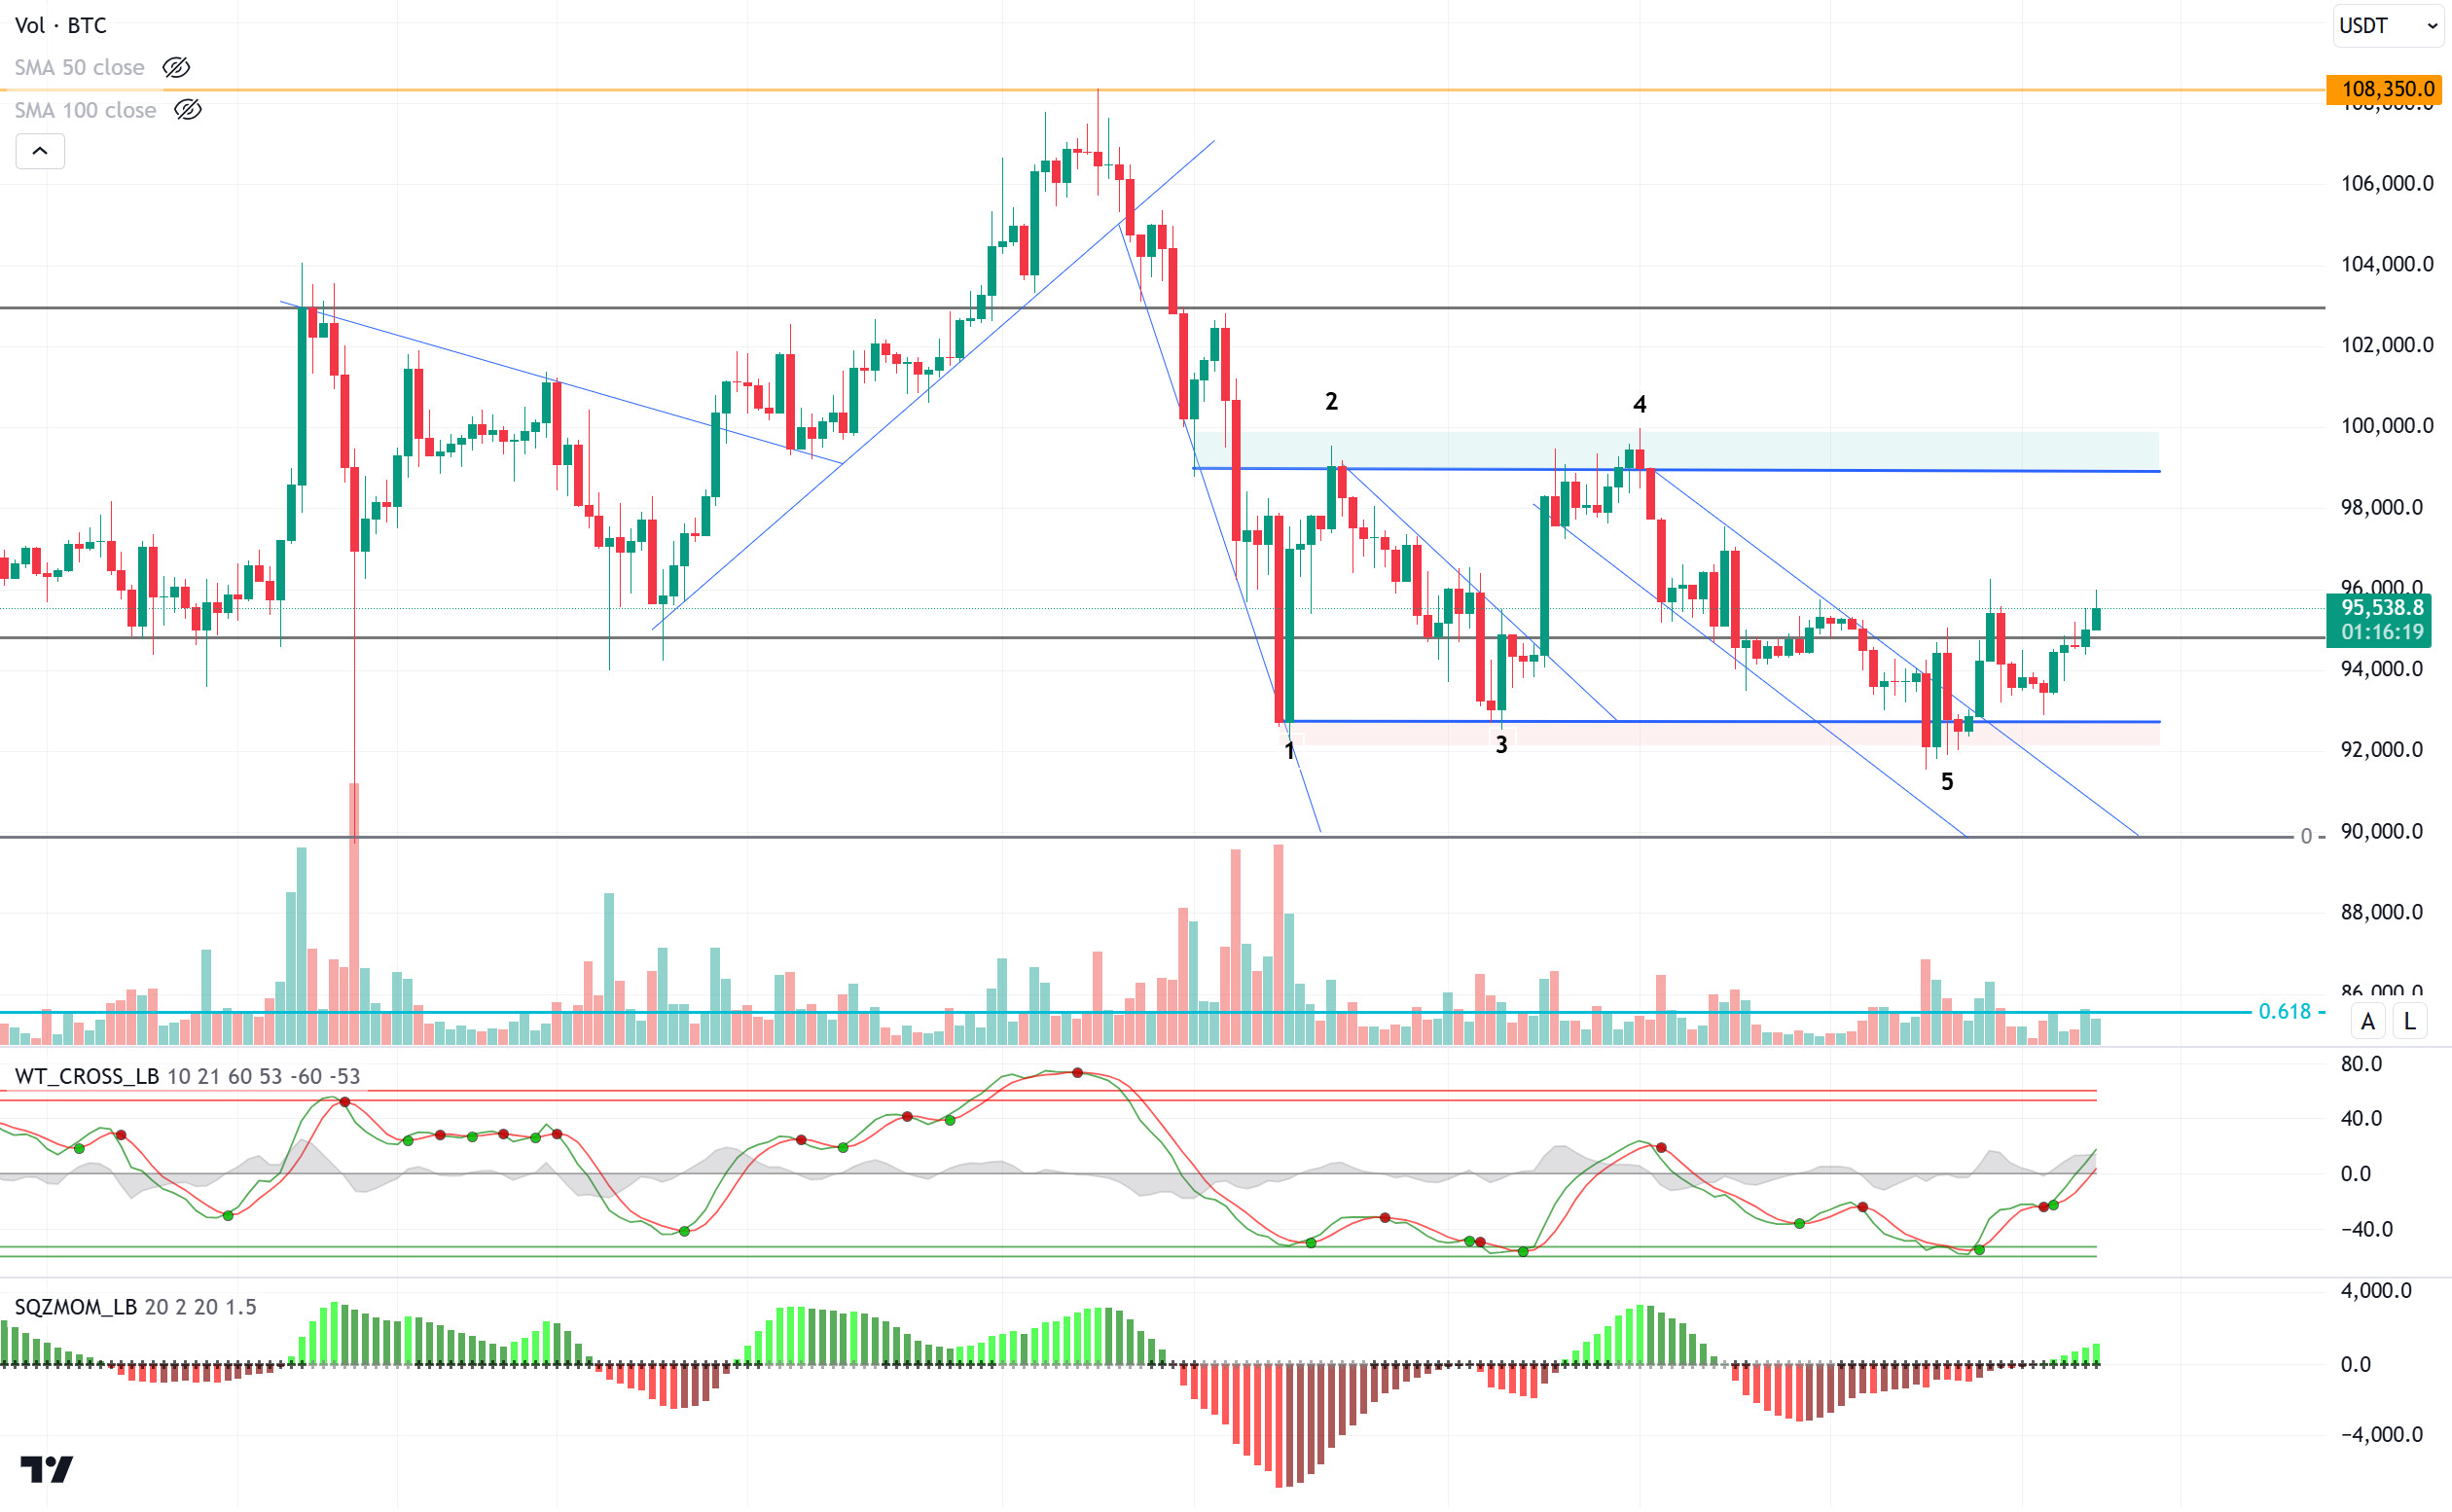
When we look at the technical outlook, BTC price retreated to 91,700 with the increased volatility in the last days of the year. In the falling minor trend structure, the breakthrough occurred with the crossing of the 92,800 zone and tested the 96,000 level. The price, which then fell back to 93,000, is currently pricing at 95,500, just above the 95,000 major resistance zone and the SMA 50-day lines. It is observed that technical oscillators maintain the buy signal and momentum indicator has moved back into the positive zone. In the continuation of the rise, closes above the 95,000 level will be taken into account, and first 97,200 and then 99,100 levels can be targeted again. In a possible pullback, pricing below the 95,000 level may bring the 92,800 level back to the agenda.
ETH/USDT
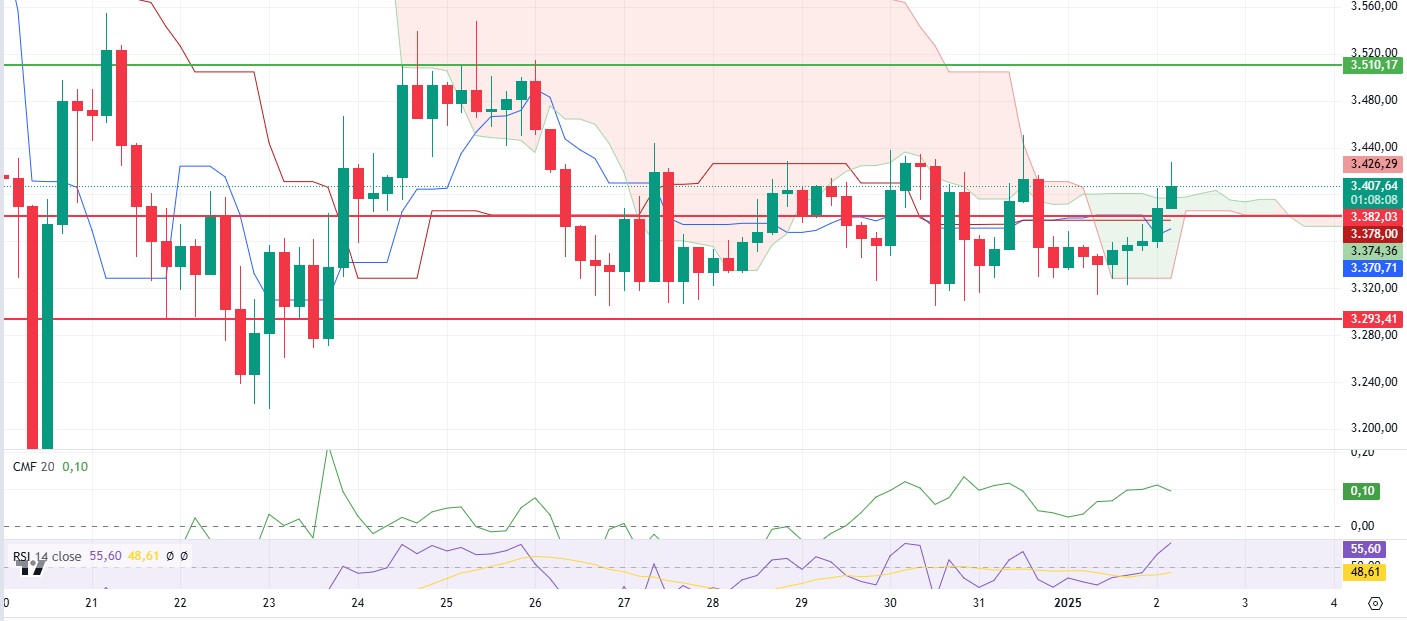
Ethereum (ETH) started the new year with a slight rise, and its price movements have caused some important signals in technical indicators. ETH, which retreated to $3,300 in the morning hours yesterday, recovered from this level and regained the $3,400 level.
When the Ichimoku indicator is analyzed, the price moving above the kumo cloud and closing above the tenkan and kijun levels offers a positive outlook. This suggests that the uptrend is supported and the market is creating a favorable backdrop for upward movements. While the Relative Strength Index (RSI) continues to gain upside momentum, there is a risk of negative divergence if it closes below the $3,412 level. This means that the uptrend may lose momentum and selling pressure may increase. The Chaikin Money Flow (CMF) indicator, on the other hand, indicates that capital flows are positive and the uptrend continues in a healthy manner . However, there has been a slight pullback in the last four hours, which may create some indecision on the market in the short term.
Ethereum’s persistence above the $3,400 level could support the continuation of the uptrend and pave the way for a move towards the next resistance level of $3,500. However, the potential negative divergence in the RSI and the weakening in momentum may increase the risk of a pullback to $3,300 if the price dips below $3,382.
Supports 3,382 – 3,293- 3,131
Resistances 3,510 – 3,670 – 3,841
XRP/USDT
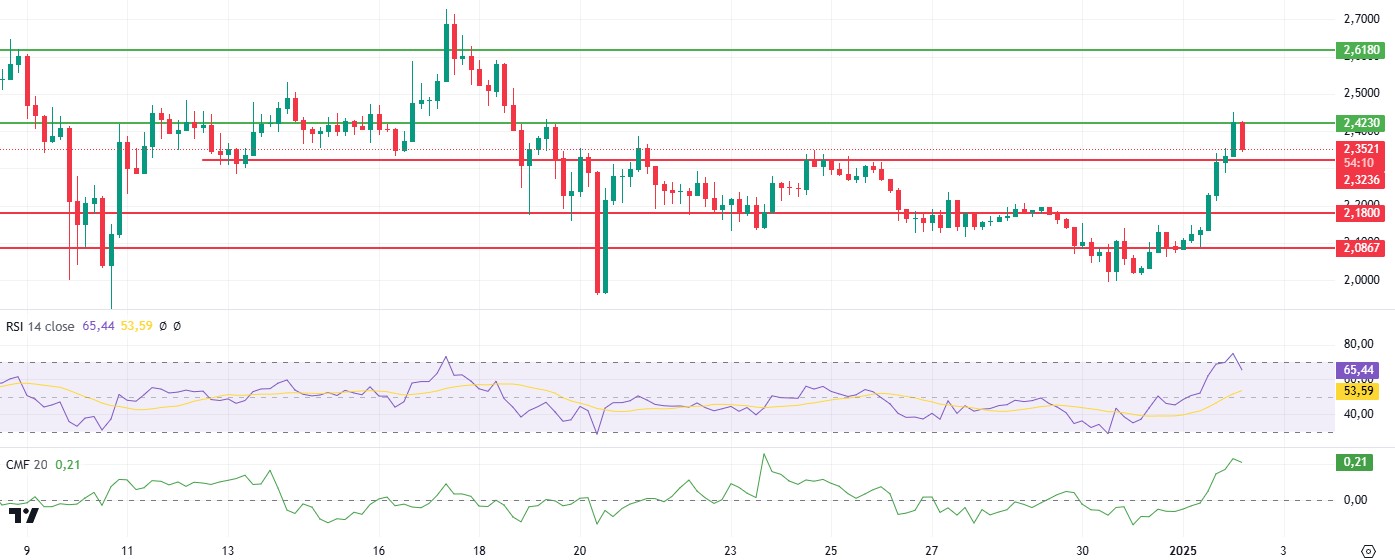
XRP surpassed the resistance at the $2.18 level with a strong bullish momentum that started yesterday and quickly rose to the $2.42 level. However, with the selling pressure it faced at this level, the price retreated to the $2.35 level.
The Chaikin Money Flow (CMF) indicator showed a rising momentum, reaching as high as 0.22, signaling a strong capital inflow into the market. However, this was followed by a negative divergence, suggesting that market momentum may weaken. The Relative Strength Index (RSI), on the other hand, entered the overbought zone with a healthy rise and then corrected slightly to exit it. This suggests that the market is in an indecisive state and is looking for direction.
These technical signals point to two possible scenarios for price action. According to the first scenario, if XRP can exceed the $2.42 level with volume after confirming this support with a re-test to the $2.32 level, the upward movement is likely to continue up to the $2.61 level. It is stated that the increase in trading volume will play a critical role in this scenario. In the second scenario, daily closes below the $2.32 support may increase selling pressure and cause the price to retreat to lower support levels, such as $2.18 or lower. In this case, the negative divergence in CMF may deepen further, signaling weakness on the market.
Supports 2.3236 – 2.1800 – 2.0867
Resistances 2.4230 – 2.6180 – 2.8528
SOL/USDT
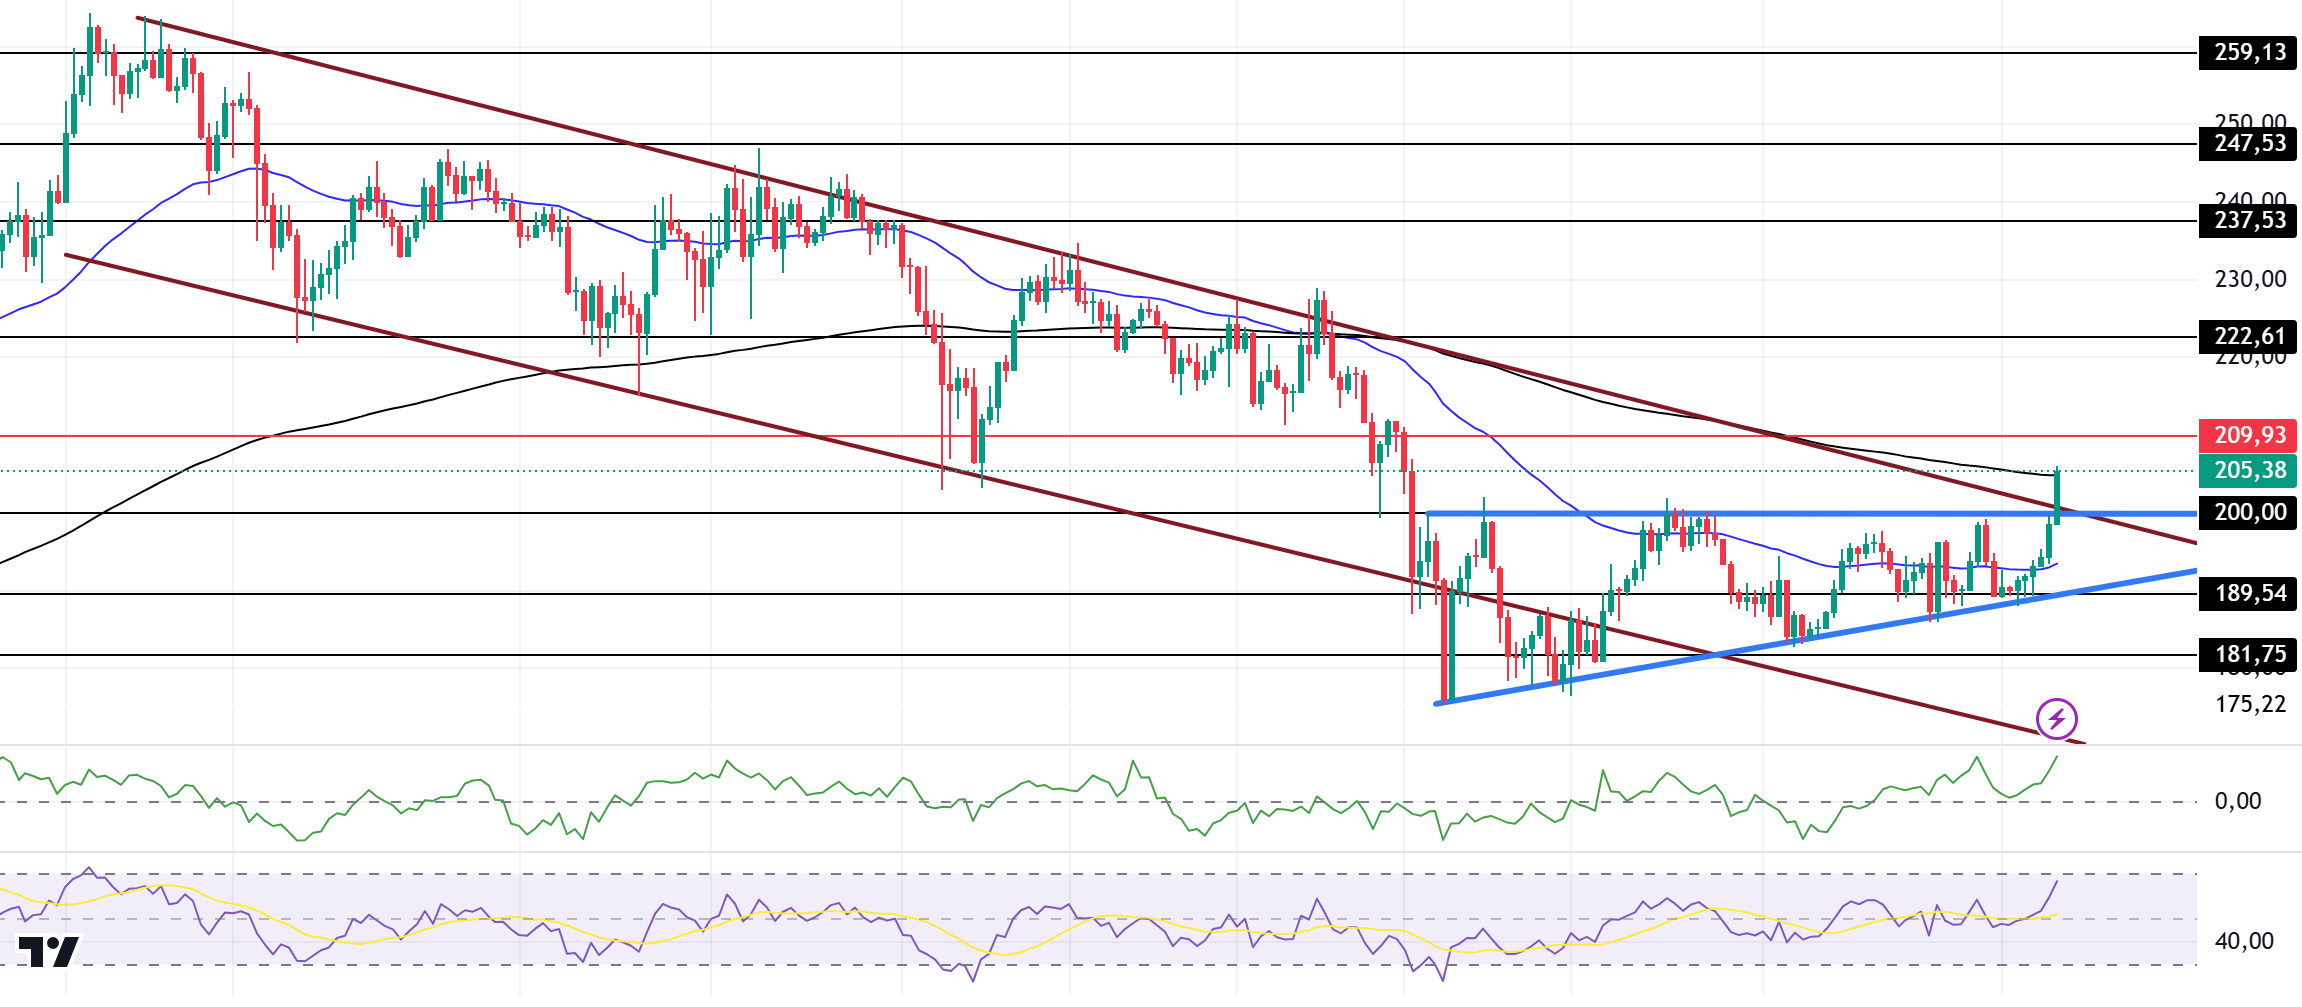
Nate Geraci, president of ETF Store, shared that spot Solana ETFs on the X platform are expected to be approved in 2025. In the last 24 hours, $9.50 million worth of SOL entered the exchanges. At the same time, volume continues to fall. This that traders are looking for the right entry range. According to Coinglass data, the SOL Long/Short ratio was 1.14 at press time, indicating a strong bullish sentiment among traders. On the other hand, Pump Fun in the ecosystem moved 120,000 SOLs to a private exchange. This raised the question, “Is a Sell Coming?
The LEFT has broken the ascending triangle pattern to the upside. This could be a bullish start. On the 4-hour timeframe, the 50 EMA (Blue Line) is below the 200 EMA (Black Line). The asset tested the 50 EMA resistance during the day and broke it to the upside to test the 200 EMA as resistance. At the same time, it broke the downtrend that has been going on since November 22nd to the upside and increased its momentum. When we examine the Chaikin Money Flow (CMF)20 indicator, it is in positive territory and money inflows are gradually increasing. However, the Relative Strength Index (RSI)14 indicator headed towards the overbought level. On the other hand, the 209.93 level stands out as a very strong resistance place in the rises driven by both the upcoming macroeconomic data and the news in the Solana ecosystem. If it breaks here, the rise may continue. In case of retracements for the opposite reasons or due to profit sales, the 163.80 support level can be triggered. If the price comes to these support levels, a potential bullish opportunity may arise if momentum increases.
Supports 200.00 – 189.54 – 181.75
Resistances 209.93 – 222.61 – 237.53
DOGE/USDT
The Dogecoin founder responded to Elon Musk’s X call by publishing a massive DOGE post. Currently, the asset is trading at $0.3314, up 4.61% in the last 24 hours. Market whales accumulated 300 million DOGE in the last 24 hours. This accumulation was recorded when the asset’s price fell to a record low of $0.3065. Dogecoin derivatives have seen notable activity recently, according to Coinglass data. Trading volume increased by 8% to $4 billion. Interest in options increased by 86% to $131 million. Open interest in options also increased by 58.82% to 336 thousand dollars.
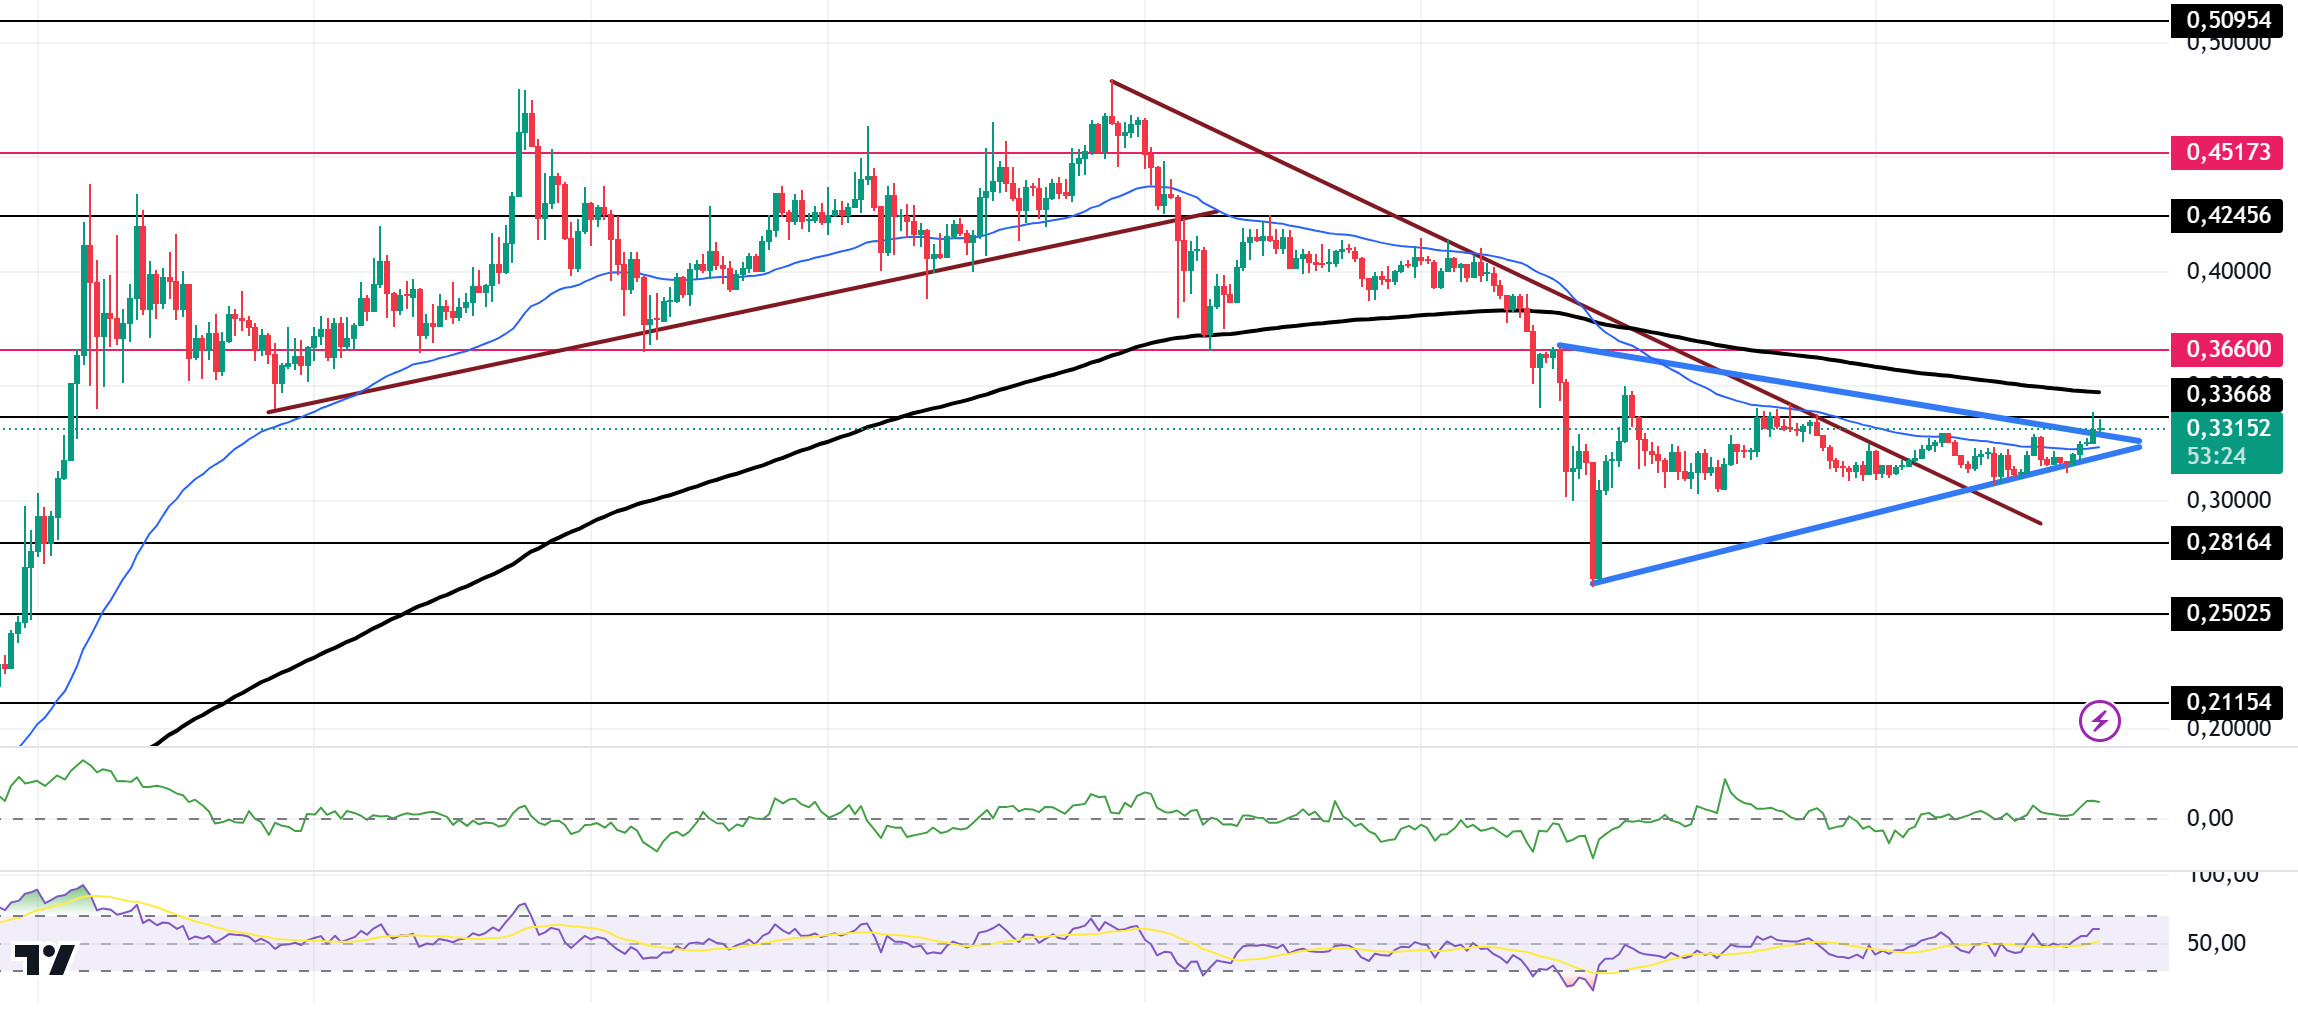
When we look at the chart, the asset, which has been moving horizontally since December 20, is gaining momentum and testing the resistance of 0.33668, the ceiling of the horizontal level. It is also testing the ceiling of the symmetrical triangle formation. If it breaks here, the rise may continue. The asset now has the momentum to test the 200 EMA (Black Line) as resistance. On the 4-hour timeframe, the 50 EMA (Blue Line) continues to be below the 200 EMA (Black Line). When we examine the Chaikin Money Flow (CMF)20 indicator, money outflows have increased, although it remains in positive territory. However, Relative Strength Index (RSI)14 is in positive territory. The 0.36600 level stands out as a very strong resistance point in the rises driven by both the upcoming macroeconomic data and the innovations in the Doge coin. If DOGE catches a new momentum and rises above this level, the rise may continue strongly. In case of possible pullbacks due to macroeconomic reasons or negativity in the ecosystem, the 0.25025 level, which is the base level of the trend, is an important support. If the price reaches these support levels, a potential bullish opportunity may arise if momentum increases.
Supports 0.28164 – 0.25025 – 0.21154
Resistances 0.33668 – 0.36600 – 0.42456
LEGAL NOTICE
The investment information, comments and recommendations contained herein do not constitute investment advice. Investment advisory services are provided individually by authorized institutions taking into account the risk and return preferences of individuals. The comments and recommendations contained herein are of a general nature. These recommendations may not be suitable for your financial situation and risk and return preferences. Therefore, making an investment decision based solely on the information contained herein may not produce results in line with your expectations.

