
MARKET SUMMARY
Latest Situation in Crypto Assets
| Assets | Last Price | 24h Change | Dominance | Market Cap. |
|---|---|---|---|---|
| BTC | 102,601.30 | 3.75% | 57.96% | 2,04 T |
| ETH | 3,190.15 | 3.33% | 10.96% | 385,01 B |
| XRP | 3.097 | 8.07% | 5.09% | 178,82 B |
| SOLANA | 239.38 | 5.05% | 3.32% | 116,67 B |
| DOGE | 0.3338 | 5.63% | 1.41% | 49,40 B |
| CARDANO | 0.9515 | 6.33% | 0.95% | 33,50 B |
| TRX | 0.2471 | 4.41% | 0.61% | 21,28 B |
| LINK | 24.22 | 4.09% | 0.44% | 15,45 B |
| AVAX | 34.07 | -0.31% | 0.40% | 14,03 B |
| SHIB | 0.00001916 | 6.73% | 0.32% | 11,27 B |
| DOT | 5.935 | 3.03% | 0.26% | 9,15 B |
*Prepared on 1.28.2025 at 07:00 (UTC)
WHAT’S LEFT BEHIND
US Senate Confirms Scott Bessant as Treasury Secretary
The US Senate confirmed Scott Bessant as Secretary of the Treasury with 68 votes in favor and 29 against. The Finance Committee had previously approved Bessant’s nomination by a vote of 16 in favor and 11 against.
OpenAI CEO Sam Altman: “DeepSeek-R1 is an Impressive Model”
Sam Altman welcomed the DeepSeek-R1 model developed by Chinese artificial intelligence startup DeepSeek on the social media platform and said that new competitors in the industry are exciting.
Trump: “DeepSeek should be a wake-up call for the US”
US President Donald Trump has described China’s low-cost approach to AI innovation as a “wake-up call”, saying US tech companies must maintain their dominance in AI.
Trump: We Hope For A Bidding War For TikTok
Trump said he hopes there will be a bidding war for TikTok and that Microsoft is currently in acquisition talks with TikTok.
Berachain-Based Royco Platform Goes Online
Berachain announced the launch of the Royco platform where users can deposit liquidity and earn rewards.
Number of Licensed Virtual Asset Platforms Increasing in Hong Kong
The Hong Kong Securities and Futures Commission has granted two new virtual asset licenses to PantherTrade and YAX, bringing the number of licensed platforms to 9. There are still 9 more platforms awaiting licenses.
Mysten Labs: Sui to Support Transactions via SMS
Mysten Labs co-founder Adeniyi announced that Sui will launch a new function that will support transactions via text message, DeFi payments and rewards.
Nvidia: DeepSeek Advances Require More Chips
Nvidia noted that China’s DeepSeek’s progress in AI models is driving chip demand and proving its practicality in the Chinese market. The company aims to supply more chips to meet the growing demand in the future.
HIGHLIGHTS OF THE DAY
Important Economic Calender Data
| Time | News | Expectation | Previous |
|---|---|---|---|
| Seedworld (SWORLD) | Vanguards Rebirth Launch Newsletter | ||
| Conflux (CFX) | Toronto Meetup | ||
| 13:30 | US Core Durable Goods Orders (MoM) (Dec) | 0.4% | -0.2% |
| 13:30 | US Durable Goods Orders (MoM) (Dec) | 0.3% | -1.2% |
| 14:00 | US S&P/CS Composite-20 HPI y/y (Nov) | 4.0% | 4.2% |
| 15:00 | US CB Consumer Confidence (Jan) | 105.7 | 104.7 |
INFORMATION
*The calendar is based on UTC (Coordinated Universal Time) time zone.
The economic calendar content on the relevant page is obtained from reliable news and data providers. The news in the economic calendar content, the date and time of the announcement of the news, possible changes in the previous, expectations and announced figures are made by the data provider institutions. Darkex cannot be held responsible for possible changes that may arise from similar situations.
MARKET COMPASS
DeepSeek effect continues in global markets. After US tech stocks, led by Nvidia, faced sharp selling yesterday, there is a similar outlook in Asia this morning, especially in Japan. The increased interest in China’s DeepSeek had caused the high costs of US artificial intelligence-themed companies to be questioned and stocks to be sold. In addition, one of the factors that contributed to the decline in risk appetite in the markets this morning was President Trump’s new statements on tariffs. The President stated that he thinks the universal tariff should be much higher than 2.5% and that Treasury Secretary Bessent, who was confirmed by the Senate, agrees.
Against this backdrop, index futures in Europe and the US are expected to open slightly lower. However, the recovery in digital assets, which started after the declines on Sunday, continued, albeit at a slow pace. This recovery, which was achieved despite the dollar appreciating with Trump’s new tariff threats and the low-risk appetite in global markets, may indicate that the rise may continue for a while in the short term. For this, the current agenda, Trump’s potential new statements, US macro indicators and the highly anticipated statements of the Federal Reserve (FED) tomorrow may be decisive.
From the short term to the big picture.
Trump’s victory on November 5, one of the main pillars of our bullish expectation for the long-term outlook in digital assets, produced a result in line with our predictions. In the process that followed, the appointments made by the president-elect and the increasing regulatory expectations for the crypto ecosystem in the US and the emergence of BTC as a reserve continued to take place in our equation as positive variables. Then, 4 days after the new President took over the White House, he signed the “Cryptocurrency Working Unit” decree, which was among his election promises, and we think that the outputs it will produce in the coming days will continue to reflect positively on digital assets.
On the other hand, although it is expected to continue at a slower pace, the expectations that the FED will continue its interest rate cut cycle (for now) and the fact that the volume in ETFs based on crypto assets indicates an increase in institutional investor interest support our upward forecast for the big picture for now. In the short term, given the nature of the market and pricing behavior, we think it would not be surprising to see occasional pause or pullbacks in digital assets. However, at this point, it is worth emphasizing again that we think that the fundamental dynamics continue to support the rise.
TECHNICAL ANALYSIS
BTC/USD
The rise of Chinese artificial intelligence company DeepSeek has led to billions of dollars in losses in the shares of Nvidia, one of the biggest US tech giants. US President Donald Trump said on Monday that DeepSeek’s sudden rise “should serve as a warning to American technology companies.” Losses in Bitcoin-related technology and mining companies caused a sharp pullback in Bitcoin at the beginning of the week. As a result, $457 million was outflows from Bitcoin spot ETFs in the US, ending a seven-day positive streak.
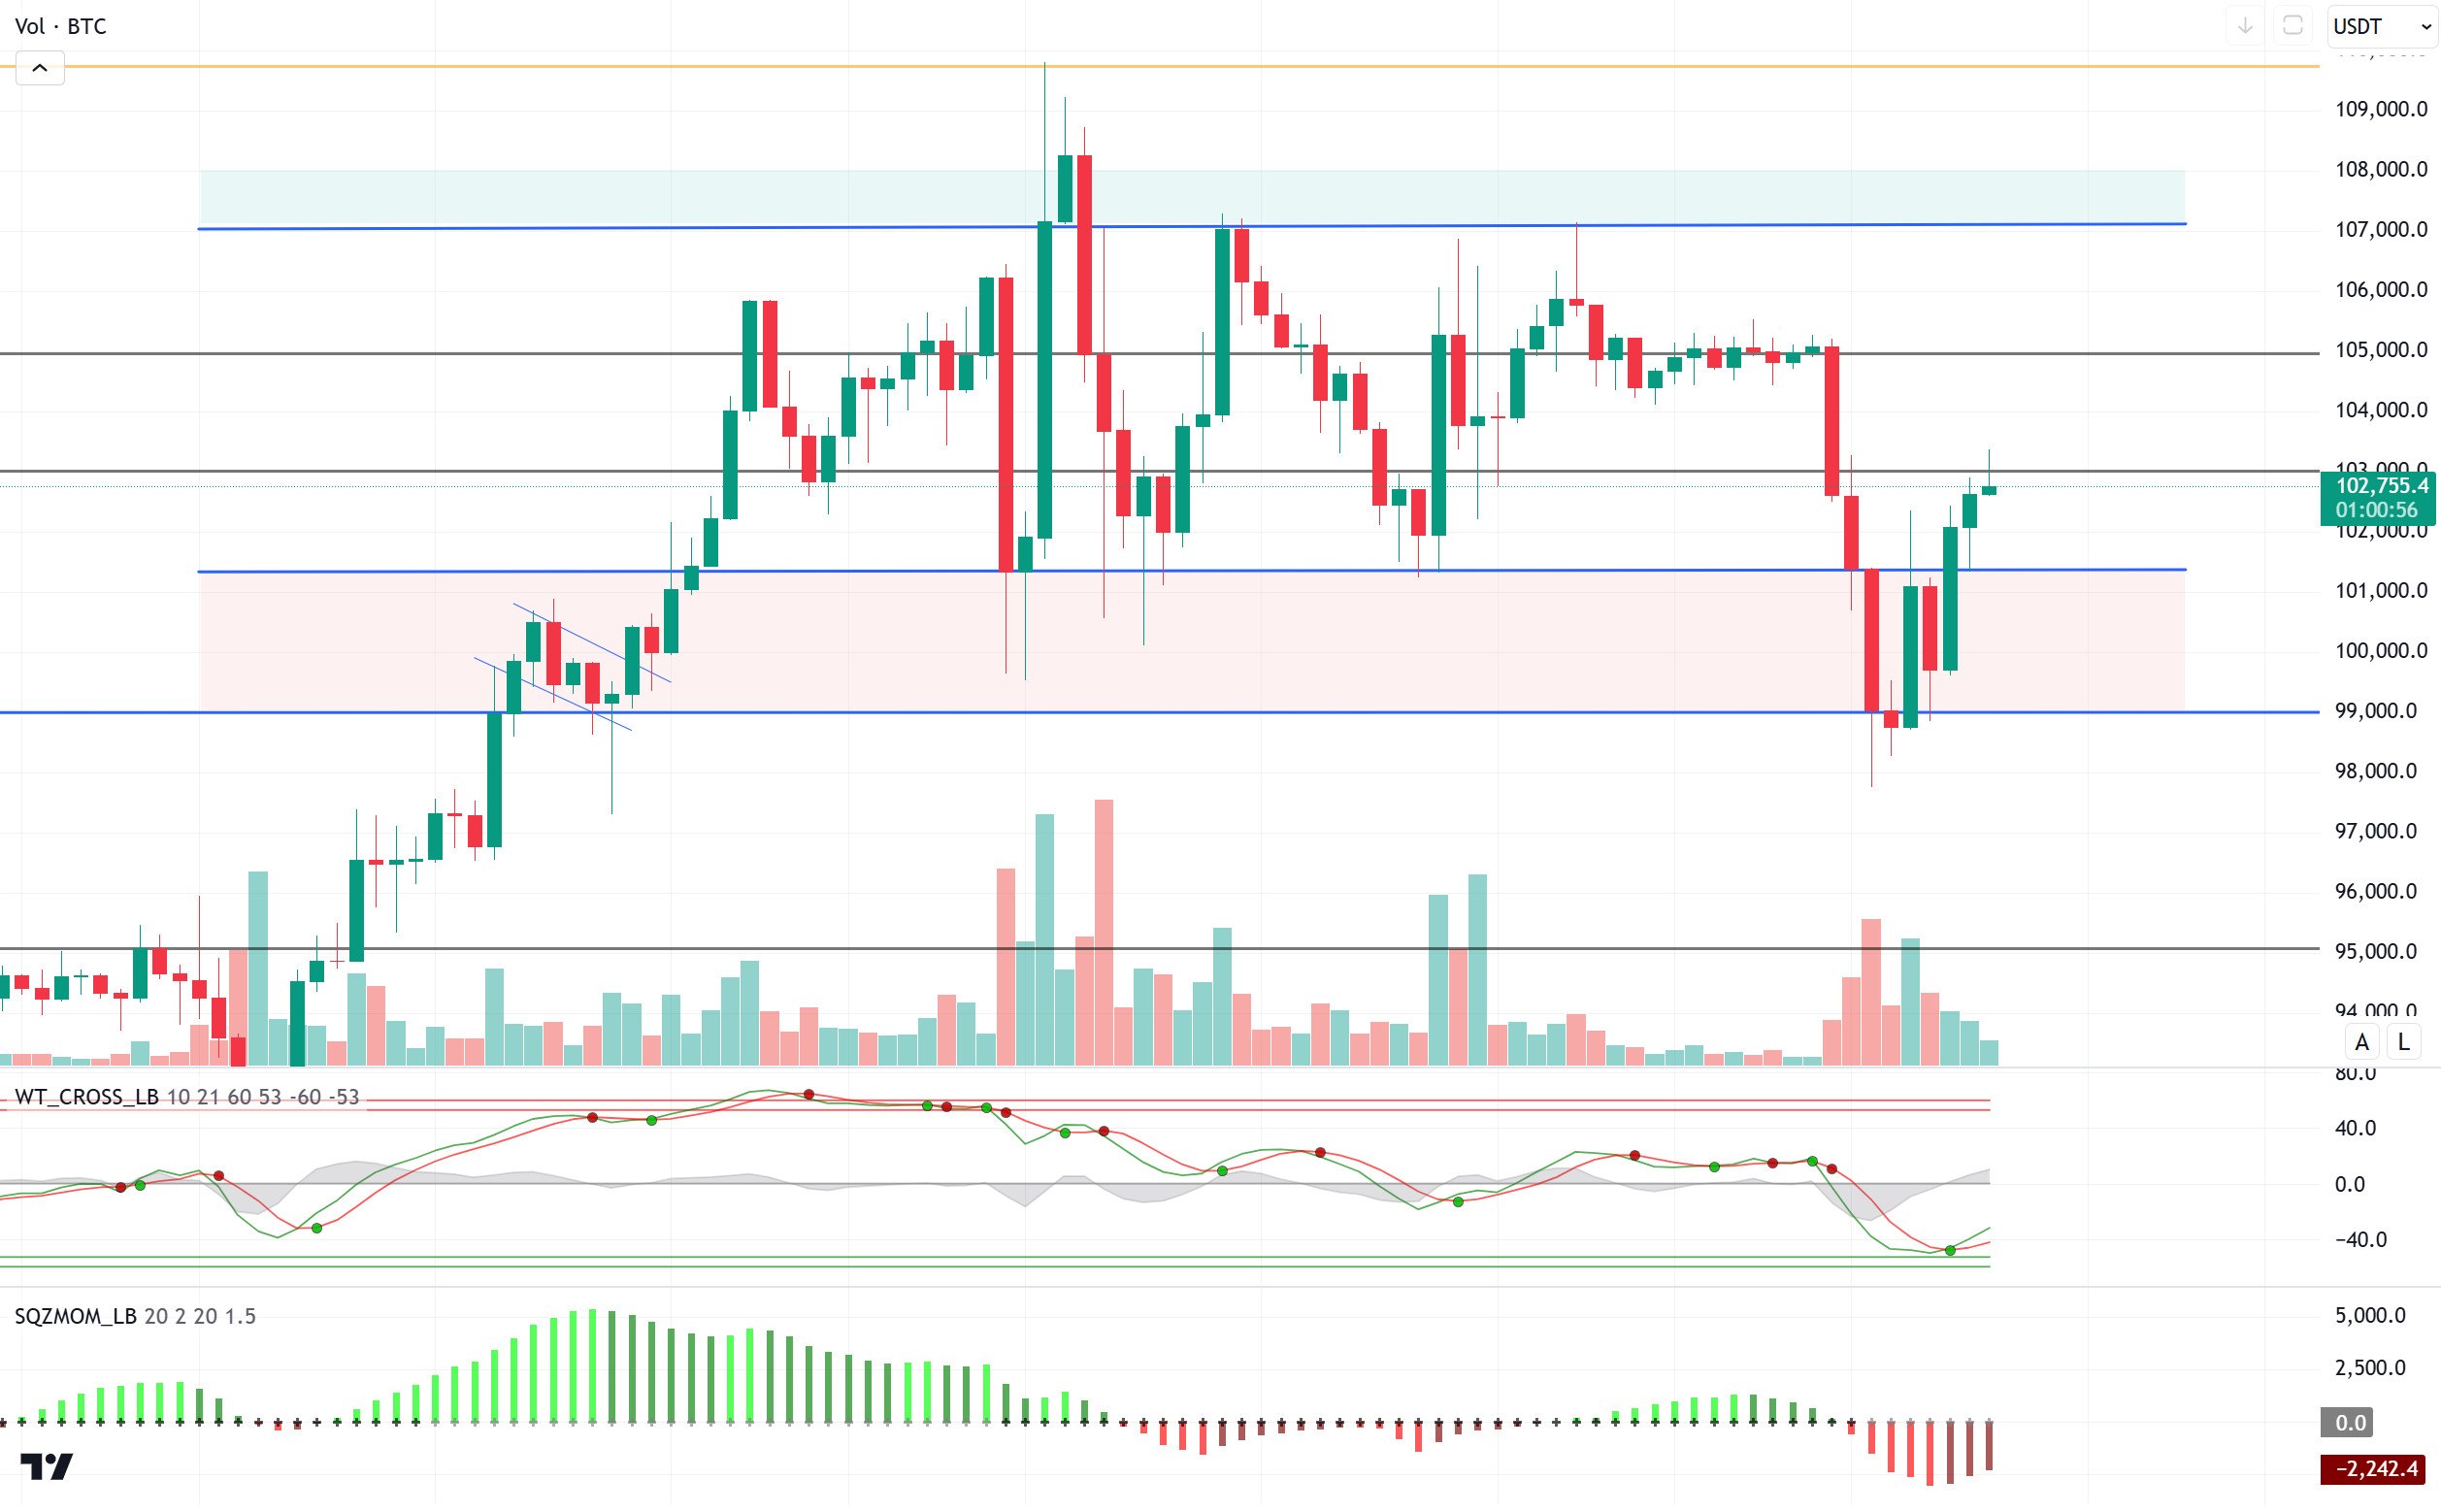
When we look at the technical outlook with all these developments, BTC, which fell to 97,700 on the first day of the week, is starting to recover again. The price, which tested the resistance level of 101,400 several times, managed to exceed this level and reached the next resistance level of 102,800. In BTC, which is currently trading at 102,700, the momentum indicator signaled a rebound yesterday as technical oscillators started to give a buy signal in the oversold zone. In the continuation of the rise, closures above the 103,000 level will be followed and the 105,000 level may reappear as a target. In a possible new wave of selling, we will follow the 101,400 level as a reference point to stay in the positive zone.
Supports 101,400 – 99,100 – 98,000
Resistances 103,000 – 105,000 – 107,000
ETH/USDT
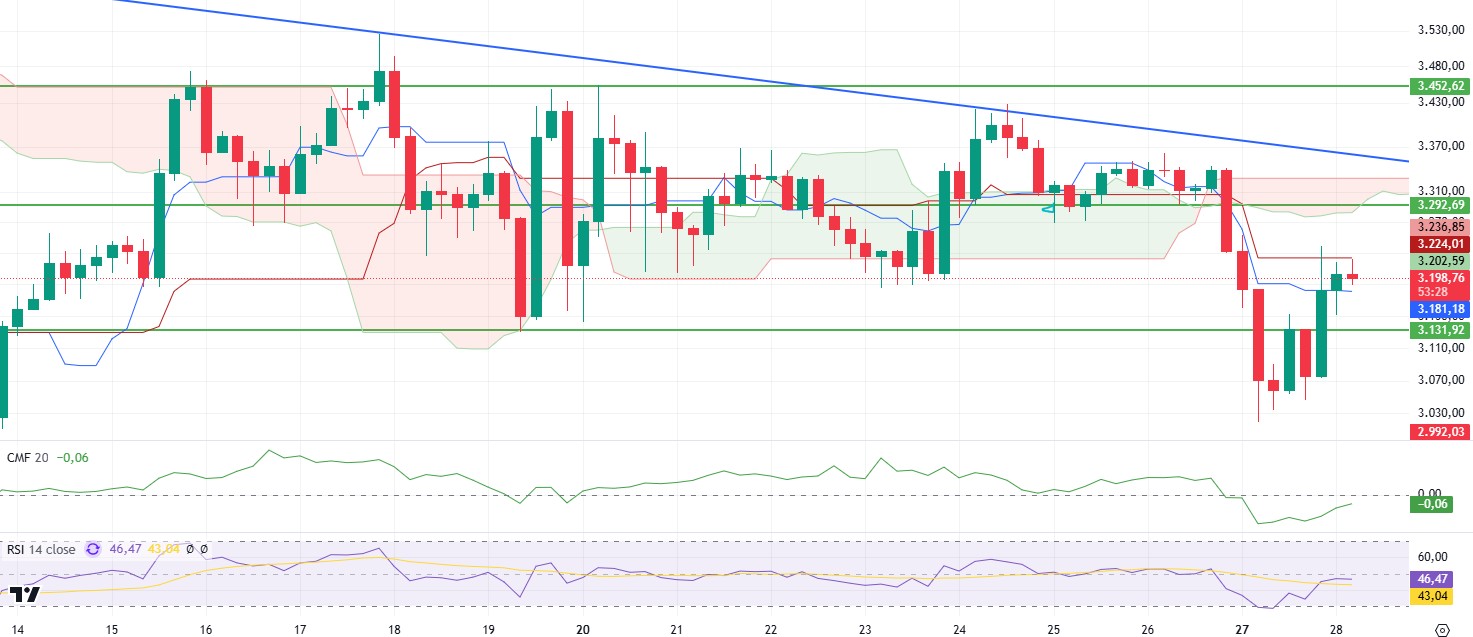
ETH, which broke the 3,131 support and retreated to 3,020 after the decline on Monday morning, regained the 3,131 level shortly afterwards and with the momentum from this level, it has risen to 3,200 levels.
When technical indicators are analyzed, the upward trend of the Chaikin Money Flow (CMF) indicator can be considered as a positive sign. However, CMF is still in negative territory, indicating that buyers have not fully dominated the market. The Relative Strength Index (RSI) entered the oversold zone with the decline and then quickly recovered and displayed an upward movement. The fact that no negative divergence was observed during this recovery can be interpreted as a positive situation in terms of sensitivity to price action. Looking at the Ichimoku indicator, ETH regained the tenkan level, but was rejected from the kijun level. In addition, the overlap of the kumo cloud with the trend line has led to the area between 3,292 – 3,350 becoming a strong resistance point. This area stands out as a critical threshold in the upside movement of the price.
As a result, technical indicators do not paint a negative picture at the moment, but suggest that sufficient conditions for the sustainability of an upward trend have not yet been created. The price first needs to overcome the kijun resistance at 3,223. In case of a sustainability above this level, an upside potential may arise up to the 3,292 – 3,350 region. However, it seems quite challenging to overcome this resistance zone with the current market data. In downward movements, the 3,131 level should be monitored as the most important support point. A downside break of this level may cause the price to retrace back down to the 2,992 levels.
Supports 3,131 – 2,992 – 2,890
Resistances 3,292 – 3,350 – 3,452
XRP/USDT
After the slight recovery of the markets yesterday and in the morning hours, XRP has re-established a positive trend as expected. With the price exceeding the 2.98 level, it is seen that it quickly reached the 3.10 resistance level and even momentarily pinned up to the sand cloud resistance above this region.
Chaikin Money Flow (CMF), which started to rise again with this price action, has retreated slightly with selling pressure from the kumo cloud. Although the Relative Strength Index has risen considerably and strengthened a positive structure, the closures of the price under the kumo cloud may bring hidden negative divergence and slight pullbacks may occur.
In summary, although there is a positive outlook, closures below the kumo cloud may bring slight pullbacks during the day. However, if the price exceeds the upper band of the kumo cloud, it may strengthen the positive trend and bring rises towards higher resistance levels.
Supports 2.9851 – 2.7268 – 2.4727
Resistances 3.1053 – 3.2927- 3.3854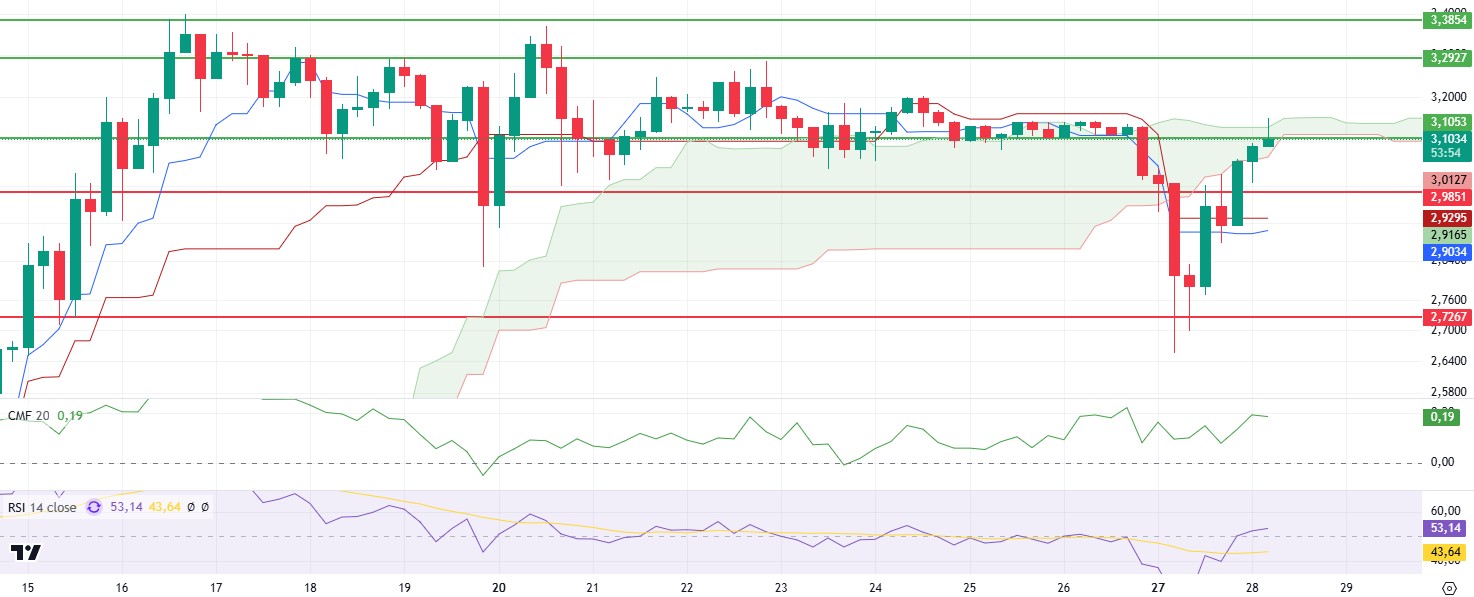
SOL/USDT
Solana-Based Social-Fi Protocol Tribe.Run Launches Friend Tech-inspired social-fi protocol allows users to buy and sell access to token-gated chats on Solana. As for Onchainde, Solana’s blockchain has issued $11 billion worth of stablecoins, led by major players like USDC and USDT, according to data from Defillama.
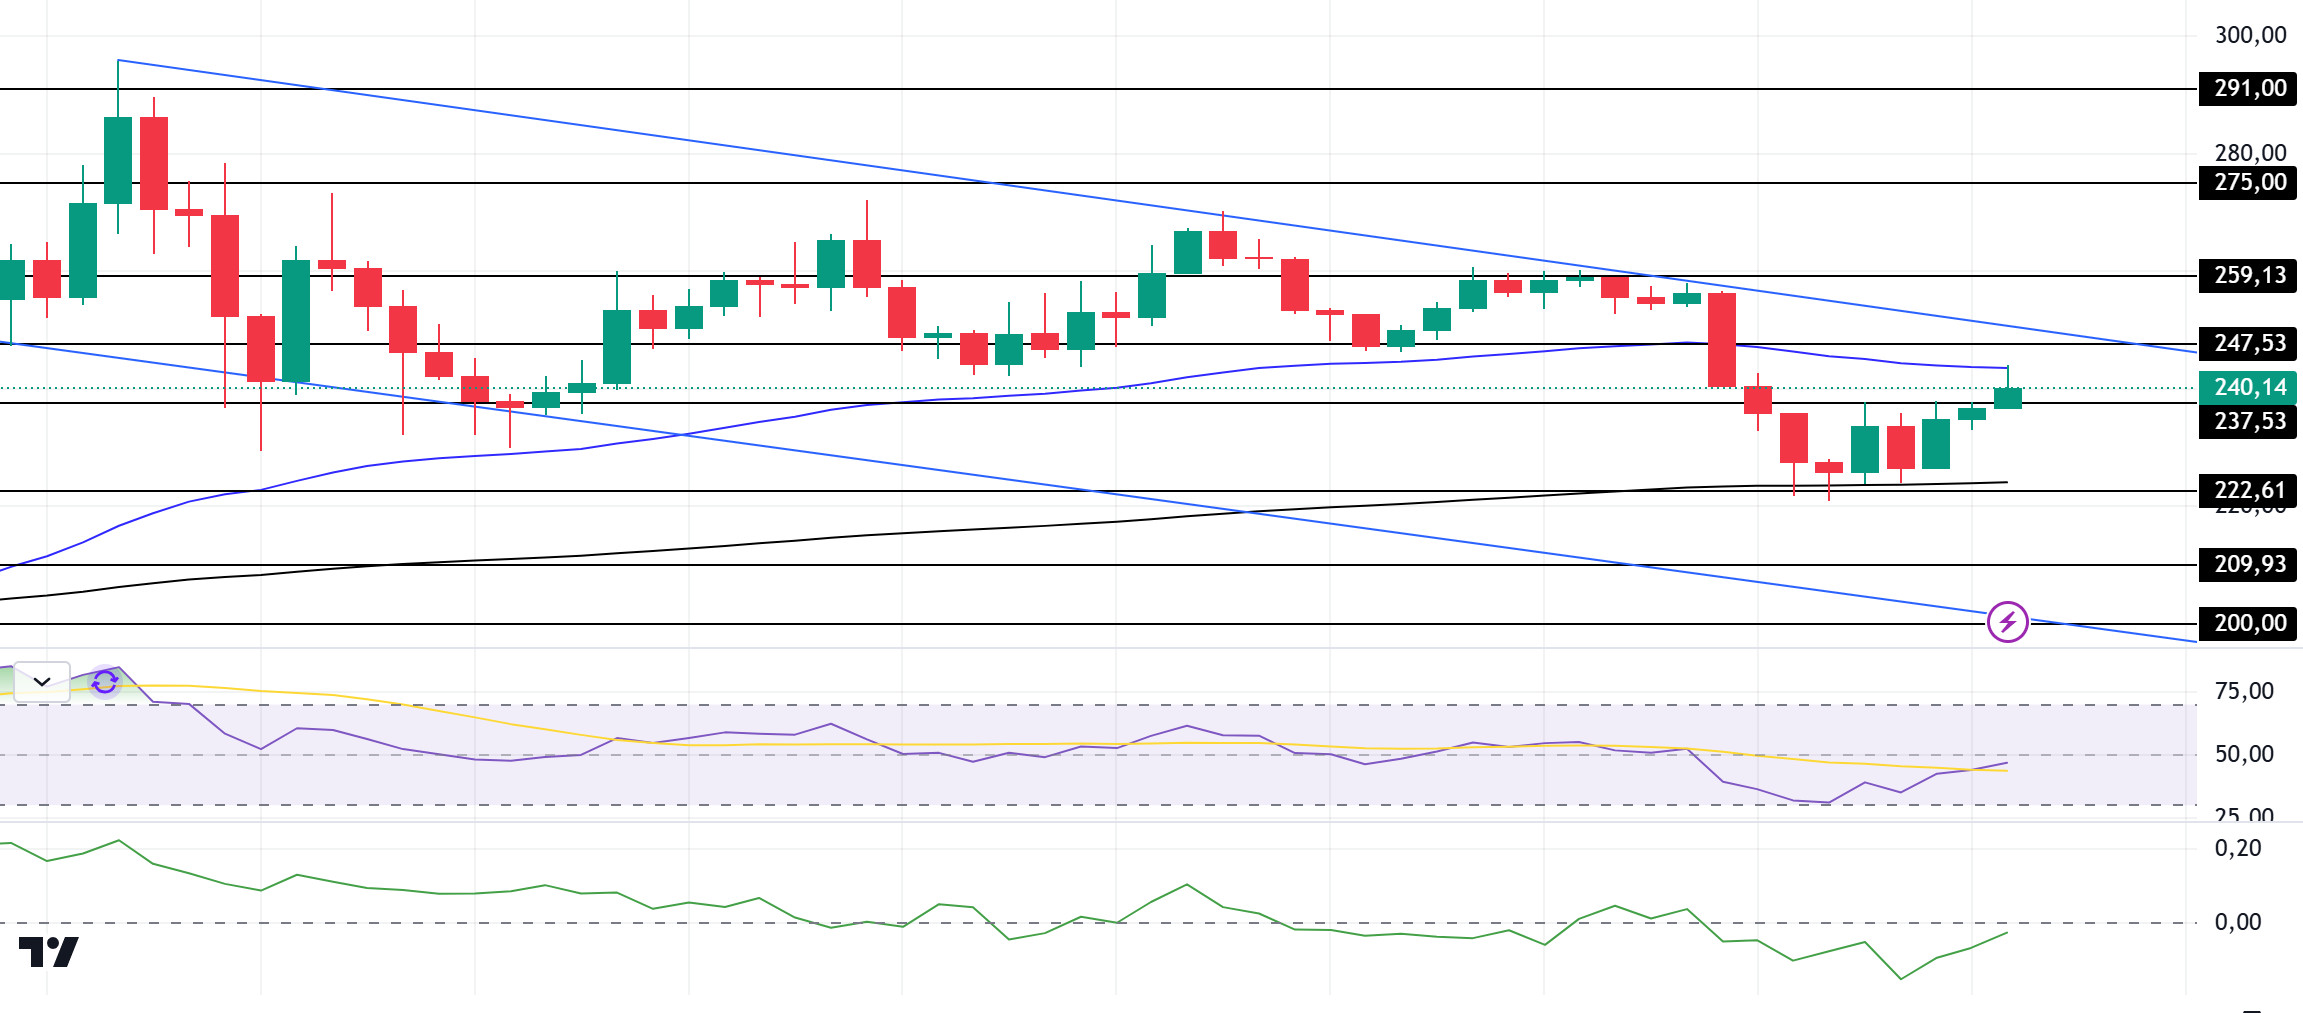
SOL continues to maintain the downtrend that started on January 19, pricing in the middle zone of the downtrend. The asset turned bullish after taking support from the 200 EMA. On the 4-hour timeframe, the 50 EMA (Blue Line) continues to be above the 200 EMA (Black Line). This could mean that the uptrend will continue in the medium term. At the same time, the asset is between the 50 EMA and the 200 EMA, and at the time of writing, the 50 EMA is acting as resistance to the asset. This could cause the price to fall again. When we examine the Money Flow (CMF)20 indicator, it came from the negative zone to the middle levels of the neutral zone and money outflows are decreasing. However, the Relative Strength Index (RSI)14 indicator has risen from the oversold zone to the neutral zone levels. This can be seen as an opportunity for a sell trade. The 259.13 level stands out as a very strong resistance point in the rises driven by both the upcoming macroeconomic data and the news in the Solana ecosystem. If it breaks here, the rise may continue. In case of retracements for the opposite reasons or due to profit sales, the 209.93 support level can be triggered. If the price reaches these support levels, a potential bullish opportunity may arise if momentum increases.
Supports 222.61 – 209.93 – 200.00
Resistances 237.53 – 247.43 – 259.13
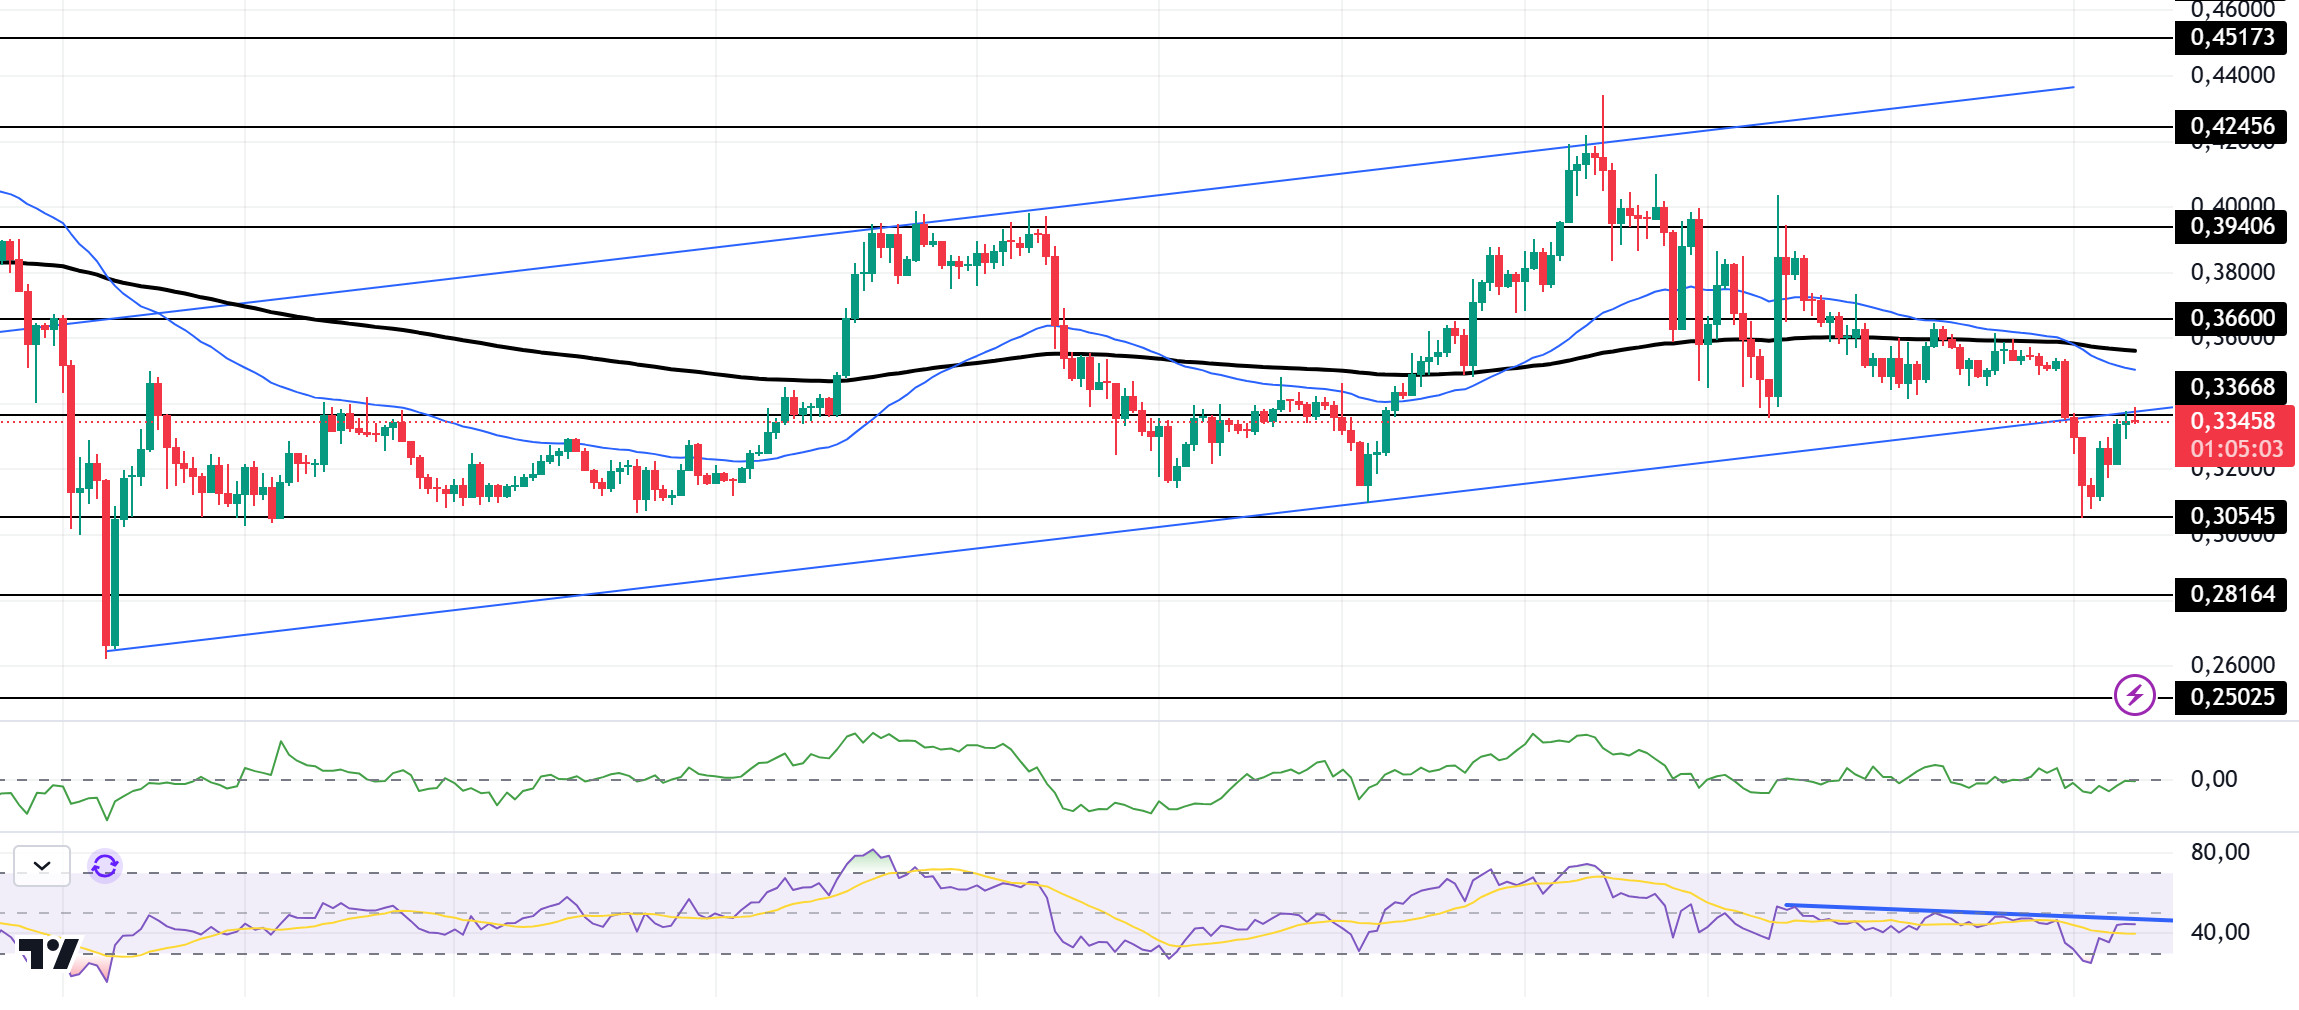
DOGE/USDT
Data from Coinglass showed that central exchanges have seen $72 million worth of DOGE outflows in the last 48 hours. Additionally, in the last 24 hours, the data reveals that 48.43% of traders currently hold long positions while 51.57% hold short positions.
DOGE has been bullish since our analysis yesterday. On December 20th, the asset broke the uptrend it started with a strong downside candle and at the time of writing, it is testing the base level of the uptrend as resistance. On the 4-hour timeframe, the 50 EMA (Blue Line) is now below the 200 EMA (Black Line). This could mean that the decline could deepen in the medium term. At the same time, the price is below the 50 EMA (Blue Line) and the 200 EMA (Black Line). The Chaikin Money Flow (CMF)20 indicator moved from negative to positive territory and money inflows and outflows seem to be in balance. However, Relative Strength Index (RSI)14 is at the neutral level from the oversold zone. At the same time, the RSI indicator is testing the resistance of the downtrend. The 0.39406 level appears to be a very strong resistance point in the rises due to political reasons, macroeconomic data and innovations in the DOGE coin. In case of possible pullbacks due to political, macroeconomic reasons or negativities in the ecosystem, the 0.28164 level, which is the base level of the trend, is an important support. If the price reaches these support levels, a potential bullish opportunity may arise if momentum increases.
Supports 0.30545 – 0.28164 – 0.25025
Resistances 0.33668 – 0.36600 – 0.39406
LEGAL NOTICE
The investment information, comments and recommendations contained herein do not constitute investment advice. Investment advisory services are provided individually by authorized institutions taking into account the risk and return preferences of individuals. The comments and recommendations contained herein are of a general nature. These recommendations may not be suitable for your financial situation and risk and return preferences. Therefore, making an investment decision based solely on the information contained herein may not produce results in line with your expectations.
