
MARKET SUMMARY
Latest Situation in Crypto Assets
| Assets | Last Price | 24h Change | Dominance | Market Cap |
|---|---|---|---|---|
| BTC | 96,496.80 | 1.13% | 56.20% | 1,91 T |
| ETH | 3,441.42 | 1.07% | 12.19% | 414,73 B |
| XRP | 2.442 | 3.96% | 4.12% | 140,24 B |
| SOLANA | 207.80 | 1.29% | 2.95% | 100,36 B |
| DOGE | 0.3384 | 2.29% | 1.47% | 49,93 B |
| CARDANO | 1.0384 | 11.97% | 1.07% | 36,46 B |
| TRX | 0.2631 | 2.10% | 0.67% | 22,68 B |
| AVAX | 39.71 | 2.90% | 0.48% | 16,29 B |
| LINK | 21.95 | -0.29% | 0.41% | 14,02 B |
| SHIB | 0.00002269 | 2.89% | 0.39% | 13,39 B |
| DOT | 7.239 | 1.60% | 0.33% | 11,14 B |
*Prepared on 1.3.2025 at 07:00 (UTC)
WHAT’S LEFT BEHIND
China to Require Banks to Report Cryptocurrency
China’s foreign exchange regulator has mandated banks to report details of risky transactions, including cryptocurrency transactions. The new rules could lead to a significant drop in crypto investments and cross-border payments.
Do Kwon Denies Money Laundering Charges
Do Kwon, founder of Terraform Labs, has been indicted by the U.S. Court for the Southern District of New York on a money laundering conspiracy charge. The indictment alleged that Do Kwon conspired to facilitate transactions in excess of $10,000 despite being aware of illegal proceeds. Kwon denied all charges in court.
T3 Financial Crimes Unit Freezes 100 Million USDT in Tron
The T3 Financial Crimes Unit (T3 FCU), a collaboration between Tether, TRON and TRM Labs, froze a total of 100 million USDT used in illegal transactions on the Tron network.
MetaPlanet Plans to Hold More Than 10,000 Bitcoins by 2025
Japanese hotel chain MetaPlanet aims to reach a total of 10,000 BTC by 2025, according to CoinDesk Japan. The company had about 1,762 BTC ($262 million) as of the end of 2024 and aims to become one of the largest Bitcoin holders in the world.
Uniswap V4 Release Postponed
Uniswap V4, the new version of the decentralized exchange Uniswap, failed to make its planned Q3 2024 launch. Announced in 2025 as “coming soon”, no firm release date has yet been given. The platform was in testing throughout 2024.
HIGHLIGHTS OF THE DAY
Important Economic Calender Data
| Time | News | Expectation | Previous |
|---|---|---|---|
| – | Bitcoin Genesis Day: “Satoshi Nakamoto mined the Genesis Block” | – | – |
| – | SUNDOG: Token Airdrop | – | – |
| 15:00 | US ISM Manufacturing PMI (Dec) | 48.2 | 48.4 |
| 16:00 | FOMC Member Barkin Speaks | – | – |
INFORMATION
*The calendar is based on UTC (Coordinated Universal Time) time zone.
The economic calendar content on the relevant page is obtained from reliable news and data providers. The news in the economic calendar content, the date and time of the announcement of the news, possible changes in the previous, expectations and announced figures are made by the data provider institutions. Darkex cannot be held responsible for possible changes that may arise from similar situations.
MARKET COMPASS
Wall Street indices, which made a good start to the new year yesterday, could not maintain their intraday gains and closed the first trading day of the year in negative territory. Tesla’s sales results did not satisfy investors, expectations that the US Federal Reserve (FED) will be more cautious in interest rate cuts and the uncertainty that will arise in policies with the Trump administration were the main dynamics that set the ground for negative sentiment. While the dollar index remains strong, Asian stock markets are mixed this morning. European indices, which diverged positively yesterday, are expected to start the new day horizontally positive.
In yesterday’s analysis for digital assets, we stated that there is room for short-term upward movements, but that they may be limited and that major cryptocurrencies may see pressure afterwards. We see that this price behavior is being followed for now. After the pullbacks continue for a while, we think we will see a pre-bullish stabilization in prices this time. It would not be wrong to say that volumes will converge to normal next week due to the New Year’s holiday, and before that, prices may continue their horizontal course.
When we look at the global dynamics that may have an impact on asset prices, market concentration will remain in the same area today after the better-than-expected US macro indicators yesterday. ISM Manufacturing PMI data will be under the spotlight of investors and Federal Open Market Committee (FOMC) member Barkin’s assessments will be closely monitored.
From the short term to the big picture.
The victory of former President Trump on November 5, which was one of the main pillars of our bullish expectation for the long-term outlook in digital assets, produced a result in line with our predictions. Afterwards, the appointments made by the president-elect and the expectations of increased regulation of the crypto ecosystem in the US continued to be a positive variable in our equation. Although it is expected to continue at a slower pace, the FED’s signal that it will continue its interest rate cut cycle and the volume in crypto asset ETFs indicating an increase in institutional investor interest (in addition to MicroStrategy’s BTC purchases, BlackRock’s BTC ETF options start trading…) support our upward forecast for the big picture for now. In the short term, given the nature of the market and pricing behavior, we think it would not be surprising to see occasional pauses or pullbacks in digital assets. However, at this point, it is worth emphasizing again that the fundamental dynamics continue to be bullish.
TECHNICAL ANALYSIS
BTC/USDT
Today marks the 16th anniversary of the first Bitcoin Genesis Block mined by Satoshi Nakamoto on January 3, 2009, a historic milestone for Bitcoin. The first Genesis Block was created with a reward of 50 BTC. It’s been 16 years since that momentous event, and today the total block height on the Bitcoin blockchain has reached 877,566. Another important development of the day is that the bankrupt FTX exchange will start its payments with stablecoin today.
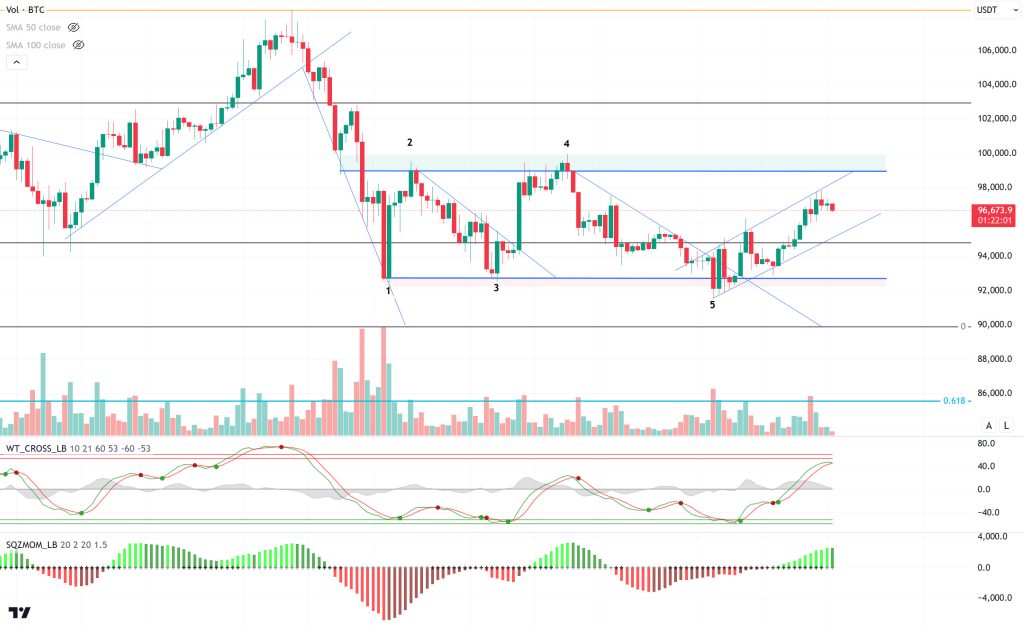
Looking at the technical outlook, BTC continues to be priced within the rising trend channel. With the rectangular formation formed, BTC, which tested resistance levels 2 and 4 from support levels 1 and 3, managed to bounce back even though it broke out of the formation with the 5th support level. In the continuation of the rise, the 99,100 level may be the level we expect to be our 6th point in the formation. The price, which reached the 97,700 level in the channel yesterday, retreated a little and is currently trading at 96,600. We can say that the technical oscillators have reached the overbought zone, the momentum indicator has started to weaken, in case of a possible sell signal during the day, we will follow the 95,500 level, which is our channel bottom line.
Supports 95,000 – 92,800 – 90,000
Resistances 97,200 – 99,100 – 101,400
ETH/USDT
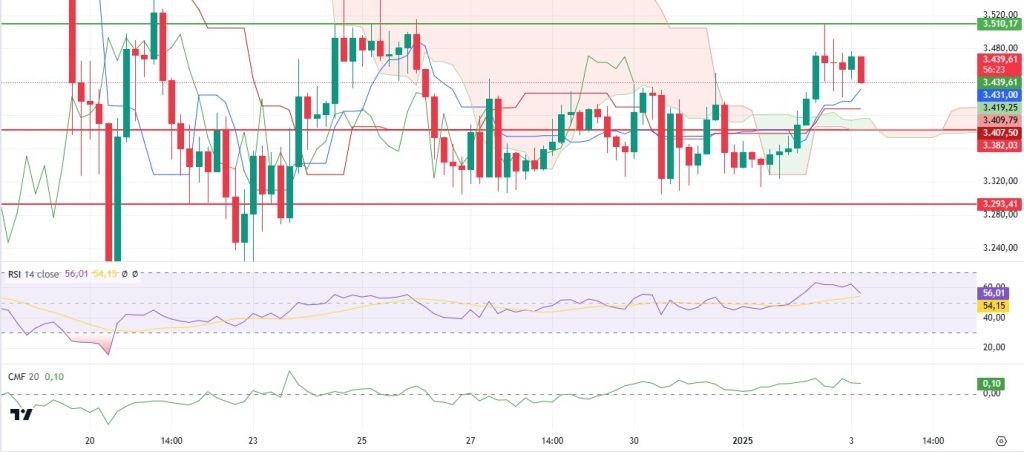
Ethereum managed to reach the 3,510 level with its strong bullish movement yesterday. However, selling pressure from this important resistance point caused the price to retreat again. In terms of the overall market, demand is not yet sufficient and buyers are still hesitant on the spot side. Cumulative Volume Delta (CVD) data also supports this, as volume growth has not reached the expected levels.
Looking at technical indicators, the Relative Strength Index (RSI) remains above its moving average, suggesting that upside momentum is still intact. However, the Chaikin Money Flow (CMF) indicator is showing a sideways movement in positive territory, suggesting that fund inflows into the market are continuing but not gaining significant strength. These indicators suggest that Ethereum is in the midst of a short-term correction and the market is too indecisive to determine its direction.
Focusing on price levels, the 3,407 level stands out as a prominent support point. This level has the potential to provide strong reaction buying due to its intersection with the Kijun line. Further down, the 3,382 level should be monitored as a critical support. In case of a decline below this level, it seems likely that selling pressure will increase and a deeper downtrend will be triggered. On the other hand, exceeding the 3.510 resistance is key for the upside to continue. Persistence above this level may pave the way for new highs to be targeted. In the short term, the possibility of a limited pullback in Ethereum price should not be ruled out. However, if a strong reaction comes from the 3,407 level, the bullish movement can be expected to gain momentum again. On the other hand, a break below 3,382 may bring a sharper downward wave in the market.
Supports 3,382 – 3,293- 3,131
Resistances 3,510 – 3,670 – 3,841
XRP/USDT
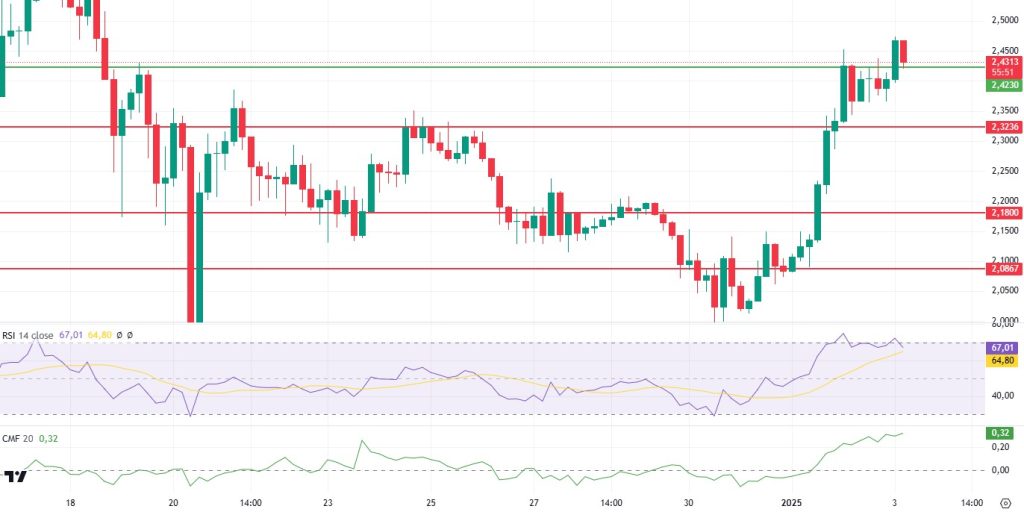
XRP managed to break the critical 2.42 level on strong volume yesterday morning and continued its uptrend. Following this move, a retest towards the 2.42 level seems to have taken place. This dynamic in the market indicates that buyers are willing to defend the relevant level.
The Chaikin Money Flow (CMF) indicator continues its upward trend, showing that fund inflows continue. This can be considered as an important signal supporting XRP’s bullish potential. On the other hand, the Relative Strength Index (RSI) is trending sideways close to the overbought zone . The fact that the RSI is in this region indicates some risk of a sideways movement or correction in the short term, but it also shows that strong buyer interest continues.
In light of the technical analysis data, the 2.42 level remains a key support point. As long as it stays above this level, the price is likely to rally towards the 2.61 levels. However, in case of a loss of the 2.42 level, there is a risk that XRP may experience a pullback towards 2.32 levels again.
Supports 2.3236 – 2.1800 – 2.0867
Resistances 2.4230 – 2.6180 – 2.8528
SOL/USDT
Solana price rose as the probability of Poly market’s spot SOL ETF increased. Poly market’s probability of this approval in 2025 increased to 85%. On the other hand, the Solayer Foundation was launched to support the Solana restaking protocol Solayer. The Solayer protocol aims to scale the Solana Virtual Machine (SVM) horizontally, similar to what Eigen Layer does for the Ethereum network.
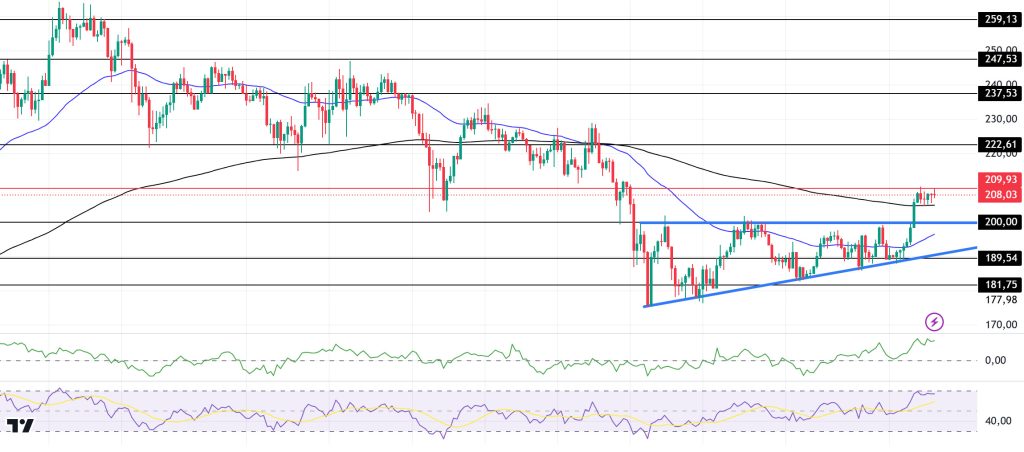
The LEFT has broken the ascending triangle pattern to the upside. This could be a bullish start. On the 4-hour timeframe, the 50 EMA (Blue Line) is below the 200 EMA (Black Line). The asset has tested the 200 EMA resistance and looks close to breaking it to the upside to start a possible bull story. It also broke the downtrend that has been in place since November 22 to the upside, increasing its momentum. Chaikin Money Flow (CMF)20 indicator is in positive territory and inflows are increasing. However, the Relative Strength Index (RSI)14 indicator reached the overbought level. The 209.93 level stands out as a very strong resistance point in the rises driven by both the upcoming macroeconomic data and the news in the Solana ecosystem. If it breaks here, the rise may continue. In case of retracements due to the opposite reasons or profit sales, the 181.75 support level can be triggered. If the price reaches these support levels, a potential bullish opportunity may arise if momentum increases.
Supports 200.00 – 189.54 – 181.75
Resistances 209.93 – 222.61 – 237.53
DOGE/USDT
Dogecoin’s price has increased by 7.73% in the last 24 hours and is trying to regain its $50 billion market capitalization. Trading volume rose to $2.55 billion during this period. According to data from CoinGlass, there has been an imbalance in the liquidation of DOGE perpetual futures positions. It was noteworthy that the amount of liquidated short positions exceeded the amount of long positions by more than 400%. The total amount of liquidated Dogecoin positions is $9.94 million. Of this amount, 1.98 million dollars were long positions and 7.96 million dollars were short positions.
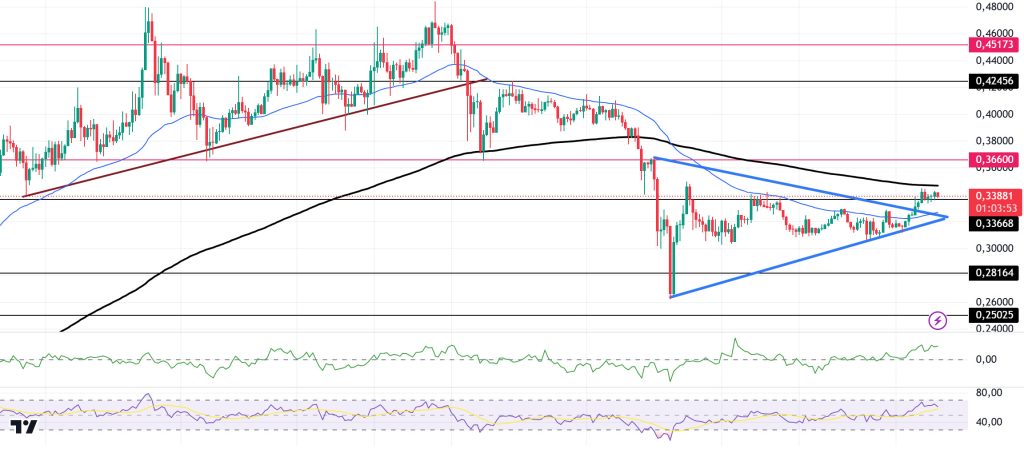
When we look at the chart, the asset, which has been moving sideways since December 20, gained momentum with the increase in volume and broke both the 0.33668 resistance, which is the ceiling of the horizontal level, and the symmetrical triangle pattern upwards. The asset is currently testing the 200 EMA (Black Line) as resistance. If it breaks here, the uptrend may continue. On the 4-hour timeframe, the 50 EMA (Blue Line) continues to be below the 200 EMA. When we examine the Chaikin Money Flow (CMF)20 indicator, it is in the positive zone and money inflows are also increasing. However, Relative Strength Index (RSI)14 is in the overbought zone. The 0.36600 level stands out as a very strong resistance point in the rises driven by both the upcoming macroeconomic data and the innovations in the Doge coin. If DOGE catches a new momentum and rises above this level, the rise may continue strongly. In case of possible pullbacks due to macroeconomic reasons or negativity in the ecosystem, the 0.28164 level, which is the base level of the trend, is an important support. If the price reaches these support levels, a potential bullish opportunity may arise if momentum increases.
Supports 0.33668 – 0.28164 – 0.25025
Resistances 0.36600 – 0.42456 – 0.45173
LEGAL NOTICE
The investment information, comments and recommendations contained herein do not constitute investment advice. Investment advisory services are provided individually by authorized institutions taking into account the risk and return preferences of individuals. The comments and recommendations contained herein are of a general nature. These recommendations may not be suitable for your financial situation and risk and return preferences. Therefore, making an investment decision based solely on the information contained herein may not produce results in line with your expectations.
