MARKET SUMMARY
Latest Situation in Crypto Assets
| Assets | Last Price | 24h Change | Dominance | Market Cap. |
|---|---|---|---|---|
| BTC | 86,839.05 | -2.74% | 59.96% | 1.72 T |
| ETH | 3,137.08 | -6.71% | 13.20% | 378.05 B |
| SOLANA | 203.34 | -7.29% | 3.55% | 96.10 B |
| DOGE | 0.3670 | -9.23% | 1.88% | 54.03 B |
| XRP | 0.6538 | 6.35% | 1.29% | 37.01 B |
| CARDANO | 0.5274 | -12.09% | 0.64% | 18.47 B |
| TRX | 0.1759 | 4.49% | 0.53% | 15.19 B |
| SHIB | 0.00002404 | -17.10% | 0.49% | 14.14 B |
| AVAX | 31.87 | -13.86% | 0.45% | 12.96 B |
| LINK | 13.25 | -10.34% | 0.29% | 8.31 B |
| DOT | 5.063 | -8.81% | 0.27% | 7.65 B |
*Prepared on 11.13.2024 at 06:00 (UTC)
WHAT’S LEFT BEHIND
Robinhood; Crypto rises will continue with Trump
Tenev, who participated in CNBC’s Squawk Box program from the US media and stated that the SEC has seriously targeted the crypto world in the last 4 years, said: “We are currently experiencing what people call the ‘Trump rise’. The Trump administration had pledged to make the US the center of crypto. We are now seeing the result of this. I think the SEC’s forced regulation policy against this new industry in the last 4 years will now come to an end.
Donald Trump announces Elon Musk for DOGE
In the US, where the debt is approaching 36 trillion dollars, the Trump administration is launching the Department of Government Efficiency (DOGE). In a statement released yesterday, Donald Trump stated that Elon Musk and Vivek Ramaswamy will head the organization.
Elon Musk releases the logo of the US Government’s Department of Productivity (DOGE) with an image of Shiba Inu
He reported that Musk posted the LOGO of the United States Government Department of Government Efficiency (DOGE), which is the image of the Shiba Inu and has the words Department of Government Efficiency. And the post read: “Making Government Fun Again!”
Possible Collaboration Between Cardano and Ripple
With recent developments in the cryptocurrency world, Cardano co-founder Charles Hoskinson praised Ripple CEO Brad Garlinghouse, sparking interest in potential collaborations. Hoskinson described Garlinghouse as “extremely collaborative” and emphasized the importance of unity in the crypto sector. Garlinghouse responded by calling for a joint effort for fairness in the industry.
HIGHLIGHTS OF THE DAY
Important Economic Calender Data
| Time | News | Expectation | Previous |
|---|---|---|---|
| Flare (FLR) Event – Night Market Event in Bangkok | |||
| Arkham (ARKM) Exchange Launch – Launch of Arkham Perpetuals Exchange | |||
| Kadena (KDA) Conference – Web Summit in Lisbon, Portugal | |||
| Blockchain Expo North America 2024 in Santa Clara | |||
| 13:30 | US Core CPI (MoM) (Oct) | 0.3% | 0.3% |
| 13:30 | US CPI (MoM) (Oct) | 0.2% | 0.2% |
| 13:30 | US Core CPI (YoY) (Oct) | 3.3% | 3.3% |
| 13:30 | US CPI (YoY) (Oct) | 2.6% | 2.4% |
| 14:45 | US FOMC Member Logan Speaks | ||
| 18:00 | US FOMC Member Musalem Speaks | ||
| 18:30 | US FOMC Member Schmid Speaks |
INFORMATION
*The calendar is based on UTC (Coordinated Universal Time) time zone.
The economic calendar content on the relevant page is obtained from reliable news and data providers. The news in the economic calendar content, the date and time of the announcement of the news, possible changes in the previous, expectations and announced figures are made by the data provider institutions. Darkex cannot be held responsible for possible changes that may arise from similar situations.
MARKET COMPASS
Ahead of critical inflation data, investors in global markets tend to take some of the money off the table. Minneapolis Fed President Neel Kashkari said that whether there will be a rate cut in December depends on inflation. After Wall Street closed in the red yesterday, Asian indices are also generally on the retreat. European futures have a similar outlook.
Inflation Data Under Scrutiny

Source: Bloomberg
We can see that the annual CPI, which started a downward trend after June 2022, has slowed down in the last month. This data, which declined from 2.5% in August to 2.4% in September, was expected to be announced as 2.3%. We also saw higher than expected figures in the monthly CPI data. If we see a higher-than-expected number, it would mean that inflation is above the FED’s 2% target and has turned upwards (if not temporarily). Such a situation may highlight the rumors that the FED may not be very comfortable with interest rate cuts and may even have started rate cuts early. We can state that this is a factor that will create an increase in the dollar and a decrease in risk appetite. Therefore, such a scenario may produce a negative result for digital assets. However, inflation indicators that will remain below forecasts have the potential to justify the FED, which could reinforce confidence in the continuation of interest rate cuts. In such a case, the continuation of the rise in digital assets may gain ground.
From the short term to the big picture.
The victory of former President Trump, one of the main pillars of our bullish expectation for the long-term outlook in digital assets, produced a result in line with our forecasts. The continuation of the Fed’s rate-cutting cycle and the inflows into BTC ETFs, indicating an increase in institutional investor interest (in addition to MicroStrategy’s BTC purchases, Microsoft starting to consider a purchase…), support our upside forecast for the big picture for now.
In the short term, given the nature of the market and pricing behavior, we think it would not be surprising to see some respite or pullbacks in digital assets from time to time. At this point, it is worth reiterating that fundamental dynamics remain bullish. While the continued extension of record highs by Bitcoin, the largest digital currency, may encourage buyers to take new, upside positions, we will watch this group struggle with the crowd that may want to take profit realizations. The lack of a new record and the decline after the rise with the news flow can be considered as a sign of downward pressure, albeit mild.
TECHNICAL ANALYSIS
BTC/USDT
We have already witnessed that every bull cycle that starts with a rise in the crypto market has its own stories. With the new US President D. Trump taking office, the expectation that he will take a more positive approach to cryptocurrencies continues to cause movement in the markets. It is stated that Trump’s crypto-supportive attitude may lead to changes in the SEC’s previous regulations and this change may accelerate innovation in the sector and prevent many companies from moving abroad. Bitcoin’s new all-time high (ATH), just $46 short of $90,000, has already made history by being dubbed the “Trump Pump”.
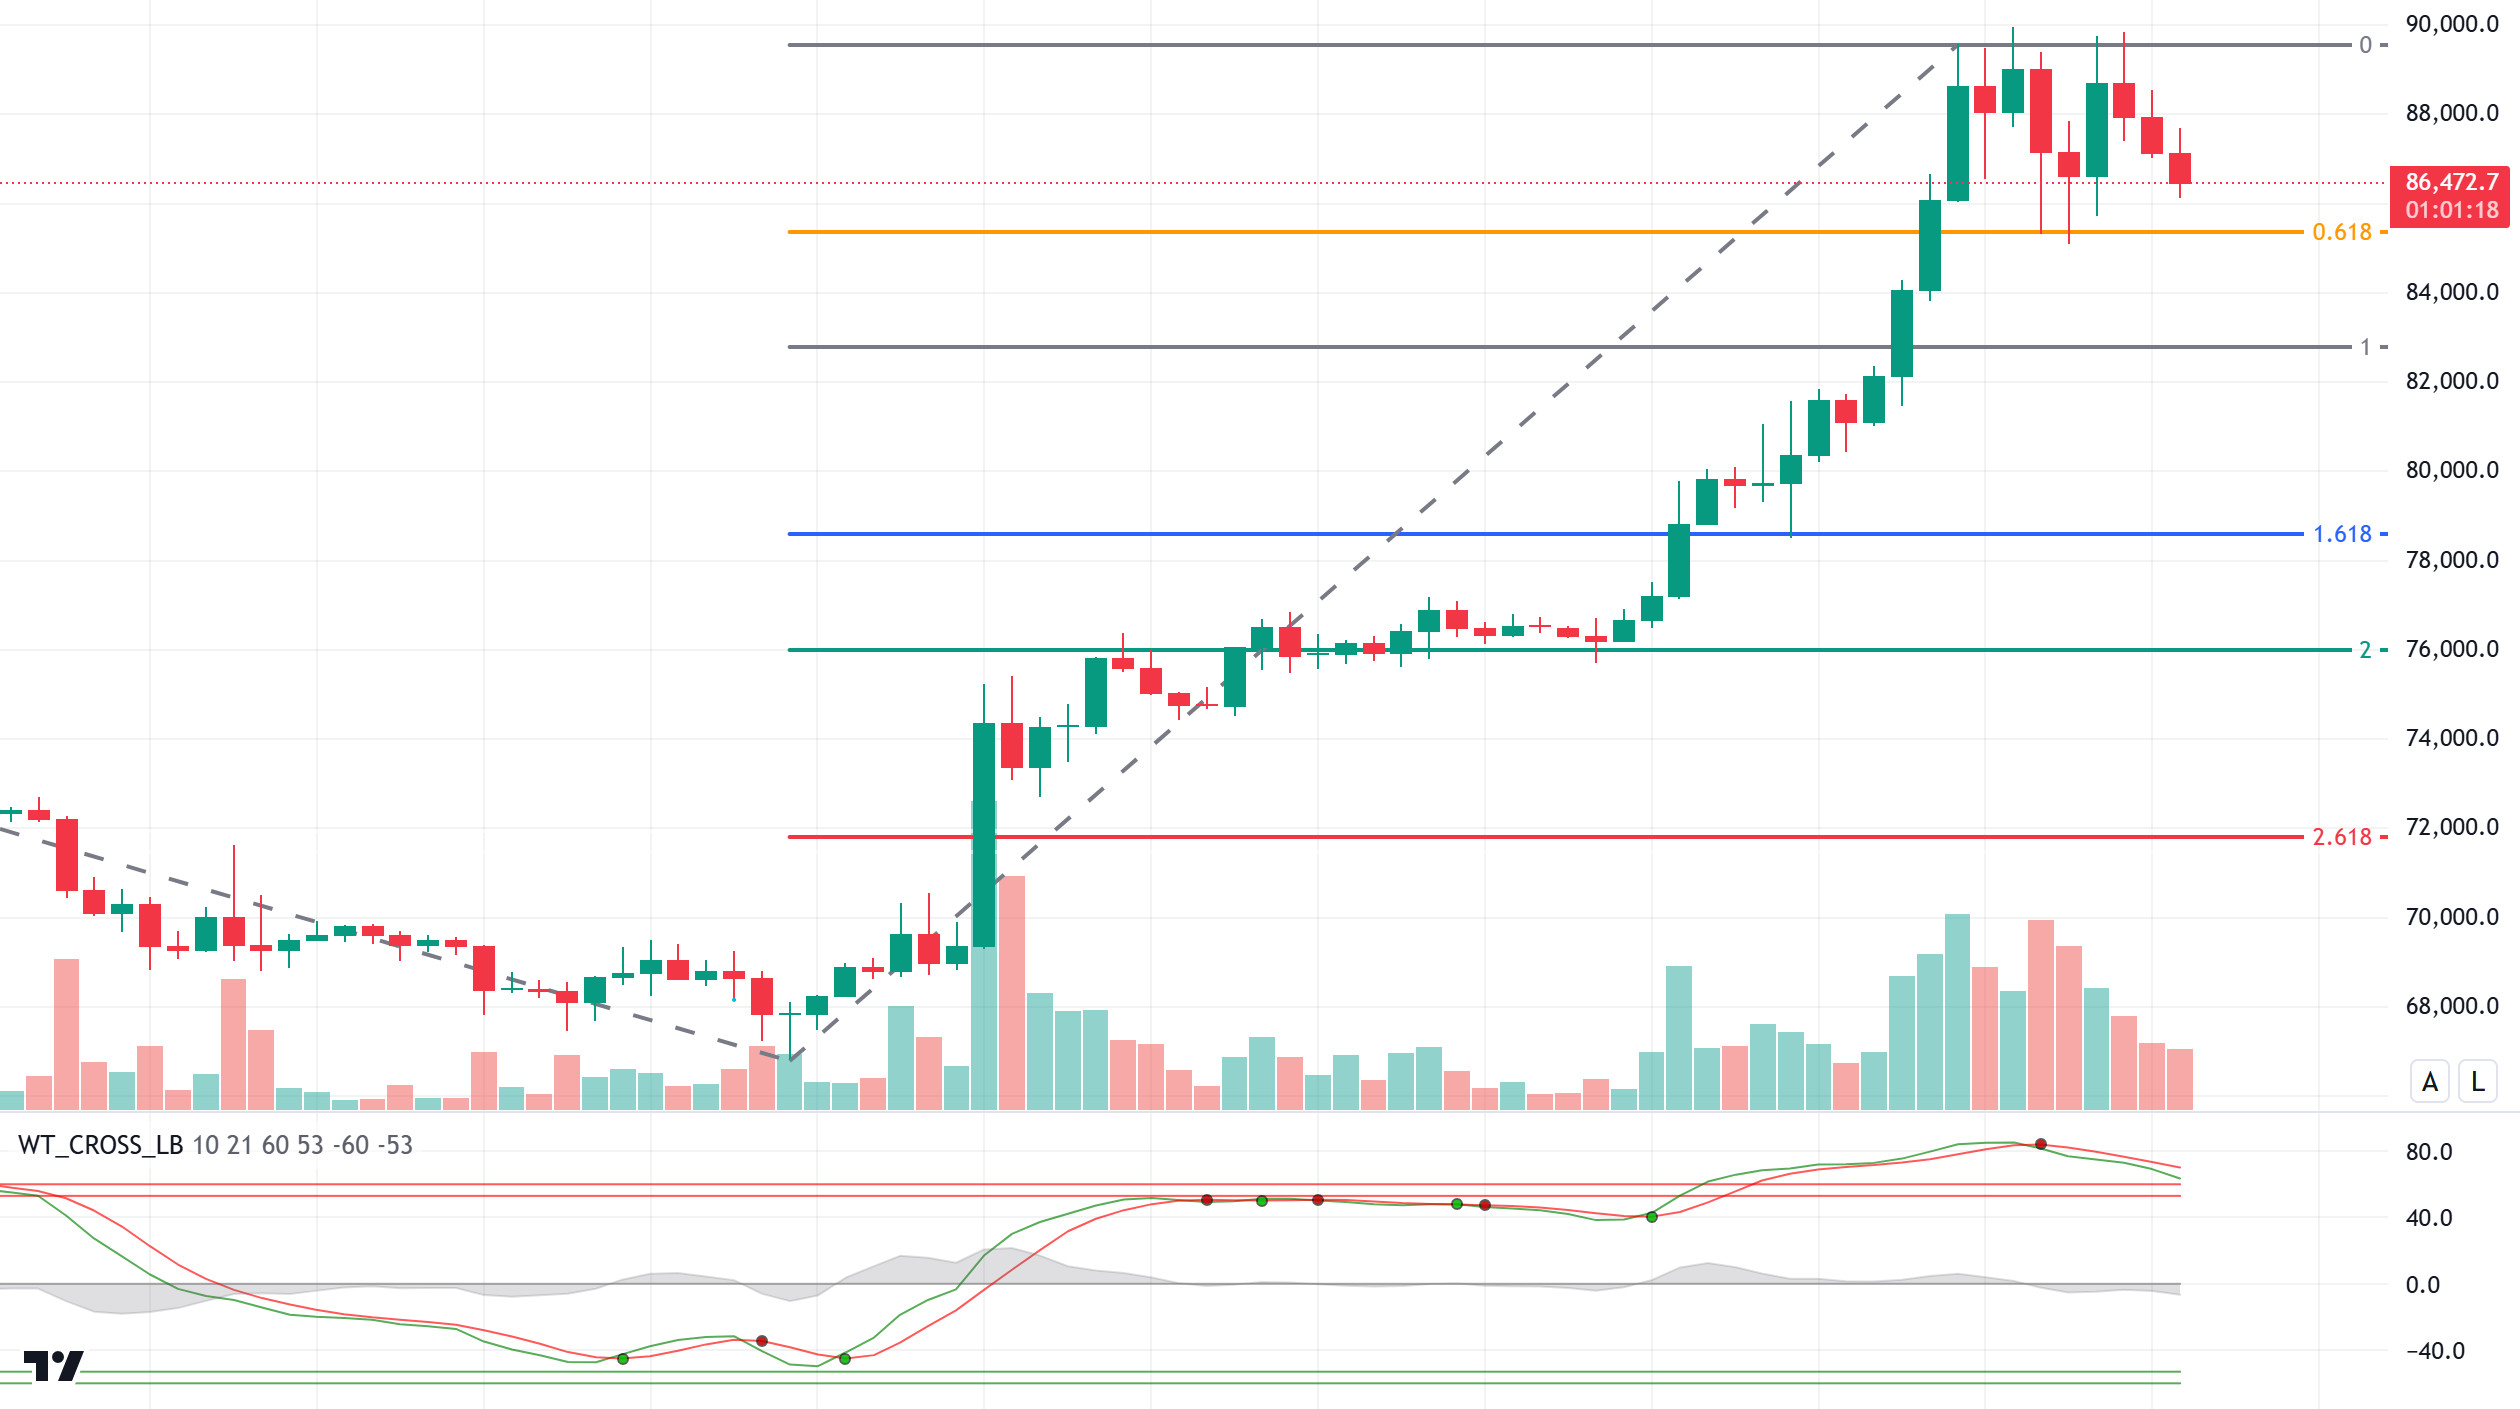
When we look at the BTC technical outlook, we see that the price exhibits volatile movements between the 85,000 and 90,000 levels. The price, which has attempted to test the new ATH level of 89,954 three times, has not yet passed this level. It is expected that this level will be passed and six-digit levels are expected to come as BTC, which has entered the consolidation process, regains momentum. The Fibonacci 0.618 (85,300) point, which has worked as a support level twice before, can be retested with technical oscillators giving a sell signal. With a break of this level, the price may take a needle towards 83,000 levels. With risk appetite high and the market in a bullish market phase, the price may start a new upward bullish wave as it gains momentum.
Supports 85,000 – 83,000 – 80,000
Resistances 90,000 – 93,000 – 95,000
ETH/USDT
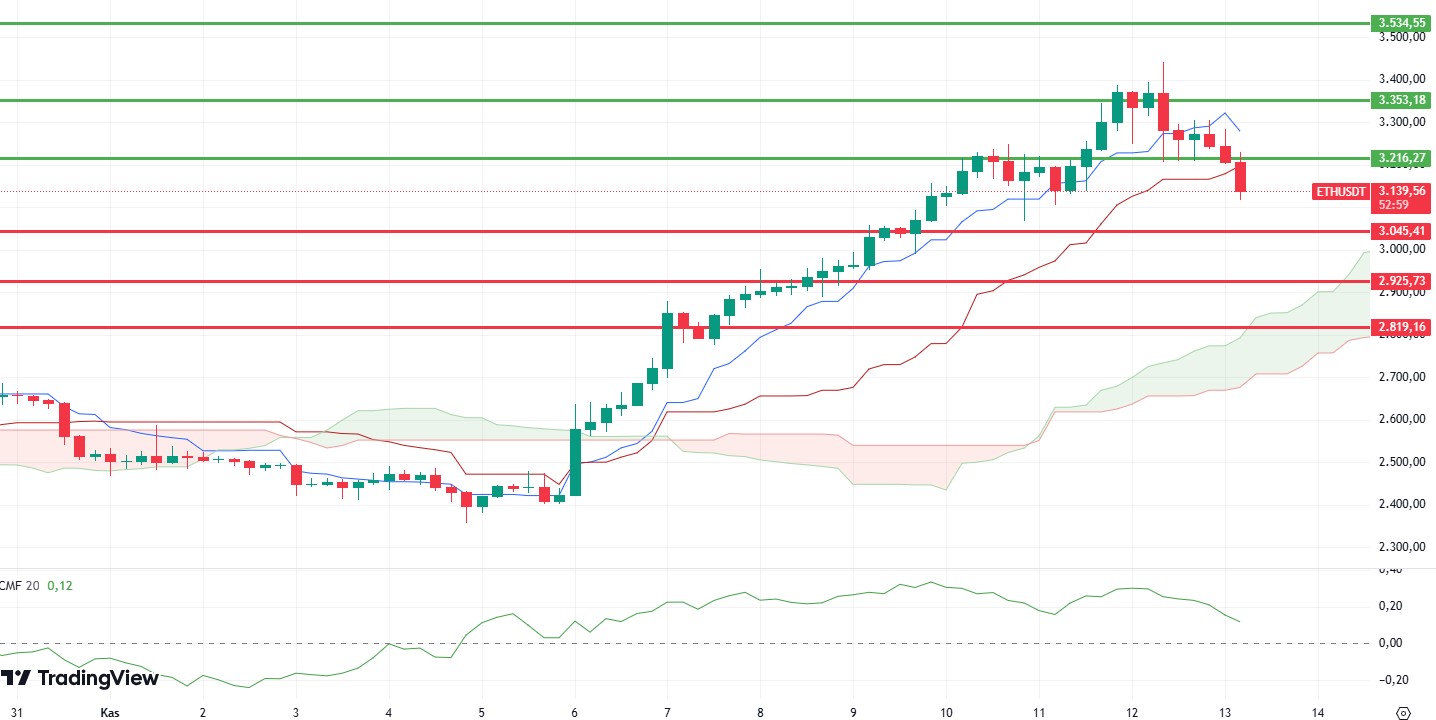
ETH broke the support of 3,216 in yesterday’s decline and fell as low as 3,120. As a result of this movement, the positive divergences on the Relative Strength Index (RSI) and Money Flow Index (MFI) have also disappeared. After the loss of the tenkan level yesterday, it can be said that the decline may continue during the day for ETH, which lost the kijun level today. The negative outlook on Chaikin Money Flow (CMF) can be considered as another factor that strengthens the bearish scenario. The correction of the RSI level may end at 42 levels. This may mean that ETH may continue its uptrend with a reaction at 3,045. With the gain of the 3.216 level, the rise may continue from where it left off. However, lower levels can be targeted in closures below 3,045.
Supports 3,045 – 2,925 – 2,819
Resistances 3,216 – 3,353 – 3,534
XRP/USDT
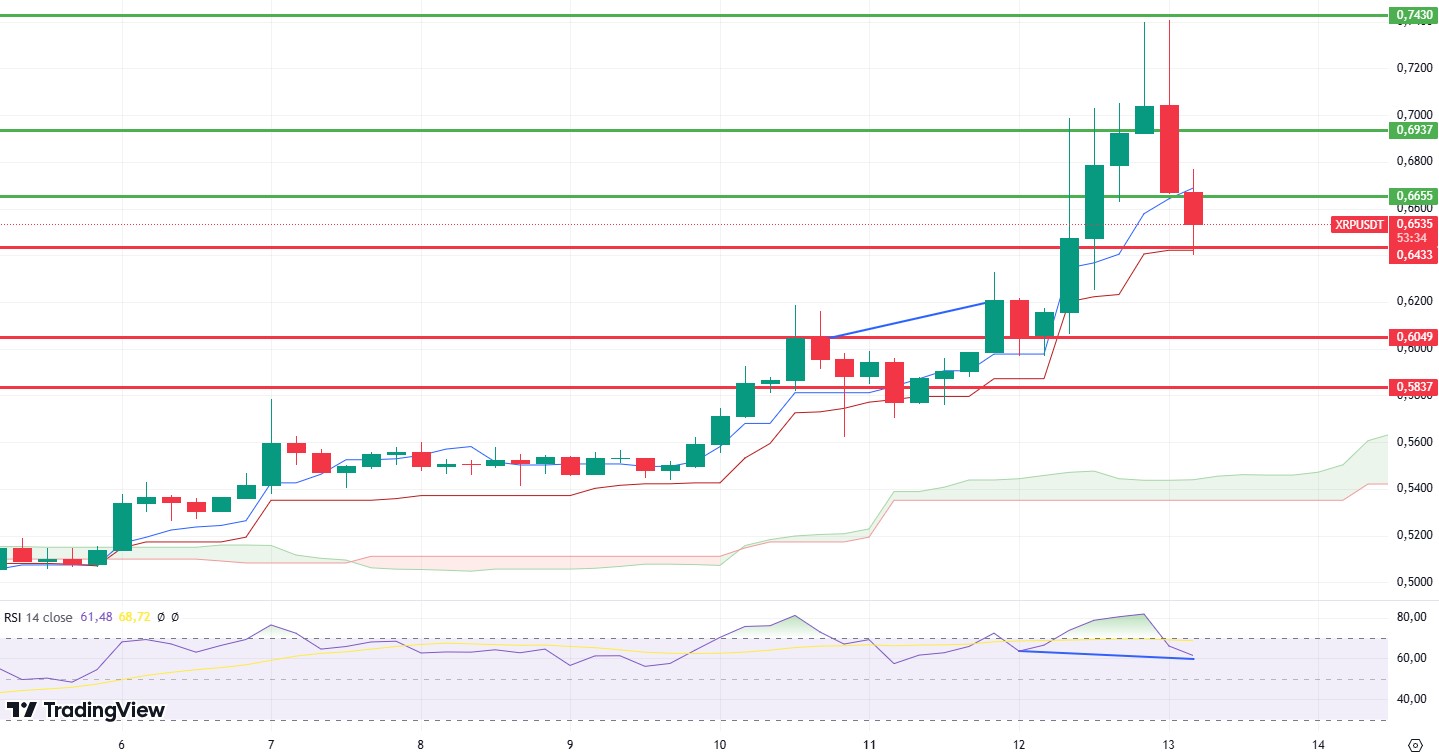
XRP advanced to the main resistance level of 0.7430 after a sharp rise yesterday. It retreated sharply with the selling pressure experienced at this level. This retreat seems to have ended at the kijun resistance. Provided that the kijun level is not lost, attacks to 0.6937 may be seen again during the day. Positive divergences on Strength Index (RSI) and Chaikin Money Flow (CMF) also support this idea. On the other hand, the loss of the kijun level may continue the downward movement to the 0.6049 region.
Supports 0.6433 – 0.6049 – 0.5837
Resistances 0.6655 – 0.6937 – 0.7430
SOL/USDT
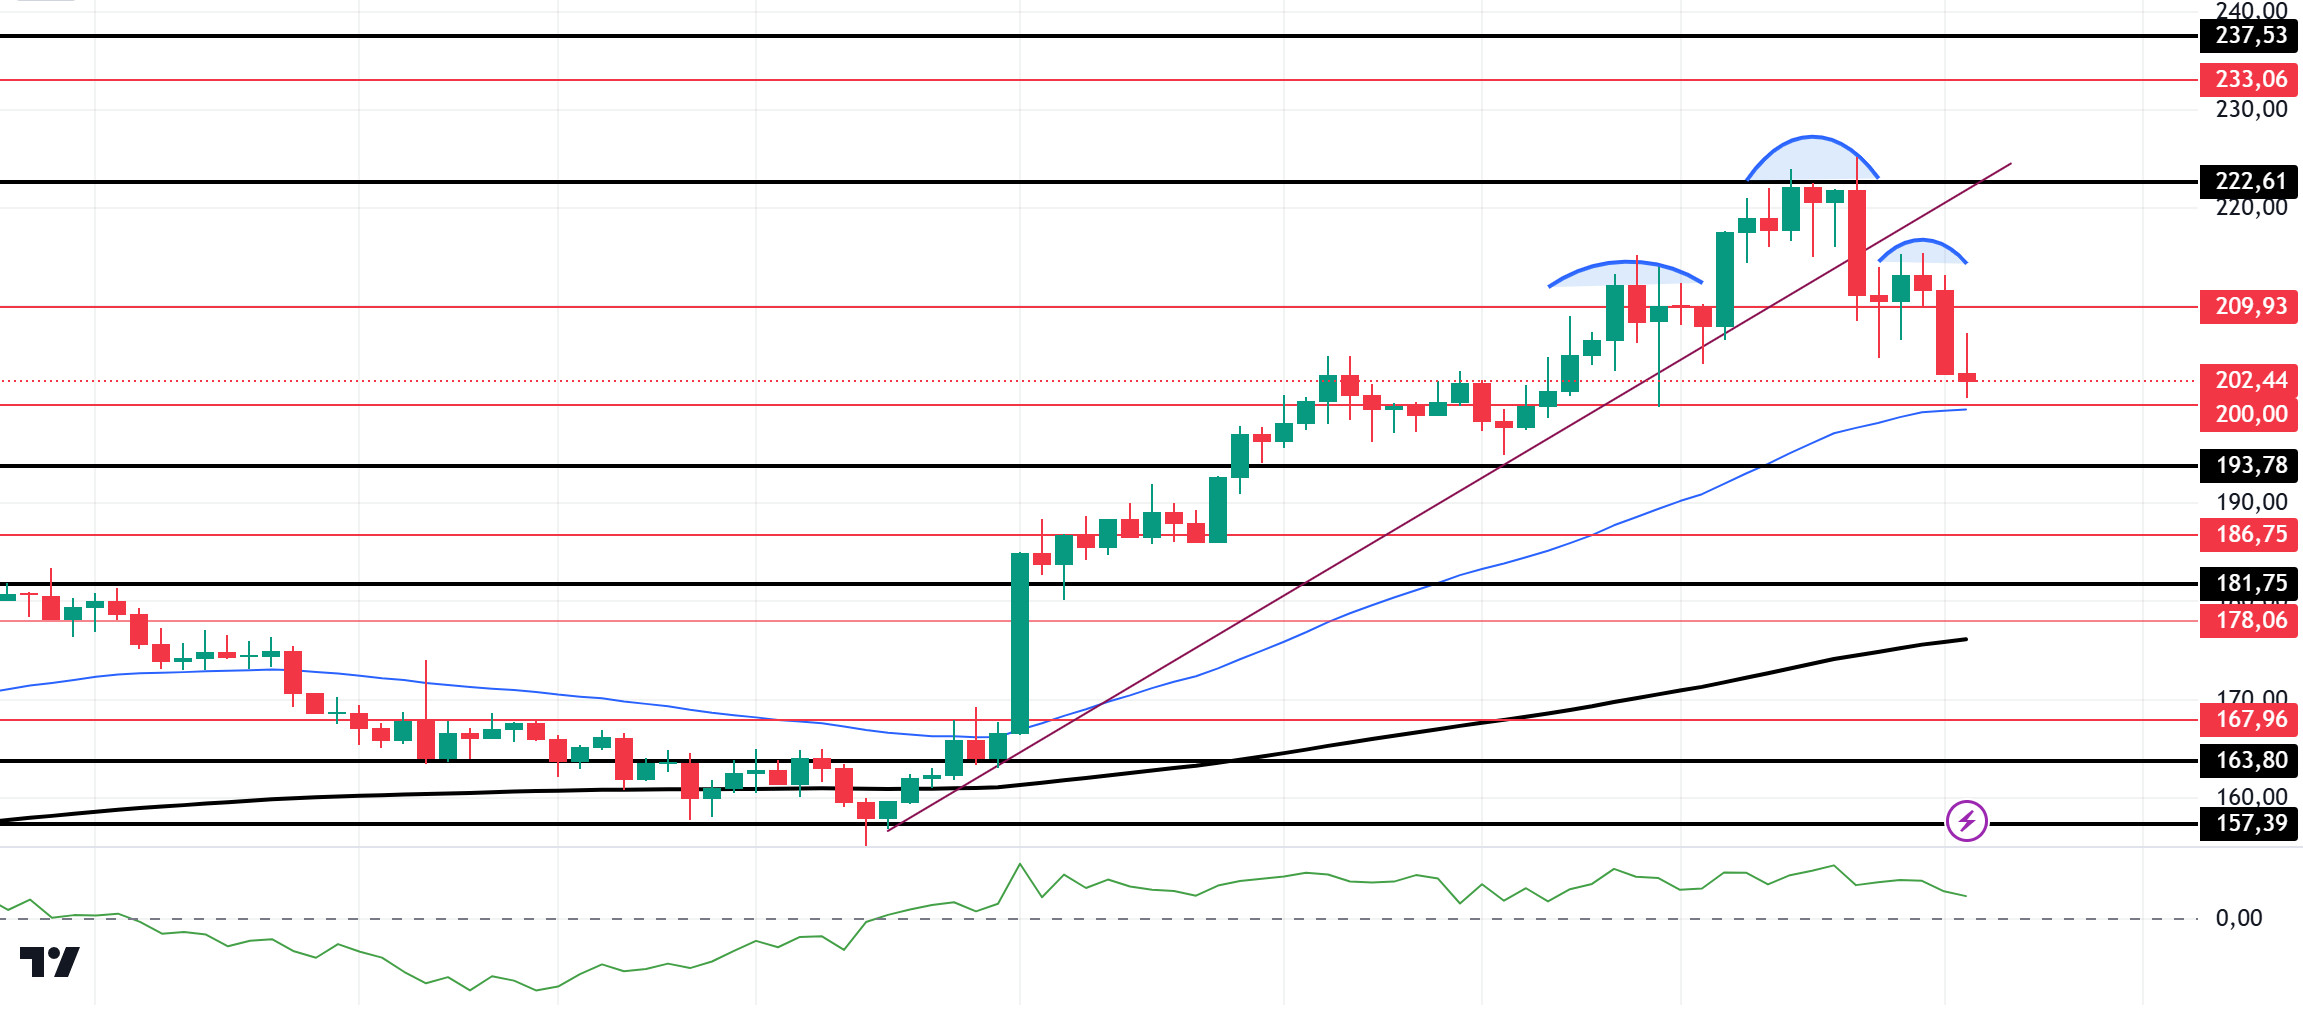
The inflation data coming from the US today is important. It is a matter of curiosity what the inflation data, which will come for the first time after the election, will be. In the ecosystem, Solana took another step into the corporate space. On Tuesday, November 12, DeFi Technologies officially announced the launch of SolFi, an operating company focused on Solana. The firm hopes to bring institutions on board Solana’s performance, which has grown significantly this year. SolFi will benefit from Solana’s performance in several areas. The fund will combine staking and advanced validator operations to generate returns for investors. In particular, it will leverage a proprietary Maximum Extractable Value (MEV) engine to increase staking returns. The company cited its inspiration as Michael Saylor’s Microstrategy, a company with high exposure to Bitcoin. DeFi Technologies CEO Olivier Roussy Newton suggested that SolFi could do for Solana what Microstrategy did for Bitcoin. SOL price is trading at 204.70, down 5.93% in 24 hours. On the 4-hour timeframe, the 50 EMA (Blue Line) continues to be above the 200 EMA (Black Line). This could mean that the uptrend will continue. However, the gap between the two averages has widened a lot, creating a difference of 13.25%. This could cause pullbacks. However, when we examine the Chaikin Money Flow (CMF)20 indicator, money inflows are positive, but inflows have started to decrease. At the same time, the shoulder-head-shoulder pattern seems to have formed in a very healthy way. If it works, the first target can be seen as 189 and the second target as 170. The 222.61 level appears to be a very strong resistance point in the rises driven by both macroeconomic conditions and innovations in the Solana ecosystem. SOL, which tested here, has lost its momentum and has broken the downward uptrend that has formed since November 5. If it starts rising again and rises above the 222.61 level, the rise may continue strongly. In case of retracements due to possible macroeconomic reasons or profit sales, support levels of 193.78 and 181.75 may be triggered again. If the price reaches these support levels, a potential bullish opportunity may arise if momentum increases.
Supports 200.00 – 193.78 – 186.75
Resistances 209.93 – 222.61 – 233.06
DOGE/USDT
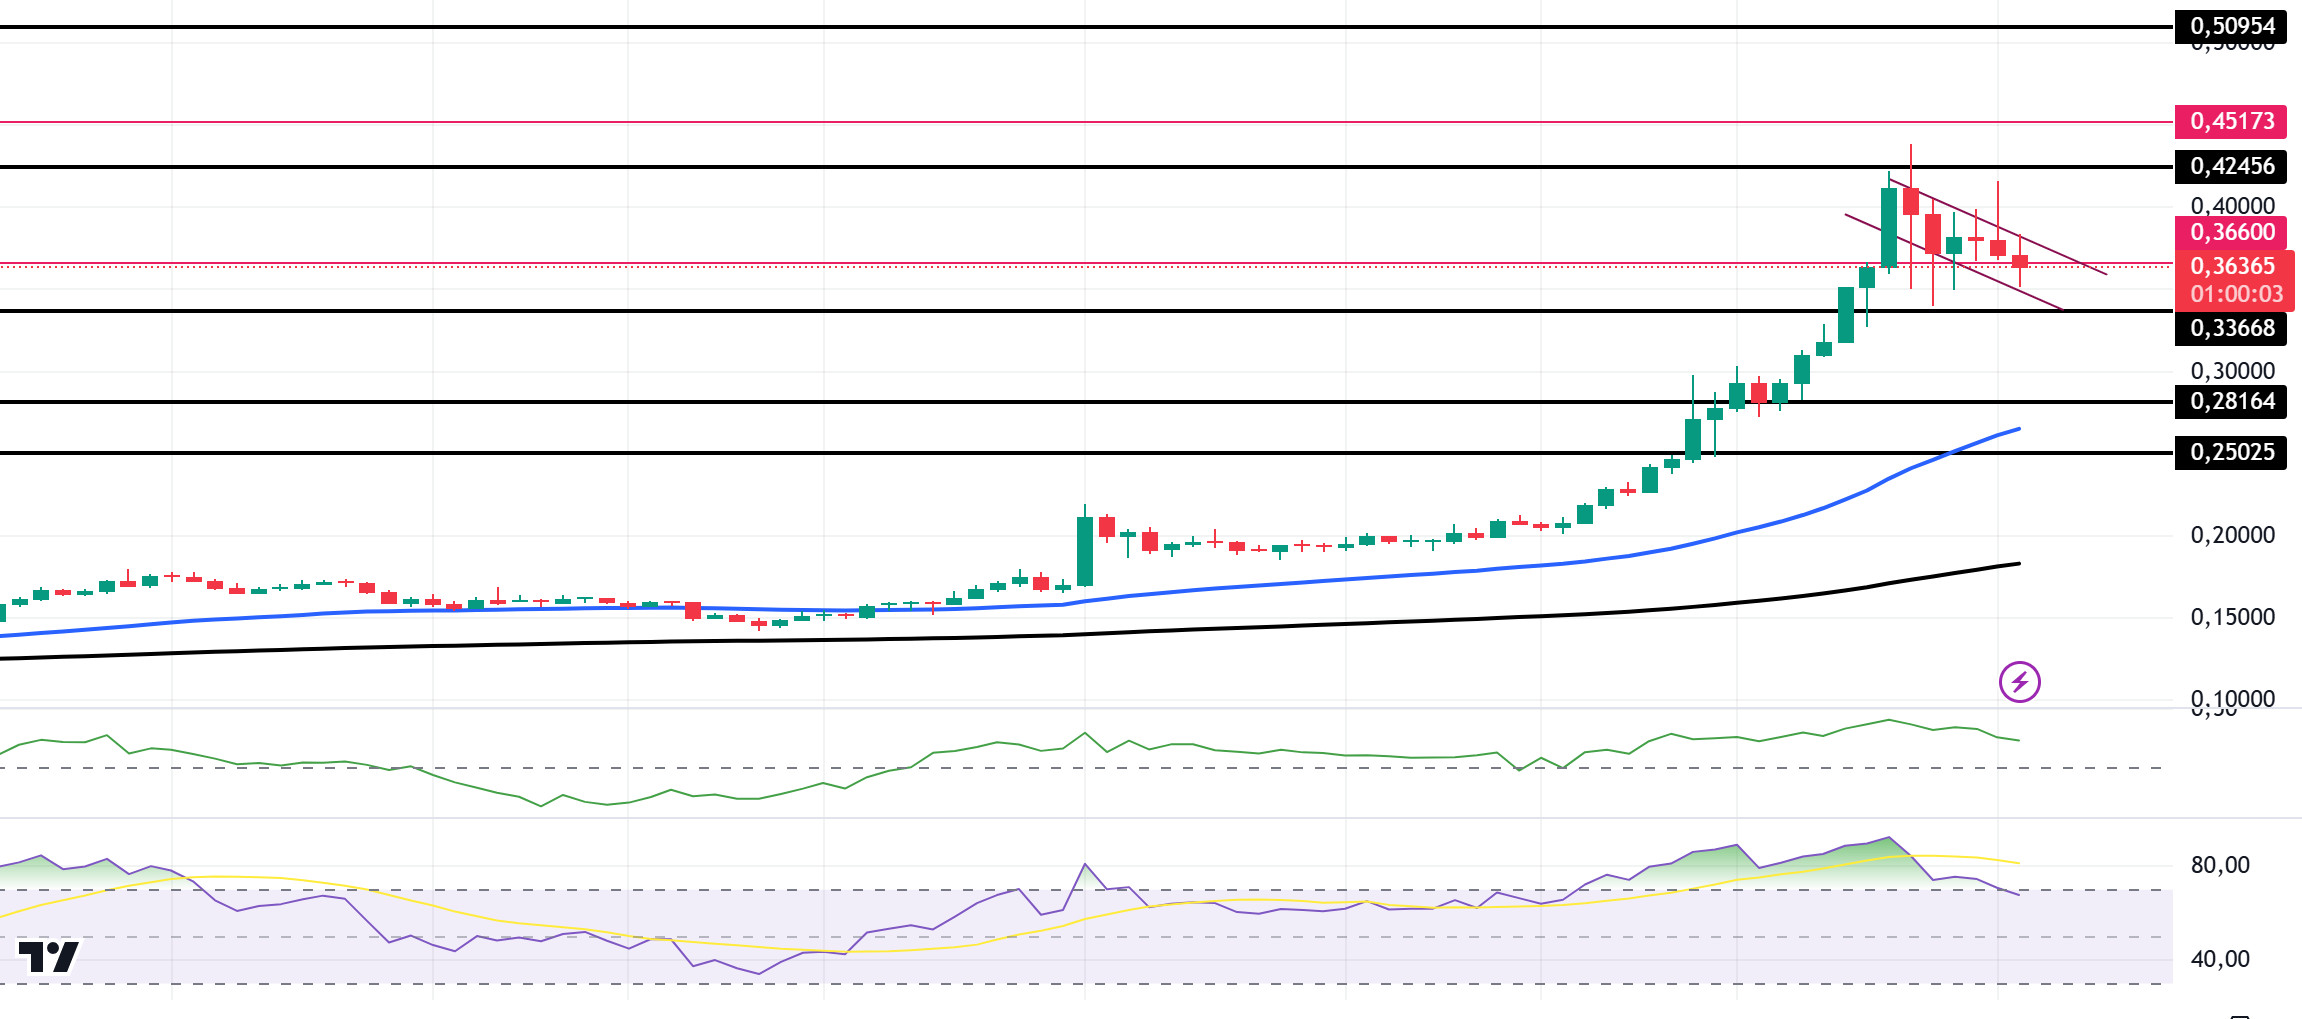
The inflation data coming from the US today is important. For the first time after the election, it will be interesting to see what the inflation data will be. On Tuesday night, President-elect Donald Trump appointed Tesla CEO Elon Musk and entrepreneur Vivek Ramaswamy to lead the new administration’s Department of Government Efficiency, also known as D.O.GE. According to on-chain data, an impressive 91.17% of the 5.82 million addresses of Dogecoin buyers are in profit. This means they are holding Doge at a lower average price than the current prices today. This may increase the selling pressure. Technically, on the 4-hour timeframe, the 50 EMA (Blue Line) continues to be above the 200 EMA (Black Line). This may mean that the rise will continue. However, the gap between the two averages has widened too much, creating a difference of 43.60%. This could cause pullbacks. At the same time, Relative Strength Index (RSI)14 is in overbought territory. This may bring profit sales. However, when we examine the Chaikin Money Flow (CMF)20 indicator, money inflows are positive, but inflows have started to decrease. On the other hand, the flag pennant pattern draws attention. This could push the doge to an all-time high. The 0.42456 level is a very strong resistance point in the rises driven by both macroeconomic conditions and innovations in the Doge coin. If DOGE, which tested here, maintains its momentum and rises above this level, the rise may continue strongly. In case of retracements due to possible macroeconomic reasons or profit sales, the support levels of 0.33668 and 0.28164 can be triggered again. If the price hits these support levels, a potential bullish opportunity may arise if momentum increases.
Supports 0.33668 – 0.28164 – 0.25025
Resistances 0.42456 – 0.45173 – 0.50954
LEGAL NOTICE
The investment information, comments and recommendations contained herein do not constitute investment advice. Investment advisory services are provided individually by authorized institutions taking into account the risk and return preferences of individuals. The comments and recommendations contained herein are of a general nature. These recommendations may not be suitable for your financial situation and risk and return preferences. Therefore, making an investment decision based solely on the information contained herein may not produce results in line with your expectations.


