Market Summary
Latest Situation in Crypto Assets
📊 Top 10 Crypto Assets Overview
| Asset | Last Price | 24h Change | Dominance | Market Cap |
|---|---|---|---|---|
| BTC | $69,089.43 | +0.74% | 59.43% | $1.36 T |
| ETH | $2,476.61 | +0.83% | 13.28% | $298.38 B |
| SOLANA | $162.45 | -0.40% | 3.40% | $76.36 B |
| XRP | $0.5053 | +0.02% | 1.25% | $28.67 B |
| DOGE | $0.1521 | +0.24% | 0.99% | $22.28 B |
| TRX | $0.1651 | +0.53% | 0.63% | $14.28 B |
| CARDANO | $0.3331 | -2.75% | 0.52% | $11.65 B |
| SHIB | $0.00001688 | -1.55% | 0.44% | $9.94 B |
| AVAX | $23.68 | +0.08% | 0.43% | $9.63 B |
| LINK | $10.73 | -2.62% | 0.29% | $6.73 B |
| DOT | $3.799 | -0.66% | 0.25% | $5.75 B |
*Prepared on 11.4.2024 at 06:00 (UTC)
What’s Left Behind
Bitcoin Spot ETF
In the week of October 28-November 1, Bitcoin spot ETFs saw net capital inflows of $2.22 billion. This was the third largest weekly net inflow since January 11, when Bitcoin spot ETFs opened for trading. The BlackRock ETF IBIT saw a weekly net inflow of $2.15 billion. Ethereum spot ETFs saw net inflows of just $13 million last week.
Critical Statement from the Central Bank of China on Bitcoin and Cryptocurrency
Lu Lei, Vice Governor of the People’s Bank of China, assessed the role of Bitcoin and central bank digital currencies in the financial future. While criticizing Bitcoin’s positioning as a means of energy consumption and store of value, it was stated that solid economic foundations are essential for CBDCs to succeed. Lu advocates central bank control in the digital currency revolution.
Elon Musk’s Squirrel-themed Memecoin
Elon Musk’s interest in the squirrel-themed “Pnut” cryptocurrency increased the token’s value to $125 million. The tragic story of the squirrel named Peanut and Musk’s post created a huge demand for Pnut. However, as the market fluctuated, investors started to realize their profits.
Highlight of the Day
Important Economic Calender Data
📅 Crypto Events – Key Developments
| Time | News | Expectation | Previous |
|---|---|---|---|
| – | Astar – Asynchronous Backing Release | – | – |
| – | Cartesi (CTSI) – Community Discussion Event | – | – |
| – | ImmutableX (IMX) – 18.08 Million Tokens Unlock | – | – |
| – | Digital Assets Week – Singapore | – | – |
| – | Maker (SKY) – MKR Return to Trading Code Vote | – | – |
Information
*The calendar is based on UTC (Coordinated Universal Time) time zone.
The economic calendar content on the relevant page is obtained from reliable news and data providers. The news in the economic calendar content, the date and time of the announcement of the news, possible changes in the previous, expectations and announced figures are made by the data provider institutions. Darkex cannot be held responsible for possible changes that may arise from similar situations.
Market Compass
Markets started the most critical week of the year. “The US Presidential elections on November 5th and the Federal Open Market Committee (FOMC) statement on November 7th stand out as the developments that may determine the direction of asset prices in the short term. Earlier, with Japan closed due to a holiday, Asian stock markets started the week mixed but generally bullish. New incentives are expected to come out of China’s National People’s Congress. This meeting of the Congress will continue throughout the week.
According to Bloomberg, the latest polls in the US presidential elections indicate that the candidates’ chances of winning are quite close to each other. According to the Polymarket bet, the gap has narrowed. While it was previously thought that Trump was more likely to win, in this parallel, the expectation that the dollar could appreciate with the policies to be followed by the former president came to the fore and the US currency recorded appreciation. Following the latest poll results, the dollar index eased, and we watched the impact of this on the counter-assets. The impact of the developments in the US on asset prices will continue this week. You can also review the November Strategy Report prepared by Darkex Research Department by clicking here.
From the short term to the big picture
The rise in digital assets, which we have been following under the locomotive of Bitcoin, gave way to a retreat last week and we saw this trend continue for part of the weekend. The recent losses, as we mentioned in our Friday evening analysis, were met with a bit of a reaction rally on Sunday.
We maintain our expectation that the uptrend will continue in the long term. On the other hand, we do not ignore the fact that the retracement that started on October 30 may not yet be complete and that the declines may continue after the reaction rally. Due to the critical importance of this week, we think that investors should be prepared for all possible scenarios.
Technical Analysis
BTC/USDT
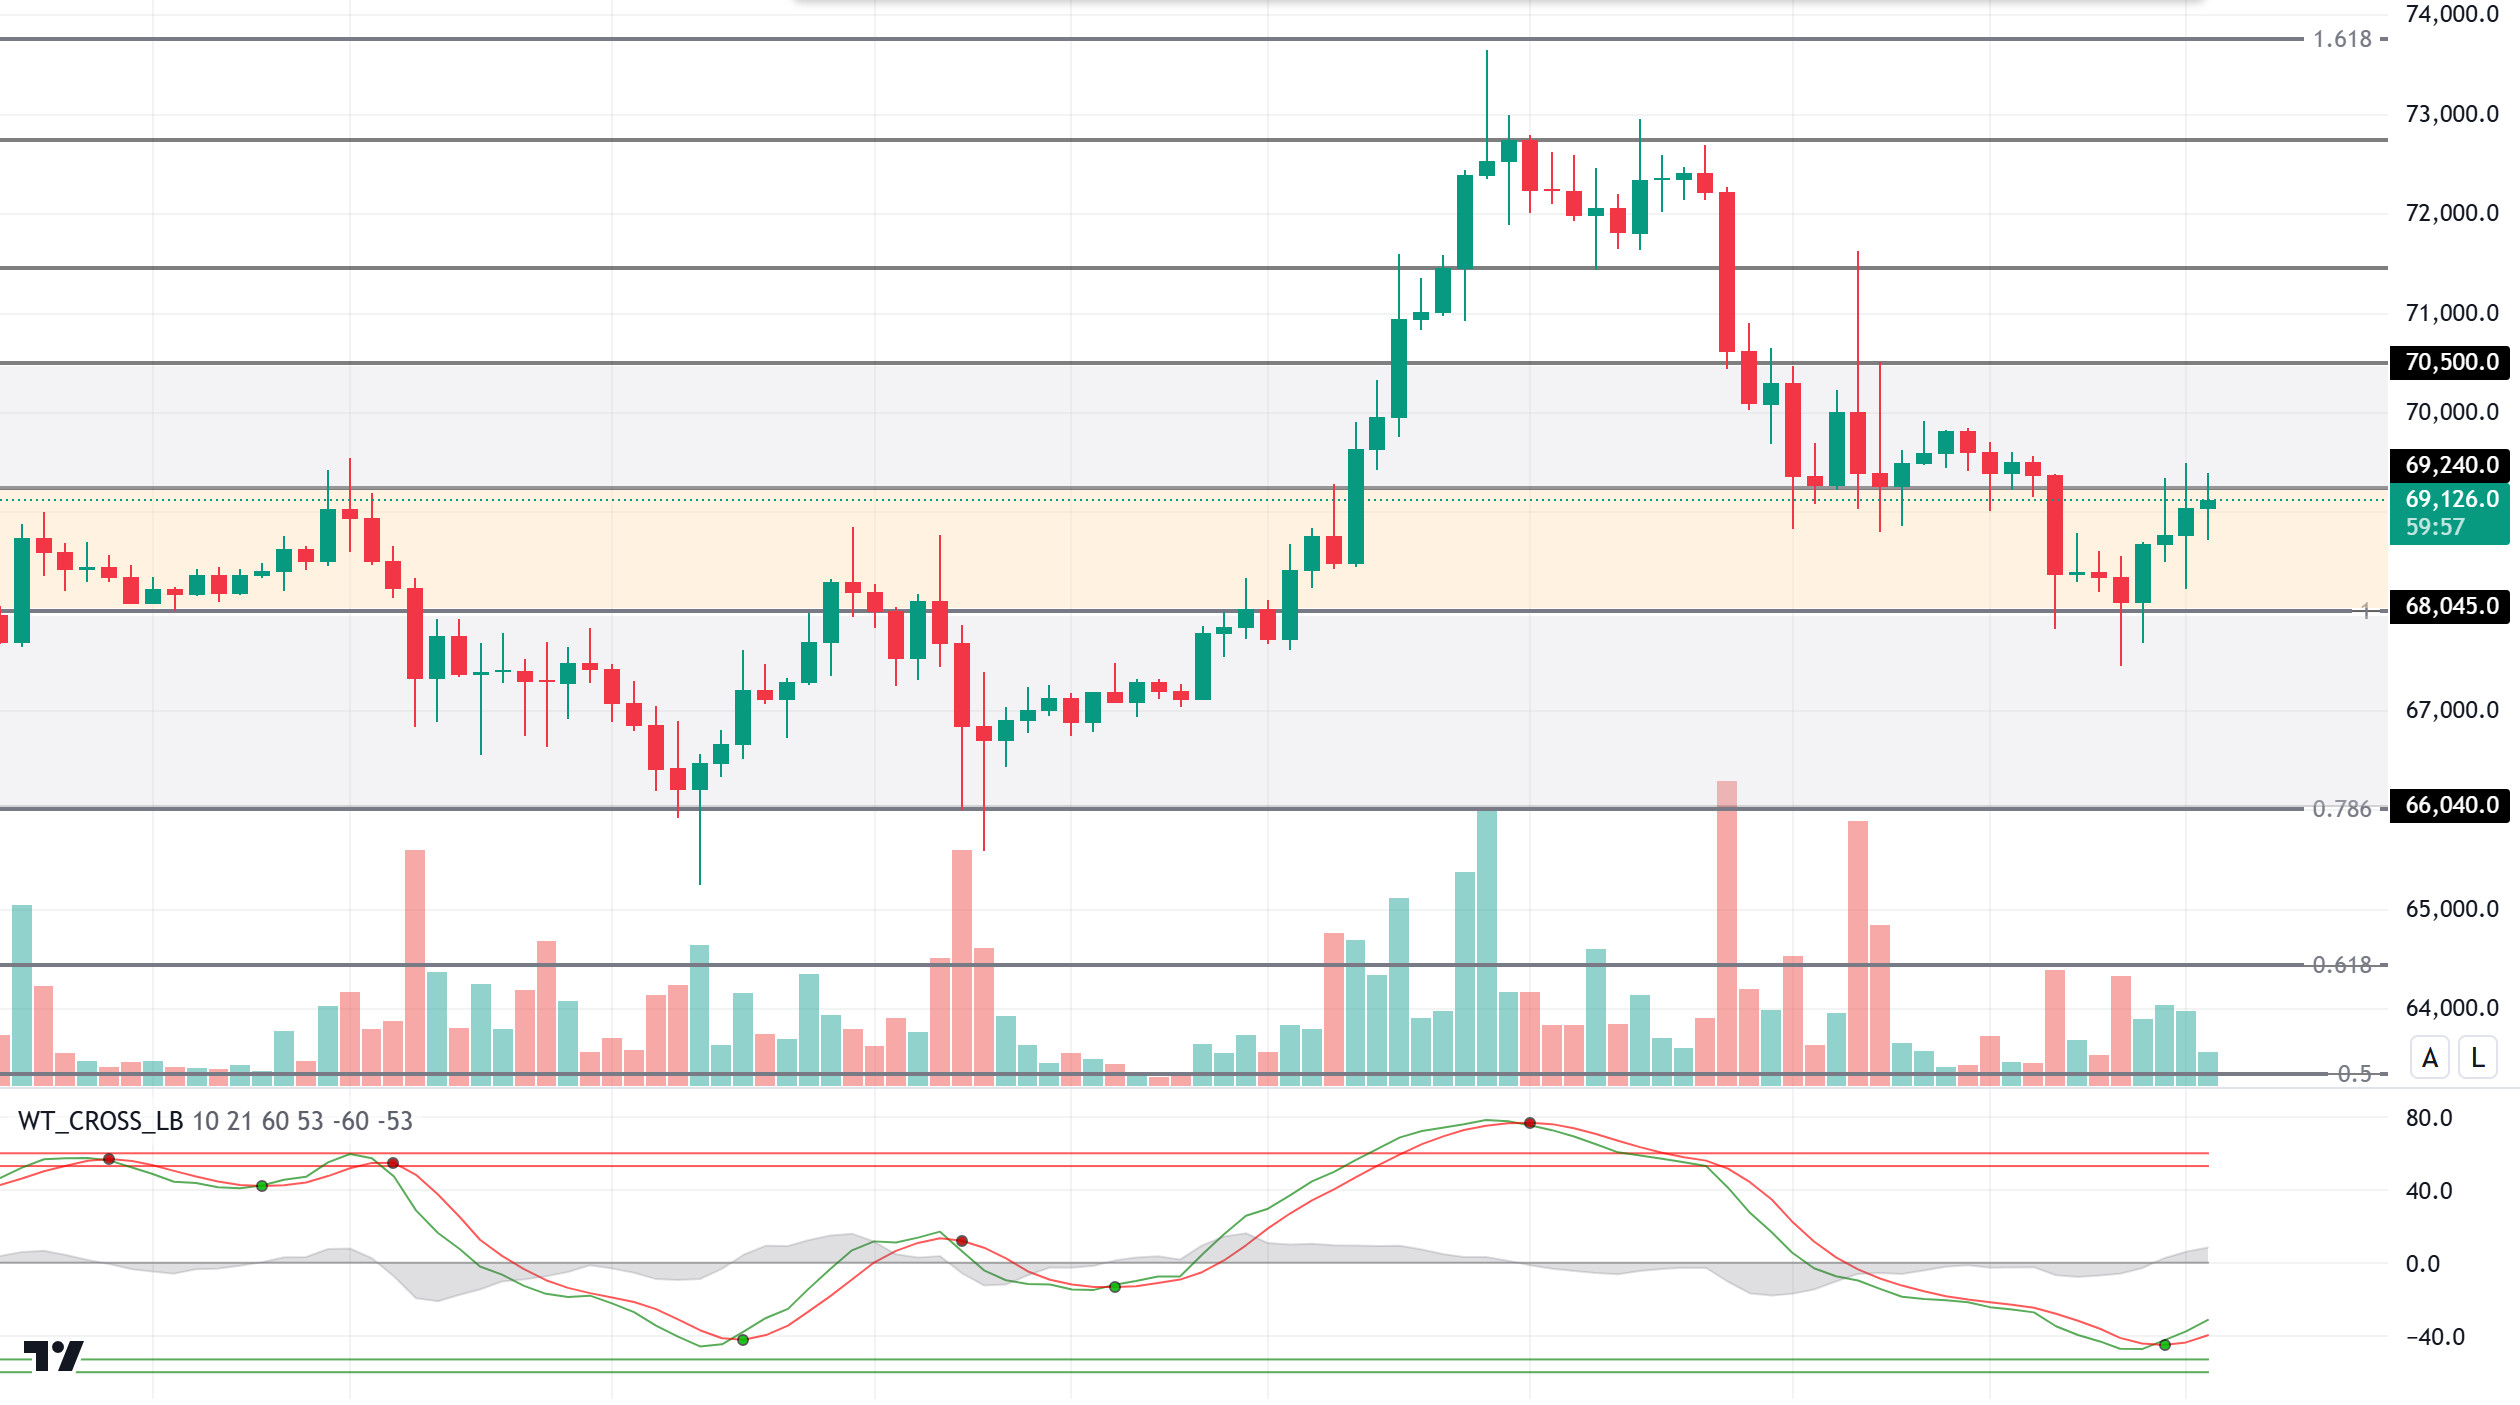
Election polls are increasing uncertainty in the markets, with the likelihood of Donald Trump’s election diminishing as election day approaches. This has been a major factor in Bitcoin’s strong correction from its peak of 73,600 to a low of 67,500. The election night results could lead to volatile movements of -10% to +10% in Bitcoin price.
When we look at the BTC technical outlook, Bitcoin, which fell as low as $ 67,500 over the weekend, has recovered as of last night and turned its direction upwards again. BTC, which entered a short-term downtrend, started testing 69,000 levels again. With our technical oscillator giving a buy signal at 4 hours, the price may retest the 70,500 level if the resistance level of 69,240 is broken. On the first trading day of the week, the reaction of global stock markets to market uncertainty will be decisive in the direction of Bitcoin.
Supports 68,045 -67,260 – 66,040
Resistances 69,240 – 70,500 – 71,460
ETH/USDT
Looking at the ichimoku indicator for ETH, which moved horizontally in the range of 2,481 – 2,438 in the relatively volume-free market at the weekend, the regain of the tenkan level and the return of Chaikin Money Flow (CMF) to the positive area can be seen as positive. However, we see negative divergence on the Relative Strength Index (RSI). Failure to exceed the 2,481 level during the day may indicate that the decline may continue. Exceeding the 2.481 level may trigger rises. It can also be said that volatility will be high as tomorrow is election day.
Supports 2,438 – 2,310 – 2,112
Resistances 2,481 – 2,576 – 2,669
LINK/USDT
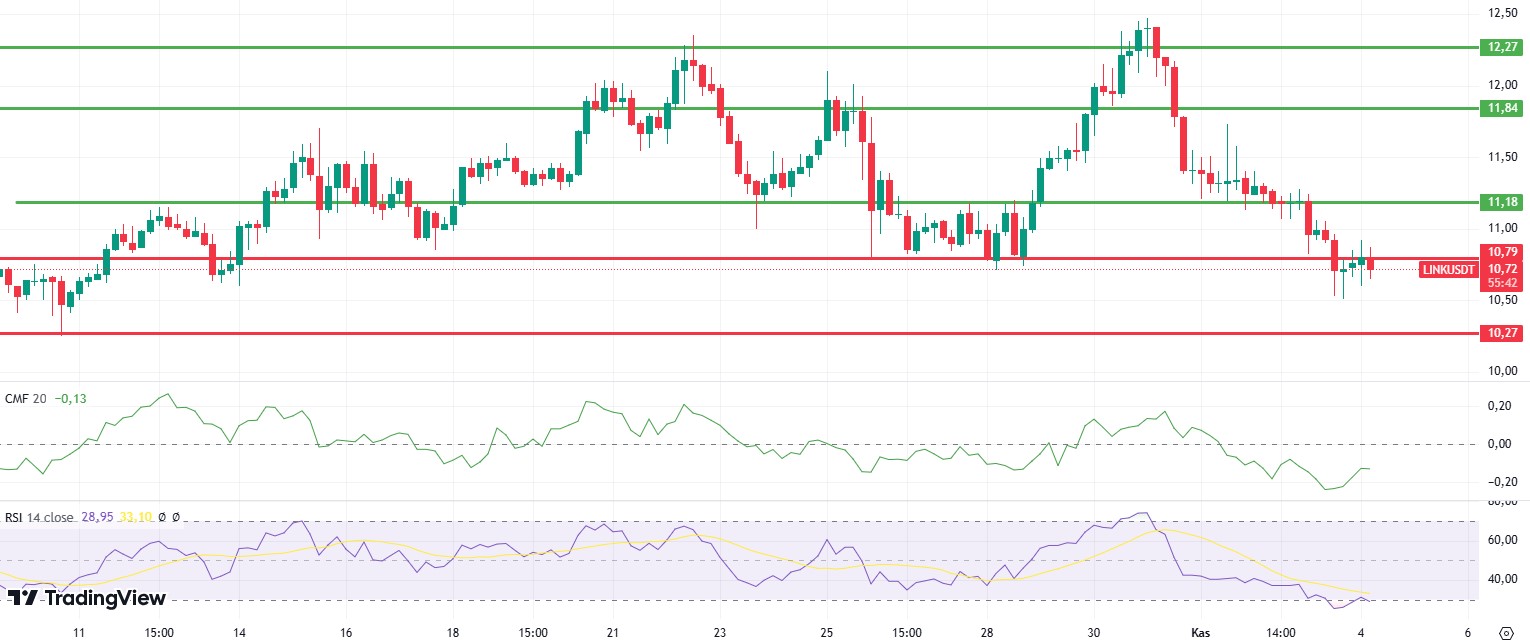
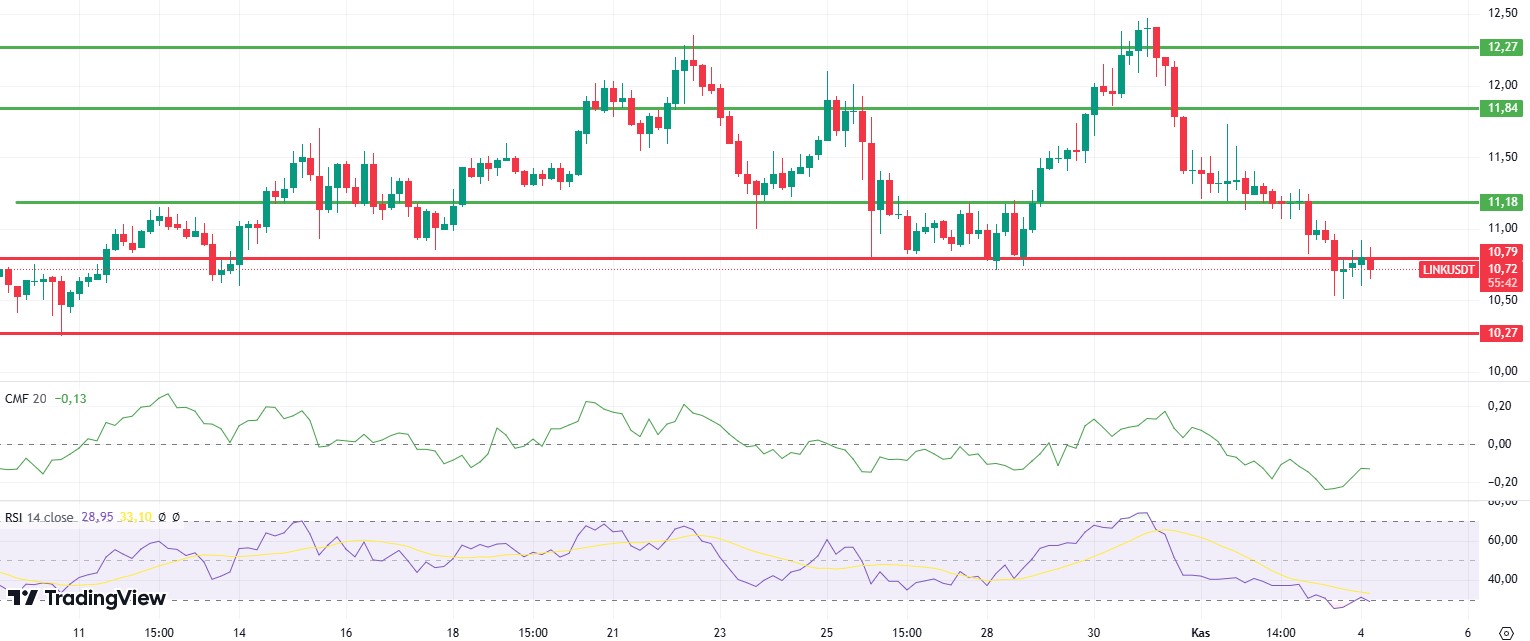
Although LINK tried to exceed the important resistance level of 10.79 at the weekend, it continues to price below this level. The fact that the Relative Strength Index (RSI) has entered the oversold zone and the Chaikin Money Flow (CMF) value is still negative indicates that slight horizontal – negative movements may occur during the day. Persistence above the 10.79 level may bring rises up to 11.18.
Supports 10.53 – 10.27 – 9.31
Resistances 10.79 – 11.18 – 11.84
SOL/USDT
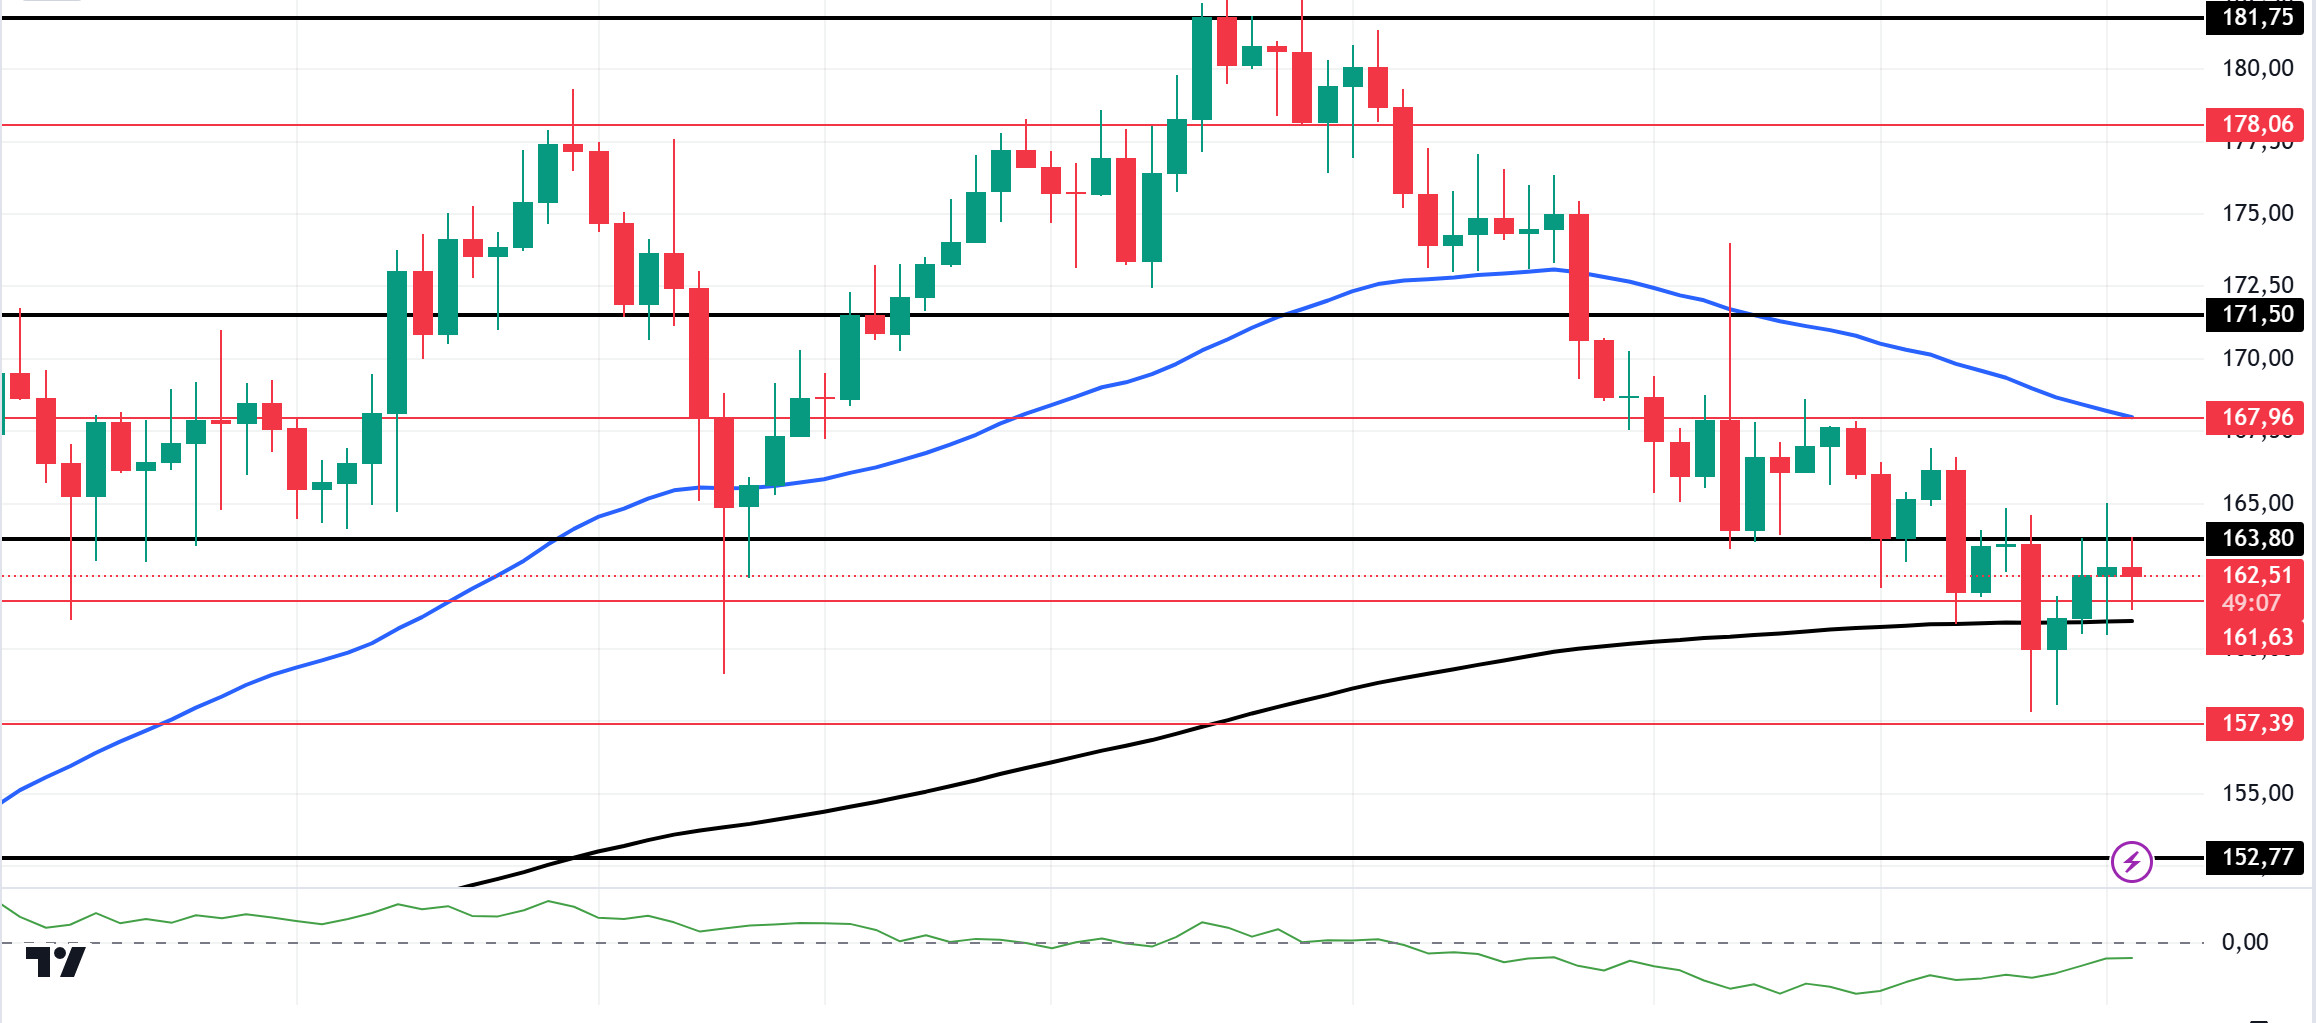
In view of the upcoming US elections, Solana co-founder Yakovenko advised voters to consider policy rather than personality. He advised them not to focus on how others plan to vote. He also advised voters to study each candidate’s position using original sources. Yakovenko stressed that analyzing the candidates’ views without decontextualizing them can lead to a more informed voting decision. The Solana Co-Founder also said, “Harris is not a communist and Trump is not a Nazi. The US will be fine either way. 50/50 means that democracy and federalism are working as designed. Each party had to adjust its message to reach a stable majority.” He concluded. According to DefiLlama data on the Solana ecosystem, SOL’s Total Value Locked (TVL) recorded a notable decrease, falling from $7.24 billion to $5.97 billion, a drop of nearly 18%. However, whale wallets containing over $5 million worth of SOL accounted for 60% of the total supply. Technically, SOL has been flat for the past seven months, struggling to hold above the $200 psychological level. The crypto market witnessed a pre-election pullback, pushing the SOL price down to $161.48 and its market capitalization to $76.08 billion. SOL tested the 181.75 level but failed to turn it into support. On the 4-hour timeframe, the 50 EMA (Blue Line) continues to be above the 200 EMA (Black Line). This could mean that the uptrend will continue. However, the price may encounter resistance at the 50 EMA. Indeed, the price keeps forming higher highs and higher lows. The Chaikin Money Flow (CMF)20 indicator is in the negative territory. But we can say that money outflows are decreasing and inflows are increasing. The 171.50 level is a very strong resistance point in the uptrend driven by both macroeconomic conditions and innovations in the Solana ecosystem. If it rises above this level, the rise may continue strongly. In case of possible political reasons or if the bear market takes over, the 152.77 support level may be triggered again. If the price hits this support level, momentum may increase and a potential bullish opportunity may arise.
Supports 161.63 – 157.39 – 152.77
Resistances 163.80 – 167.96 – 171.50
ADA/USDT
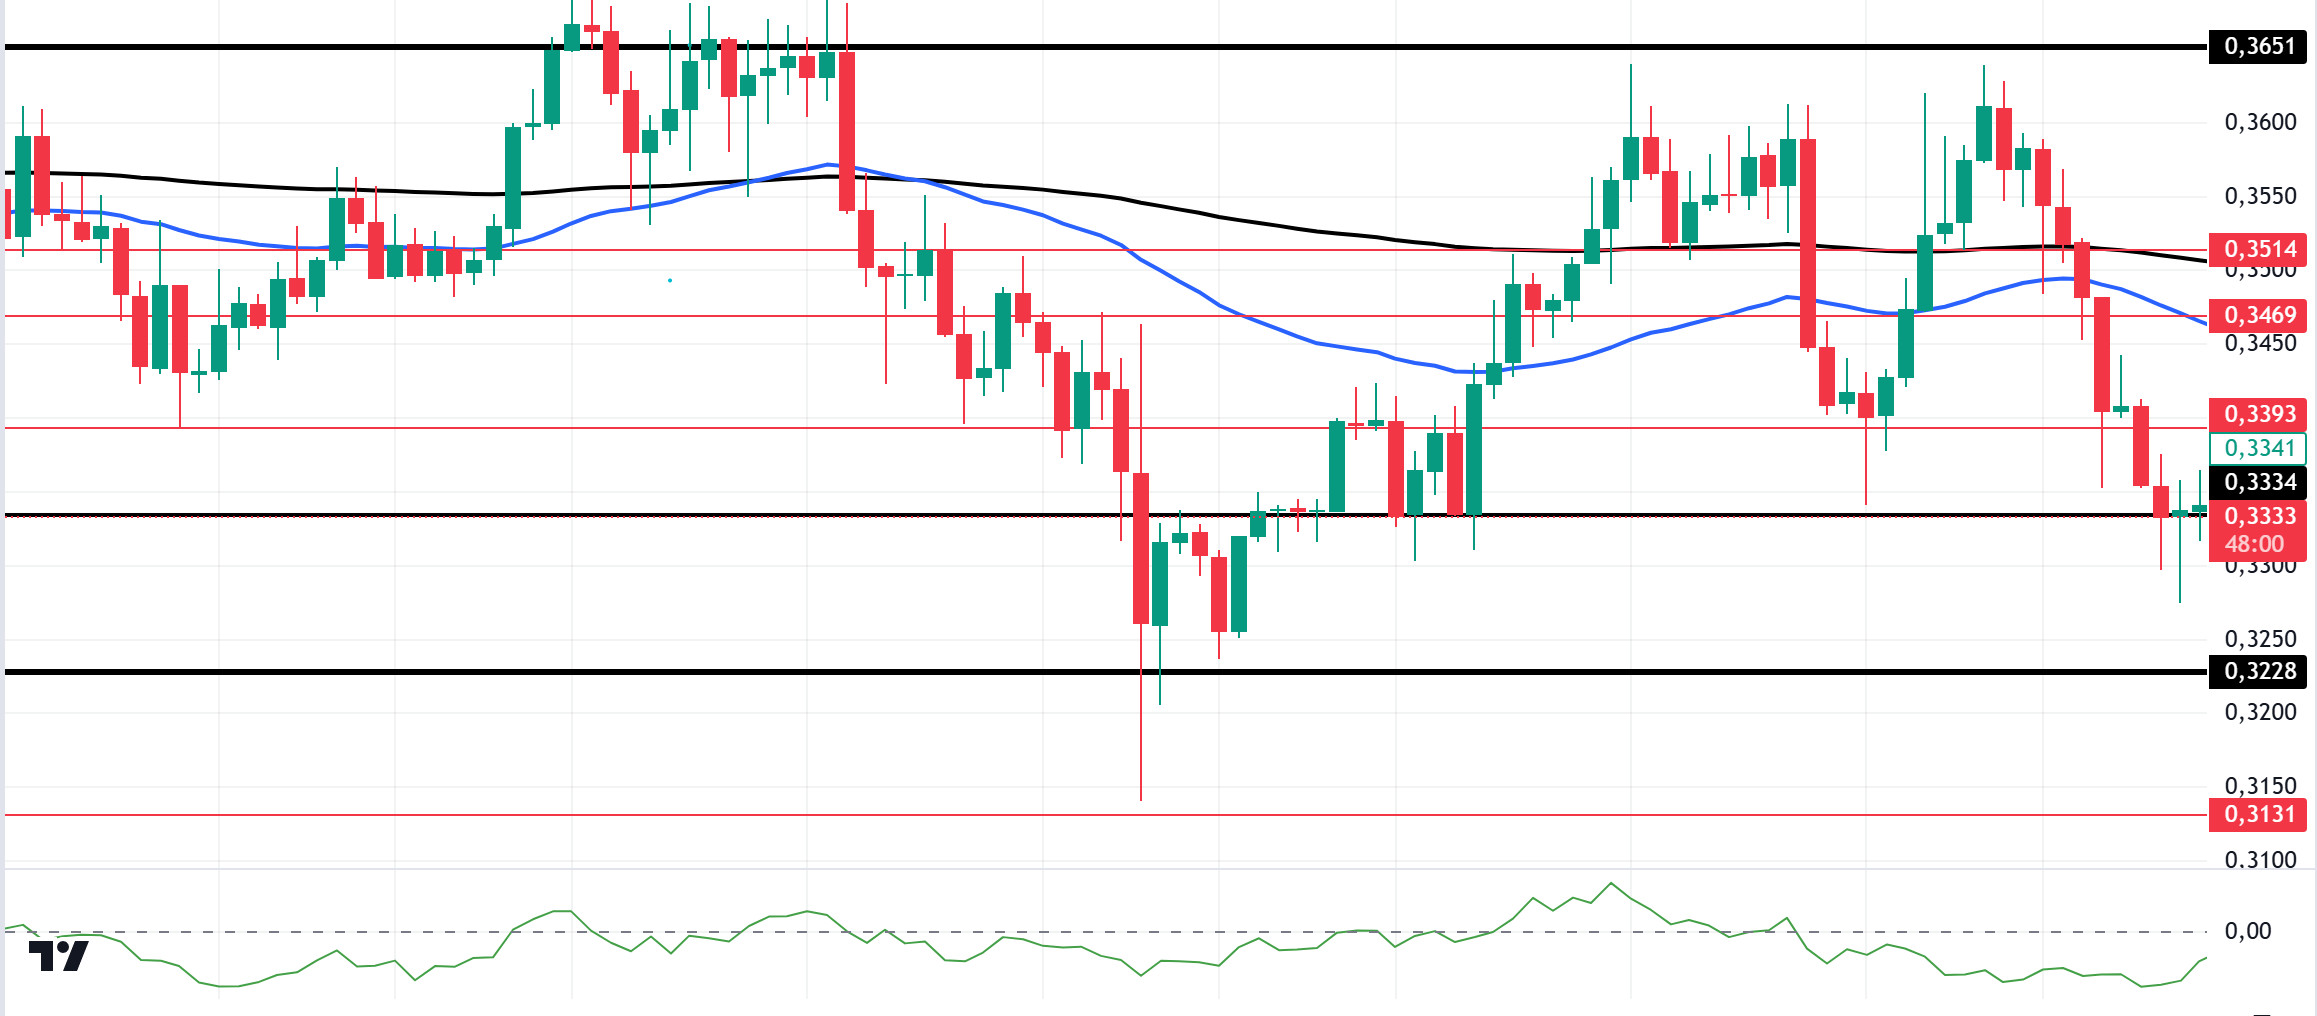
When we look at the liquidity zones of ADA, there is an important liquidity place in the region of 0.3710-0.3770 dollar levels. This region is likely to attract prices to itself. Although it is not clear whether buyers can follow this and make more gains, the weak demand in recent weeks means that the price will once again show resistance at $ 0.3750 and the price will continue downward. ADA’s value has fallen by more than 2.86% in the last 24 hours and is trading at $0.3321. Technically, on the 4-hour chart, the price broke the 50 EMA (Blue Line) and 200 EMA (Black Line) to the downside. However, the 50 EMA hovers below the 200 EMA. This shows that the trend is bearish. At the same time, when we examine the Chaikin Money Flow (CMF)20 indicator, it is in the negative zone. But it approached the positive zone due to money inflows. Considering all this, ADA may test the 0.3651 level once again. In the decline that will be experienced due to the macroeconomic data and negativities in the ecosystem, the support level of 0.3228 should be followed. It may be appropriate to buy when it comes to this price level. In the rises due to developments in the ecosystem, if the 0.3651 level is broken in volume, the upward acceleration will increase even more and the 0.3905 level should be followed as a retracement place.
Supports 0.3334 – 0.3228 – 0.3131
Resistances 0.3393 – 0.3469 – 0.3514
AVAX/USDT
AVAX, which opened yesterday at 24.13, fell by about 2.5% during the day and closed the day at 23.54. Today, there is no planned data to be announced especially by the US and expected to affect the market. For this reason, it may be a low volume day where we may see limited movements. The market is focused on the US presidential elections tomorrow. News flows from the Middle East will be important for the market.
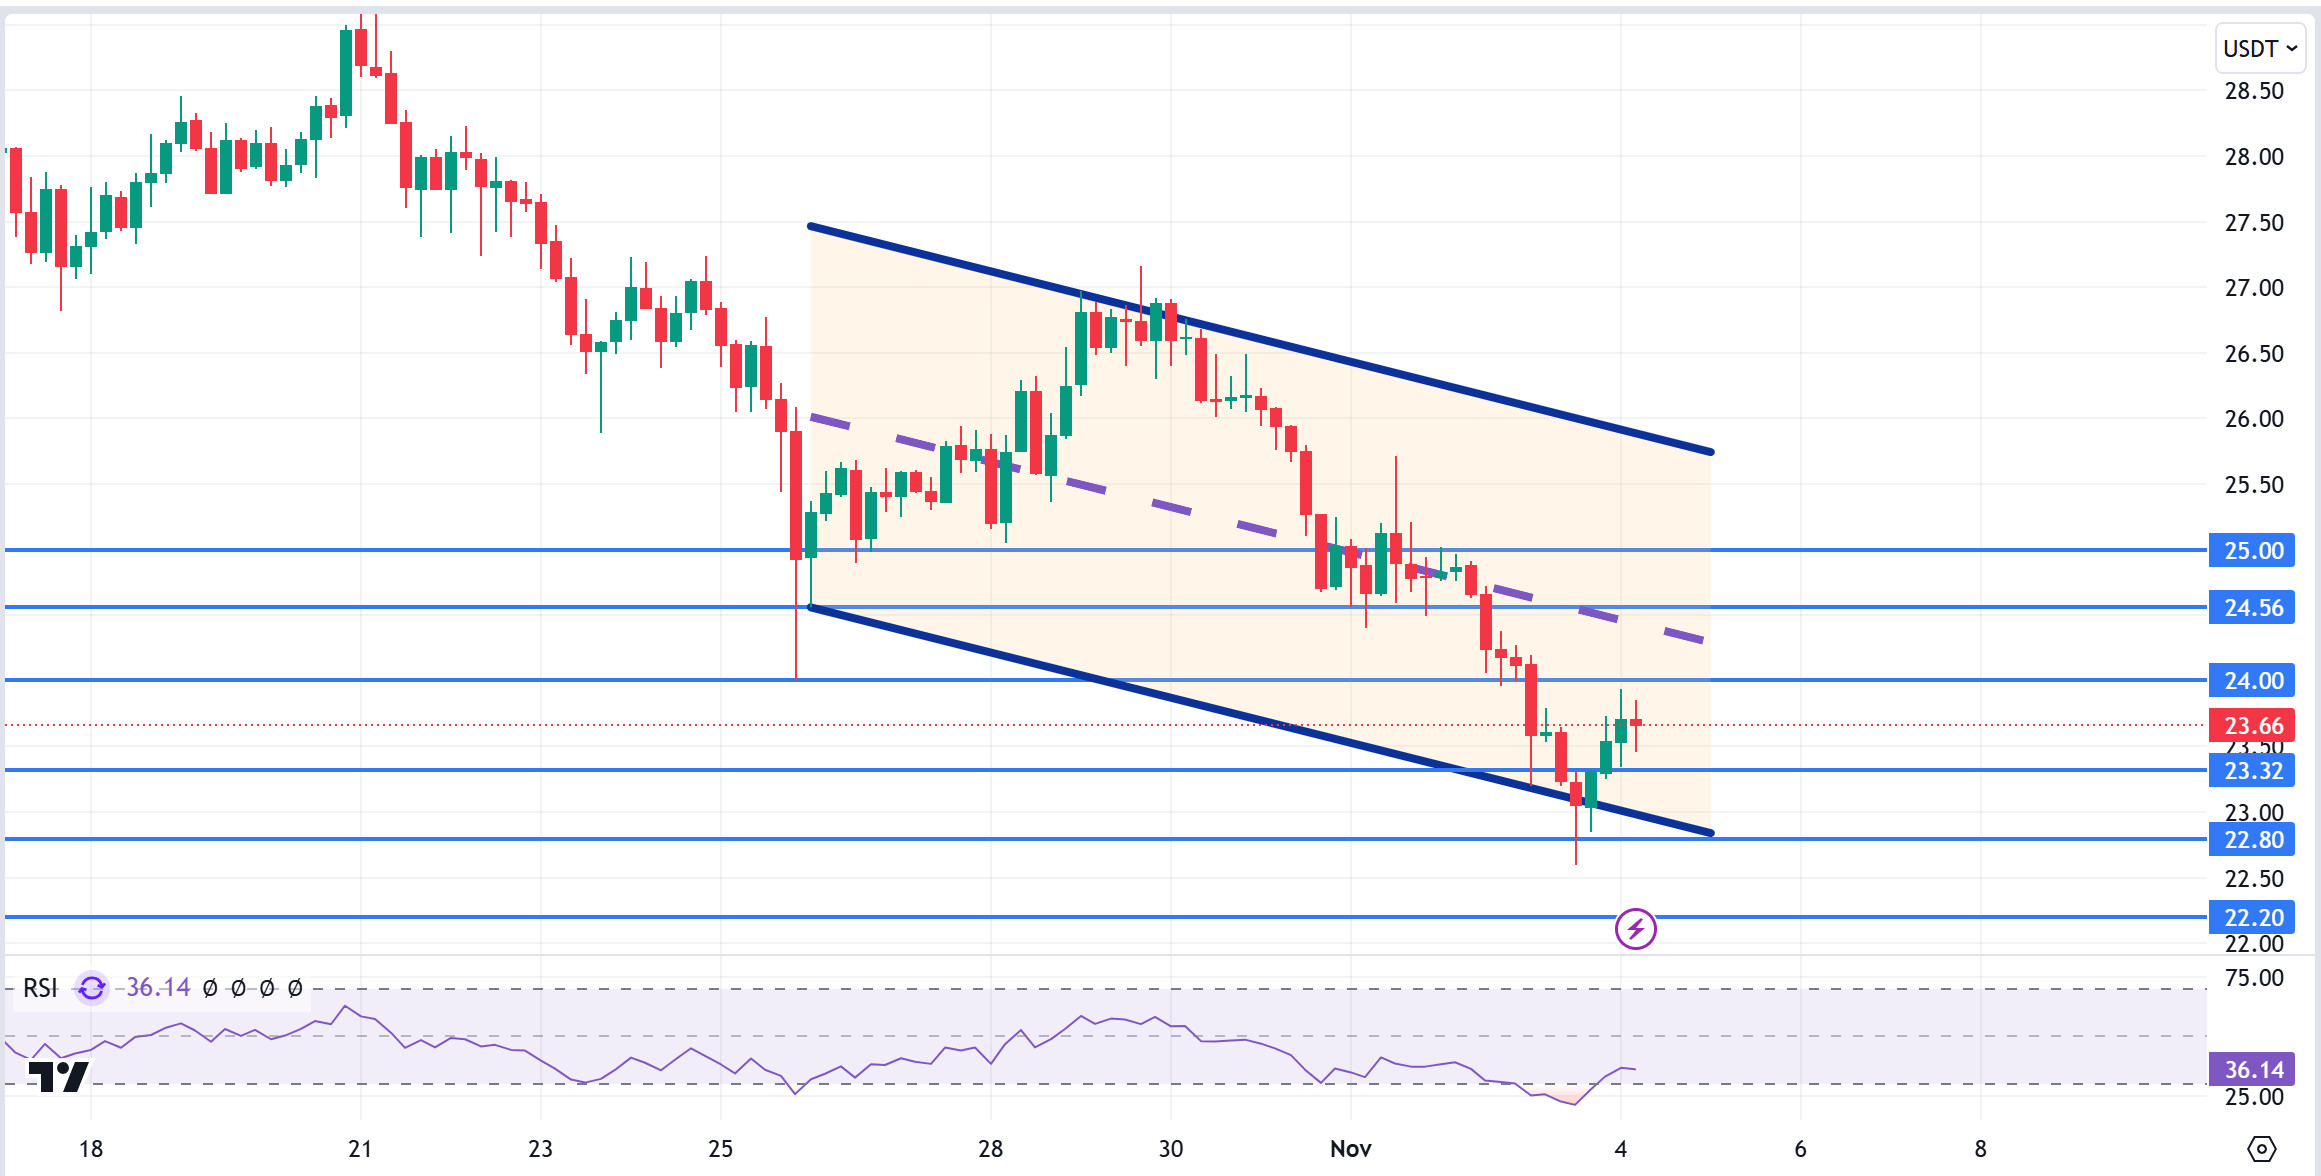
AVAX, currently trading at 23.66, is moving within the bearish channel on the 4-hour chart. It is in the lower band of the bearish channel and with a Relative Strength Index value of 36, it can be expected to rise slightly from these levels. In such a case, it may test the 24.00 resistance. On the other hand, selling pressure may increase if there is news of increasing tension in the Middle East. In such a case, it may test 23.32 support. As long as it stays above 22.80 support during the day, the desire to rise may continue. With the break of 22.80 support, sales may increase.
Supports 23.32 – 22.80 – 22.20
Resistances 24.00 – 24.56 – 25.00
TRX/USDT
TRX, which started yesterday at 0.1662, fell 0.5% during the day and closed the day at 0.1651. There is no scheduled data for the market today. The market will be closely following the news flows regarding the US elections and the tension in the Middle East.
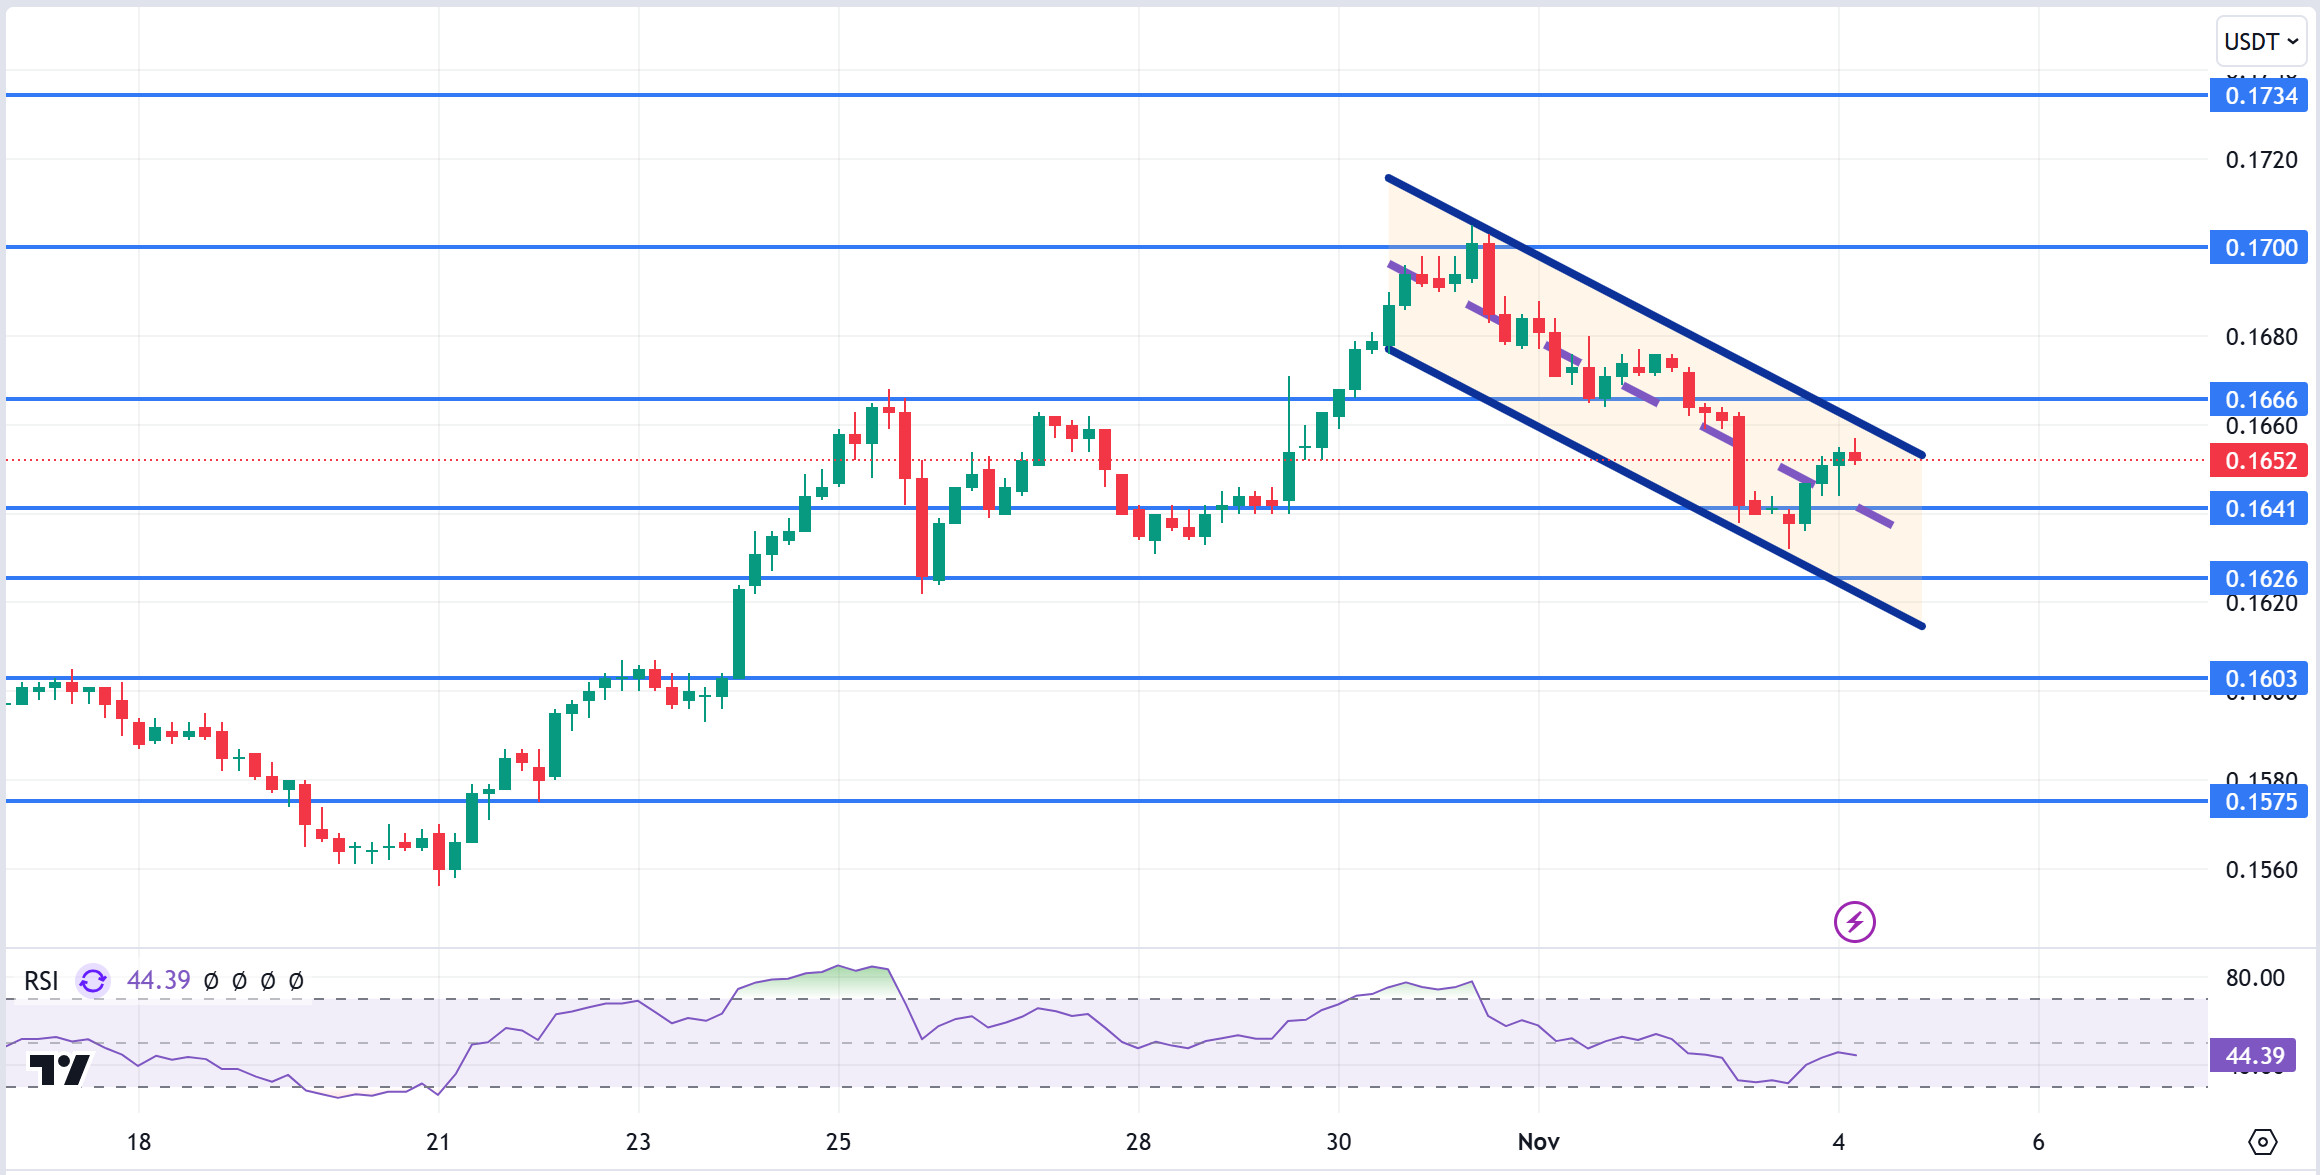
TRX, currently trading at 0.1652, is in the upper band of the bearish channel on the 4-hour chart. Relative Strength Index value is 44 and it can be expected to decline slightly from its current level. In such a case, it may test the 0.1641 support by moving to the channel middle band. However, if it cannot close the candle under 0.1641 support, it may test 0.1666 resistance with the buying reaction that will occur. As long as TRX stays above 0.1482 support, the desire to rise may continue. If this support is broken downwards, sales can be expected to increase.
Supports 0.1641 – 0.1626 – 0.1603
Resistances 0.1666 – 0.1700 – 0.1734
DOT/USDT
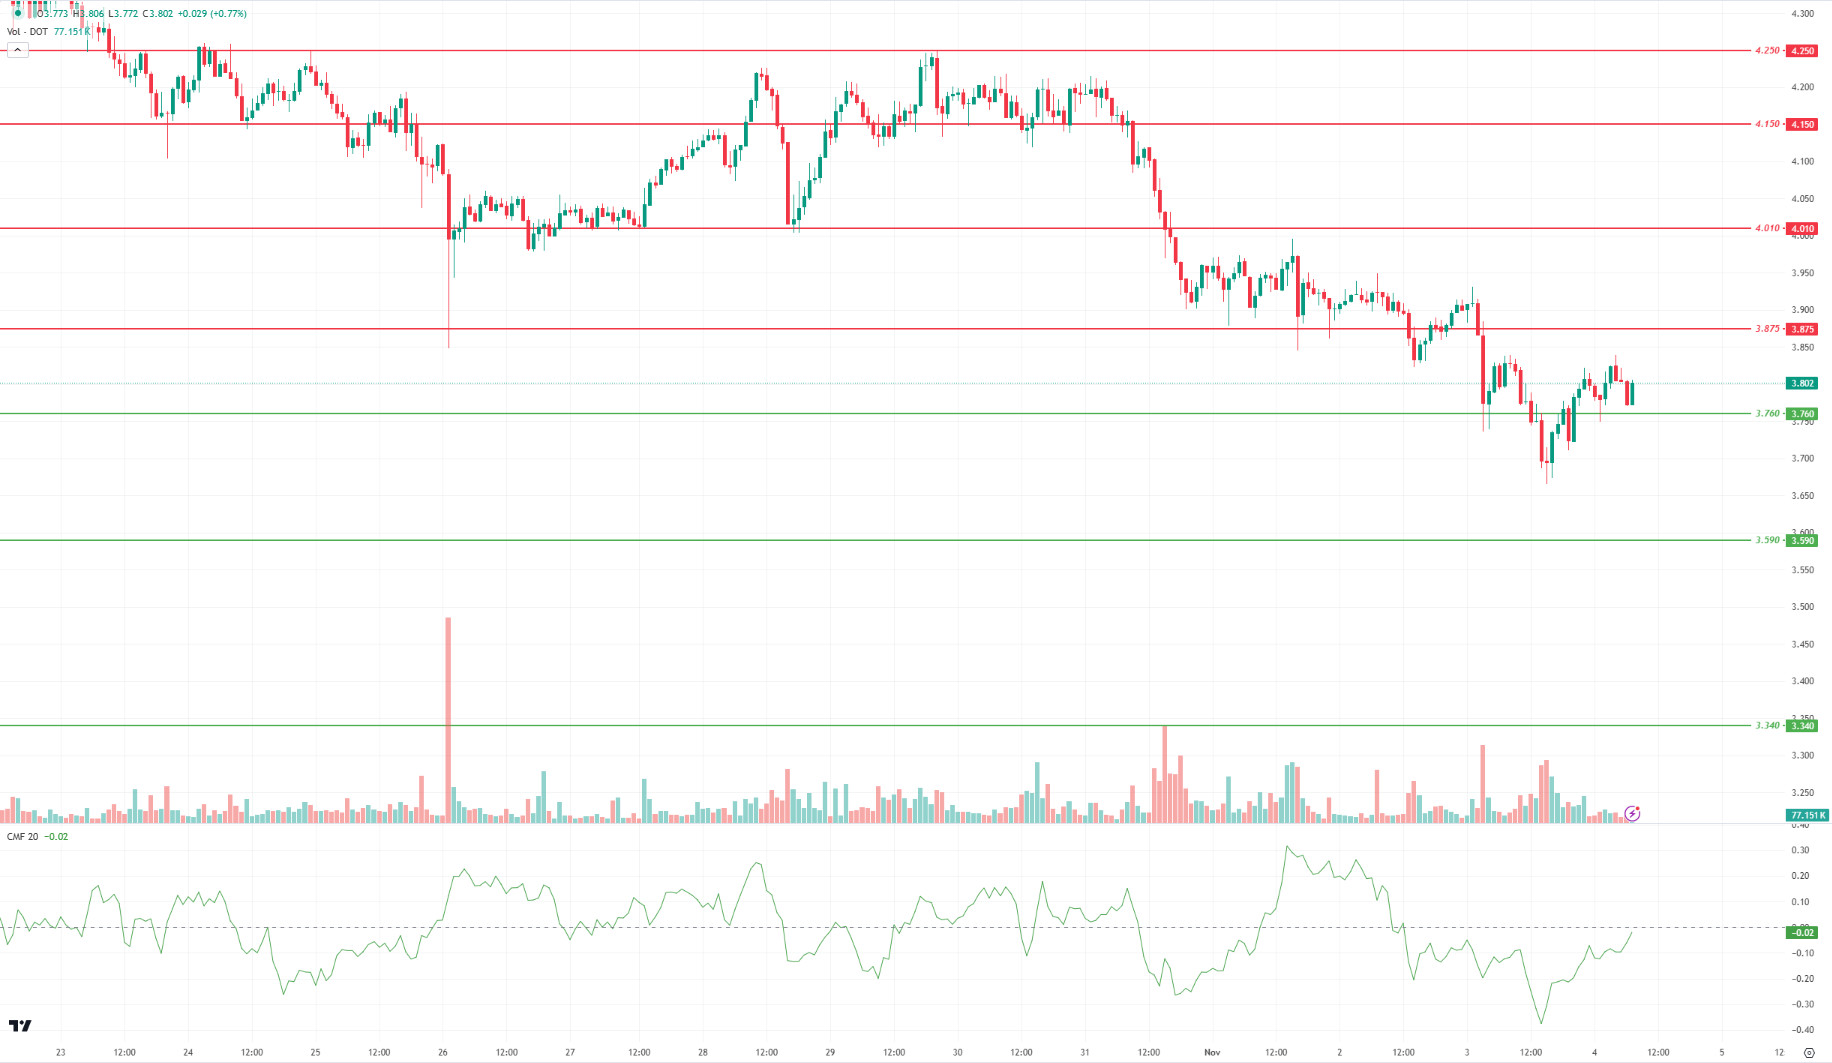
When we examine the Polkadot (DOT) chart, the price broke down the 3.875 support level and managed to hold above the 3.760 support band. When we examine the Chaikin Money Flow (CMF) oscillator, we see that the selling pressure is stronger, although the buyer pressure has increased compared to the previous hours. In this context, if the price persists below the 3.760 level, there may be pullbacks towards 3.590 levels. On the other hand, if the price maintains above the 3.760 level, we may see a movement towards the 3.875 band, which is the first resistance level.
Supports 3,760 – 3,590 – 3,340
Resistances 3.875 – 4.010 – 4.150
SHIB/USDT
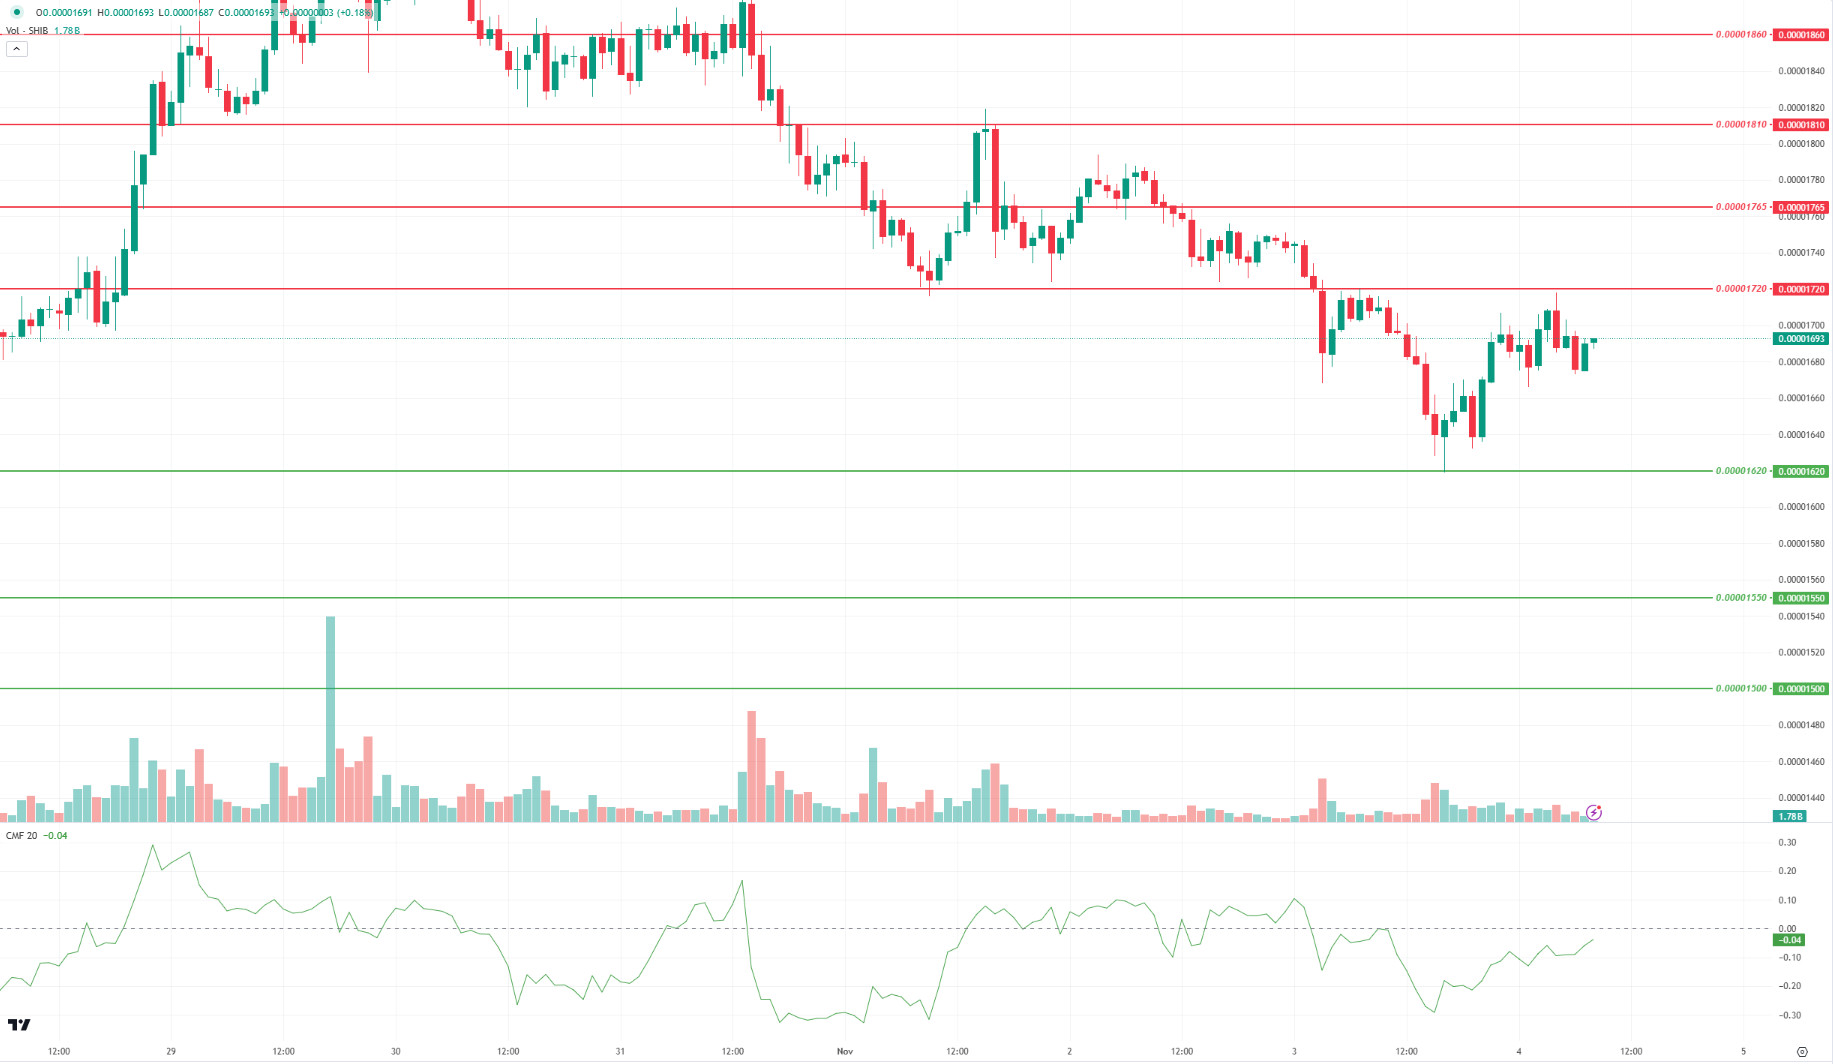
Shiba Inu (SHIB) fell to the 0.00001620 support level. SHIB, which reacted from the 0.00001620 support level, seems unable to break the selling pressure at 0.00001720. When we analyze the Chaikin Money Flow (CMF) oscillator, we can say that the selling pressure is stronger, although the buyer pressure has increased compared to the previous hour. In this context, the price may retest the 0.00001620 levels. On the other hand, the price may want to break the selling pressure at 0.00001720 with the increase in buyer pressure.
Supports 0.00001620 – 0.00001550 – 0.00001500
Resistances 0.00001720 – 0.00001765 – 0.00001810
LEGAL NOTICE
The investment information, comments and recommendations contained herein do not constitute investment advice. Investment advisory services are provided individually by authorized institutions taking into account the risk and return preferences of individuals. The comments and recommendations contained herein are of a general nature. These recommendations may not be suitable for your financial situation and risk and return preferences. Therefore, making an investment decision based solely on the information contained herein may not produce results in line with your expectations.


