
MARKET SUMMARY
Latest Situation in Crypto Asset
| Assets | Last Price | 24h Change | Dominance | Market Cap |
|---|---|---|---|---|
| BTC | 74,793.49 | +0.49% | 58.92% | 1.48 T |
| ETH | 2,802.77 | +8.11% | 13.45% | 337.66 B |
| SOLANA | 187.42 | +0.80% | 3.52% | 88.38 B |
| XRP | 0.5556 | +3.59% | 1.26% | 31.61 B |
| DOGE | 0.1913 | -6.44% | 1.12% | 28.02 B |
| TRX | 0.1613 | -0.83% | 0.56% | 13.95 B |
| CARDANO | 0.3686 | +1.54% | 0.51% | 12.91 B |
| AVAX | 26.96 | +2.97% | 0.44% | 10.98 B |
| SHIB | 0.00001849 | -3.50% | 0.43% | 10.91 B |
| LINK | 12.28 | +4.26% | 0.31% | 7.70 B |
| DOT | 4.087 | -0.23% | 0.25% | 6.20 B |
*Prepared on 11.7.2024 at 06:00 (UTC)
WHAT’S LEFT BEHIND
Ripple Legal Director: Trump Could Make the U.S. the Crypto Capital
Stuart Alderoty, chief legal officer of Ripple, emphasized that the new president Donald Trump should make the necessary regulations for the US to become a leader in the cryptocurrency space. Alderoty stated that America could become the crypto capital of the world if a suitable regulatory environment is provided.
Tether Treasury Injects 1.845 Billion USDT
On November 7, Spot On reported that Chain monitoring showed that Tether Treasury injected 1.845 billion USDT into the CEX exchange via the Ethereum chain in the last 12 hours, of which $1.706 billion went to Binance, $101.7 million to Coinbase, $20 million to OKX and $17.86 million to Kraken.
BlackRock’s Spot Bitcoin ETF IBIT
According to The Block, a day after Trump won the US presidential election, BlackRock’s IBIT spot bitcoin ETF reported that trading volume soared to $1 billion within 20 minutes of opening, setting a single-day trading volume record. Subsequently, the price of bitcoin quickly surpassed $75,000 and reached an all-time high.
Elon Musk’s Net Worth 20.9 billion
Tesla (TSLA) closed up 14.75% on Wednesday US time, after the Elon Musk-backed Trump won the US presidential election. Tesla’s sharp rise boosted founder and CEO Elon Musk’s net worth by $20.9 billion in a single day, according to the Forbes rich list, bringing his total assets to $285.6 billion, far surpassing Jeff Bezos, who ranks second on the world’s richest list.
Avalanche Foundation
The Block reports that the Avalanche Foundation has been approved by the court to repurchase 1.97 million AVAX tokens worth approximately $52 million purchased from the bankrupt Luna Foundation Guard (LFG), according to The Block.
Important Economic Calender Data
| Time | News | Expectation | Previous |
|---|---|---|---|
| Neon (NEON) – 53.91 Million Tokens Unlock | |||
| Kaspa (KAS) – Meetup in Zurich, Switzerland | |||
| Hashflow (HFT) – 160.4 Million Tokens Unlock | |||
| 13:30 | US Initial Jobless Claims | 223K | 216K |
| 19:00 | US FED Interest Rate Decision | 4.75% | 5.00% |
| 19:00 | US FOMC Statement | ||
| 19:30 | US FOMC Press Conference | ||
INFORMATION
*The calendar is based on UTC (Coordinated Universal Time) time zone. The economic calendar content on the relevant page is obtained from reliable news and data providers. The news in the economic calendar content, the date and time of the announcement of the news, possible changes in the previous, expectations and announced figures are made by the data provider institutions. Darkex cannot be held responsible for possible changes that may arise from similar situations.
MARKET COMPASS
Following the highly anticipated US elections, Trump’s victory formed the basis for the sharp rises in digital assets. While Bitcoin recorded new record highs, Wall Street indices also made significant gains yesterday on expectations of the new president’s fiscal policies. Today, eyes will be on the second important news from the US.
Fed and Rate Cut after Trump… Will the course be redrawn?
The Federal Open Market Committee (FOMC) of the US Federal Reserve (FED), which will conclude today, will be another decisive development for the markets. The next move of the bank, which started the interest rate cut cycle with 50 basis points in September, is eagerly awaited. Expectations are weighted towards a 25 basis point rate cut this time.
In the aftermath of Trump’s victory, the size of the rate cut, Chairman Powell’s statements and the guidance for the next interest rate level will be the main topics that will shape the markets.
When we look at the “dot plot” graph showing the expectations of the FOMC members, which was published together with the September statement, we see that the officials foresee that by the end of 2024, the policy rate will be at 4.25-4.50% from 4.75-5%. This implies a 50 bps rate cut by the end of the year, and we agree that this course will be followed with two 25 bps rate cuts in the remaining two meetings of the year. However, the key question is, “Would the Fed want to be more cautious about further rate cuts due to inflation that may start to rise again after Trump’s expansionary fiscal policies?” We will try to understand this both in the dot plot and Powell’s statements.
FOMC Dot Plot Chart
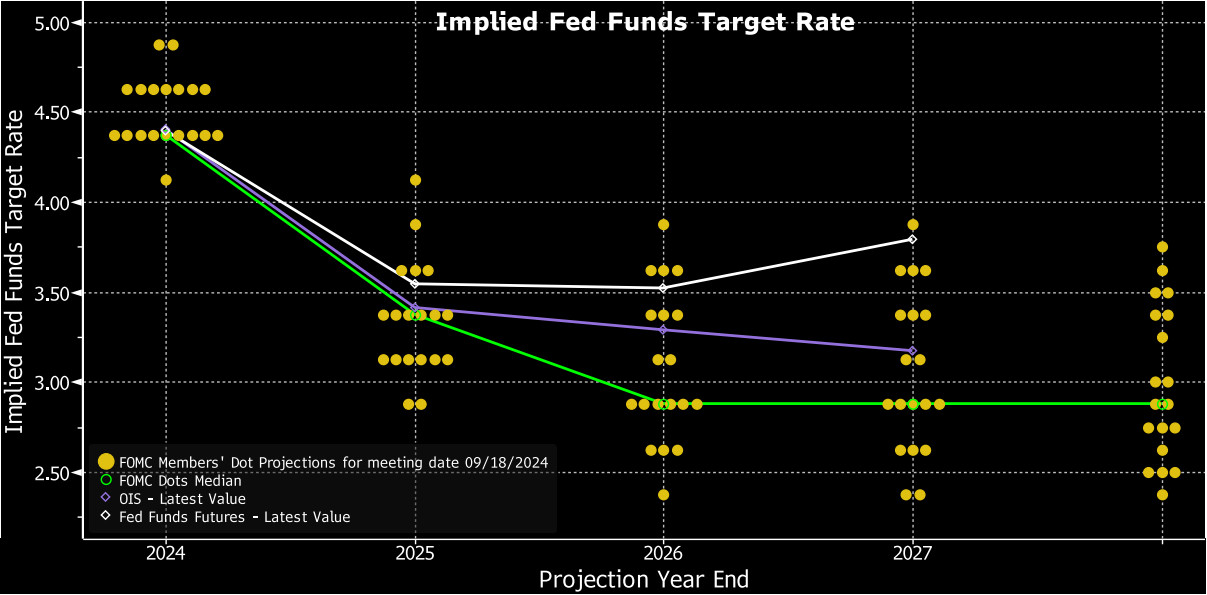
What are the expectations?
When we evaluate the components of the equation, we think that the FOMC will decide for a 25 basis point rate cut in November. In addition, markets also expect another 25 basis point cut at the December meeting, which is in line with our baseline scenario. On the other hand, we think that this route is largely priced in and if the FED cuts today in line with expectations and signals another 25 basis point cut for the December meeting, the positive impact on digital assets will be limited.
One of the roadmaps that would be a surprise would be the FED’s stance that is not very favorable to further rate cuts. This seems to be one of the possible scenarios after Trump’s victory. In such a case, we anticipate that this will have a negative impact on digital assets as the probability of a rate cut in December will decrease. We think that it is very unlikely that the FED will decide to cut interest rates by more than 25 basis points or send such a message for the next meeting.
From the short term to the big picture
The victory of former President Trump, which was one of the main pillars of our bullish expectation for the long-term perspective in digital assets, produced a result in line with our forecasts. For the short term, given the nature of the market and pricing behavior, we think it would not be surprising to see some respite or retracement in digital assets after this expectation. At this point, it would be useful to underline again that fundamental dynamics remain bullish. While the expansion of the largest digital currency Bitcoin’s record high may encourage buyers to take new, upside positions, we will watch this group struggle with the crowd that may want to take profit realizations. Also, the results from the FOMC meeting today will be extremely important for digital assets.
TECHNICAL ANALYSIS
BTC/USDT
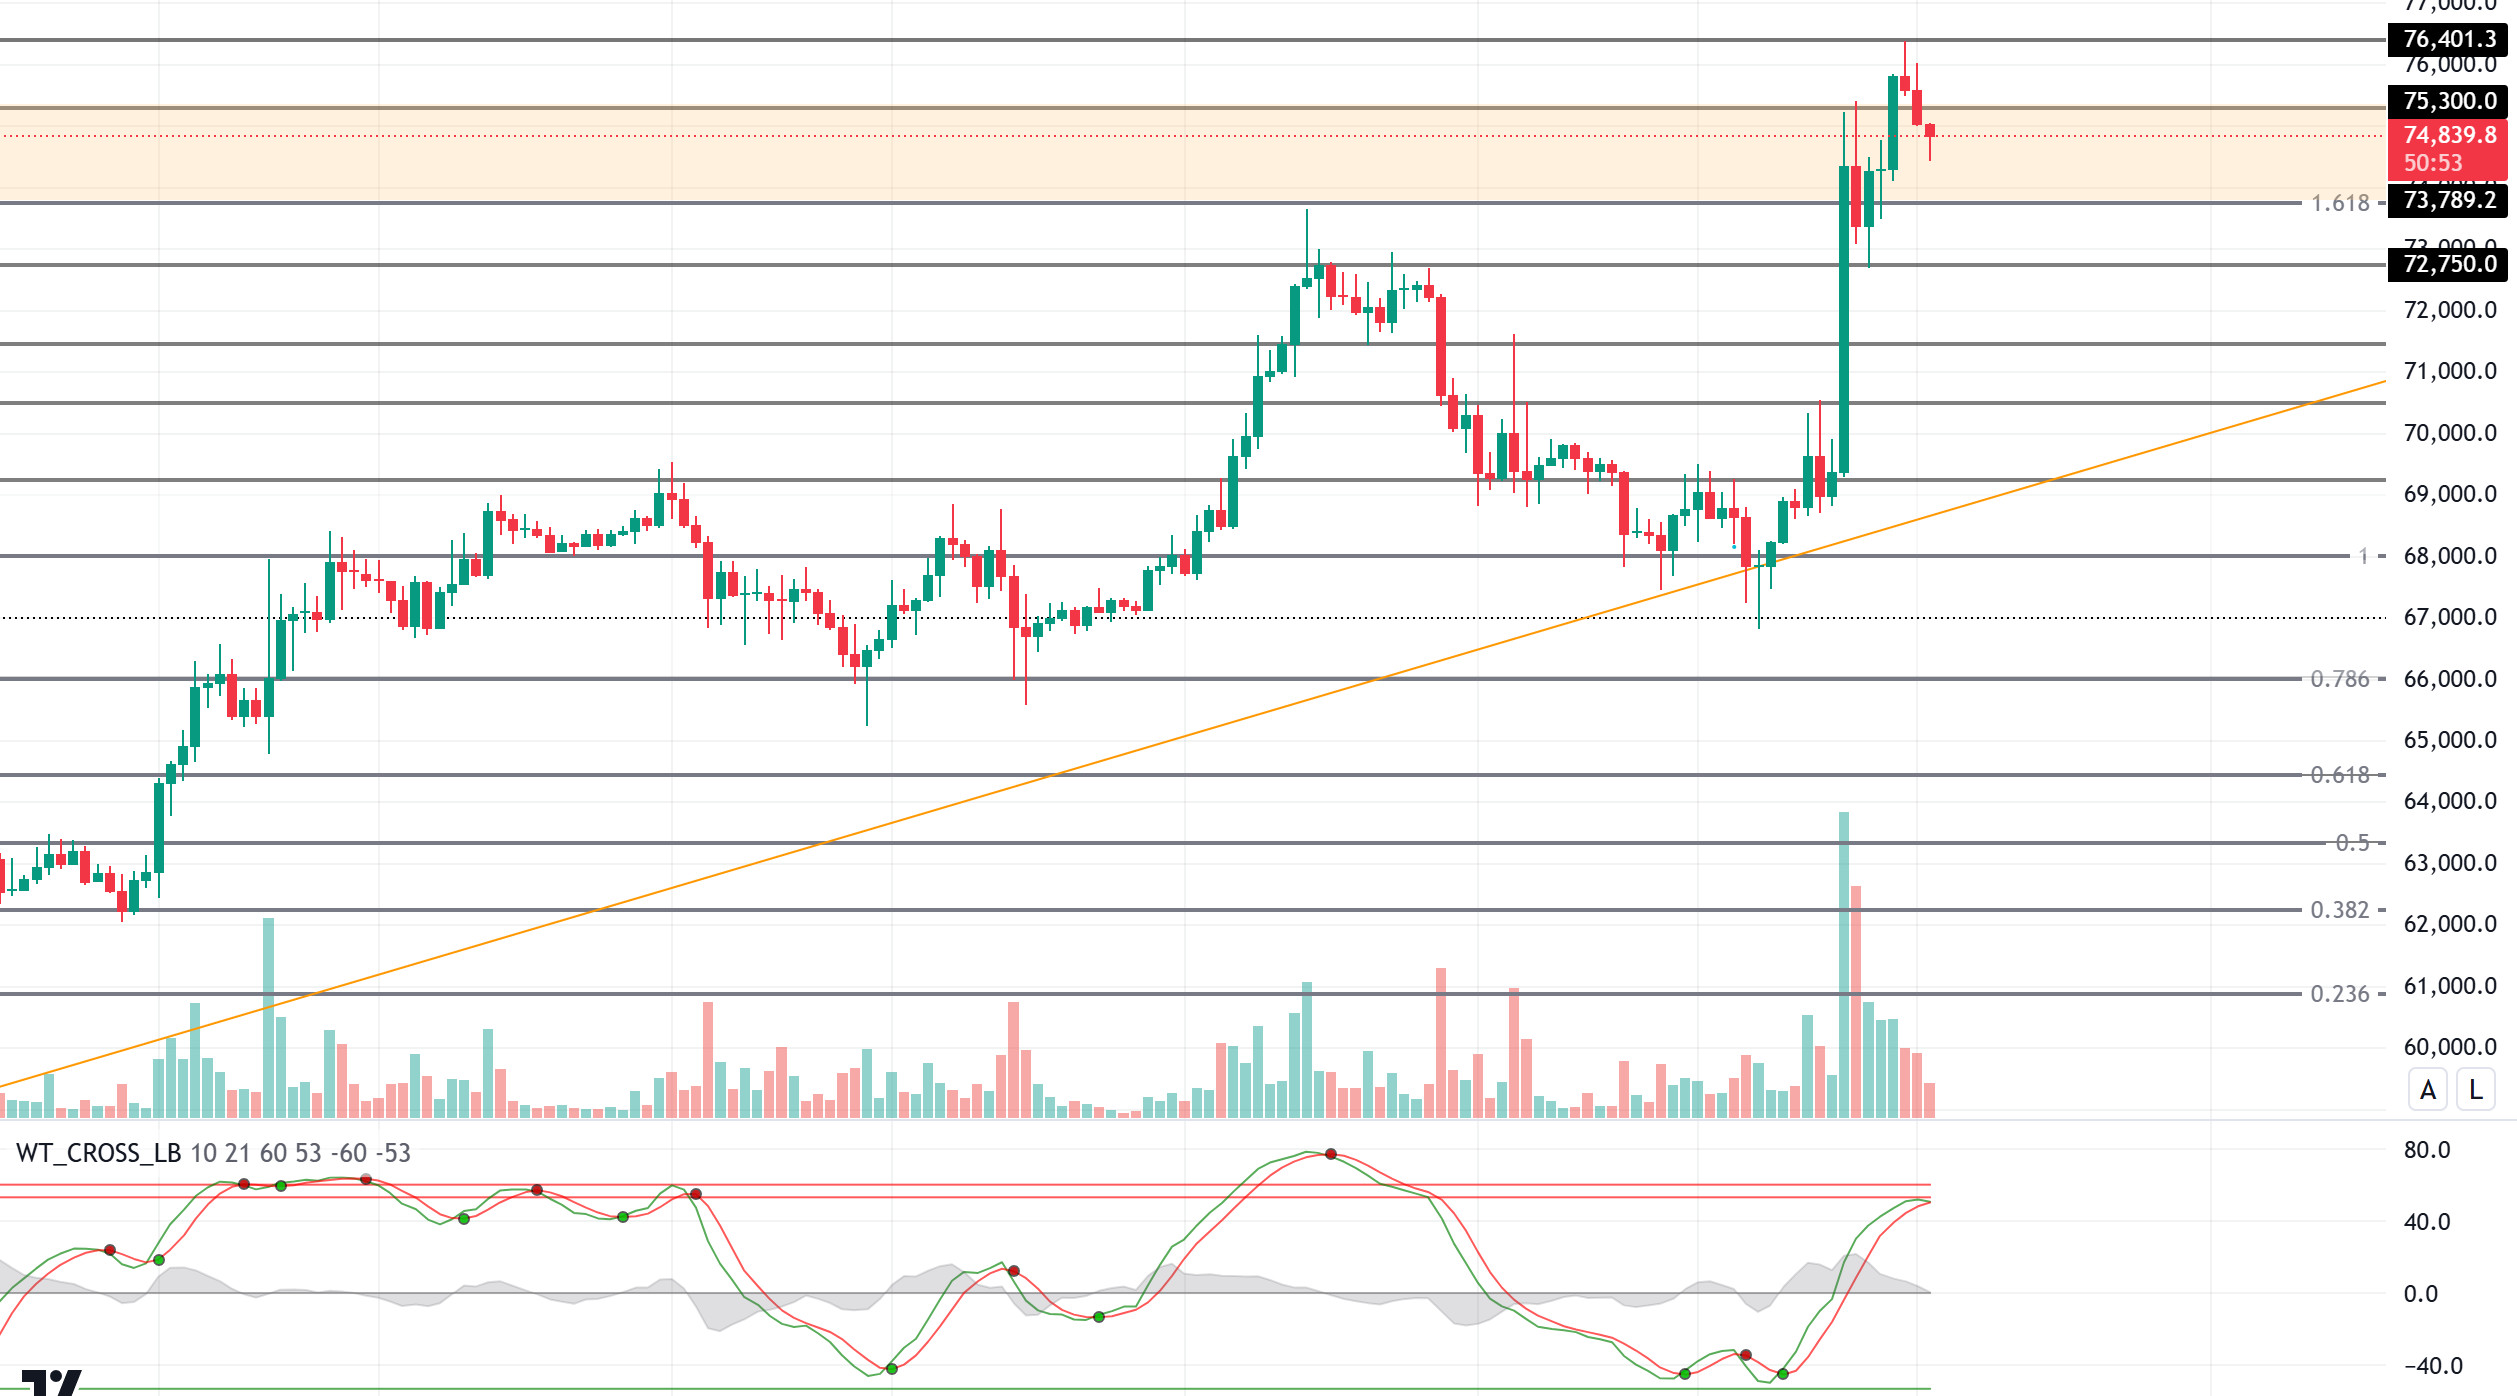
The rally in Bitcoin after the US elections continues with new peak attempts. Spot Bitcoin ETFs, where institutional investors exited for three consecutive days due to pre-election uncertainty, witnessed positive inflows again. Positive inflows pushed Bitcoin to the 76,400 level, providing a new ATH level. Today, eyes will be on the FED interest rate decision. According to CME data, a 25 basis point rate cut is almost certain with 97%.
With all these developments, in the BTC technical outlook, with the opening of the US stock markets yesterday, positive pricing on the stock side with the support of spot ETFs pushed Bitcoin to the 76,400 level. Then, unable to hold on to the new ATH level, BTC fell back below 75,000. For a new bullish move, the consolidation of the price between 73,000 and 76,000 levels may help it regain momentum. President D. Trump’s statements and the steps to be taken in line with his promises may bring a movement towards the Fibonacci 2.618 (83,000) level in BTC. Unless there is an extraordinary development, declines in BTC may continue to be in the form of bullish corrections. Looking at the major ascending trend line, the depth of the correction is seen at the 70,000 level as the new low.
Supports 73,789 – 72,750 – 71,453
Resistances 75,300 – 76,400- 83,060
ETH/USDT
Ethereum was stuck at the level of 2,649 with the rise experienced yesterday. Breaking this level gave momentum to the rise, bringing it up to 2.880 levels. The Relative Strength Index (RSI) level entered the overbought zone, indicating that some correction could be coming for ETH. It is currently down to 2,800 levels. On the other hand, Chaikin Money Flow (CMF), Commodity Channel Index (CCI), Money Flow Index (MFI) and momentum remain positive. In addition, looking at CVDs, it is seen that the rise in the night hours is spot-weighted. High transfers to Beacon Chain and the increase in the number of staked ETHs can be listed as other factors contributing to the positive outlook. In the light of this data, it can be said that if the correction for ETH, which has exceeded important resistance levels, does not exceed the 2,768 level, the rises can continue up to 3,045 levels. If it goes below 2,768, declines can be seen up to 2,722.
Supports 2,768 – 2,722 – 2,649
Resistances 2,811 – 2,921 – 3,045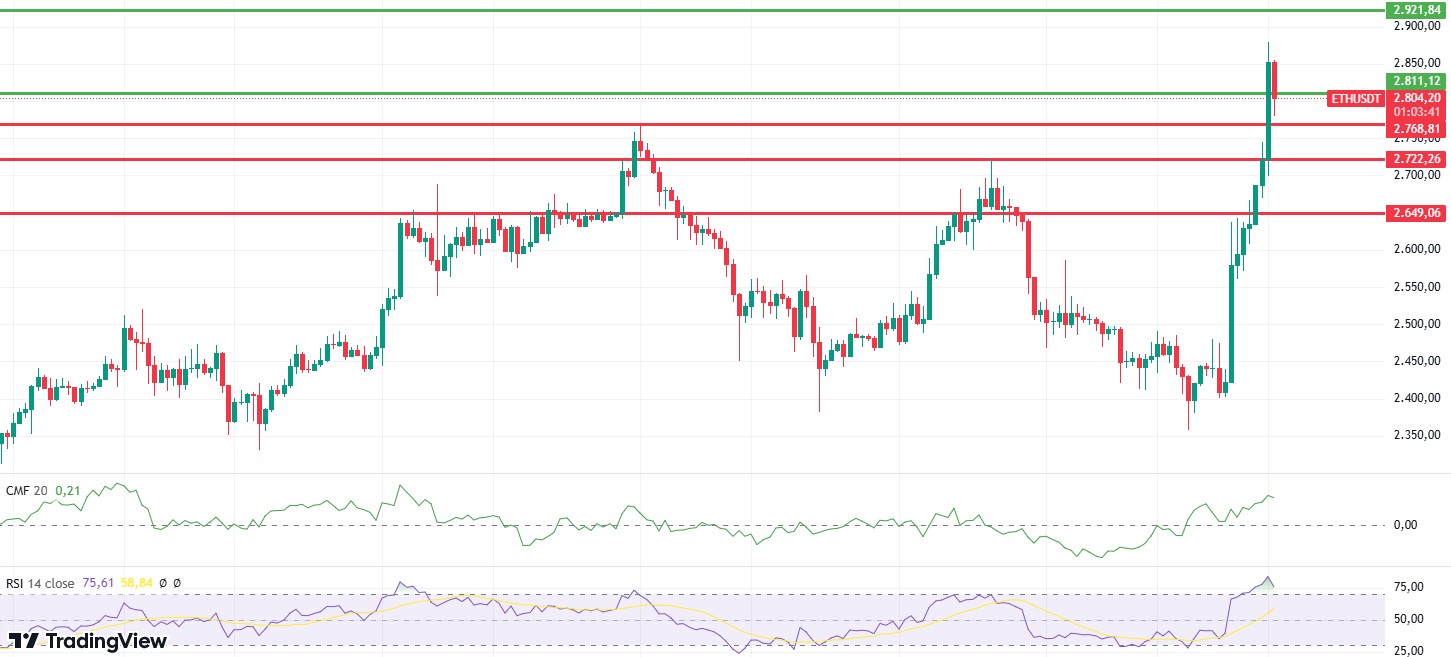
LINK/USDT
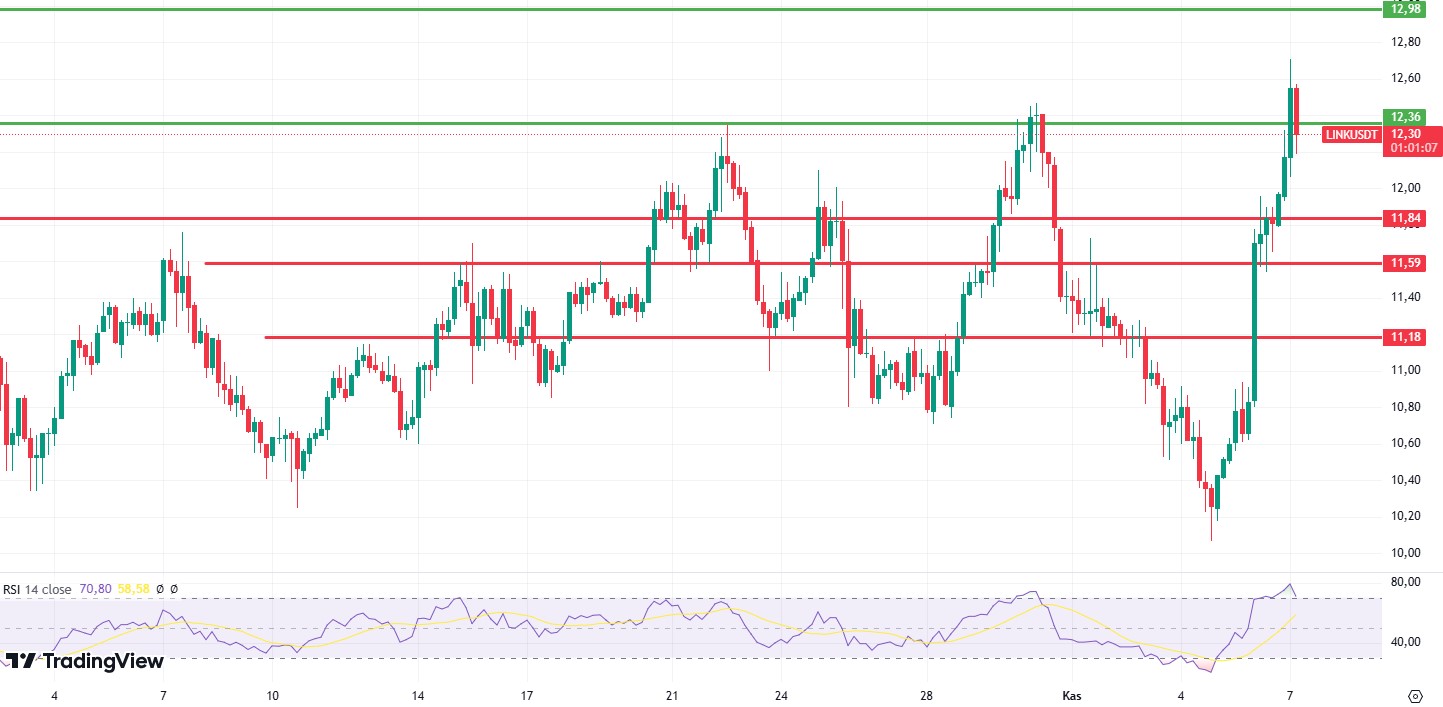
While LINK continued to rise as it exceeded the 12.36 level, it fell below this level again with the correction in the market. Although there is the potential to rise up to 12.98 with the re-break of this level during the day, the Relative Strength Index (RSI) level fell from the overbought zone to below 70, indicating that the correction may continue for some more time. On the other hand, the ETH price exceeding important supports and the increase in onchain activities may increase demand for LINK in the short and medium term. For this reason, an upward breakout of the region between 12.36 and 12.98 could accelerate the rise.
Supports 11.84 – 11.59 – 11.18
Resistances 12.36 – 12.98 – 13.77
SOL/USDT
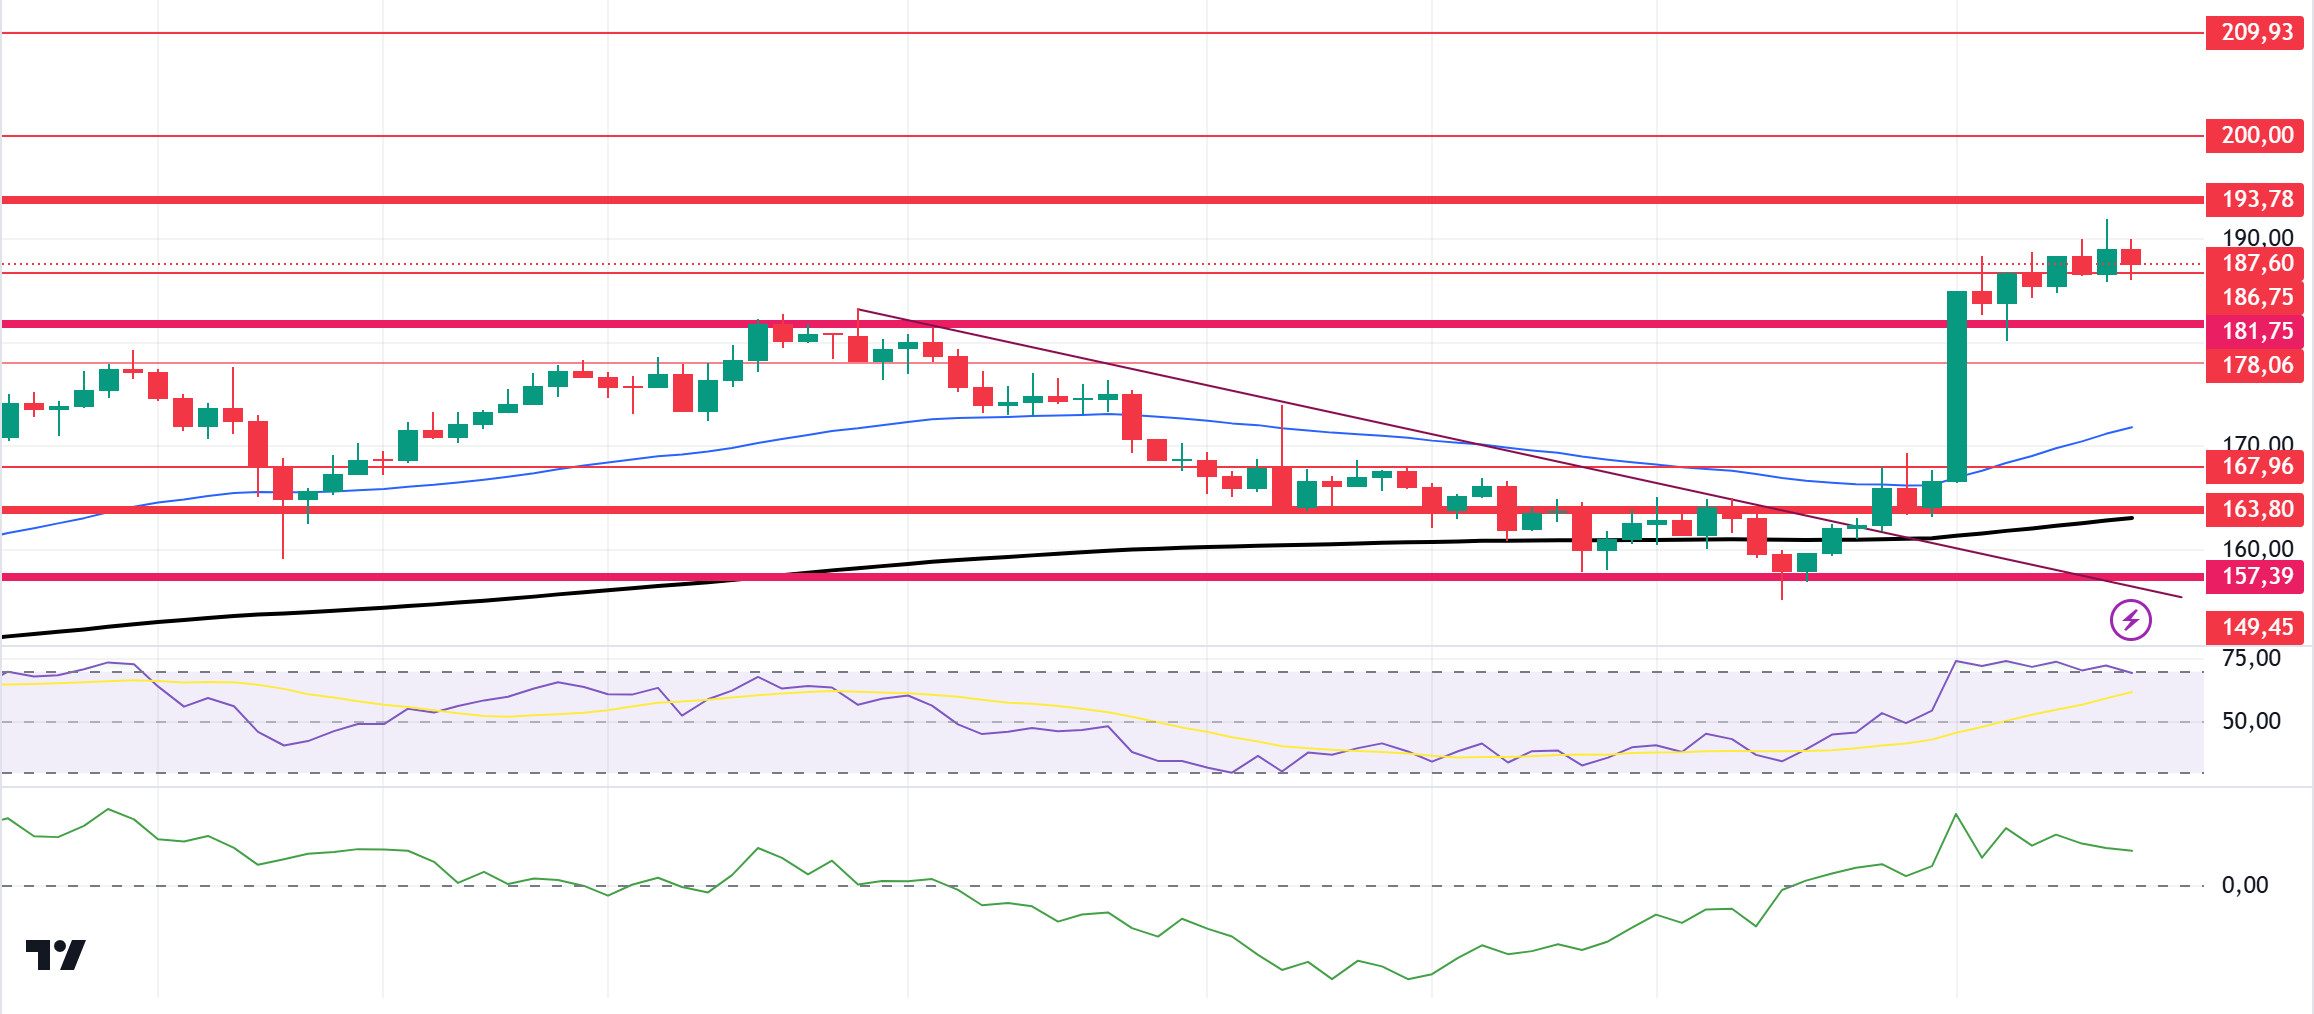
The interest rate decision from the US today is a very important data to follow. According to the data from CME, the probability of a 25 basis point rate cut from the FED meeting is 95.5%. Another data will be Unemployment benefit applications. In the Solana ecosystem, the Open Interest (OI) rate also showed a significant increase. Currently, OI has reached its highest level since April 1st at $3.01 billion. Meanwhile, Solana’s total locked value (TVL) has increased by 12% from $5.93 billion on November 5th to $6.70 billion today. The memecoin market on Solana reached an astonishing milestone, with the total market capitalization rising sharply by 30% in the last 24 hours to an all-time high of $12 billion. From a technical point of view, SOL broke strongly through 181.75, which we call critical resistance, and ran it as a support level. With this move, it moved upwards from the region where it has been consolidating for about 4 months. In the 4-hour timeframe, the 50 EMA (Blue Line) continues to be above the 200 EMA (Black Line). This may mean that the rise will continue. Relative Strength Index (RSI)14 is in the overbought zone, which may bring profit sales. At the same time, when we examine the Chaikin Money Flow (CMF)20 indicator, we see that although money inflows are positive, they are decreasing. The 193.78 level stands out as a very strong resistance point in the rises driven by both macroeconomic conditions and innovations in the Solana ecosystem. If it rises above this level, the rise may continue strongly. In case of retracements due to possible political reasons or profit sales, the 181.75 support level may be triggered again. If the price hits this support level, momentum may increase and a potential bullish opportunity may arise.
Supports 186.75 – 181.75 – 178.06
Resistances 193.78 – 200.00 – 209.93
ADA/USDT
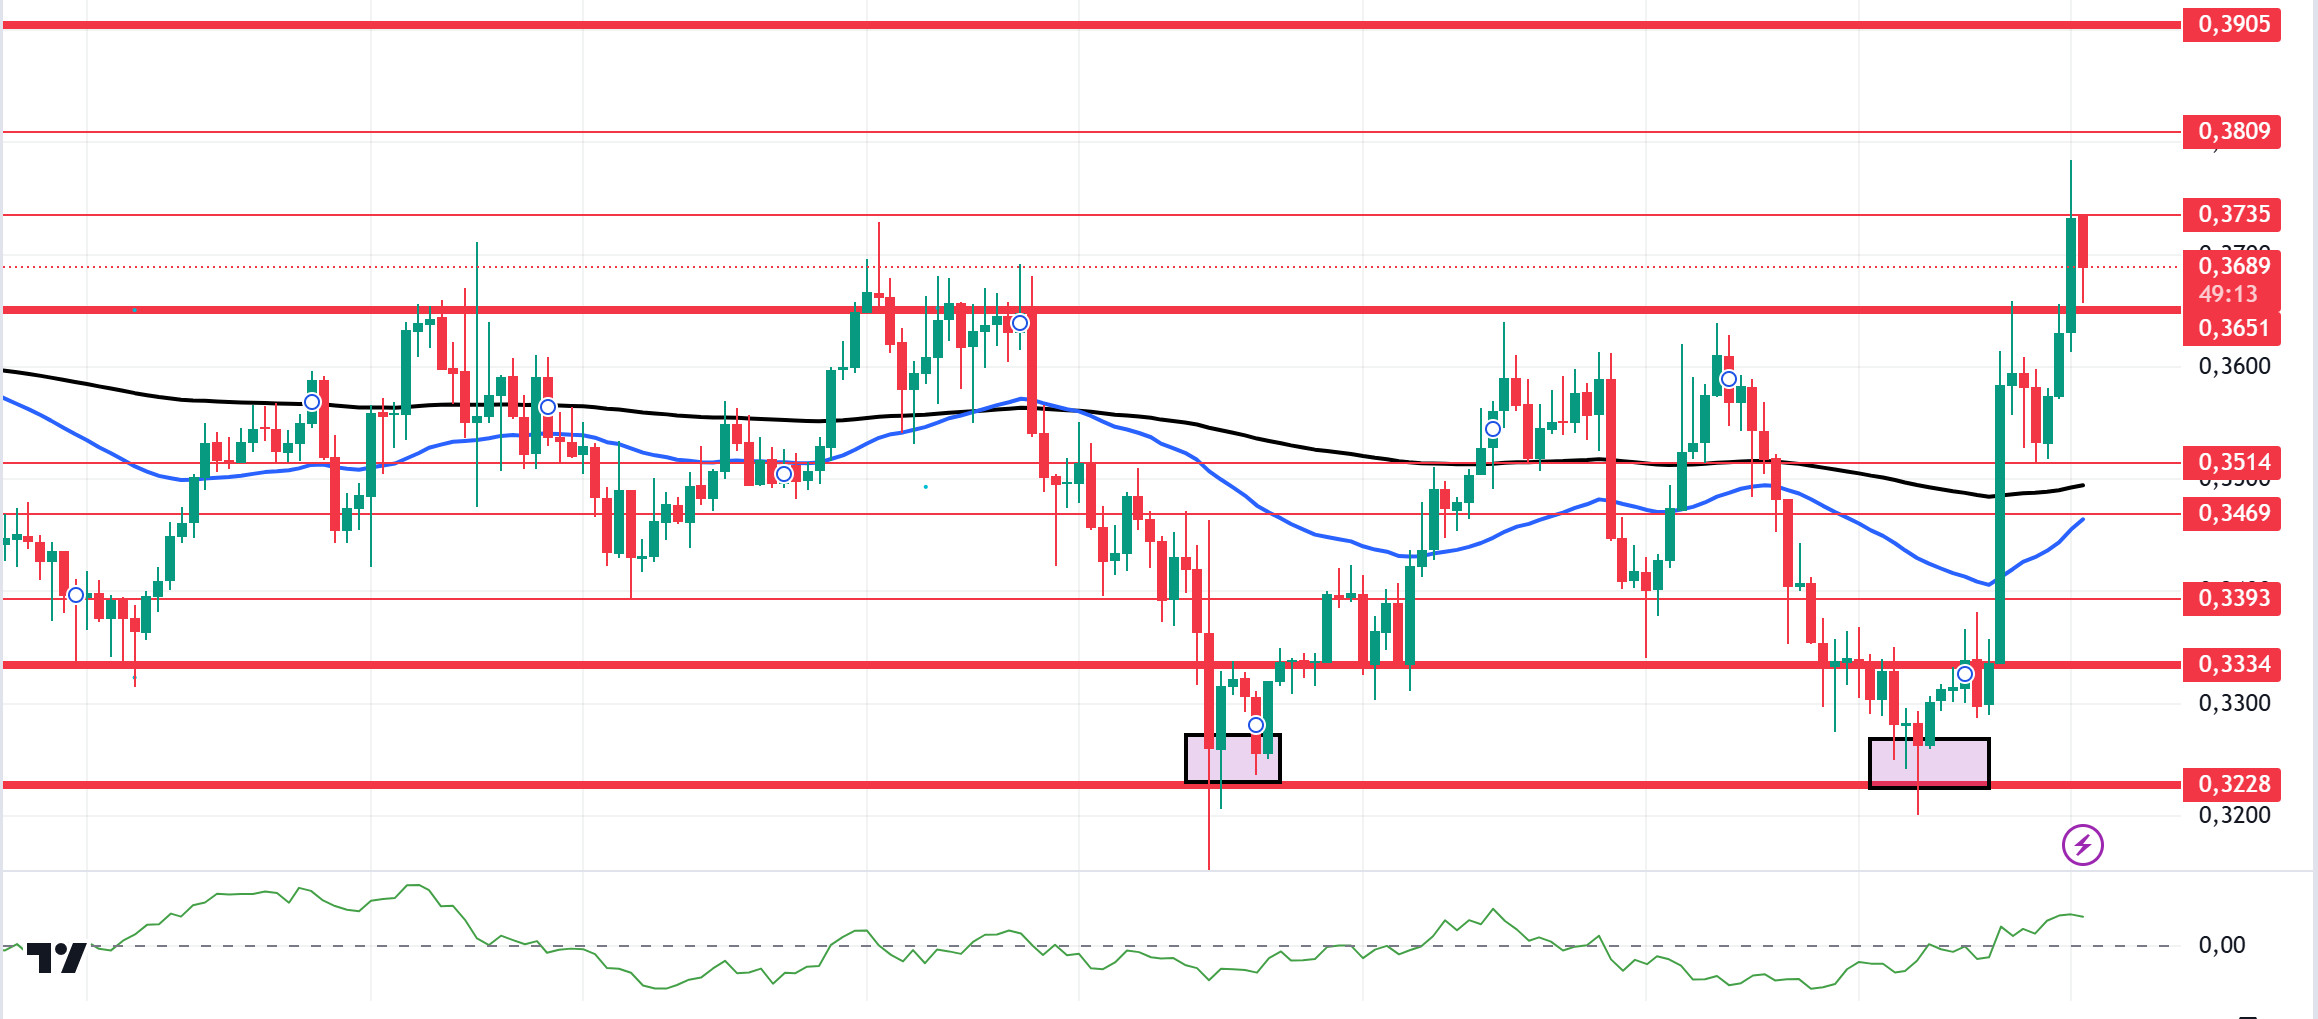
The interest rate decision from the US today is a very important data to follow. According to the data from CME, the probability of a 25 basis point rate cut from the FED meeting is 95.5%. Another data will be Unemployment benefit applications. In the Cardano ecosystem, funding rates have also increased significantly. At the time of writing, it jumped from 0.0008% on November 5th to 0.0111%. This increase shows that derivatives traders are opening more and more new long positions in Cardano. Technically, ADA, which has been accumulating since October 1, is pricing above the 50 EMA (Blue Line) and 200 EMA (Black Line) on the 4-hour chart. However, the 50 EMA continues to hover below the 200 EMA. Although this shows us that the trend is bearish, the convergence of the moving averages shows us that the bearish trend is decreasing. At the same time, when we examine the Chaikin Money Flow (CMF)20 indicator, we can say that money flows are increasing by moving into the positive zone. On the other hand, we can say that a double bottom formation was formed in the 0.3228 region, which is the strong resistance level, supporting the upward momentum. Considering all these, it has supported the 0.3651 level, which works as resistance. The 0.3651 level, which is the support level, should be followed in the decline that will be experienced due to the macroeconomic data and negativities in the ecosystem or in the retracements brought by profit sales. It may be appropriate to buy when it comes to this price level. In the rises due to macroeconomic data or developments in the ecosystem, the 0.3905 level should be followed. If it breaks this level, the rise may strengthen.
Supports 0.3651 – 0.3514 – 0.3469
Resistances 0.3735 – 0.3809 – 0.3905
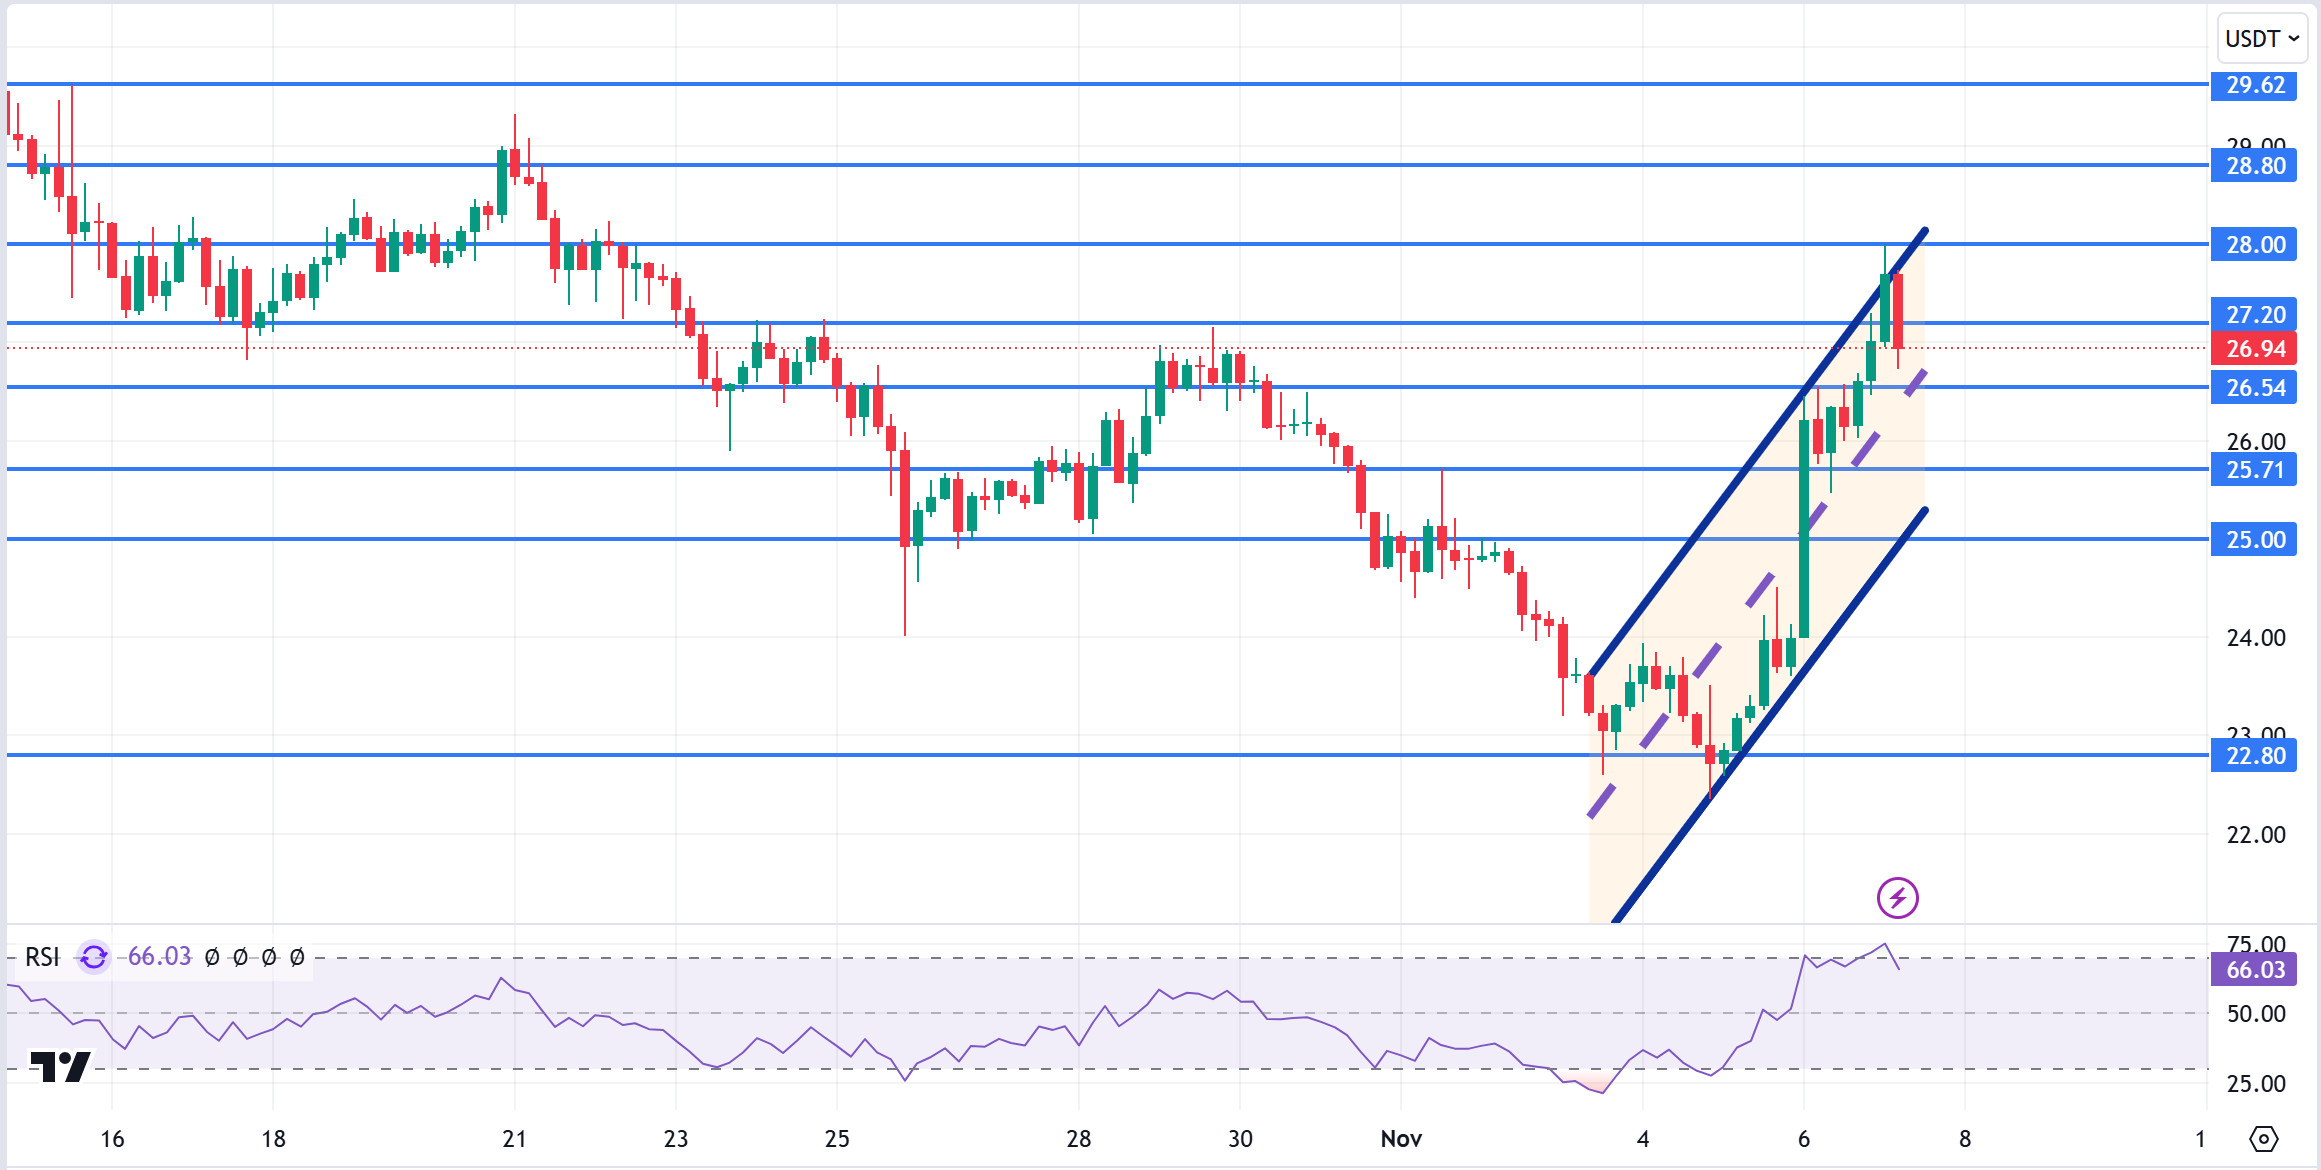
AVAX/USDT
AVAX, which opened yesterday at 24.00, rose about 12.5% during the day after the US elections and closed the day at 27.01. Today, US unemployment claims data and FED interest rate decision will be announced. The FED is expected to cut interest rates by 25 basis points. There may be high volatility in the market during the rate decision. News flows from the Middle East will be important for the market.
AVAX, which is currently trading at 26.94, is in the middle band of the bullish channel on the 4-hour chart and the Relative Strength Index value is very close to the overbought level with 66. Some decline can be expected from these levels. In such a case, it may test 26.54 and 25.71 supports. On the other hand, a buying reaction may occur as a result of the positive perception of the data to be announced today by the market. In such a case, it may test 28.00 resistance. As long as it stays above 22.80 support during the day, the desire to rise may continue. With the break of 22.80 support, sales may increase.
Supports 27.20 – 26.54 – 25.71
Resistances 28.00 – 27.20 – 28.00
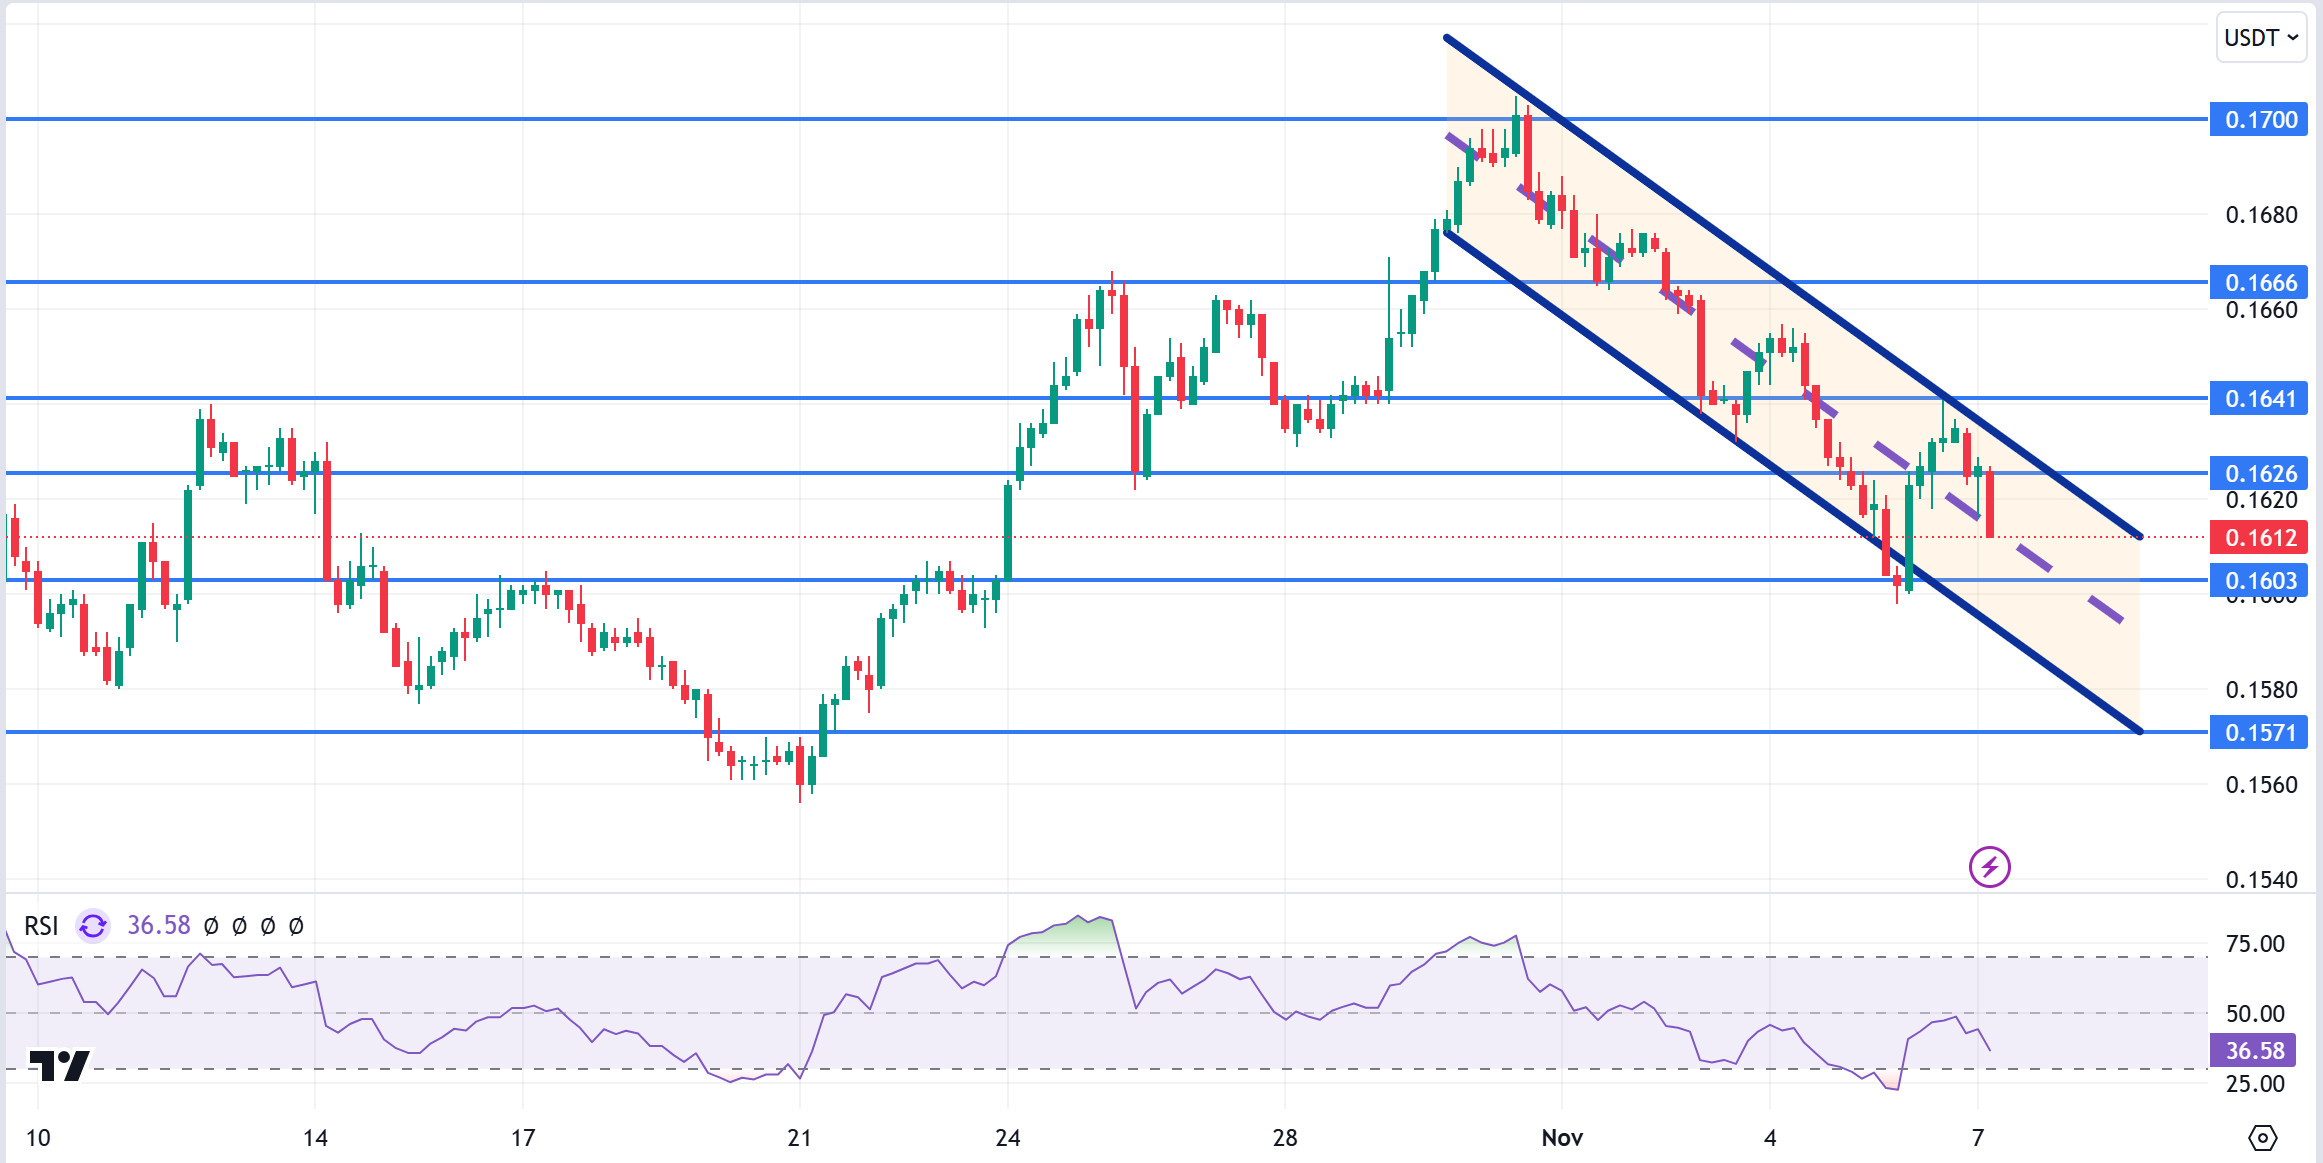
TRX/USDT
TRX, which started yesterday at 0.1601, rose about 1.5% during the day and closed the day at 0.1625. Today, applications for unemployment benefits and the FED interest rate decision will be important for the market. In addition, the market will be closely following the news flows regarding the tension in the Middle East.
TRX, currently trading at 0.1612, is in the middle band of the bearish channel on the 4-hour chart. The Relative Strength Index value has approached the oversold zone with 36 and can be expected to rise slightly from its current level. In such a case, it may move to the upper band of the channel and test the 0.1641 resistance. However, if it cannot close the candle above 0.1641 resistance, it may test 0.1603 support with the sales reaction that may occur. As long as TRX stays above 0.1482 support, the desire to rise may continue. If this support is broken downwards, sales can be expected to increase.
Supports 0.1626 – 0.1603 – 0.1571
Resistances 0.1641 – 0.1666 – 0.1700
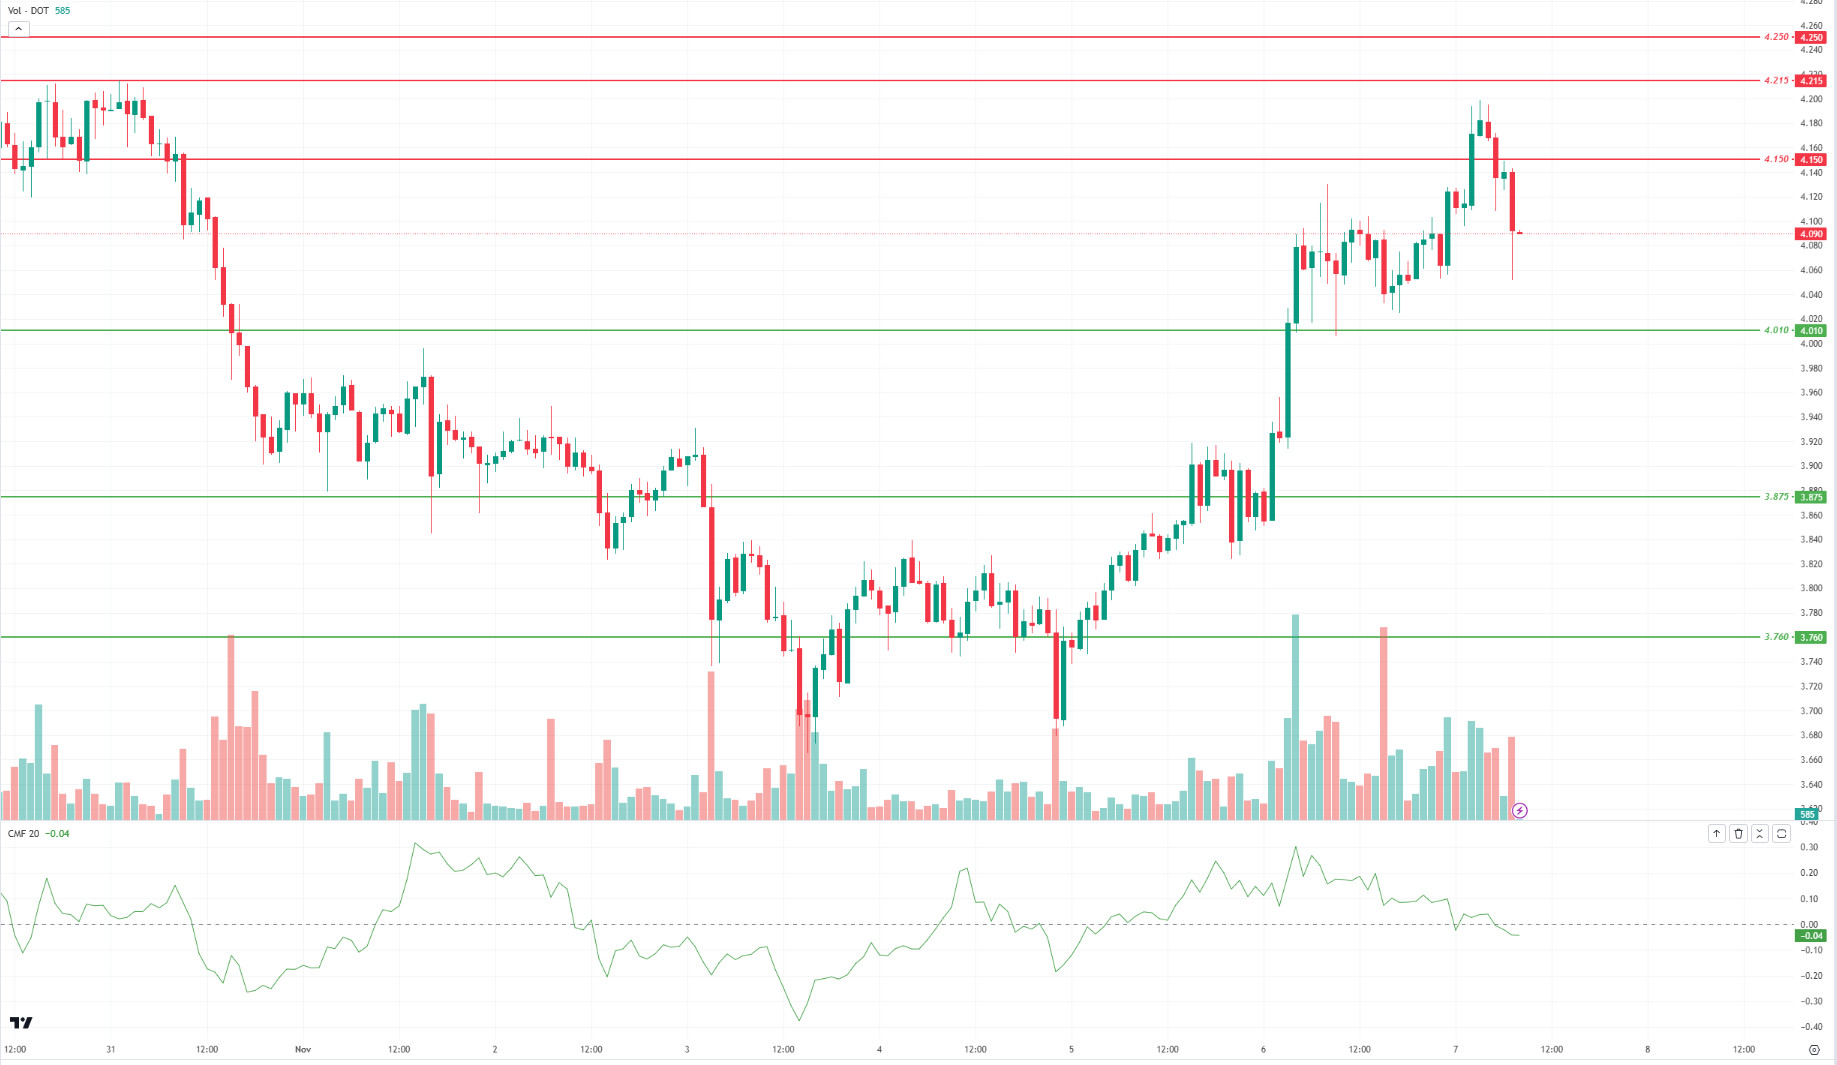
DOT/USDT
When we examine the Polkadot (DOT) chart, we can say that the price broke the 4.150 band upwards but could not provide permanence above it. When we examine the Chaikin Money Flow (CMF) oscillator, we see that it is in the negative zone and the seller pressure is stronger than the buyer pressure. In this context, the price may retreat towards the 4.010 support level. On the other hand, if the buyer pressure increases again, the price may want to break the selling pressure in the 4.150 band.
Supports 4.010 – 3.875 – 3.760
Resistances 4.150 – 4.215 – 4.250
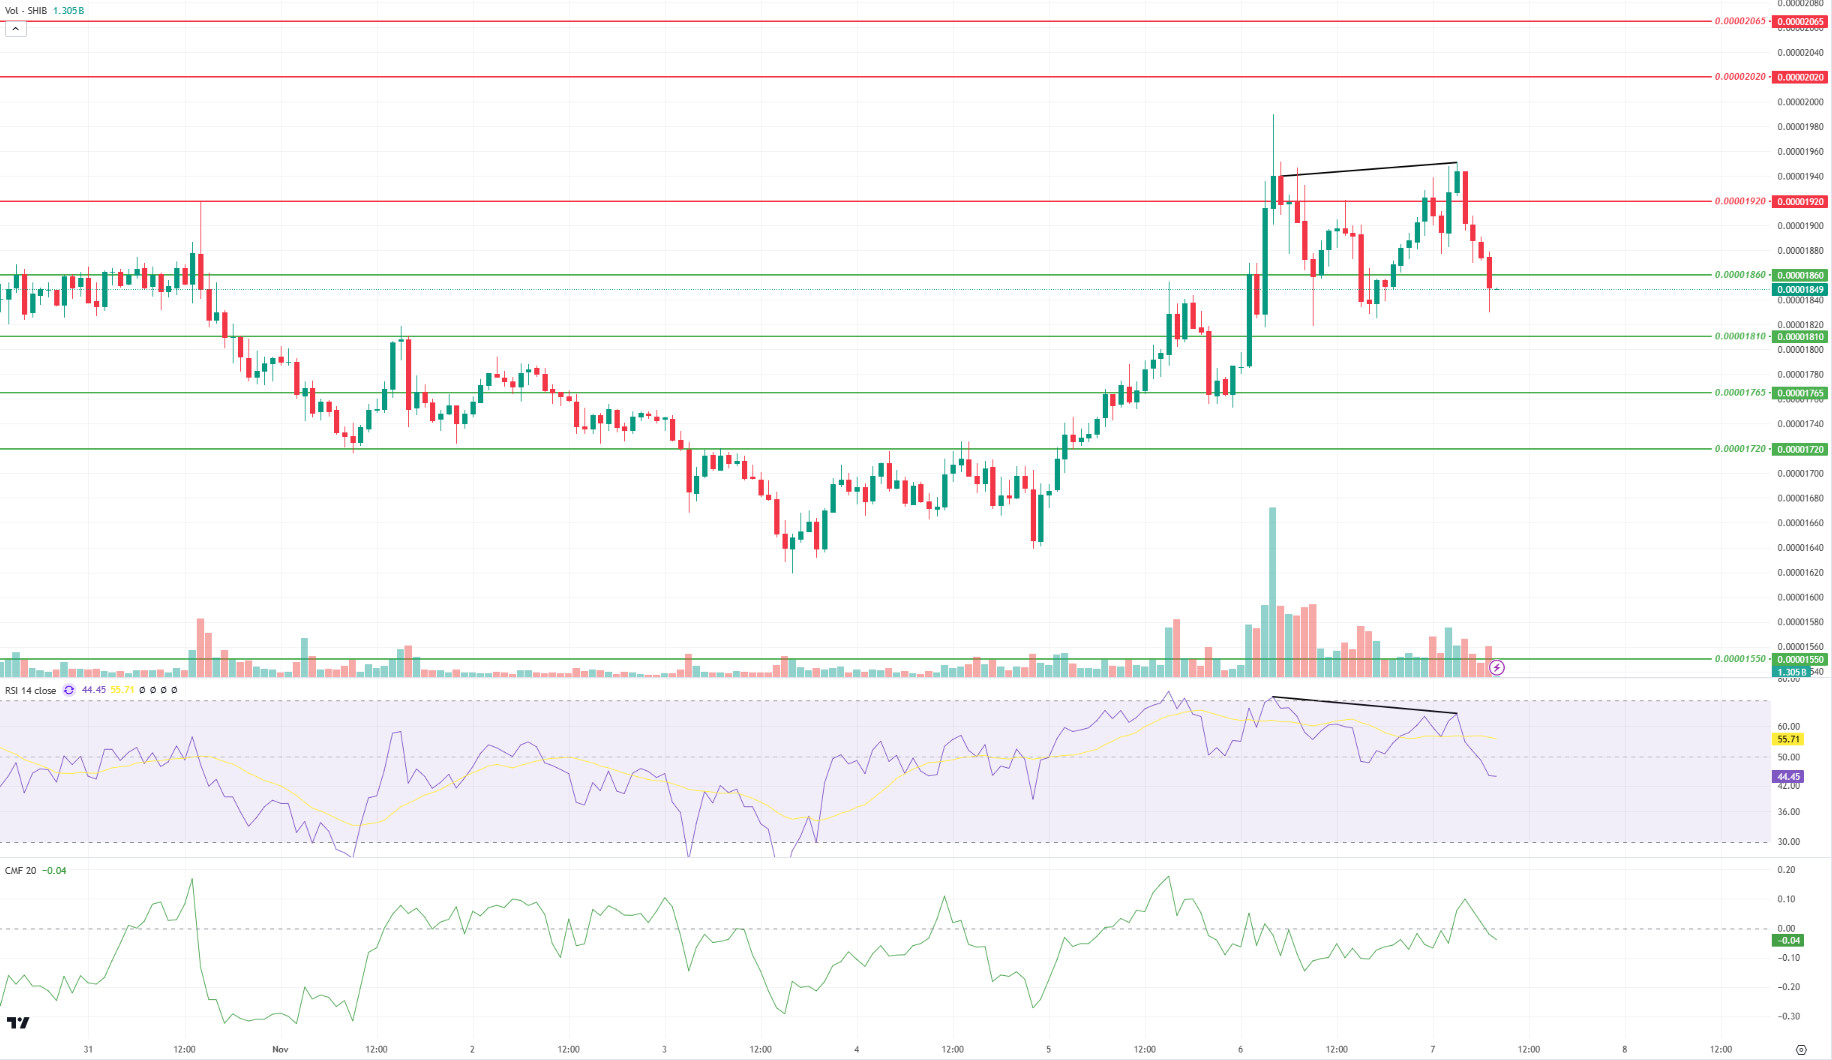
SHIB/USDT
When we examine the chart of Shiba Inu (SHIB), we see that the price failed to break the resistance level of 0.00001920. After the negative divergence between the Relative Strength Index (RSI) and the price, the price was rejected at 0.00001920. Chaikin Money Flow (CMF) oscillator is in the negative zone. In this context, the price may continue its movement towards the 0.00001810 support band. On the other hand, if the buyer pressure increases, the price may want to break the selling pressure at the 0.00001920 resistance level.
Supports 0.00001860 – 0.00001810 – 0.00001765
Resistances 0.00001920 – 0.00002020 – 0.00002065
LEGAL NOTICE
The investment information, comments and recommendations contained herein do not constitute investment advice. Investment advisory services are provided individually by authorized institutions taking into account the risk and return preferences of individuals. The comments and recommendations contained herein are of a general nature. These recommendations may not be suitable for your financial situation and risk and return preferences. Therefore, making an investment decision based solely on the information contained herein may not produce results in line with your expectations.
