MARKET SUMMARY
Latest Situation in Crypto Assets
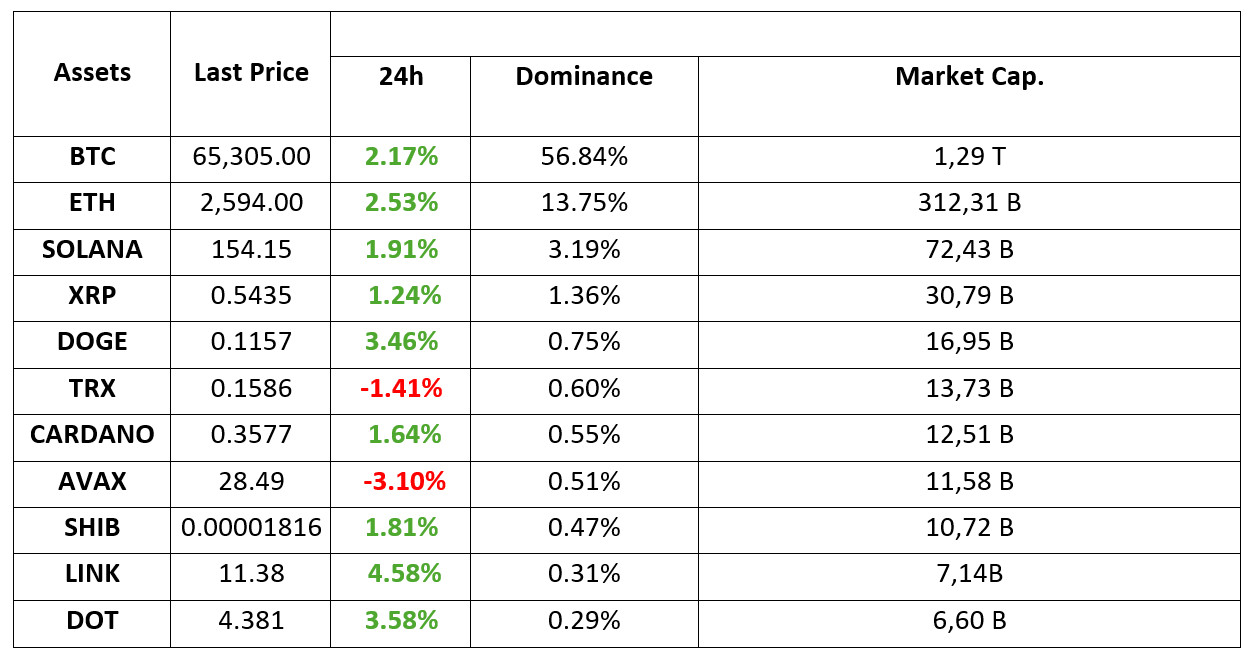
*Prepared on 10.15.2024 at 06:00 (UTC)
WHAT’S LEFT BEHIND
China’s fiscal stimulus package could be $850 billion
In China, which first gave hope to the markets with the financial support package announced in September, a special and very long-term bond is planned to be issued to strengthen the economy. It was stated that 6 trillion yuan (approximately 850 billion dollars) of revenue is aimed to be obtained from the bonds to be issued for 3 years.
Bitcoin Spot ETF
Bitcoin spot ETFs saw net inflows of $556 million. Grayscale GBTC recorded a net inflow of $37.77 million, while Mini Trust BTC recorded a net inflow of $4.68 million. The largest net inflow of the day came from Fidelity FBTC with $ 239 million. Bitwise BITB attracted attention with an inflow of $ 100 million.
HIGHLIGHTS OF THE DAY
Important Economic Calender Data
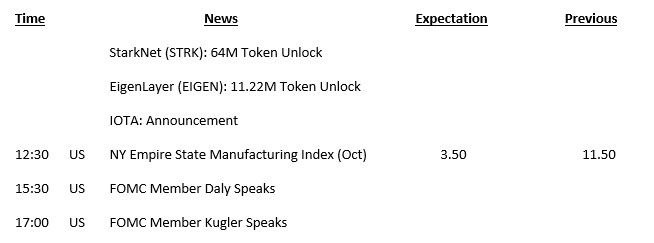
INFORMATION:
*The calendar is based on UTC (Coordinated Universal Time) time zone. The economic calendar content on the relevant page is obtained from reliable news and data providers. The news in the economic calendar content, the date and time of the announcement of the news, possible changes in the previous, expectations and announced figures are made by the data provider institutions. Darkex cannot be held responsible for possible changes that may arise from similar situations.
MARKET COMPASS
Following the US indices that started the week with a rise yesterday, there is a contrasting picture in Asian stock markets this morning. Expectations that China’s recently announced incentives may not be enough to revive the economy put pressure on the country’s stock market, while it is rumored that Israel has agreed to target only Iran’s military points for retaliation. Digital assets eased slightly during Asian trading after rallying on easing expectations that crypto assets could be used as a funding tool to buy stocks on Chinese exchanges.
Candidates’ speeches are closely monitored ahead of the upcoming presidential elections in the US. Finally, Kamala Harris’s evaluations for crypto assets were closely watched. Although Harris did not mention the details, she gave the message that she would be in a regulatory framework rather than a prohibitive approach to digital assets. Apart from this, the assessments made by Fink, CEO of BlackRock, one of Wall Street’s largest investment firms, were also noteworthy. Fink described Bitcoin as a legitimate investment vehicle and a separate asset class in its own right.
We maintain our view that the upward trend in digital assets will be maintained in the long term, with the potential for an escalation in Middle East tensions that will not rise at least until the US presidential elections and increased risk appetite. However, we would not be surprised to see some correction with the limitation of the rise during Asian transactions after the recent gains. Today, the statements of the US Federal Reserve (FED) officials will be closely monitored. Finally, Waller and Kashkari made statements indicating that the urgency of emergency rate cuts had diminished. It may be important whether this tone will be maintained by other members.
TECHNICAL ANALYSIS
BTC/USDT
The expected “uptober” trend in Bitcoin started to show its effect in the middle of the month. Bitcoin, which has shown a strong stance with the effect of optimistic weather, is expected to test new peaks if D. Trump is elected president in the US elections. Serious inflows to Bitcoin spot ETFs with the interest of institutions stand out as one of the factors behind the strong stance in Bitcoin. While there are positive developments on behalf of Bitcoin in the long term, a potential correction movement may await us before a significant rise occurs in the short term.
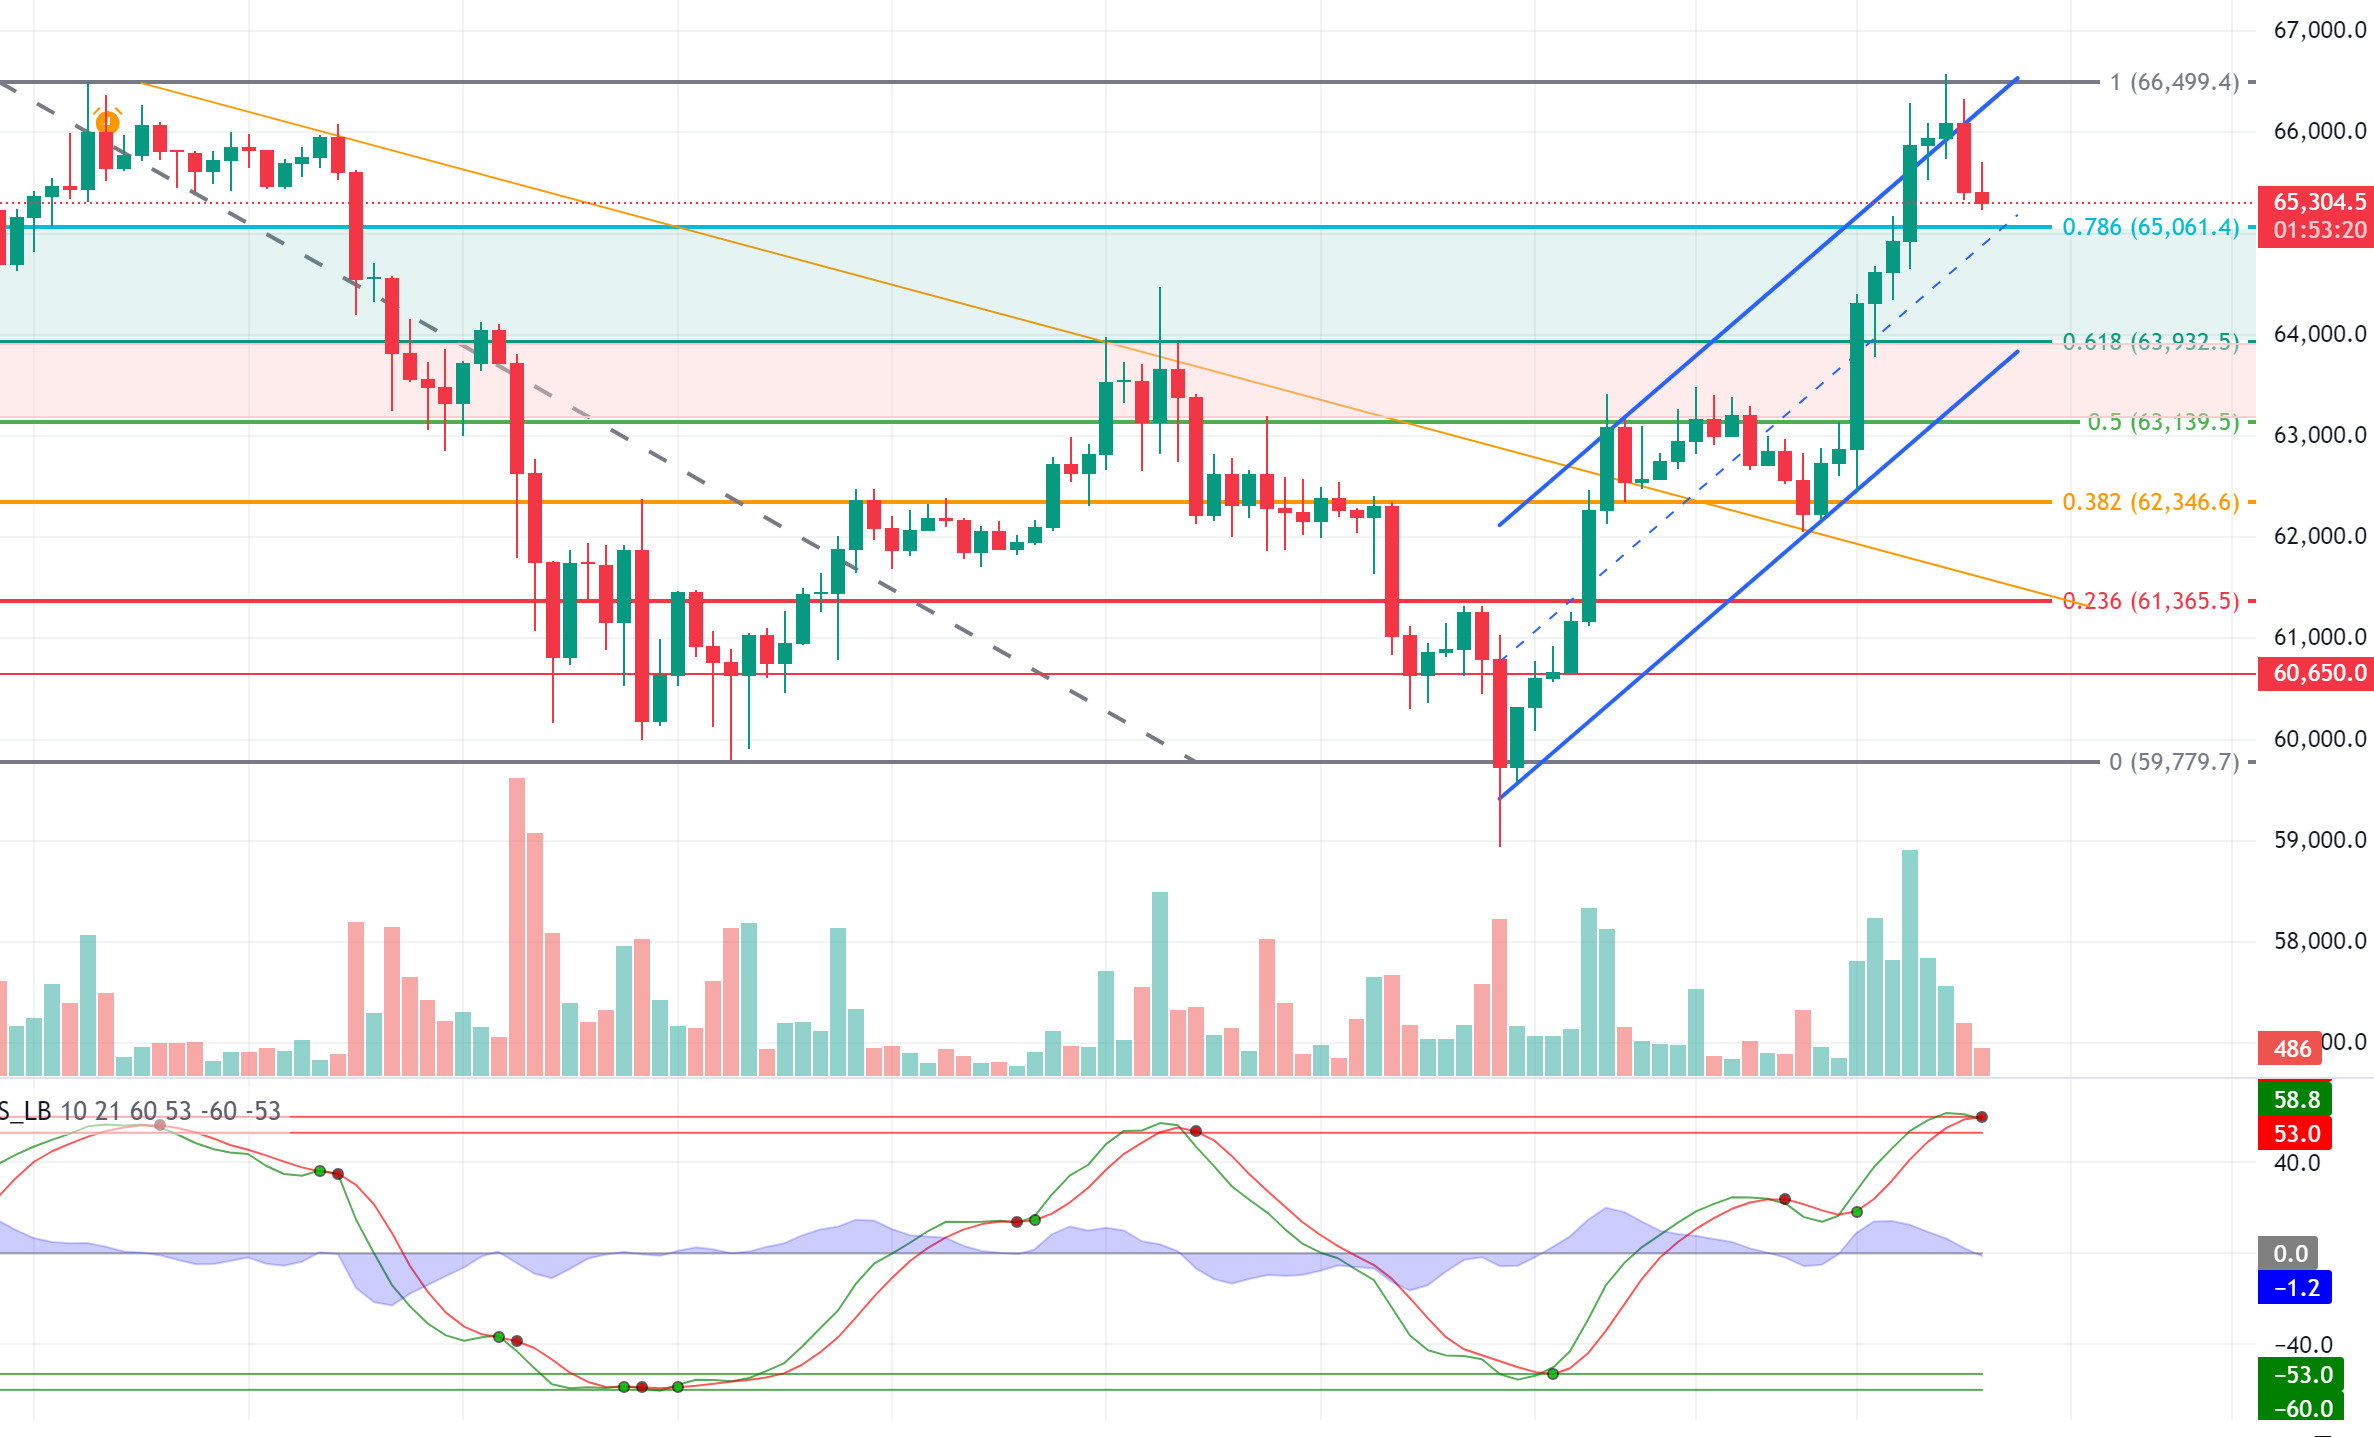
If we look at the BTC 4-hour technical analysis, although it crossed the upper band of the channel within the uptrend, the price, which encountered resistance in that region, has turned its direction down. Touching the Fibonacci 1 (66,500) resistance level, the price does not gain enough momentum for the breakout and needs a correction. As a matter of fact, the wave trend oscillator, which is our technical indicator, generates a sell signal on the hourly and 4-hour chart, confirming the potential correction. The first support level that will meet us with a correction is 0.786 (65,061), and in case of a break, the lower line of the rising trend is 0.618 (63,932). In the continuation of the rise with the effect of optimistic weather, the resistance level we will follow will be 66,500.
Supports 65,061 – 63,932 – 63,139
Resistances 66,500 – 67,130 – 68,200
ETH/USDT
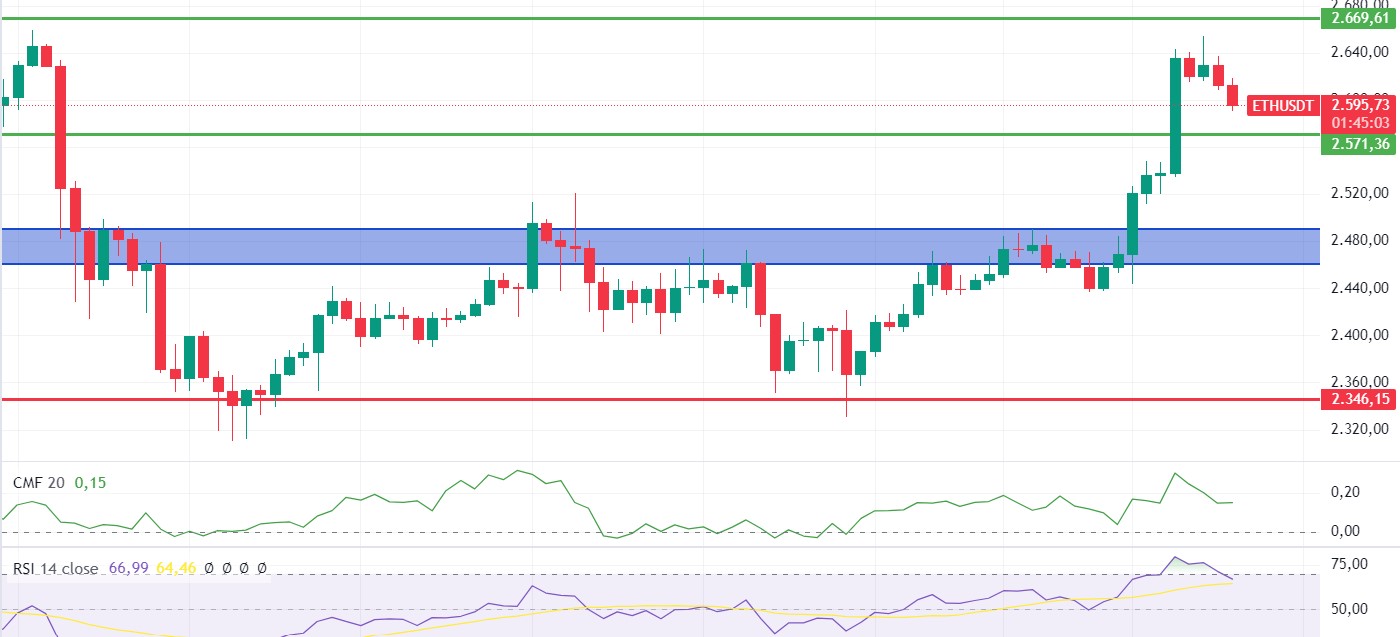
After the 2,640 level we targeted for Ethereum came with the rise yesterday, some retracement seems to continue. First of all, looking at the RSI, it has fallen back from the overbought zone to below 70. CMF, on the other hand, gave a negative mismatch at the peak of its price and turned down as ETH started its correction. Looking at open interest, we see that investors are slowly starting to reduce their positions. In CVD spot and futures, it is seen that both the rise and fall are common from both channels. In the light of all these data, we can say that the decline may continue up to 2,571 levels during the day, and if this level is broken, it may deepen to 2,490 – 2,460 levels, the area indicated by the blue box. The 2,669 level is the most important resistance point and the rise may continue with its break.
Supports 2,571 – 2,490 – 2,460
Resistances 2,669 – 2,731 – 2,815
LINK/USDT
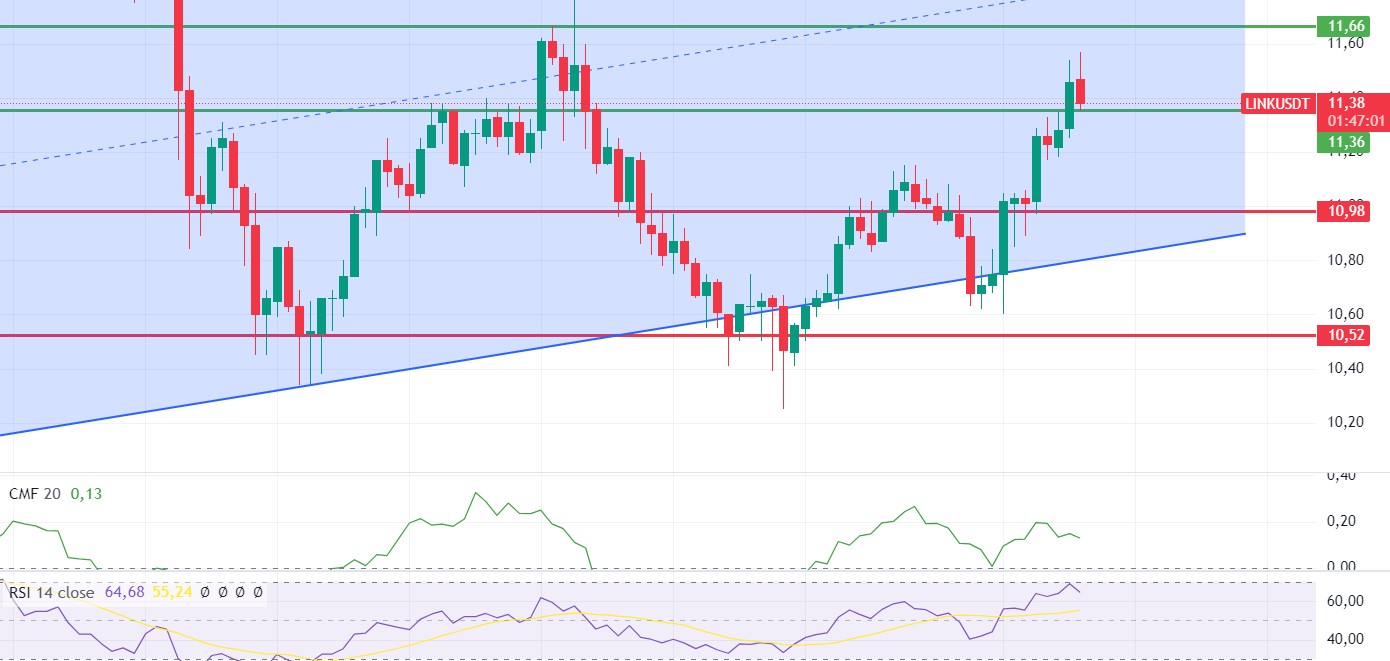
After LINK managed to break through the kumo cloud resistance, it came up to 11.57 levels, pricing sharply positive. For LINK, which started its correction instantly, we see that a clear negative mismatch formed in CMF is working. With this mismatch, LINK, which advances to 11.36 support, may make sharp descents to 10.98 levels if this level is broken. The structure in RSI also seems to support this idea. In addition to all these, the 11.66 level stands out as the most important resistance point. Hard candles with volume can be seen for LINK, which will take a much more positive outlook with the break of this level.
Supports 11.36 – 10.98 – 10.52
Resistances 11.66 – 12.26 – 12.71
SOL/USDT
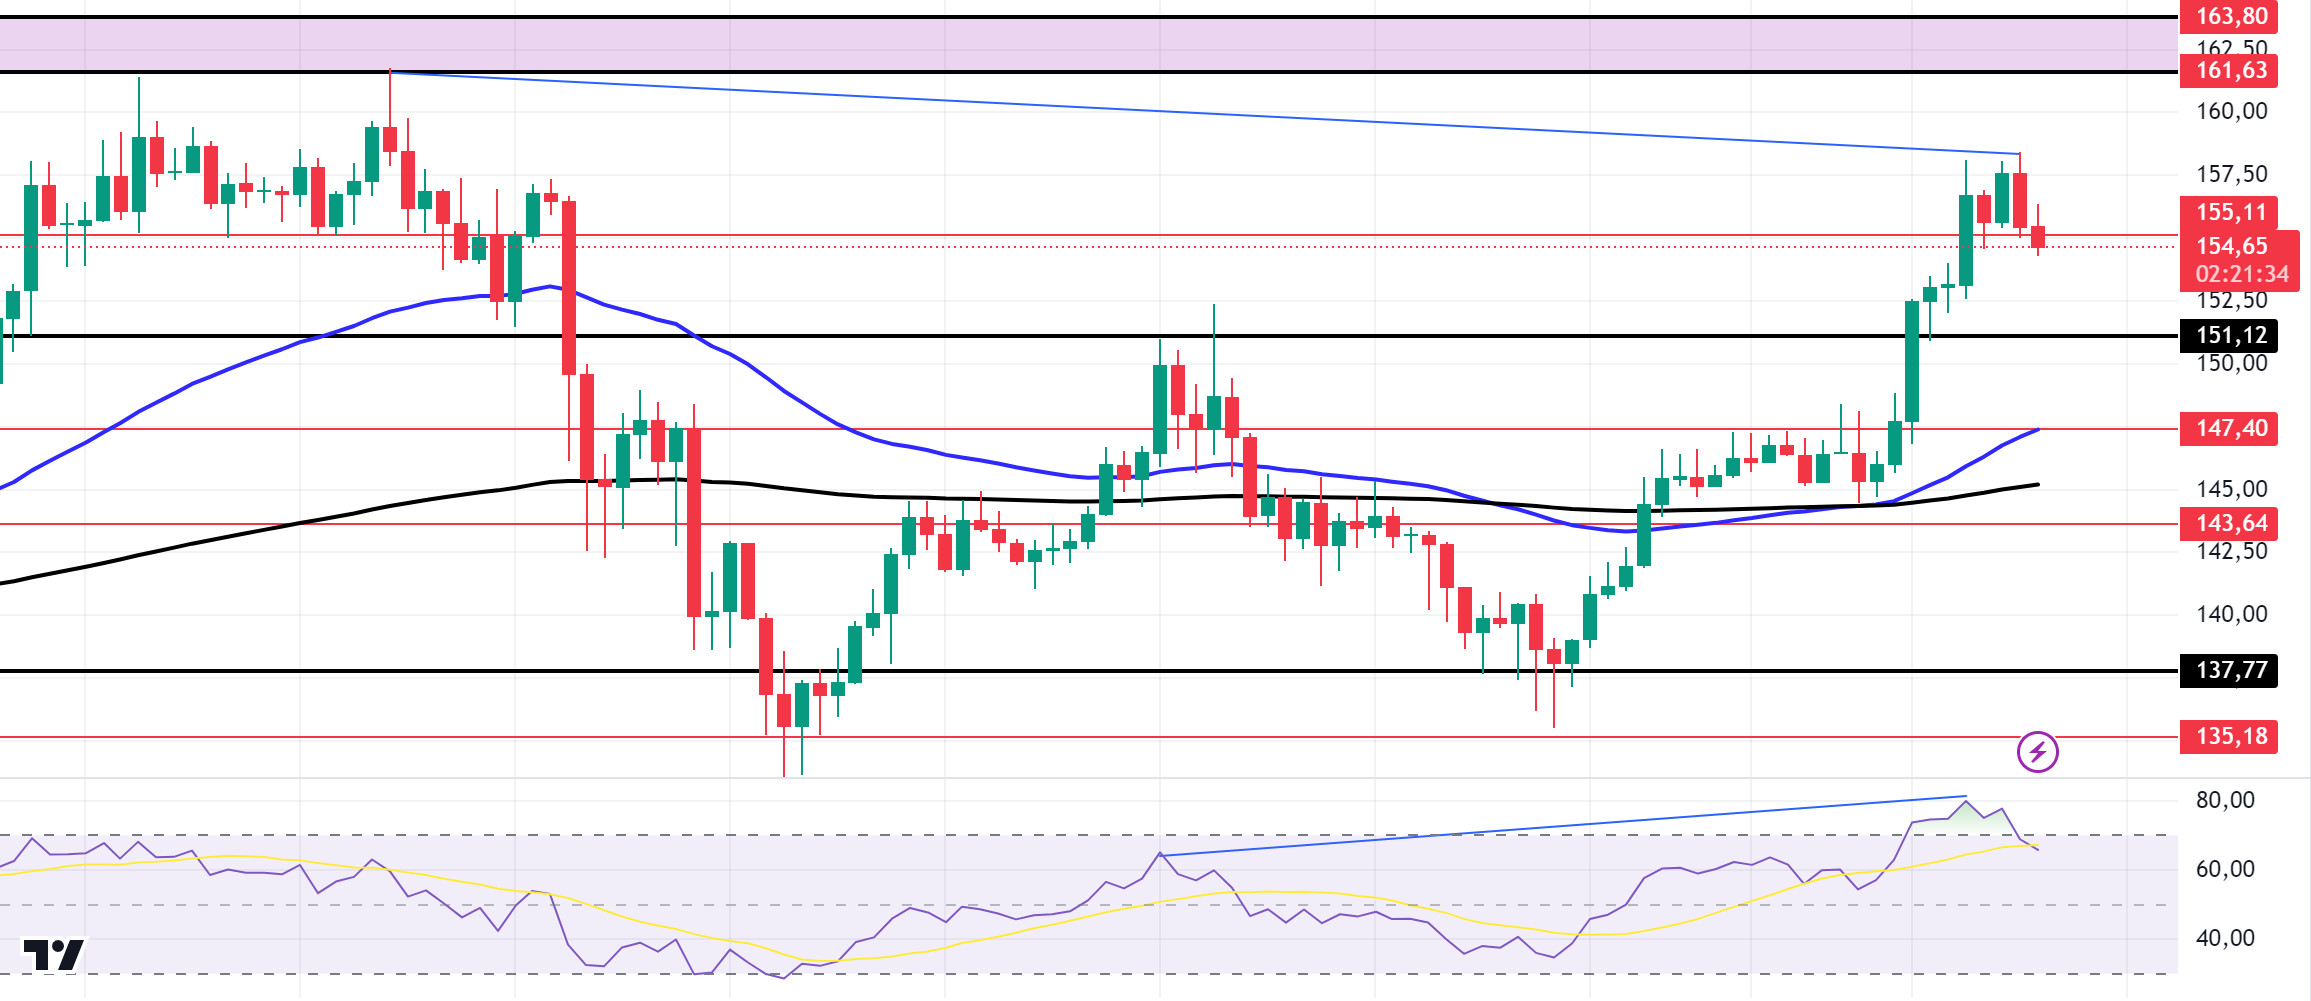
Solana’s trading volume rose to $2.7 billion in the last 24 hours. With this change in market dynamics, an upward movement can be expected from the region where it has been consolidating for a long time. At the same time, Solana’s TVL exceeded $6 billion for the first time since January 2022. However, the number of weekly active addresses on Solana reached an all-time high of 30.5 million. Technically, SOL was up 2.37%. On the 4-hour timeframe, the 50 EMA continues to be above the 200 EMA. This could mean that the uptrend will continue. It decisively broke the 151.12 level, an important resistance place. This means that it could test the 163.80 level, the ceiling level of the band where it has been consolidating for a long time. When we look at our RSI (14) indicator, there is a mismatch. This could lead to profit taking and, technically, to a sell-off as traders consider a possible pullback. The 161.63 level is a very strong resistance point in the uptrend driven by both macroeconomic conditions and innovations in the Solana ecosystem. If it rises above this level, the rise may continue strongly. In the sales that investors will make due to profit sales, the support level of 151.12 – 147.40, which is the place of retreat, should be followed. If the price comes to these support levels, a potential bullish opportunity may arise.
Supports 151.12 – 147.40 – 143.64
Resistances 155.11 – 161.63 – 163.80
ADA/USDT
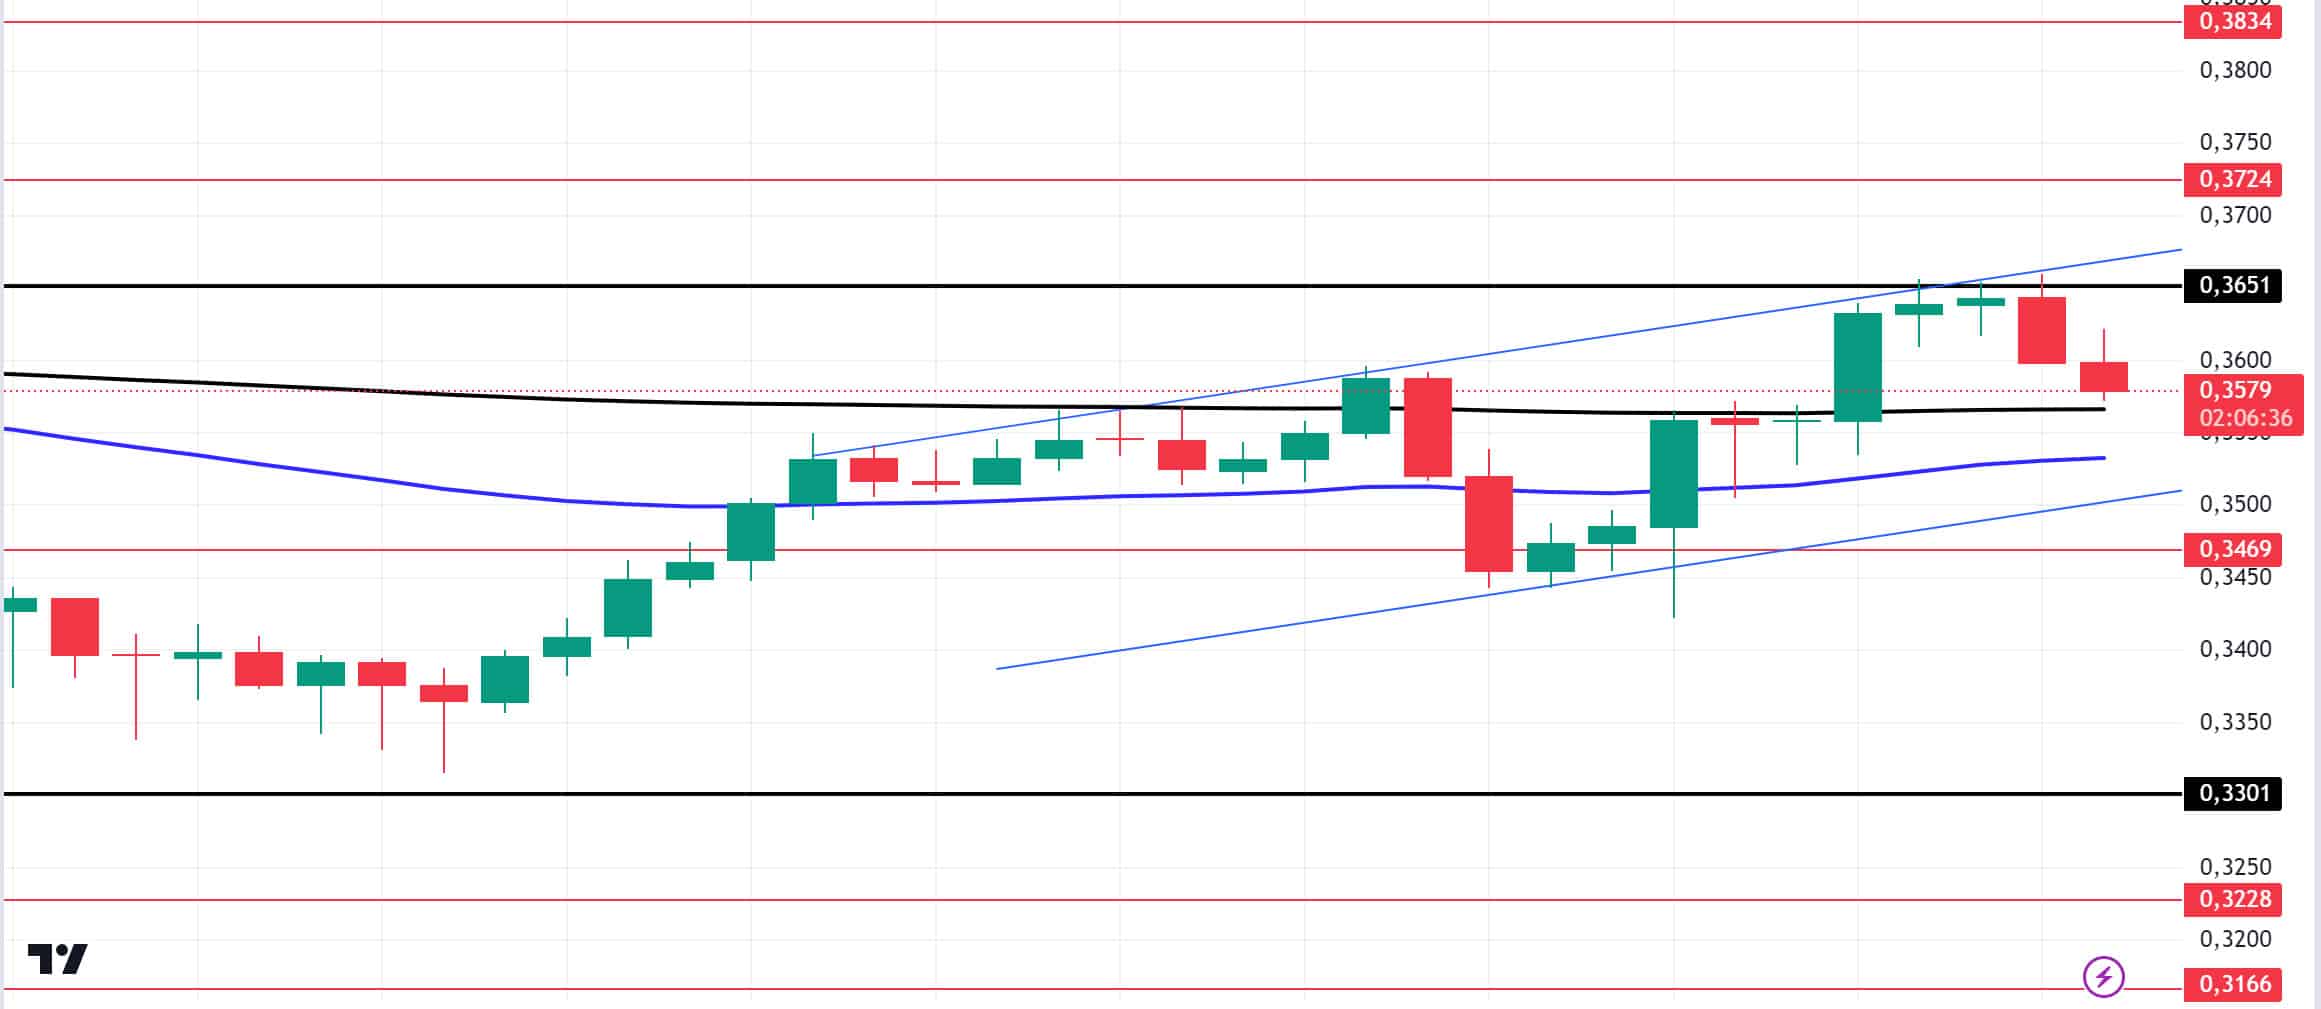
Cardano faces a major token unlock event this week. Approximately 18.5 million ADA is priced at critical levels, while increased circulation could recover with ecosystem updates. This corresponds to a value of approximately $6.6 million at the time of writing. ADA tested the critical resistance level of 0.3651 and retreated slightly from that level. On the 4-hour chart, the downtrend that started on September 27 was broken by whale movements and seems to have received support from the downtrend level. This could be a bullish sign. On the other hand, the 50 EMA continues to hover below the 200 EMA. The 200 EMA has supported the price. More signals may be needed for a rise. If macroeconomic data is positive for cryptocurrencies, it will retest the 0.3651 resistance level. If the money flow decreases and macroeconomic data is negative for cryptocurrencies, 0.3469 is a support level and can be followed as a good buying place.
Supports 0.3469 – 0.3301 – 0.3228
Resistances 0.3651 – 0.3724 – 0.3834
AVAX/USDT
AVAX, which opened yesterday at 29.05, rose during the day, but then fell again and closed the day at 29.07. Today, there is no planned data to be announced especially by the US and expected to affect the market. For this reason, it may be a low-volume day where we may see limited movements. News flows from the Middle East will be important for the market.
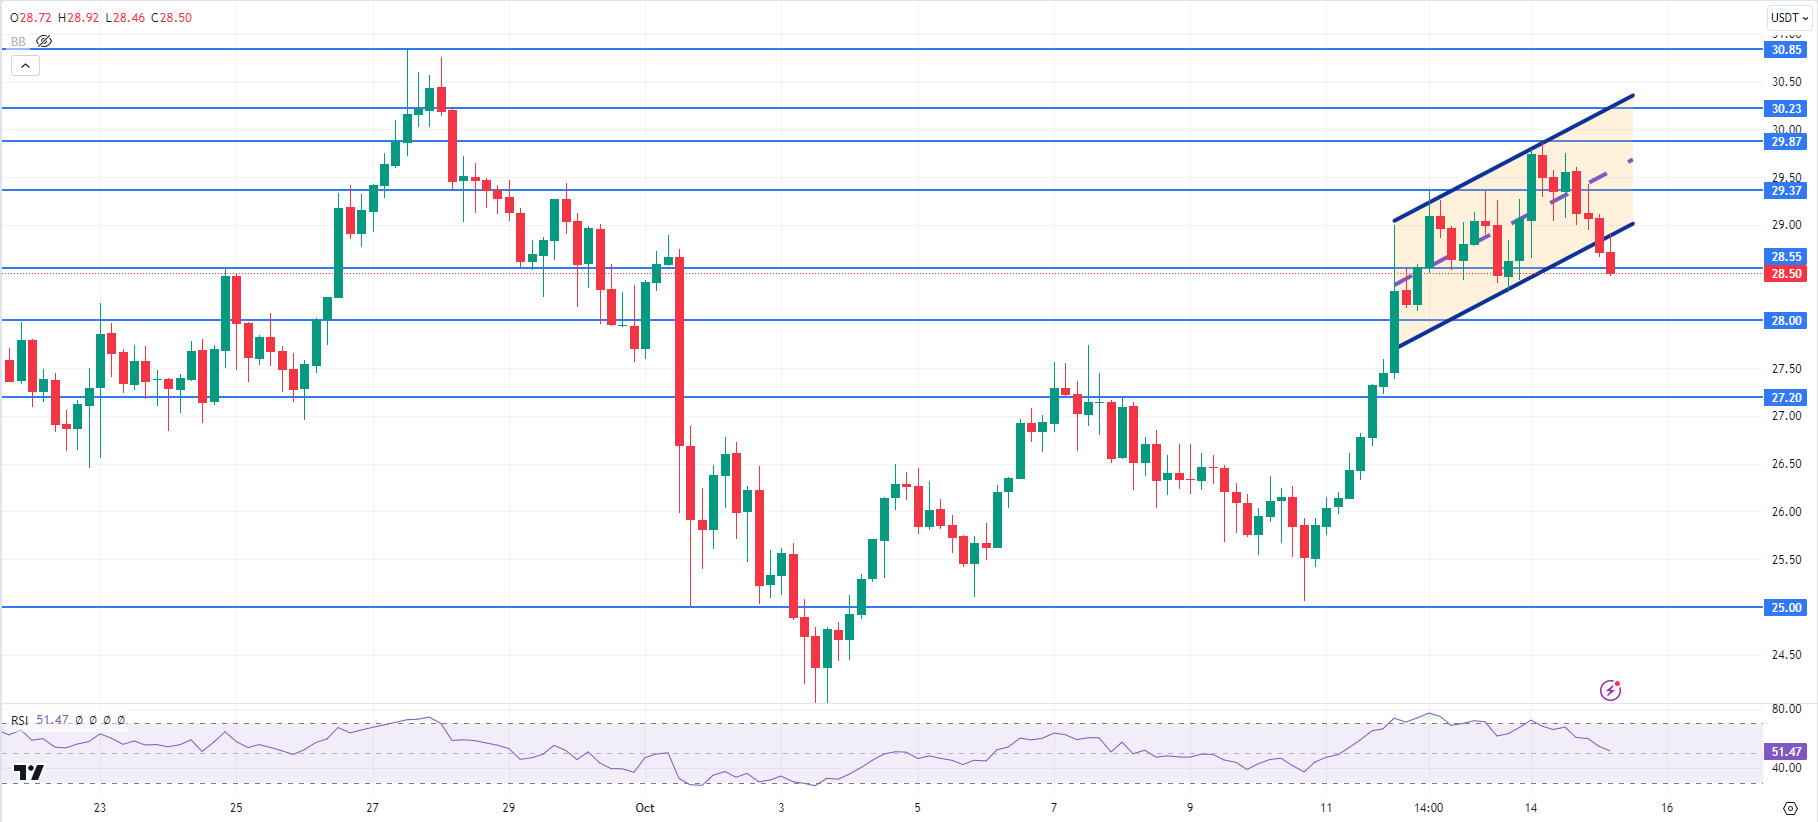
AVAX, currently trading at 28.67, is moving in the lower band of the rising channel on the 4-hour chart. It is trying to break the channel downwards and in order to get confirmation that this break has occurred, it must close the candle below the support of 28.55. With the RSI 51 value, it can be expected to rise from here and move to the middle band. In such a case, it may test 29.37 resistance. Sales may increase in case of negative news about the increasing tension in the Middle East. In such a case, it may test 28.00 support. As long as it stays above 25.00 support during the day, the desire to rise may continue. With the break of 25.00 support, sales may increase.
Supports 28.55 – 28.00 – 27.20
Resistances 29.37 – 29.87 – 30.23
TRX/USDT
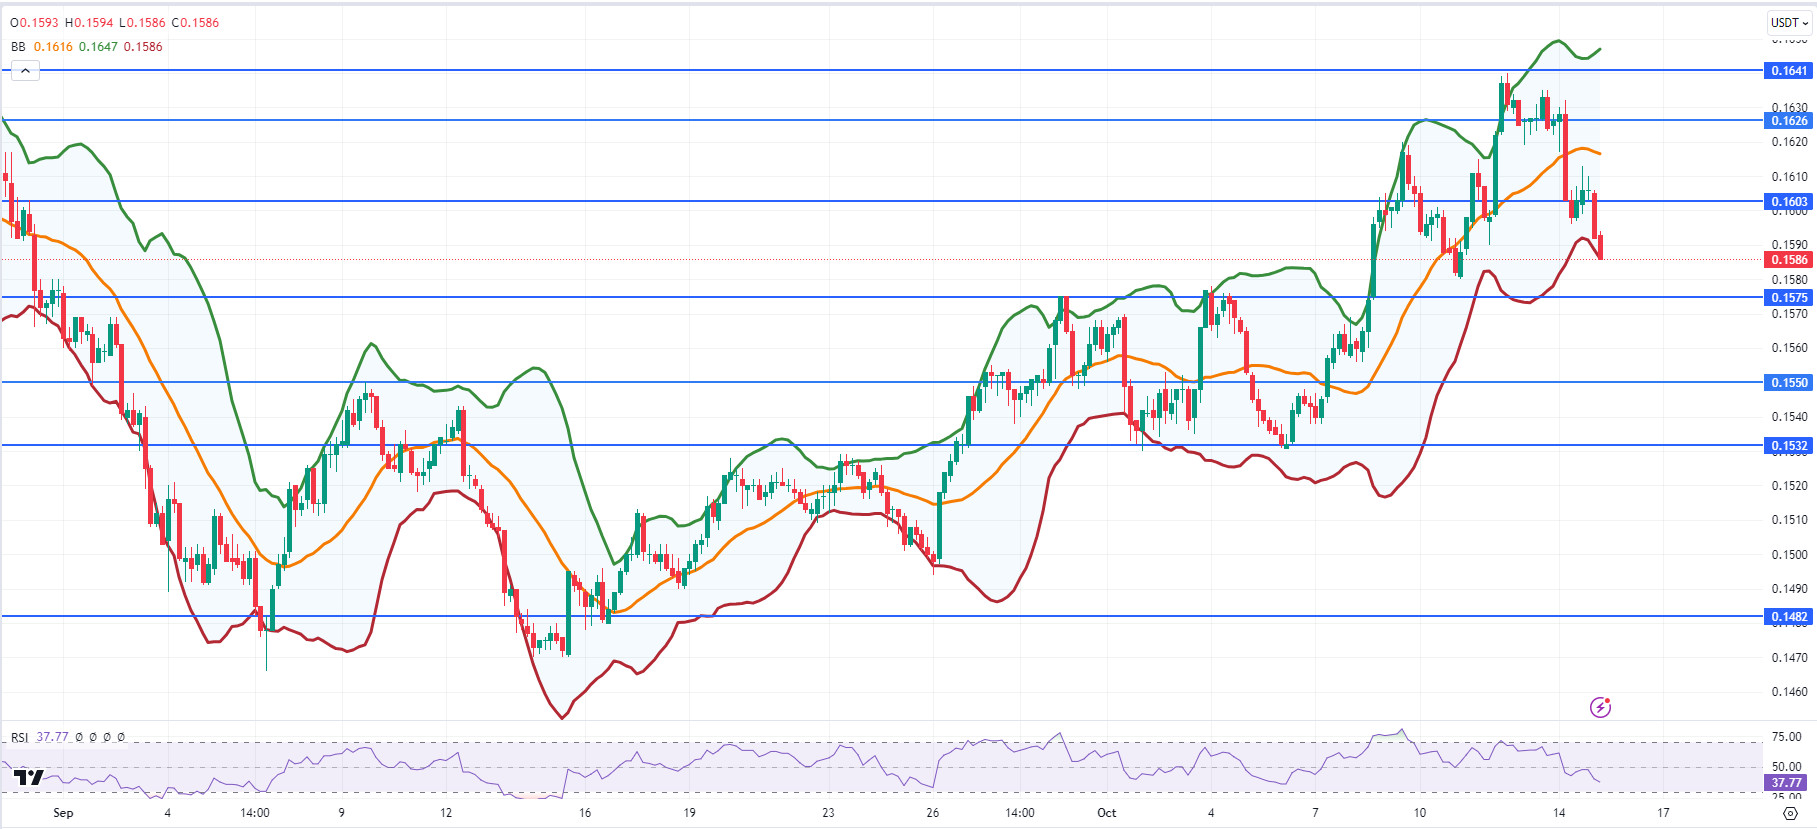
TRX, which started yesterday at 0.1626, fell about 1% during the day and closed the day at 0.1606. There is no scheduled data for the market today. The market will be closely following the news flows regarding the tension in the Middle East.
TRX, currently trading at 0.1586, is in the Bollinger lower band on the 4-hour chart. The RSI has approached the oversold zone with a value of 37 and can be expected to rise slightly from its current level. In such a case, it may move to the Bollinger middle band and test the 0.1603 resistance. However, if it cannot close the candle above 0.1603 resistance, it may test 0.1575 support with the selling pressure that may occur. As long as TRX stays above 0.1482 support, the desire to rise may continue. If this support is broken downwards, sales can be expected to increase.
Supports 0.1575 – 0.1550 – 0.1532
Resistances 0.1603 – 0.1626 – 0.1641
XRP/USDT
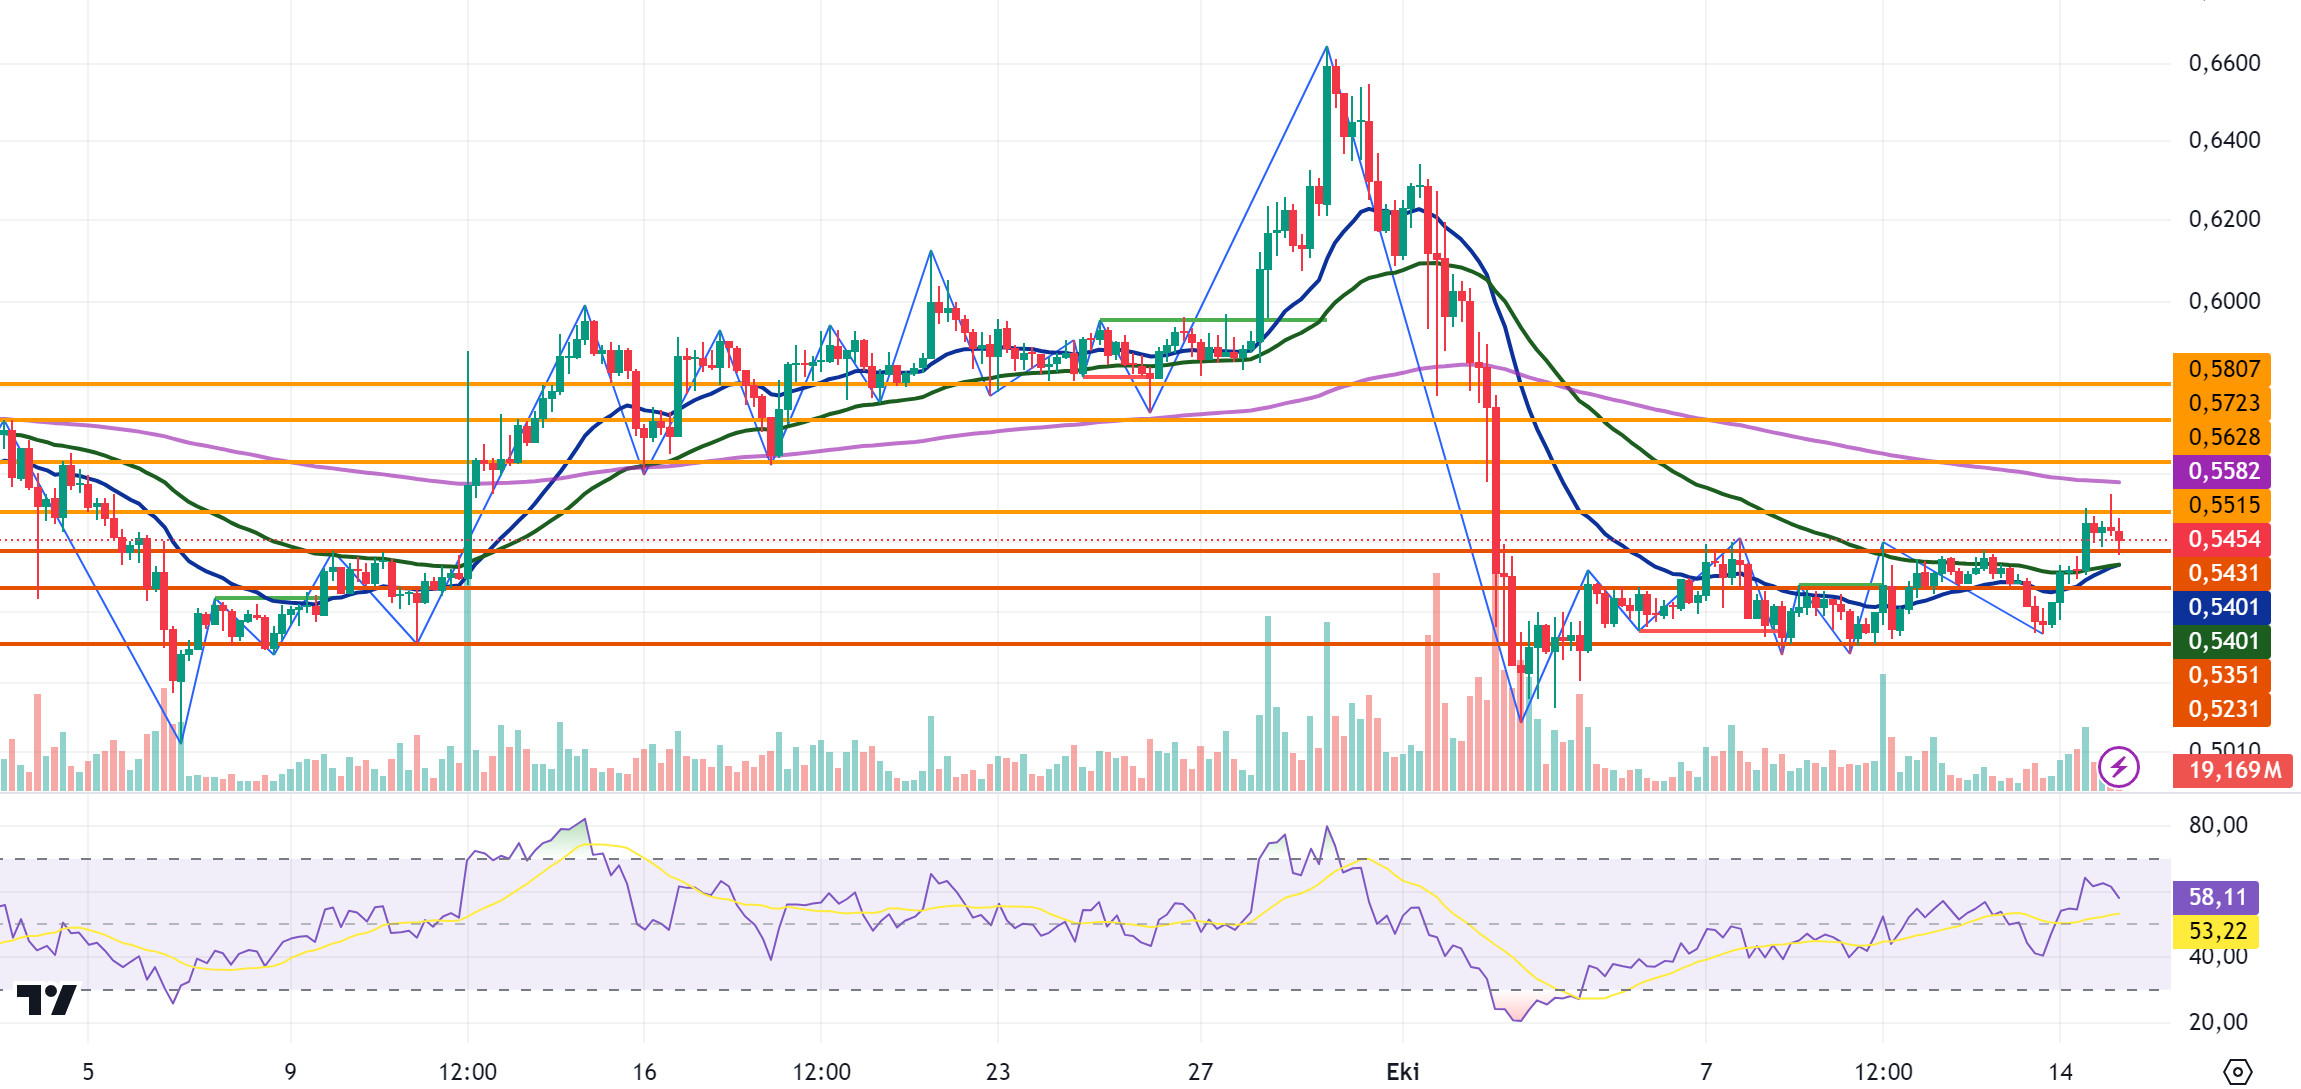
The daily closing of XRP, which saw a 3.1% increase in value with the rise it experienced yesterday, was realized at 0.5484. In the 4-hour analysis, XRP, which was traded above the EMA20 and EMA50 levels with the rise it experienced yesterday morning, continued its rise and the rise was replaced by a decline with sales in the EMA200 region. In the 4-hour analysis, XRP, which started today with a decline, may test the support levels of 0.5431-0.5351-0.5231 if the decline continues. If the decline is replaced by a rise again, it can test the resistance levels of 0.5515-0.5628-0.5723 with its rise.
XRP may decline on its rise with possible sales at the EMA200 level and may offer a short trading opportunity. In its decline, it may rise with possible purchases at EMA20 and EMA50 levels and may offer a long trading opportunity.
EMA20 (Blue Line) – EMA50 (Green Line) – EMA200 (Purple Line)
Supports 0.5431 – 0.5351 – 0.5231
Resistances 0.5515 – 0.5628 – 0.5723
DOGE/USDT
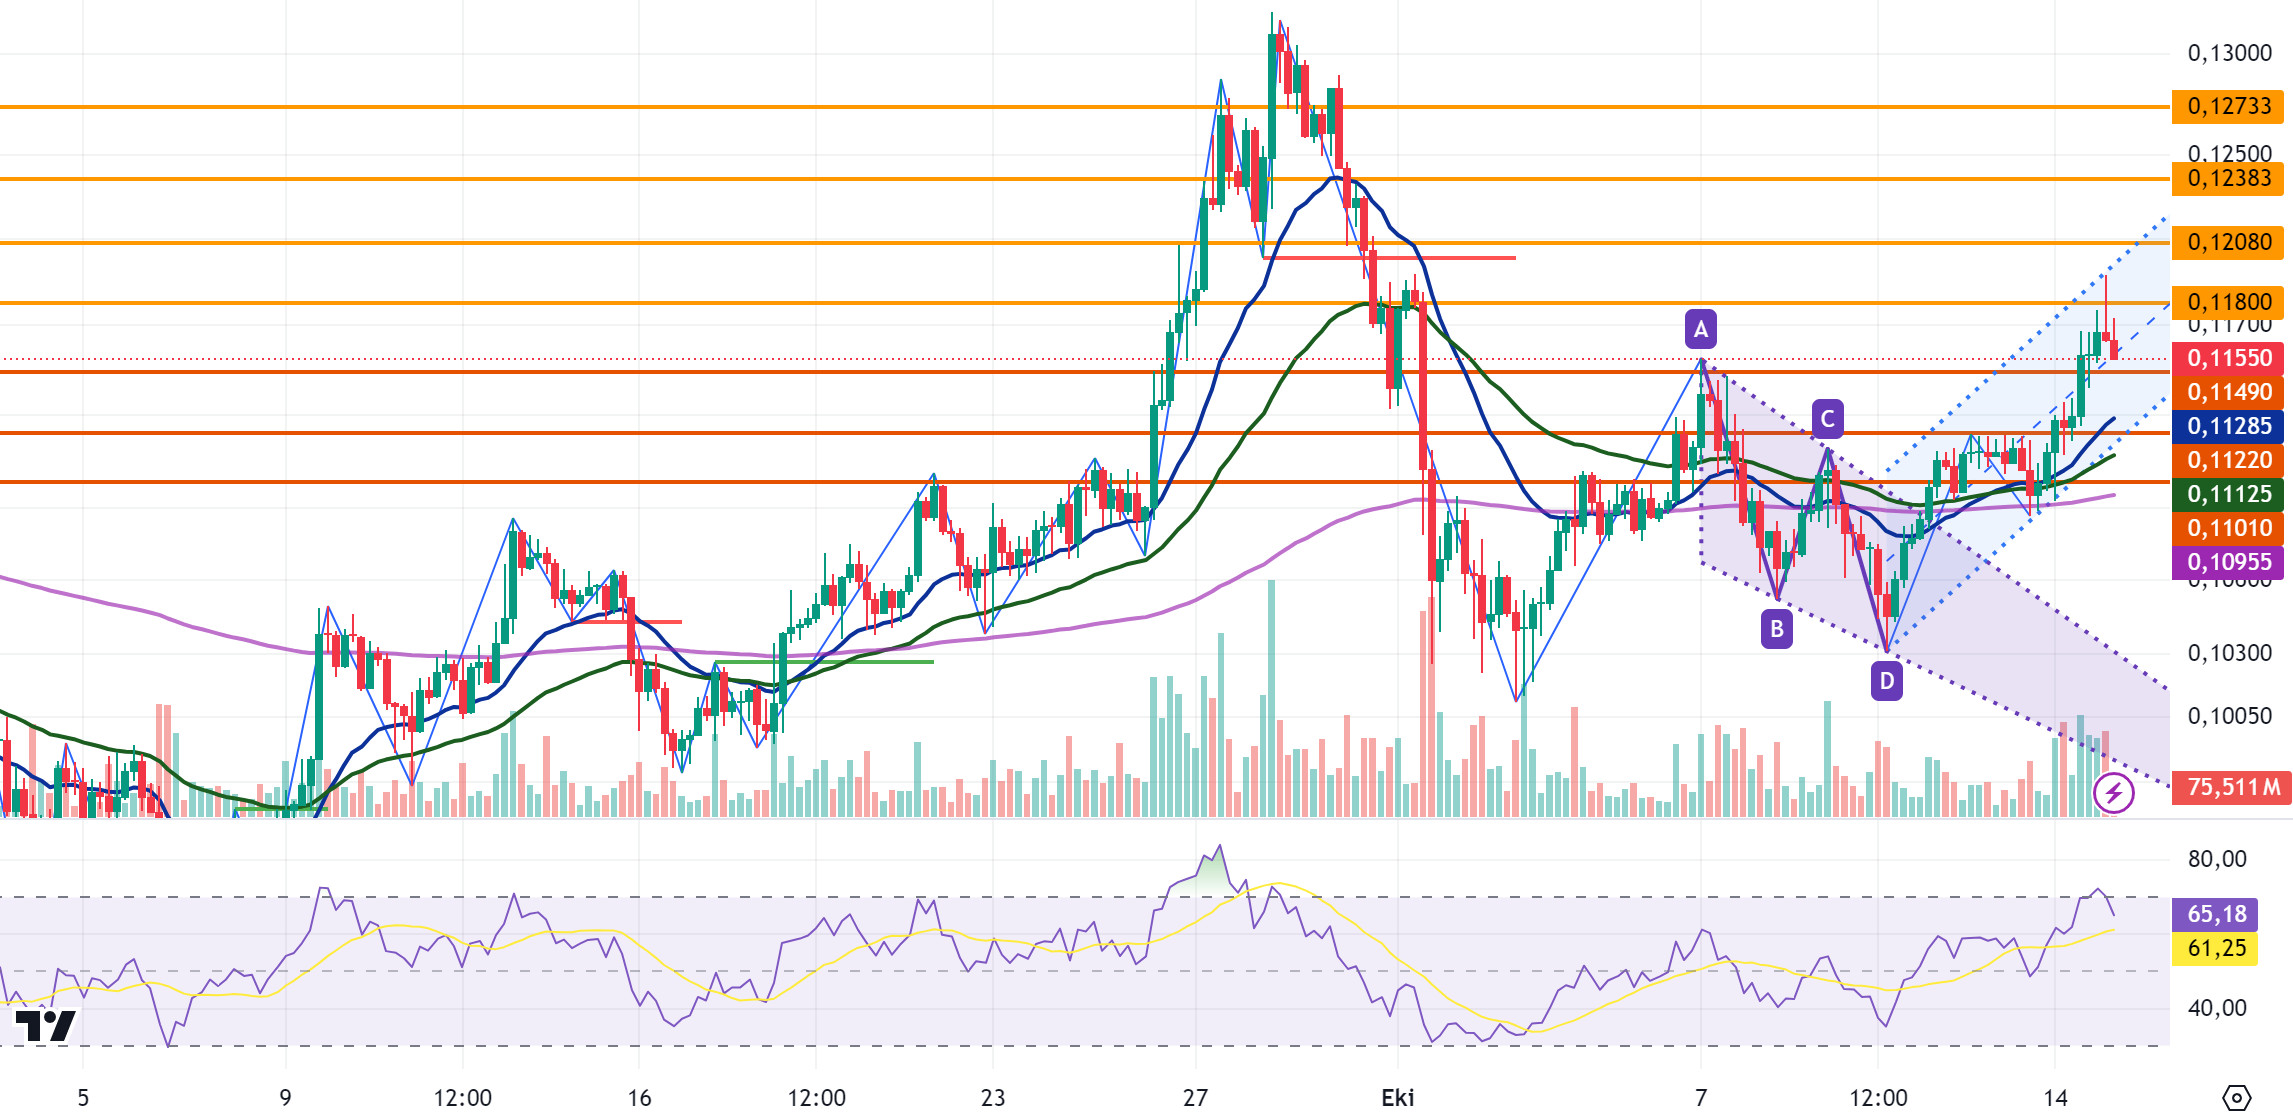
DOGE closed yesterday at 0.1166 with a 4.75% increase in value. In the 4-hour analysis, DOGE, which started today with a decline, continued its decline in the last candle and is currently trading at 0.1155. DOGE, which continues its upward movement in the rising channel after breaking the triangle pattern upwards, may realize the flag formation in its rise in the 4-hour analysis in this process and test the resistance levels of 0.1180-0.1208-0.1238 in its rise. If the decline deepens after the continuation of the decline experienced today, it may test the support levels of 0.1149-0.1122-0.1101.
DOGE may decline on its rise with possible sales at 0.13 and may offer a short trading opportunity. In its decline, it may rise with possible purchases at 0.1122 and may offer a long trading opportunity.
EMA20 (Blue Line) – EMA50 (Green Line) – EMA200 (Purple Line)
Supports 0.1149 – 0.1122 – 0.1101
Resistances 0.1180 – 0.1208 – 0.1238
DOT/USDT
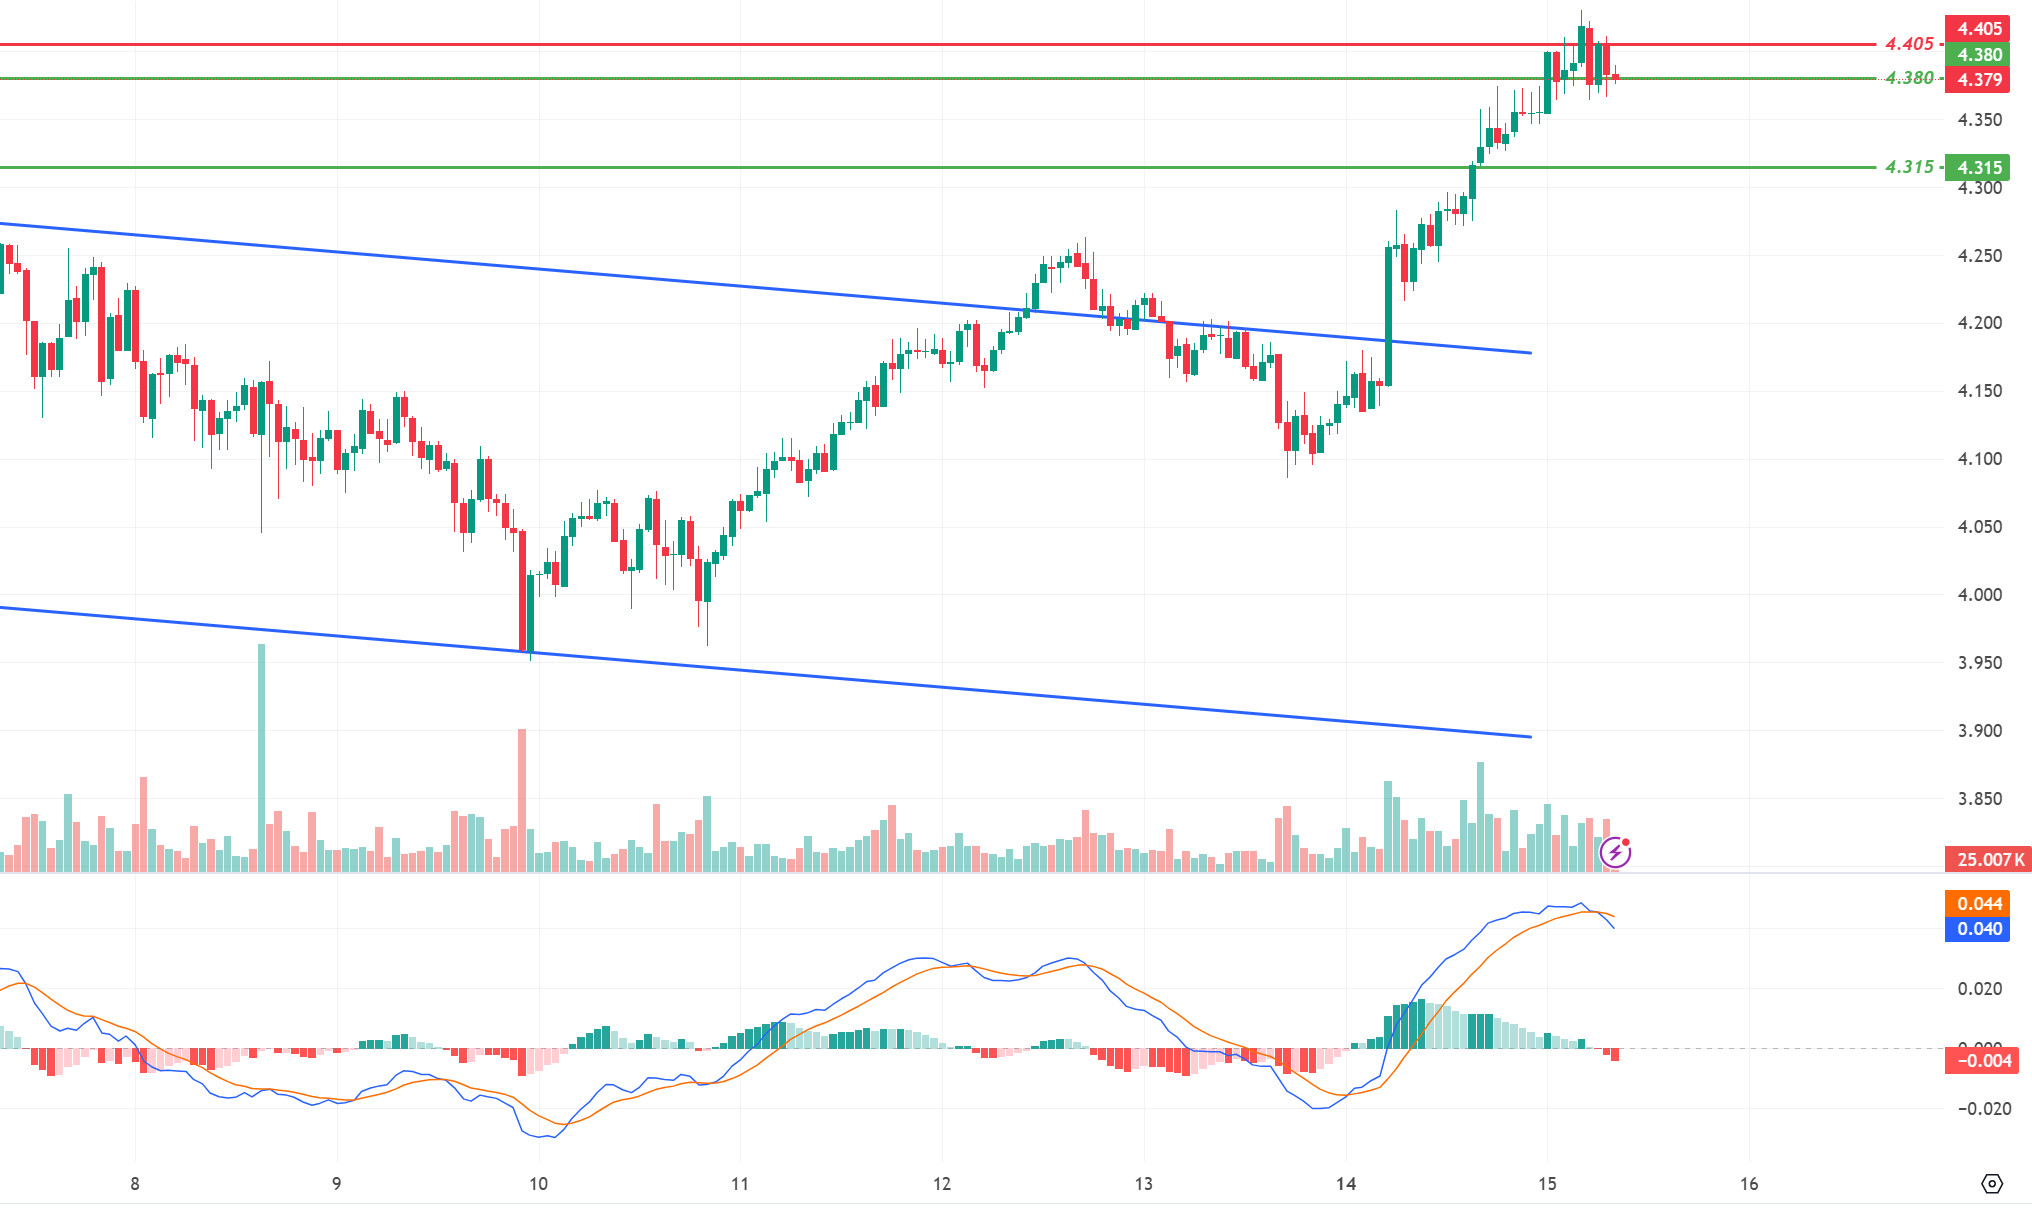
Polkadot (DOT) was rejected at 4,405 resistance level. Polkadot, which moved upward sharply with the upside break of the downtrend, rose to 4,405 levels. According to the MACD oscillator, we can say that the selling pressure is increasing compared to the previous hour. If the 4.405 level cannot break the selling pressure, the price may retreat towards 4.380 levels. On the other hand, if the buying pressure rises again, the price may move towards the 4,450-resistance level.
Supports 4,380 – 4,315 – 4,250
Resistances 4.405 – 4.450 – 4.510
SHIB/USDT
The Shiba Inu (SHIB) team announced a new partnership with Mass Build. The partnership coincides with a significant surge in SHIB’s price, boosting investor confidence. While Mass Build aims to provide AI-powered financial solutions to the SHIB ecosystem, the partnership aims to increase Shiba Inu’s integration with real-world financial services.
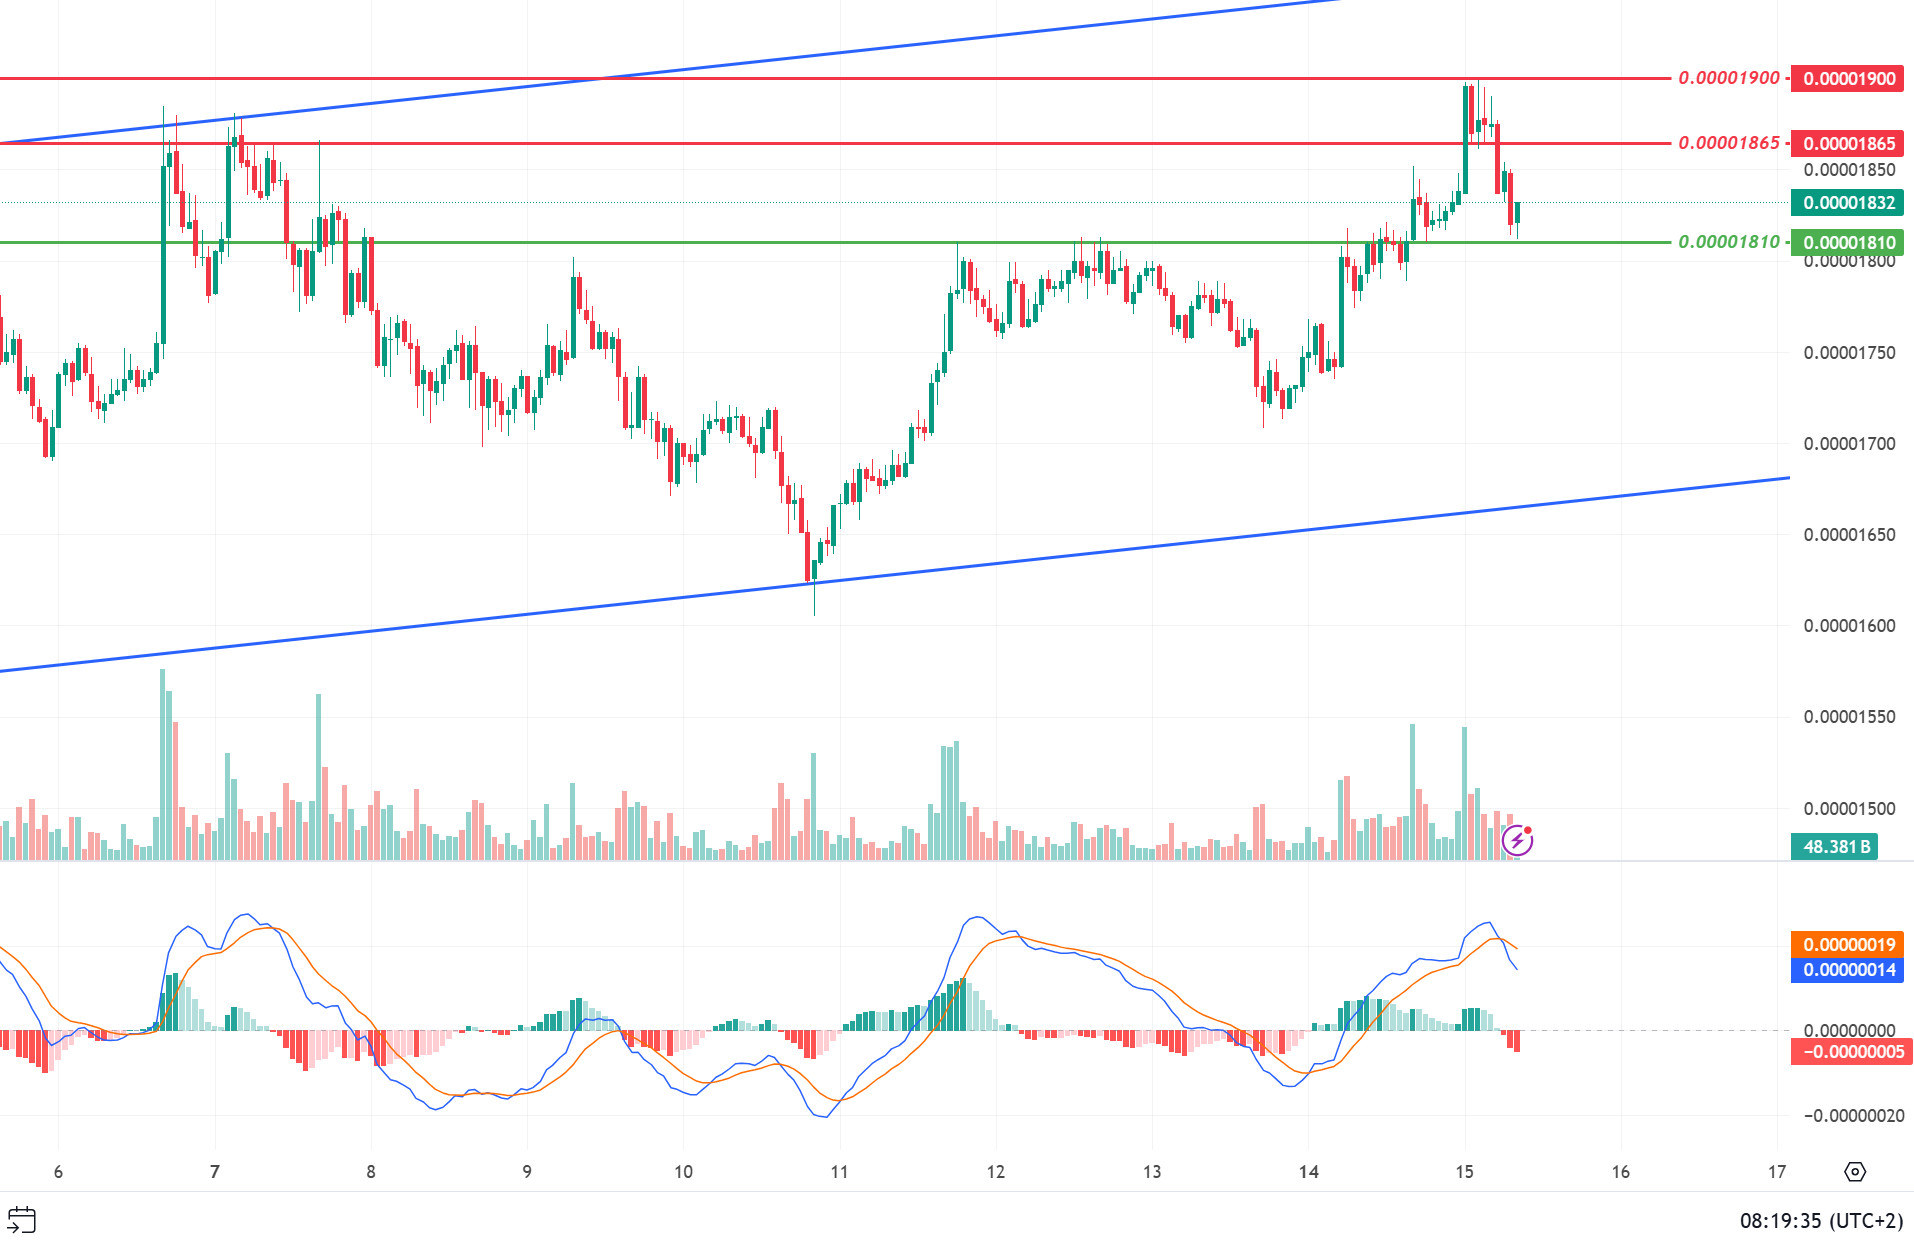
When we examine the SHIB chart, the price is moving towards the upper band with the reaction from the lower band within the rising price channel. SHIB, which was rejected from the 0.00001900 resistance level, seems to have made its correction towards 0.00001810 levels. According to the MACD oscillator, the selling pressure seems to be more compared to the previous hour. In the negative scenario, the price may move towards 0.00001765 levels with the loss of 0.00001810 level. In the positive scenario, the price may want to break the selling pressure at 0.00001900 if the price maintains above 0.00001810.
Supports 0.00001810 – 0.00001765 – 0.00001690
Resistances 0.00001865 – 0.00001900 – 0.00001950
LEGAL NOTICE
The investment information, comments and recommendations contained herein do not constitute investment advice. Investment advisory services are provided individually by authorized institutions taking into account the risk and return preferences of individuals. The comments and recommendations contained herein are of a general nature. These recommendations may not be suitable for your financial situation and risk and return preferences. Therefore, making an investment decision based solely on the information contained herein may not produce results in line with your expectations.


