
MARKET SUMMARY
Latest Situation in Crypto Assets
| Assets | Last Price | 24h Change | Dominance | Market Cap |
|---|---|---|---|---|
| BTC | 66,989.00 | -1.71% | 57.24% | 1.32 T |
| ETH | 2,623.00 | -2.69% | 13.65% | 315.74 B |
| SOLANA | 166.48 | 0.59% | 3.38% | 78.25 B |
| XRP | 0.5322 | -3.26% | 1.30% | 30.18 B |
| DOGE | 0.1408 | -1.99% | 0.89% | 20.59 B |
| TRX | 0.1596 | 1.41% | 0.60% | 13.81 B |
| CARDANO | 0.3598 | -0.18% | 0.54% | 12.57 B |
| AVAX | 27.69 | -1.39% | 0.49% | 11.24 B |
| SHIB | 0.00001814 | -2.61% | 0.46% | 10.67 B |
| LINK | 12.17 | 3.85% | 0.33% | 7.63 B |
| DOT | 4.322 | -2.90% | 0.28% | 6.52 B |
*Prepared on 10.22.2024 at 06:00 (UTC)
WHAT’S LEFT BEHIND
The Latest on Bitcoin ETFs
Investments in Bitcoin ETFs reached $294 million in recent days, with BlackRock’s IBIT product in particular generating a remarkable inflow of $329 million. In the same period, there was an outflow of $20.8 million from Ethereum ETFs. Developments show that investors are turning towards Bitcoin and away from Ethereum.
Mining Shares
After the Bitcoin halving, miners faced a challenging period as their rewards were halved. Thielen noted that despite hedge funds’ moves against the industry, some miners still offer promising opportunities. It is predicted that if Bitcoin surpasses the $70,000 level, a major rally in mining stocks could be triggered.
Elon Musk backs crypto and XRP advocate senatorial candidate
With two weeks to go until the presidential elections in the US, senatorial elections in the states will also be held along with the presidential elections. John Deaton and Elizabeth Warren are currently competing for the state of Massachusetts. In the struggle between the two candidates, Elon Musk supported Deaton on X.
HIGHLIGHTS OF THE DAY
Important Economic Calender Data
| Time | News | Expectation | Previous |
|---|---|---|---|
| 14:00 USFOMC | Member Harker Speaks |
INFORMATION
*The calendar is based on UTC (Coordinated Universal Time) time zone. The economic calendar content on the relevant page is obtained from reliable news and data providers. The news in the economic calendar content, the date and time of the announcement of the news, possible changes in the previous, expectations and announced figures are made by the data provider institutions. Darkex cannot be held responsible for possible changes that may arise from similar situations.
MARKET COMPASS
The rise in US 10-year bond yields following the statements made by the Federal Reserve officials and the strong dollar, which remained strong amid expectations that Trump is ahead in the presidential election, drove asset prices in global markets. The statements of the regional FED presidents led to a perception that the bank would not follow an interest rate cut course as fast as expected, leading to a rise in bond yields. Losses in assets considered to be relatively riskier also affected equities and digital assets.
Later in the day, Federal Open Market Committee (FOMC) official Harker’s remarks at the “Annual Fintech Conference” hosted by the Philadelphia FED will be monitored. Harker’s remarks may be important as FED officials’ recent comments on monetary policy have caused shifts in pricing behavior.
US 10-Year Bond Yield
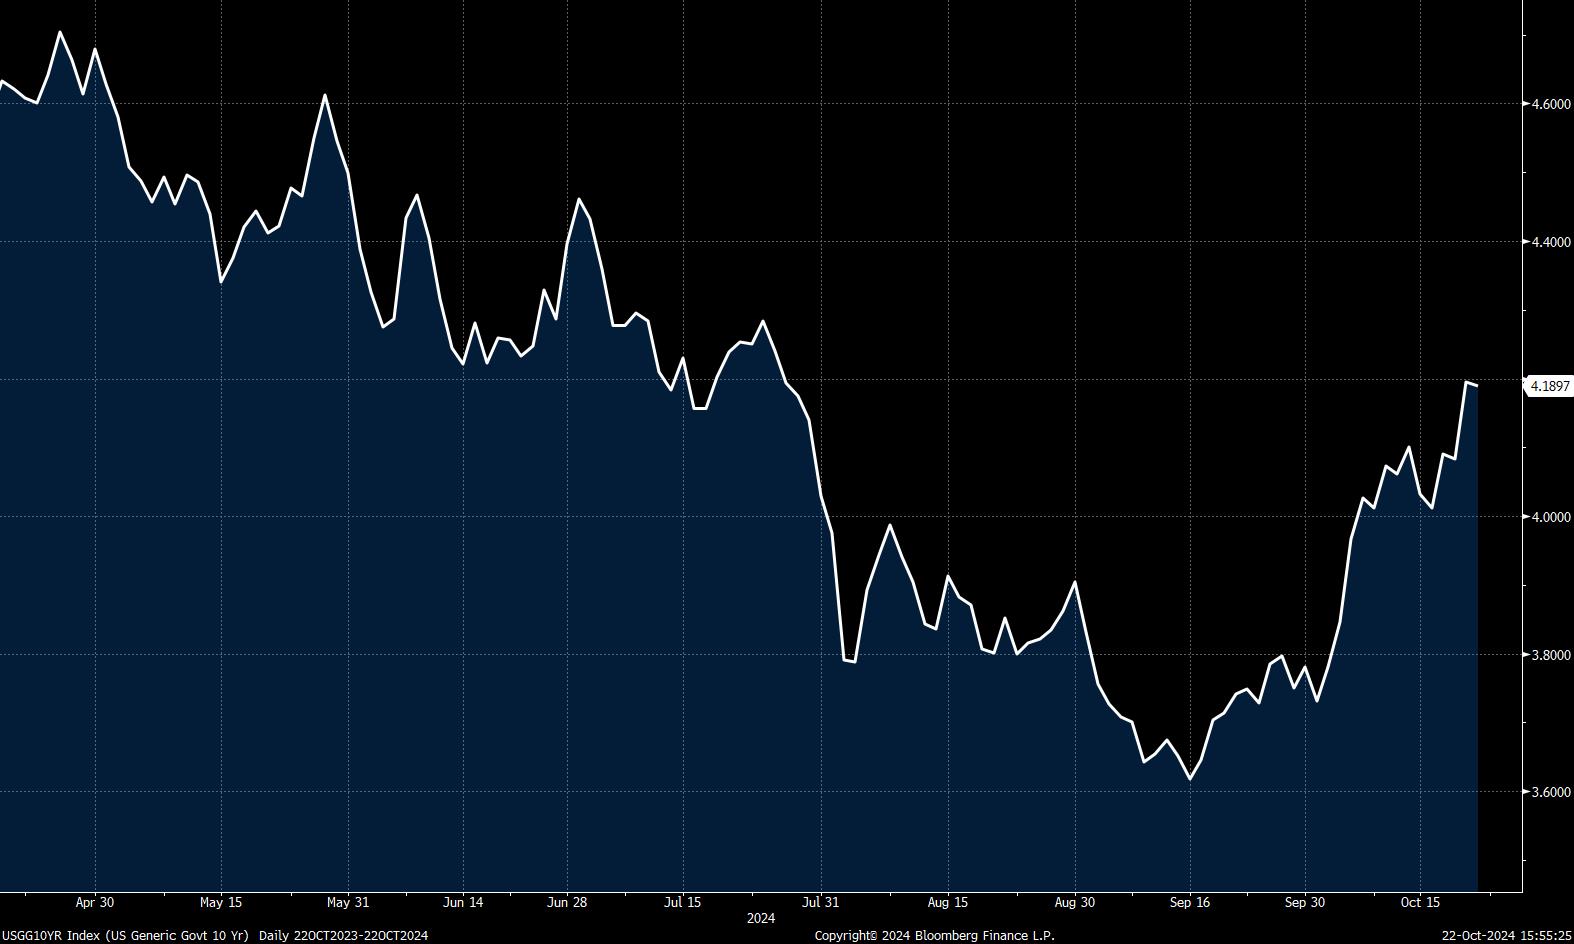
Source: Bloomberg
Following the last rise of digital assets on October 10, we have seen short periods of respite from time to time. Bitcoin, which approached $70,000 at the start of the new week, started a similar retreat during Asian transactions, while new shaping in the recent dynamics affecting the price created the ground for the decline to deepen a little more this time. This price change, which comes after the gains made since mid-October, should not come as a surprise. However, it seems that the risk appetite in the markets needs to continue to decline in order for the expectation that the decline may expand further to continue to increase. For this, the direction of the dollar index (DXY) and whether the recent rise in US 10-year bond yields will continue may be important and can be monitored as indicators for market monitoring.
TECHNICAL ANALYSIS
BTC/USDT
The series was not broken in the new week in Bitcoin Spot ETFs. BTC spot ETFs, which entered our lives in January, initially attracted little attention, but over time it has become a serious market with institutional investors focusing on it. ETFs, which caught a positive entry series on five consecutive days last week, continue the series this week, another factor showing that the market is growing in the long term.
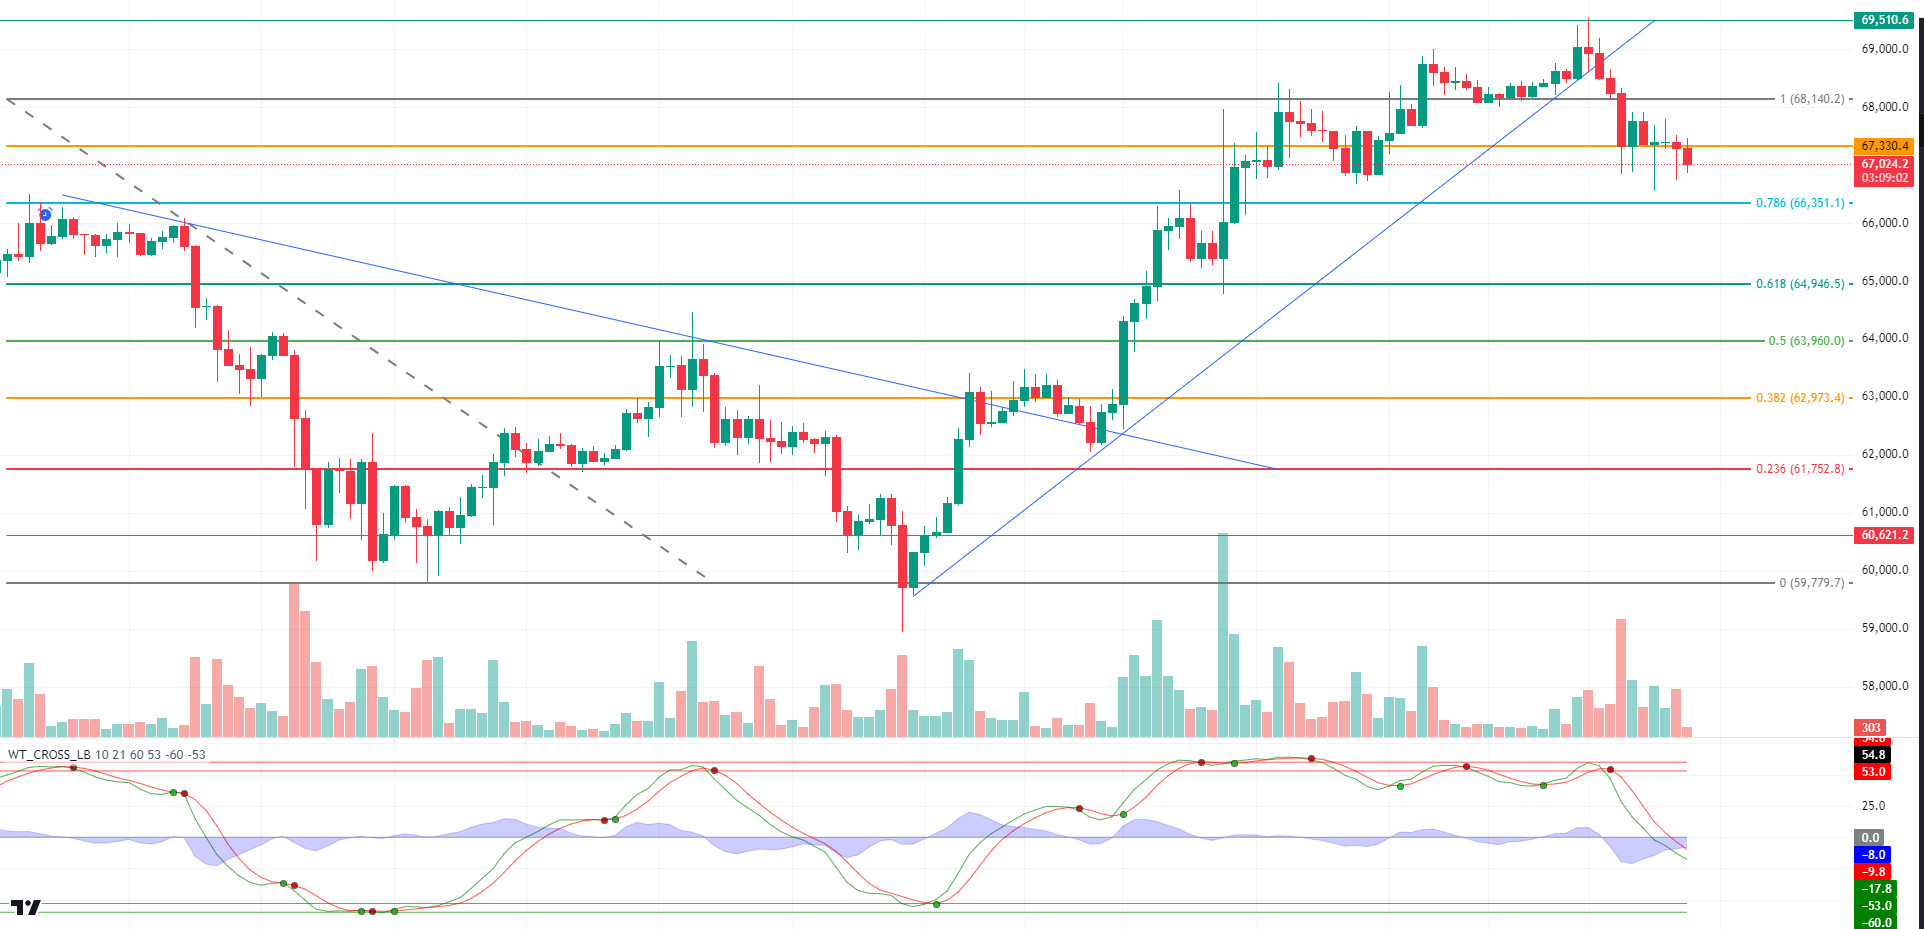
In the BTC technical outlook, the price, which tested the 69,500 level, the level where it peaked within the rising trend channel, could not persist in this region and formed a downtrend in 4 hours. BTC, which is currently priced at the 67,000 level, may increase the selling pressure if it performs hourly closures below the 67,330 support level as it tests below the 67,330 support level several times during the day. When we look at global markets, Asian indices are mixed and European indices are negative, which is reflected in the US market. With the deepening of the retreat in BTC, the first level we will follow will be the Fibonacci 0.786 (66.351) support point. The fact that technical indicators do not reach the oversold zone and do not produce a buy signal may support a potential pullback. In case the market recovers, Fibonacci 1 (68.140) can be retargeted after a persistence above 67.330.
Supports 67,330 – 66,350 – 64,946
Resistances 68,140 – 69,510 – 71,470
ETH/USDT
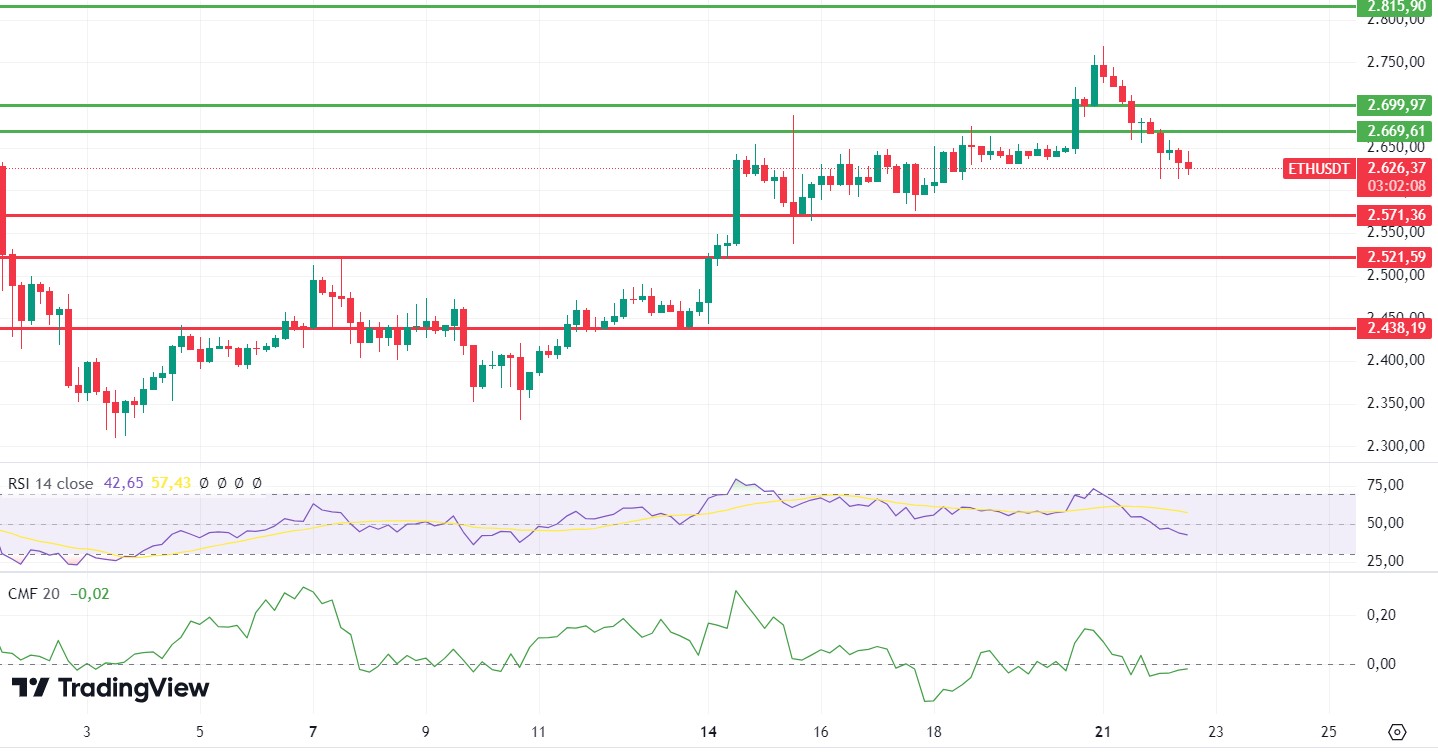
For Ethereum, which has been slightly negative during the day as expected with the weakness in momentum, Chaikin Money Flow (CMF) has not yet recovered from the negative value. Negativity also continues on the Relative Strength Index (RSI). In summary, it seems likely that the declines will continue for a while for ETH, which has weakened after the recent rise. The continuation of this bearish scenario up to the 2,571 level can be seen as a correction. However, breaks below this level may start a negative trend again. In the positive scenario, ETH, which we expect to see persistence above the 2,699 level, can initiate upward movements with hard candles above this level.
Supports 2,571 – 2,521 – 2,440
Resistances 2,669 – 2,700 – 2,815
LINK/USDT
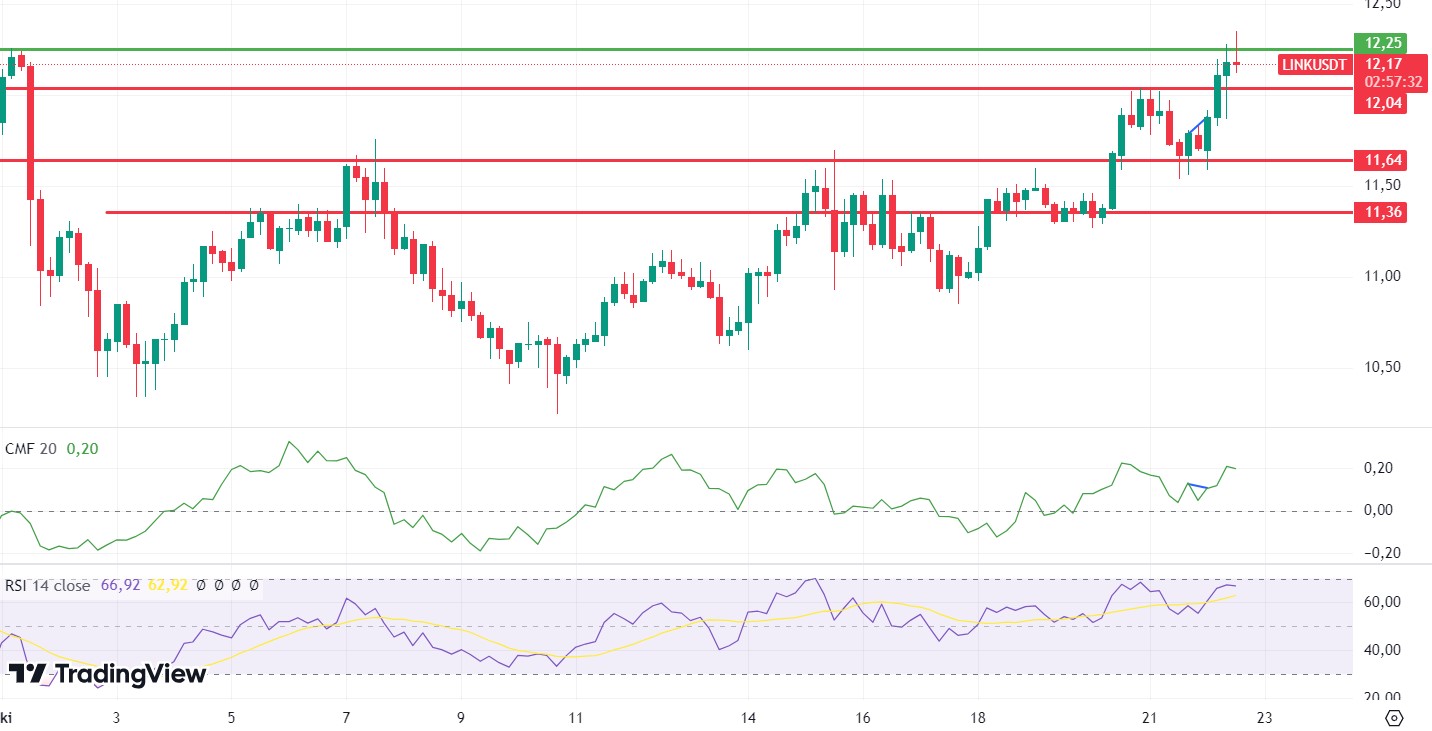
LINK is stuck at 12.25 resistance as it continues to rise after the news that it is “collaborating with Larry Fink, the brains behind BlackRock.” The double top on the Relative Strength Index (RSI) and the reversal signals on Chaikin Money Flow (CMF) indicate that this level is difficult to break. However, it can still be said that the 12.71 level can come quickly with the break of the level. In a bearish scenario, 12.04 and 11.64 levels stand out as strong support points, respectively.
Supports 12.04 – 11.64 – 11.36
Resistances 12.25 – 12.71 – 14.32
SOL/USDT
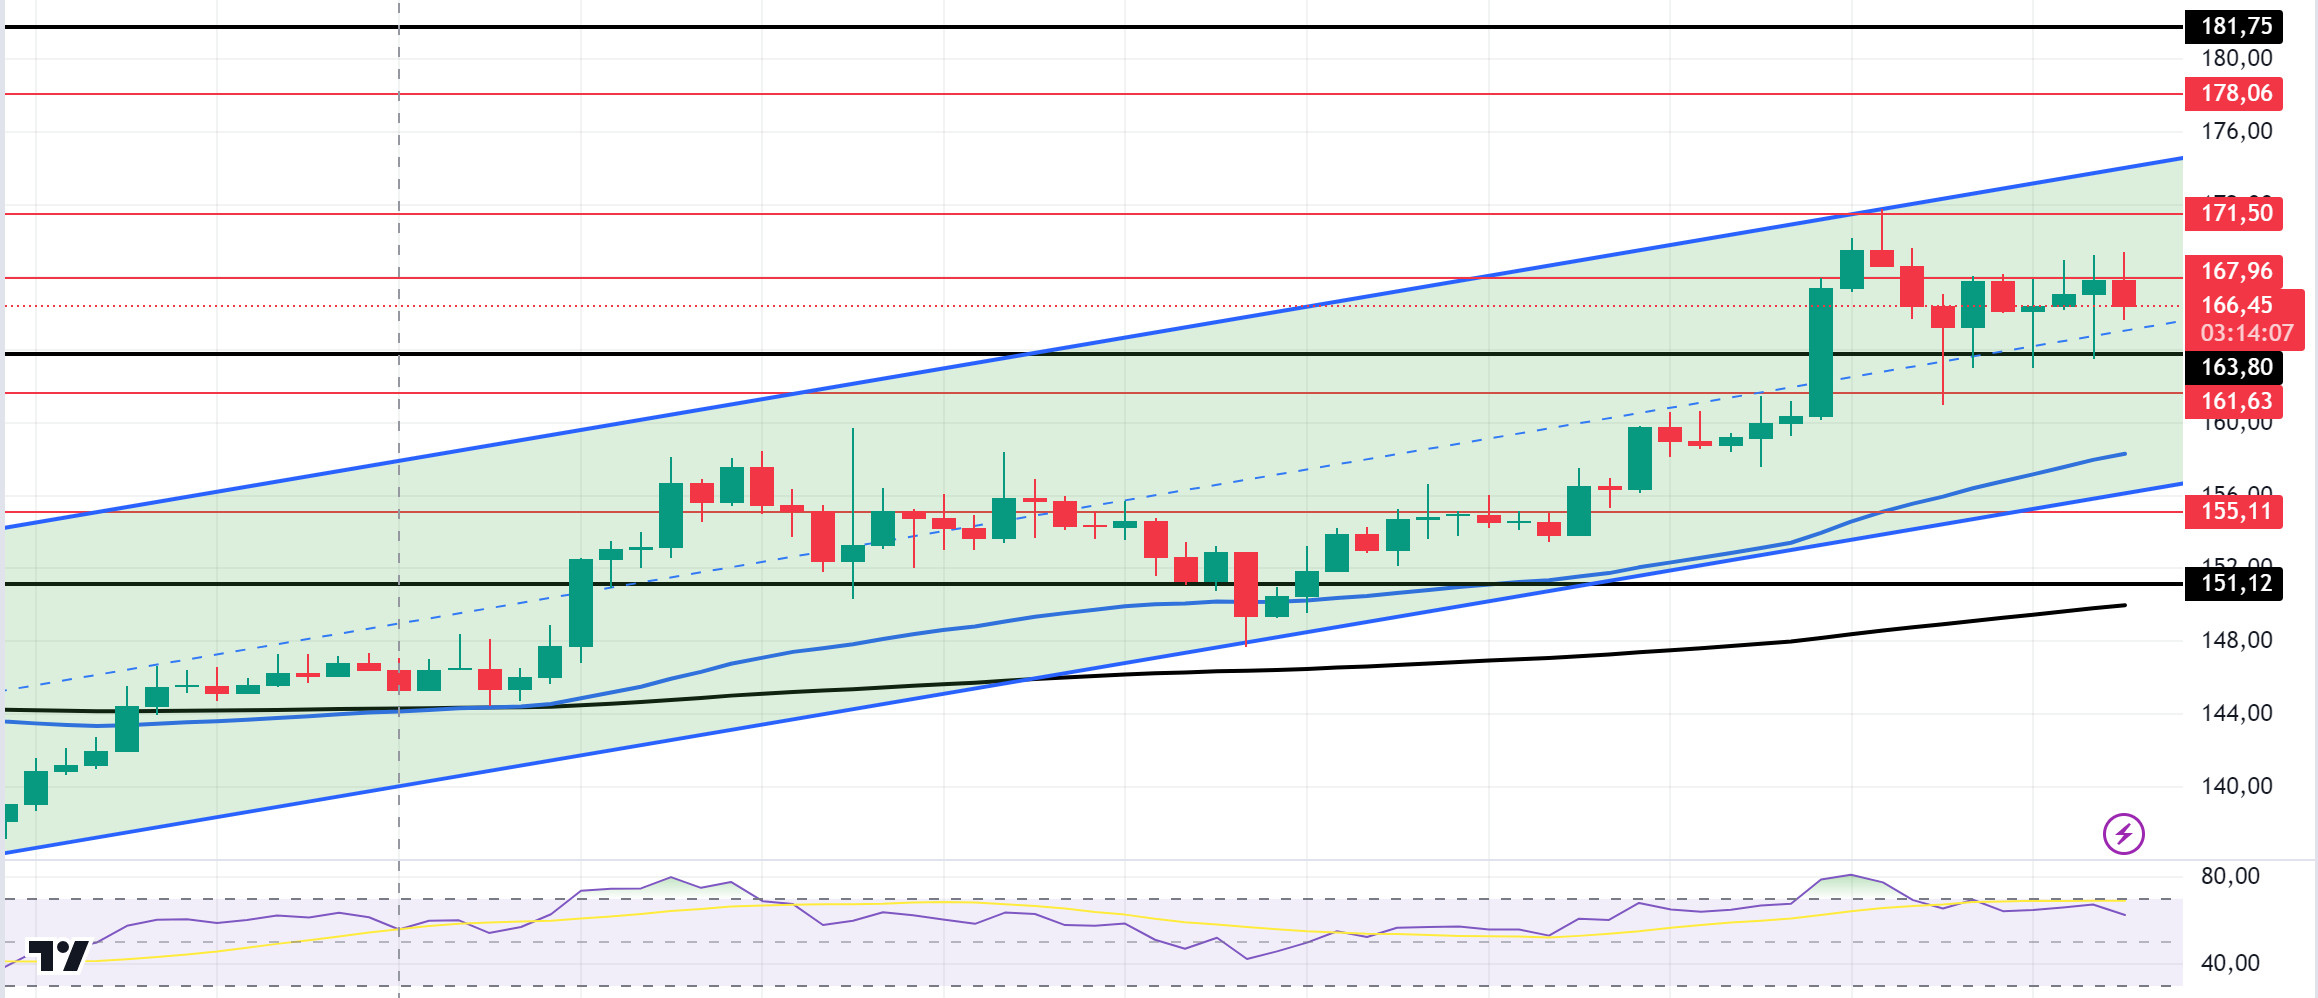
The price has been sideways since our morning chart. Looking at the chart, the 50 EMA (Blue Line) continues to be above the 200 EMA (Black Line) on the 4-hour timeframe. This could mean that the uptrend will continue. The price broke an important resistance level of 163.80 on volume, continuing the uptrend that started on October 10. However, the Relative Strength Index (RSI)14 indicator started to fall from the overbought zone. This indicates the start of profit sales. This gives us the meaning that the SOL price may fall. The 181.75 level is a very strong resistance point in the uptrend driven by both macroeconomic conditions and innovations in the Solana ecosystem. If it rises above this level, the rise may continue strongly. In case of possible profit sales, support levels of 163.80 – 161.63 should be followed. If the price comes to these support levels, a potential bullish opportunity may arise.
Supports 163.80 – 161.63 – 155.11
Resistances 167.96 – 171.50 – 178.06
ADA/USDT
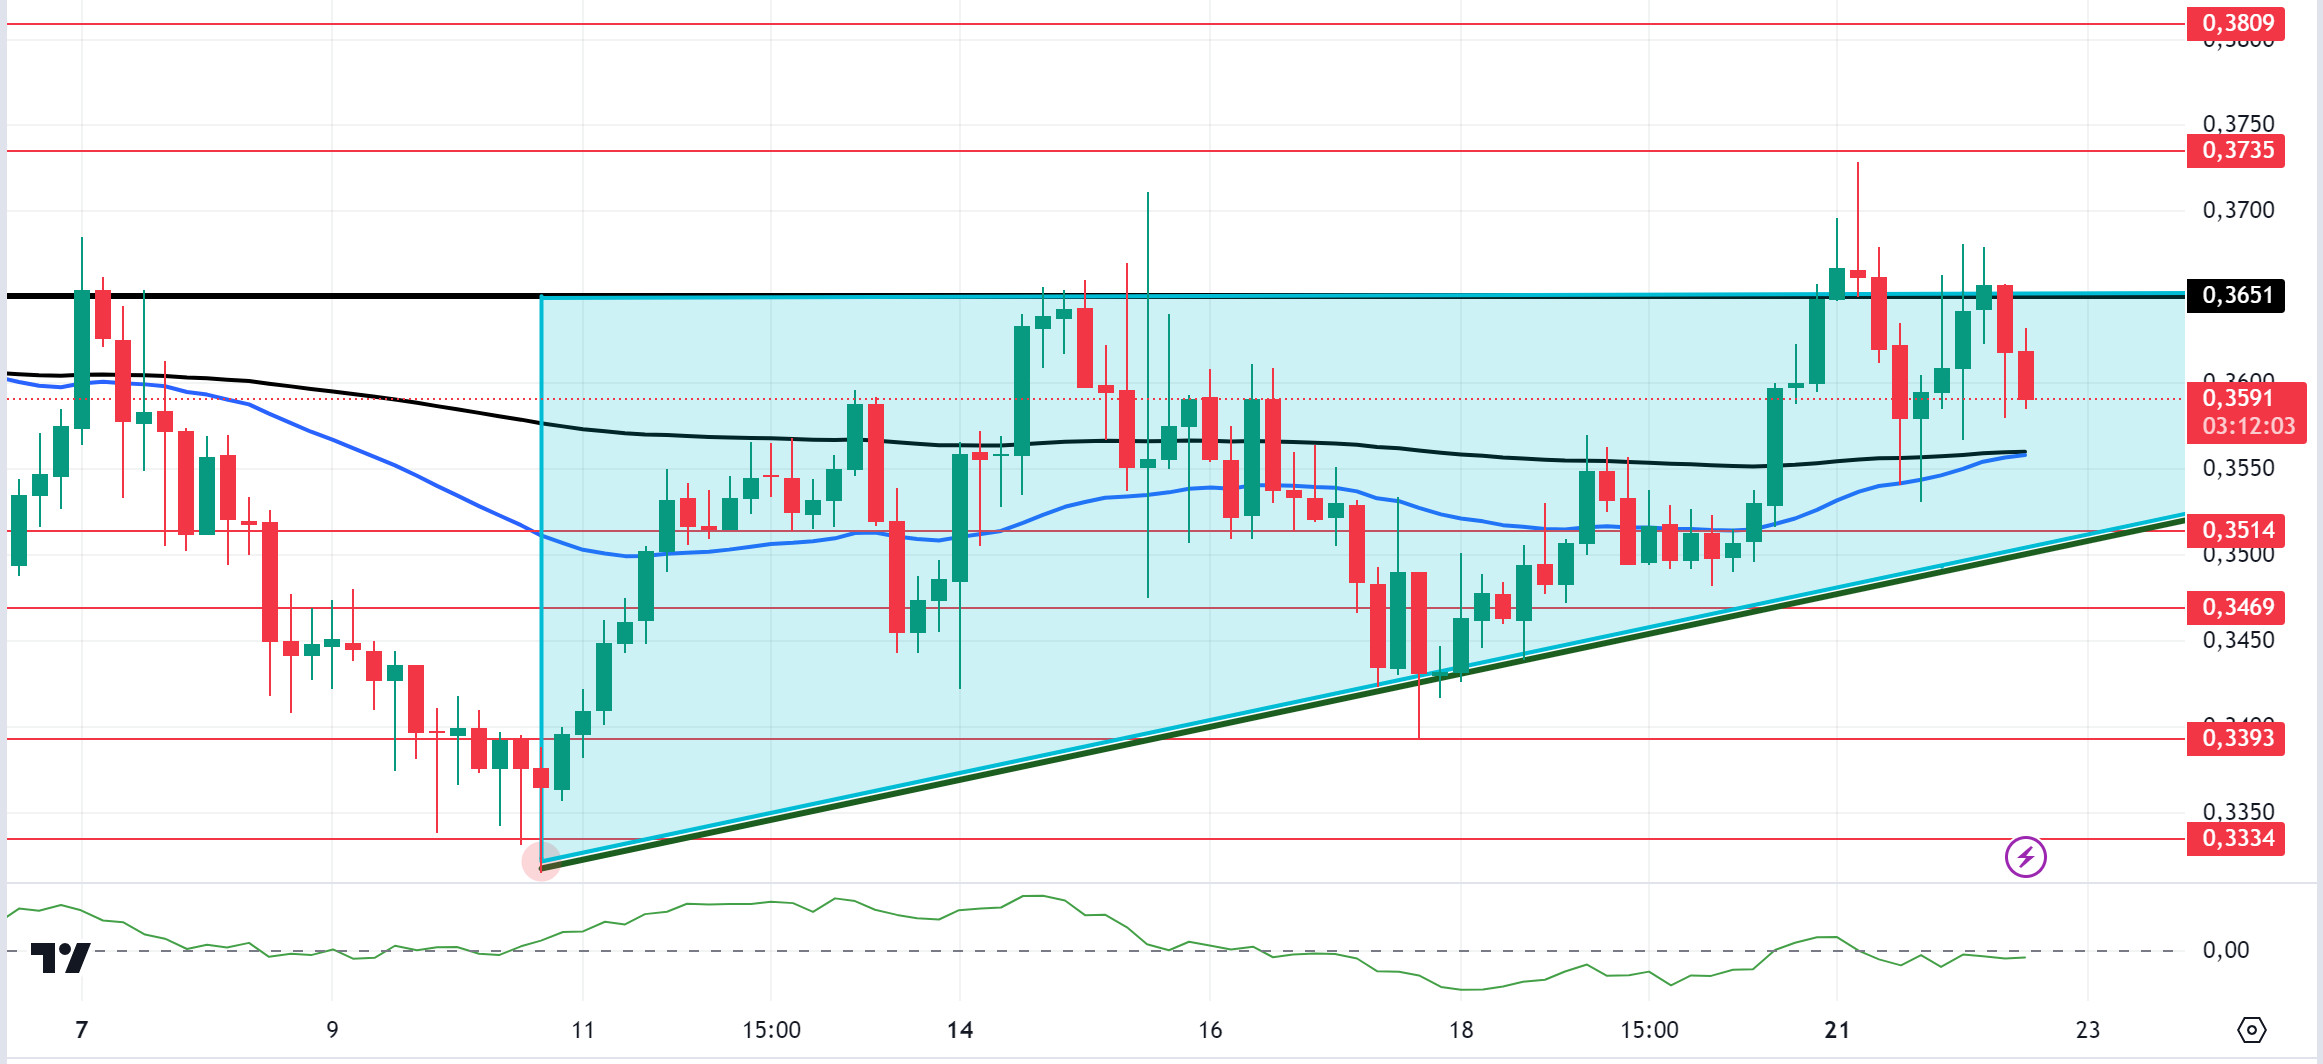
On the 4-hour chart, the price is pricing above the 50 EMA and 200 EMA. At the same time, the 50 EMA (Blue Line) continues to hover below the 200 EMA (Black Line). This supports that the trend is bearish. The Chaikin Money Flow (CMF) 20 indicator remains neutral despite all this data. This may complicate the upside momentum. At the same time, ADA, which tested the ceiling level of the ascending triangle pattern for the second time, may test the resistance level of 0.3905 if it breaks this level. Continued decline in money flow may signal a potential decline towards the 0.3514 support zone. If this happens, 0.3514 is a strong support level and can be followed as a good place to buy.
Supports 0.3514 – 0.3469 – 0.3393
Resistances 0.3651 – 0.3735 – 0.3809
AVAX/USDT
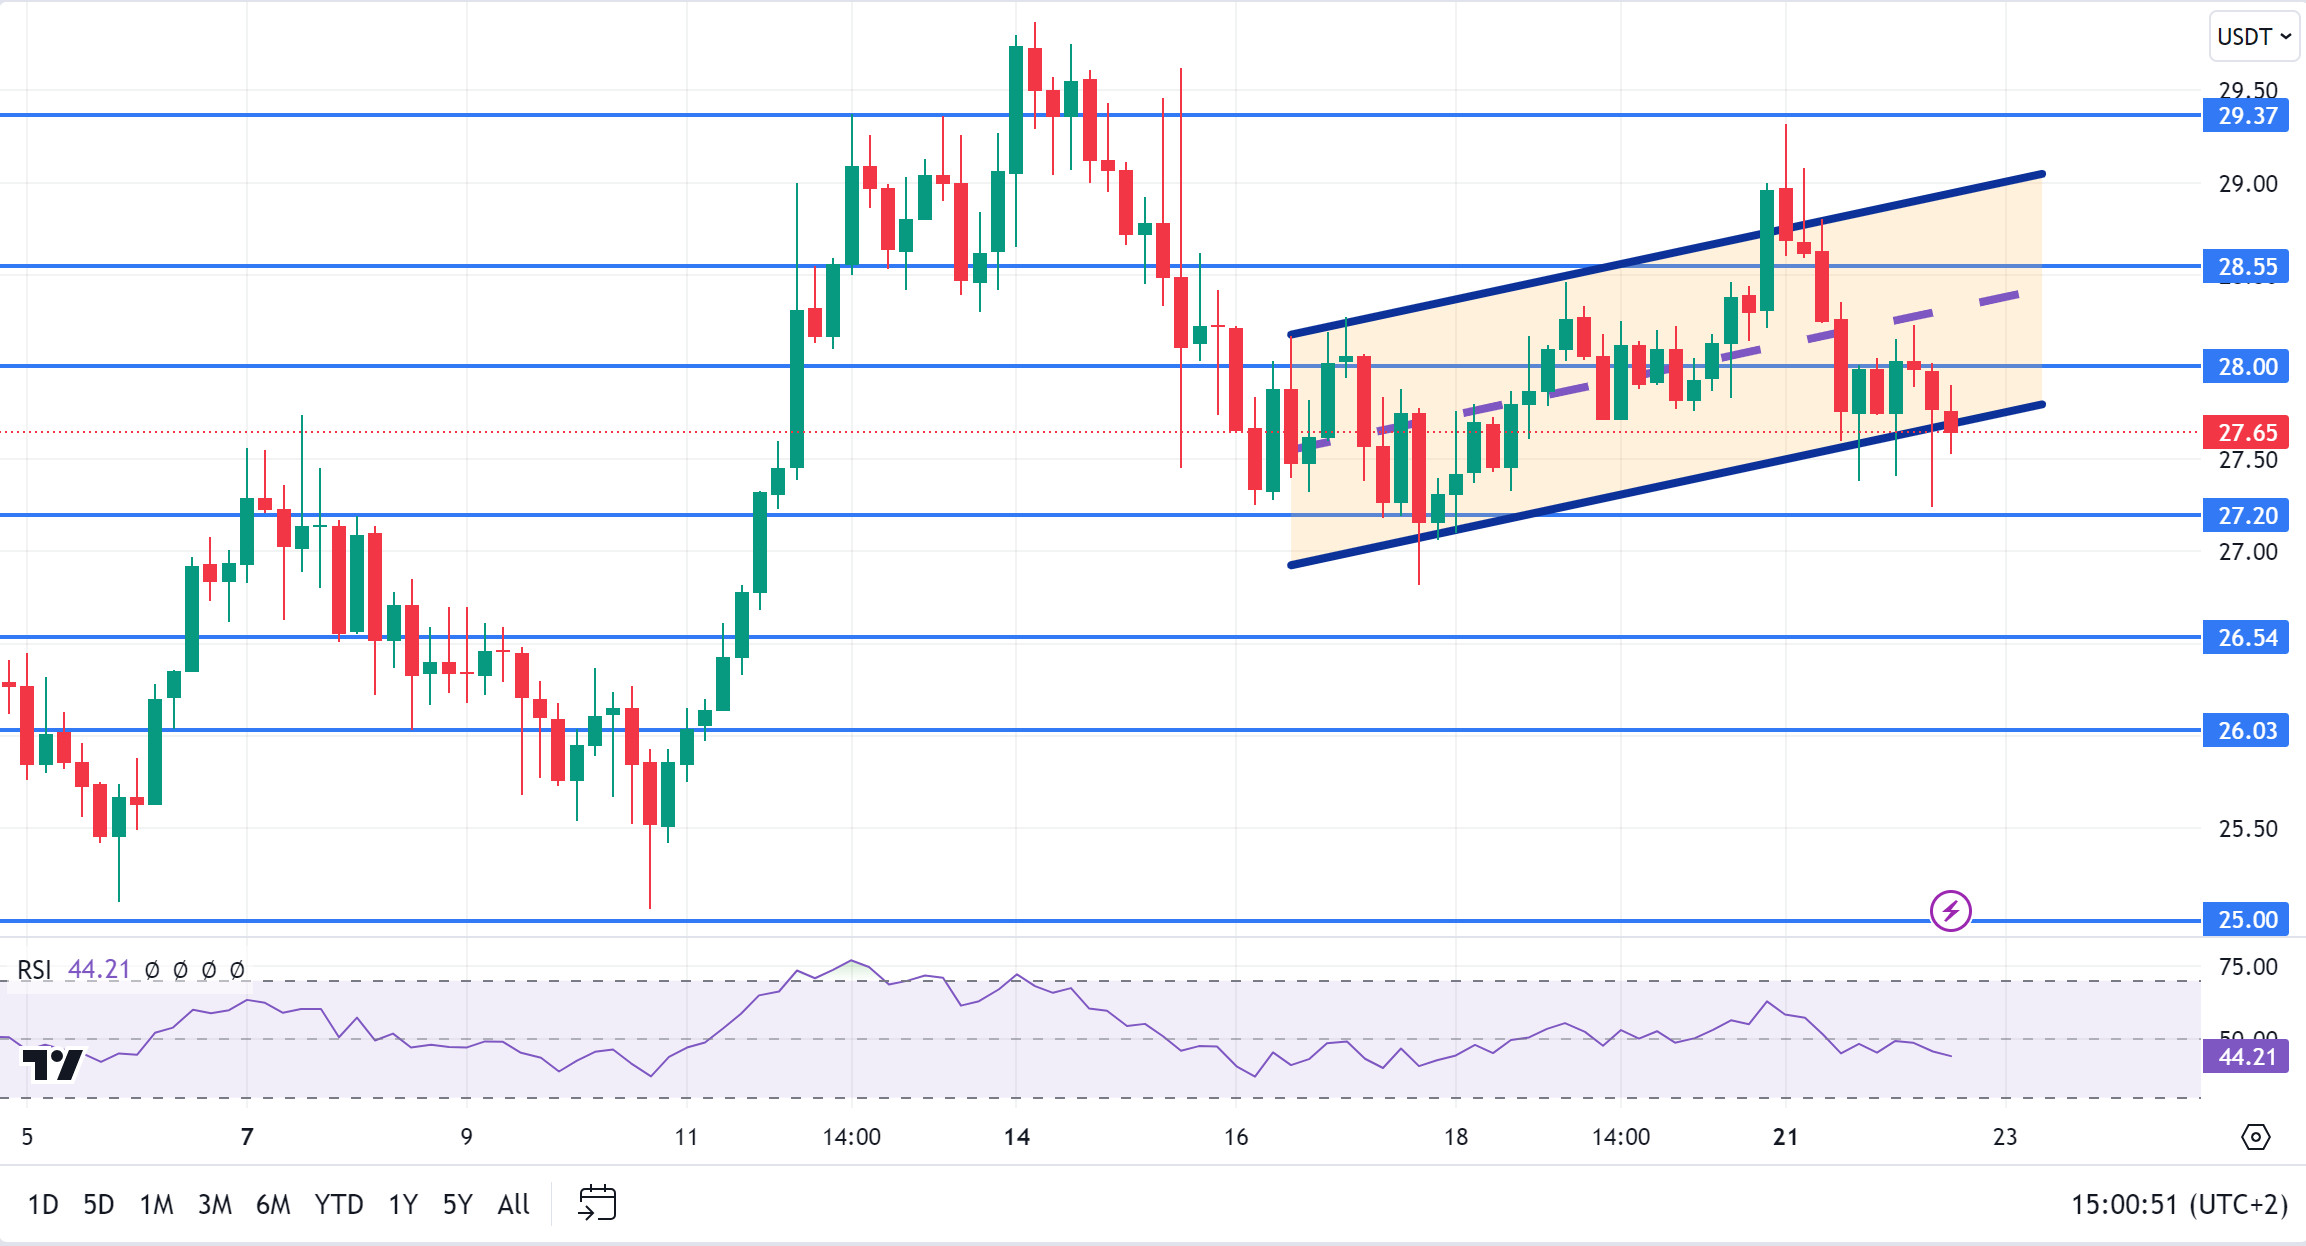
AVAX, which opened today at 27.75, fell slightly during the day and is trading at 27.65. Today, there is no planned data to be announced especially by the US and expected to affect the market. For this reason, it may be a low-volume day where we may see limited movements. News flows from the Middle East will be important for the market.
On the 4-hour chart, it moves within the bullish channel. It is in the lower band of the bullish channel and with a Relative Strength Index value of 44, it can be expected to rise slightly from here and move to the middle band. In such a case, it may test the 28.00 resistance. On the other hand, sales may increase in case of news of increasing tension in the Middle East. In such a case, it may test 27.20 support. As long as it stays above 25.00 support during the day, the desire to rise may continue. With the break of 25.00 support, sales may increase.
Supports 27.20 – 26.54 – 26.03
Resistances 28.00 – 28.55 – 29.37
TRX/USDT
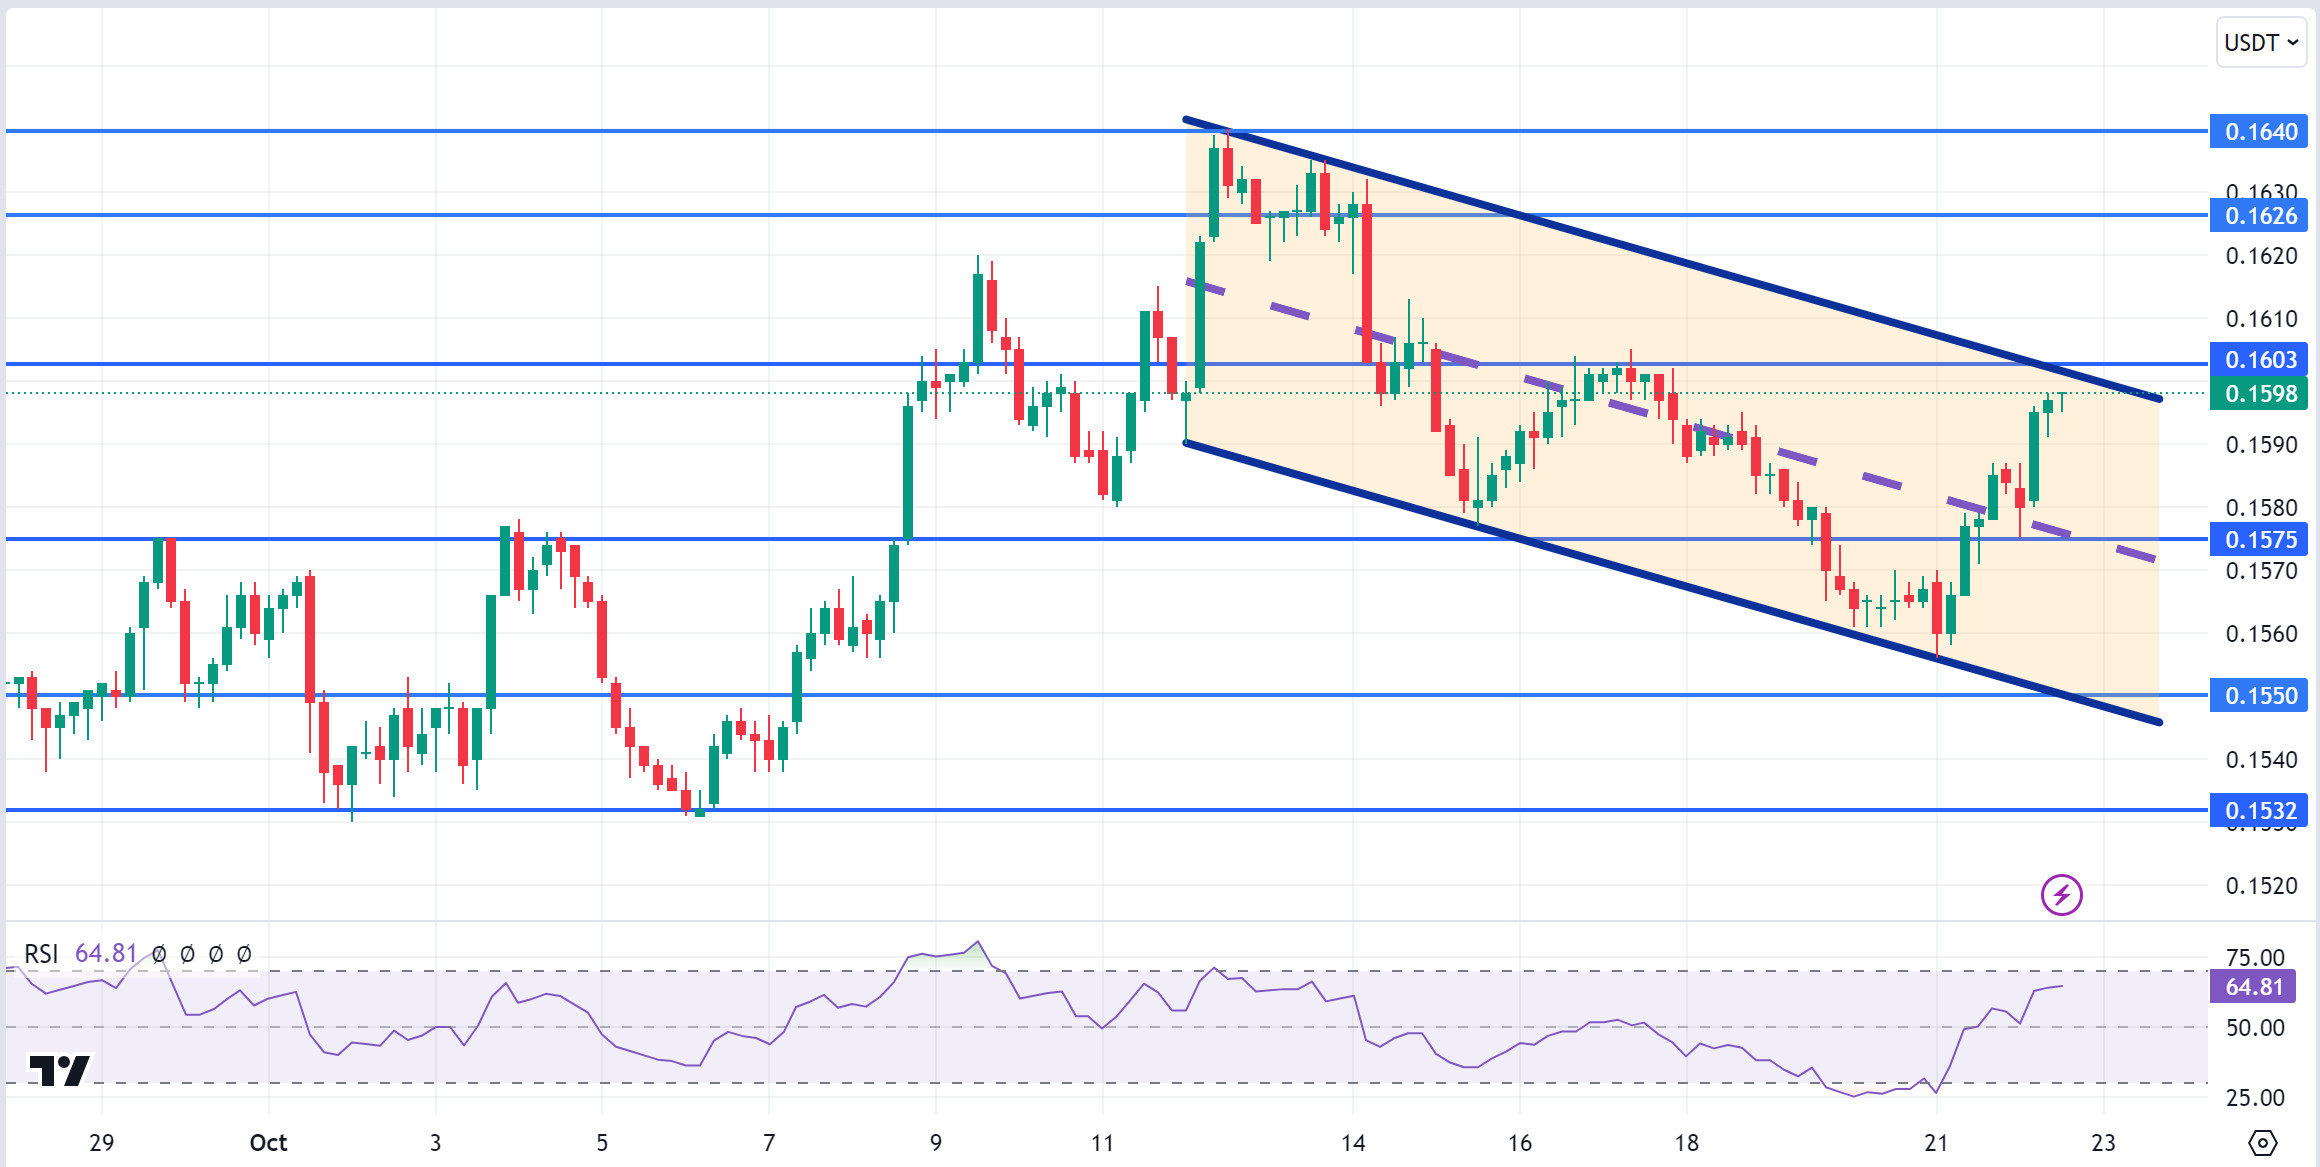
TRX, which started today at 0.1583, rose 1% during the day and is trading at 0.1598. There is no scheduled data for the market today. The market will be closely following the news flows regarding the tension in the Middle East.
On the 4-hour chart, it is in the upper band of the bearish channel. The Relative Strength Index value has approached the overbought zone with 64 and can be expected to decline slightly from its current level. In such a case, it may move to the mid-trend band and test the 0.1575 support. However, if it cannot close the candle under 0.1575 support, it may test 0.1603 resistance with the buying reaction that may occur. As long as TRX stays above 0.1482 support, the desire to rise may continue. If this support is broken downwards, sales can be expected to increase.
Supports 0.1575 – 0.1550 – 0.1532
Resistances 0.1603 – 0.1626 – 0.1640
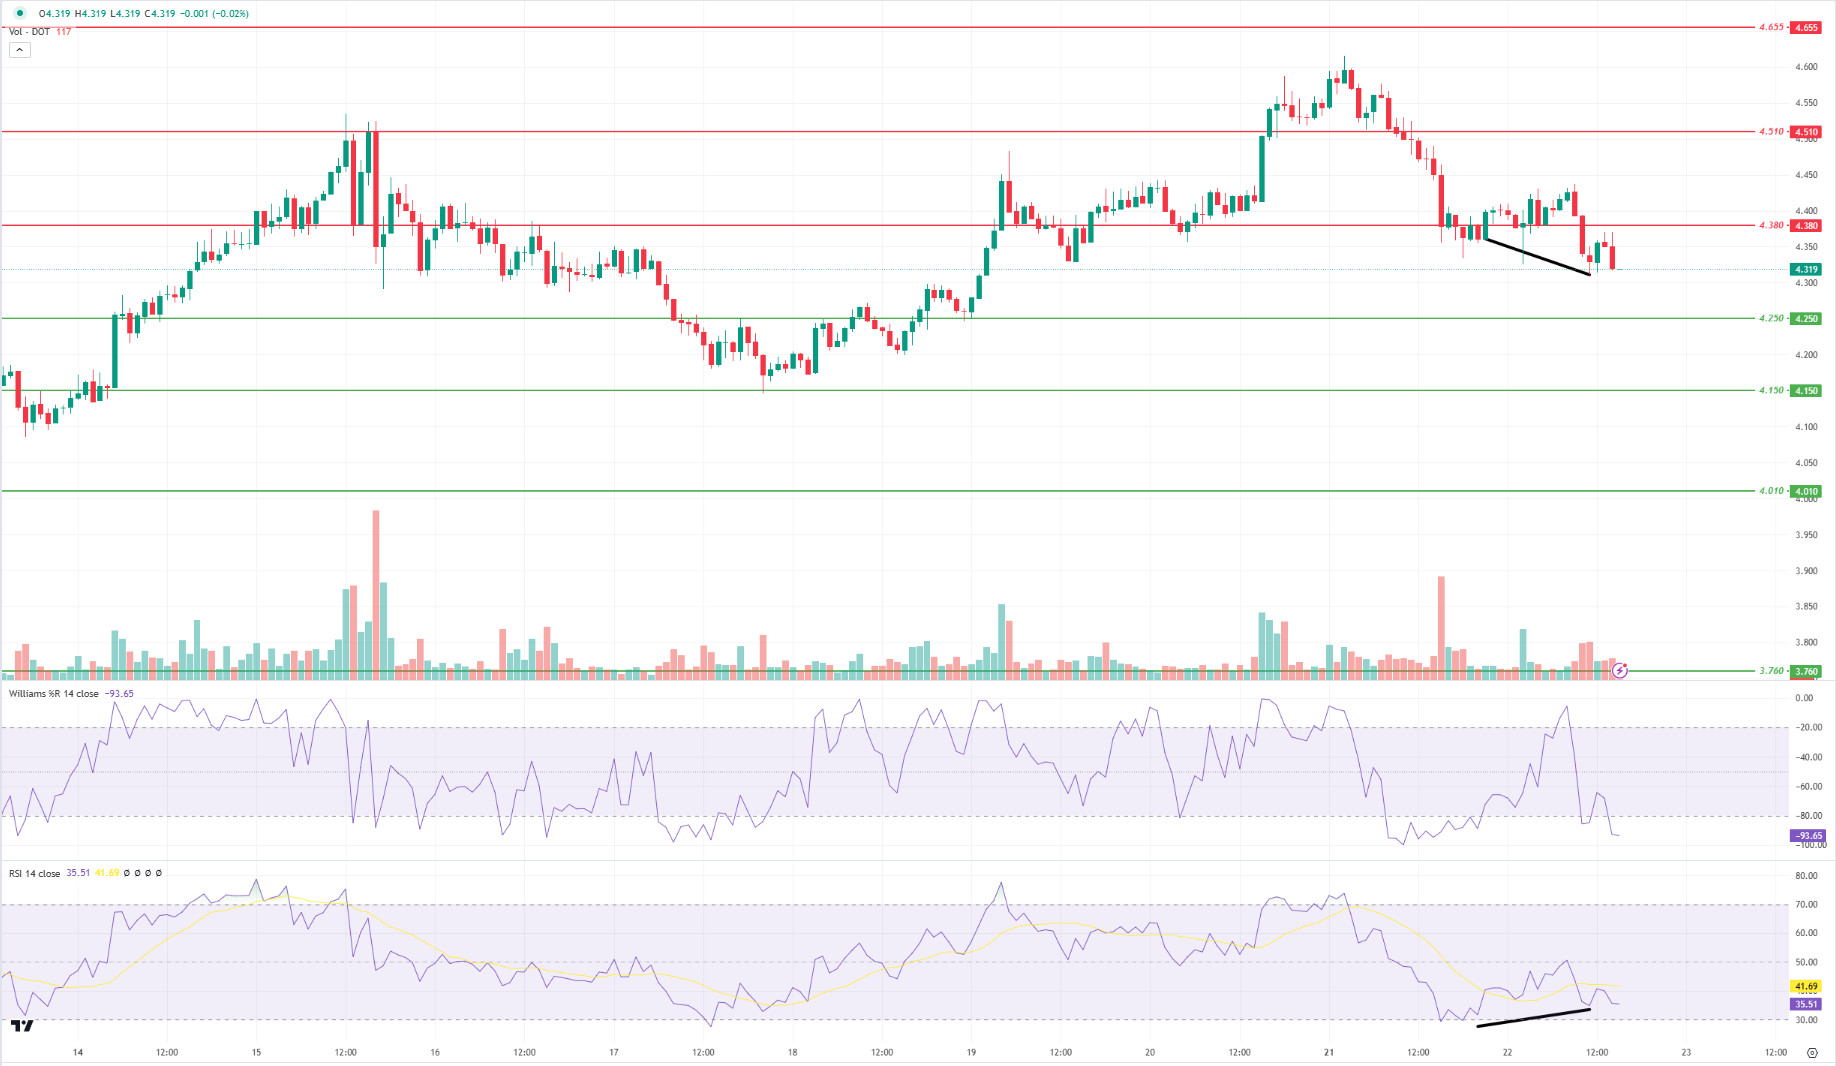
DOT/USDT
Aventus announced the launch of Aventus 2.0 to expand enterprise use cases on the Polkadot (DOT) network. The update aims to increase network performance and user engagement by introducing features such as a Layer 3 appchain model, a liquidity mining program, and an AVT token burning mechanism. Aventus 2.0 will be implemented according to a community-driven plan and aims to play an important role in the Polkadot ecosystem for enterprise solutions.
When we examine the DOT chart, selling pressure continued as the Williams R% oscillator broke below the -20 level. Breaking down the 4.380 support band, DOT continues to correct with increasing buying pressure. When we examine the Williams R% oscillator, we see that it fell below the -80 level. In this context, the price may move towards the 4,250 support level. On the other hand, when we examine the Relative Strength Index (RSI) oscillator, we see that there is a positive divergence between the price. According to this situation, if the price can maintain above the 4.380 level, its next target may be the 4.510 resistance level.
Supports 4,250 – 4,150 – 4,010
Resistances 4.380 – 4.510 – 4.655
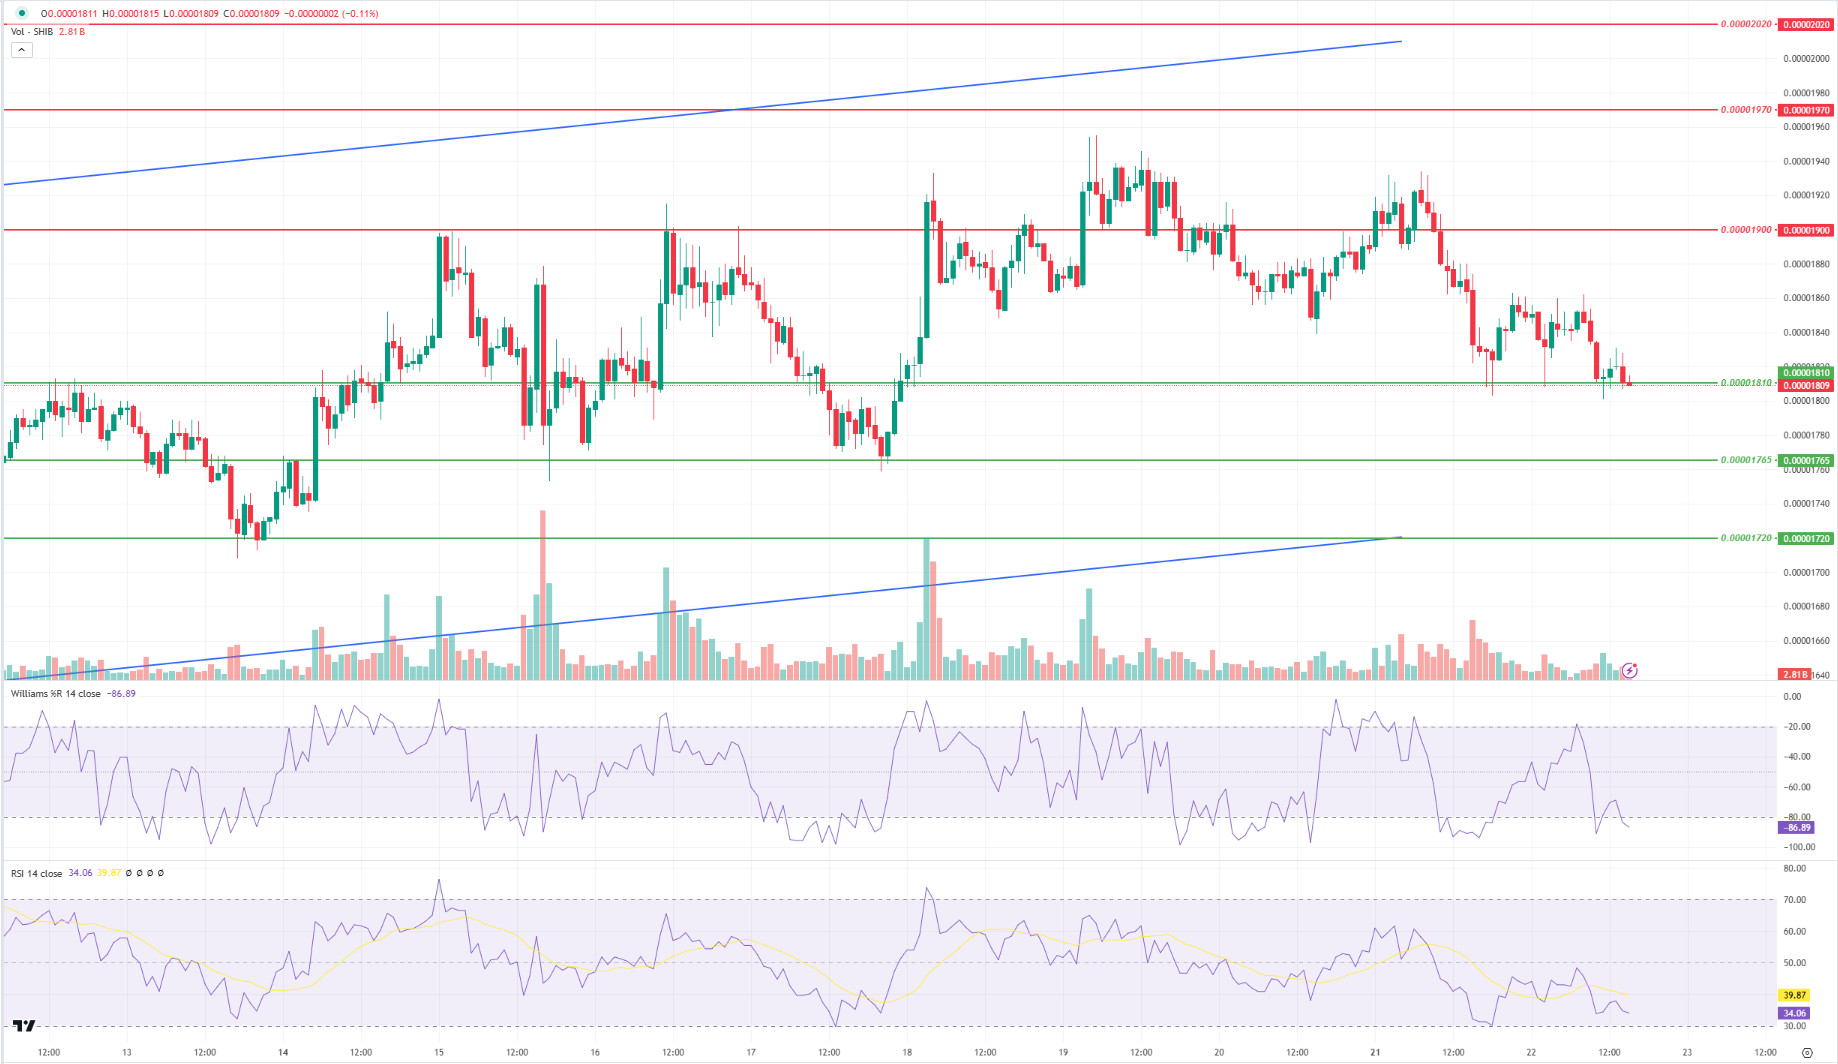
SHIB/USDT
When we examine the chart of Shiba Inu (SHIB), we see that the price is in the 0.00001810 support band. The Williams R% oscillator seems to be breaking the -80 level upwards. When we examine the Relative Strength Index (RSI) oscillator, we see a positive divergence between it and the price. In this context, the price may react from the 0.00001810 support level and move towards the 0.00001900 resistance level. On the other hand, if the price breaks the 0.00001810 support band down, we may see a retracement towards the next support level at the 0.00001765 band.
Supports 0.00001810 – 0.00001765 – 0.00001720
Resistances 0.00001900 – 0.00001970 – 0.00002020
LEGAL NOTICE
The investment information, comments and recommendations contained herein do not constitute investment advice. Investment advisory services are provided individually by authorized institutions taking into account the risk and return preferences of individuals. The comments and recommendations contained herein are of a general nature. These recommendations may not be suitable for your financial situation and risk and return preferences. Therefore, making an investment decision based solely on the information contained herein may not produce results in line with your expectations.
