
MARKET SUMMARY
Latest Situation in Crypto Assets
| Assets | Last Price | 24h Change | Dominance | Market Cap. |
|---|---|---|---|---|
| BTC | 72,352.00 | 1.77% | 58.73% | 1.43 T |
| ETH | 2,661.00 | 1.67% | 13.15% | 320.17 B |
| SOLANA | 178.67 | -0.94% | 3.45% | 84.02 B |
| XRP | 0.5240 | -0.14% | 1.22% | 29.77 B |
| DOGE | 0.1744 | 6.36% | 1.05% | 25.54 B |
| TRX | 0.1675 | 2.05% | 0.60% | 14.49 B |
| CARDANO | 0.3582 | 3.60% | 0.51% | 12.53 B |
| AVAX | 26.56 | -0.05% | 0.44% | 10.81 B |
| SHIB | 0.00001893 | 3.97% | 0.46% | 11.15 B |
| LINK | 11.99 | 4.60% | 0.32% | 7.52 B |
| DOT | 4.204 | 1.49% | 0.26% | 6.36 B |
*Prepared on 10.30.2024 at 06:00 (UTC)
WHAT’S LEFT BEHIND
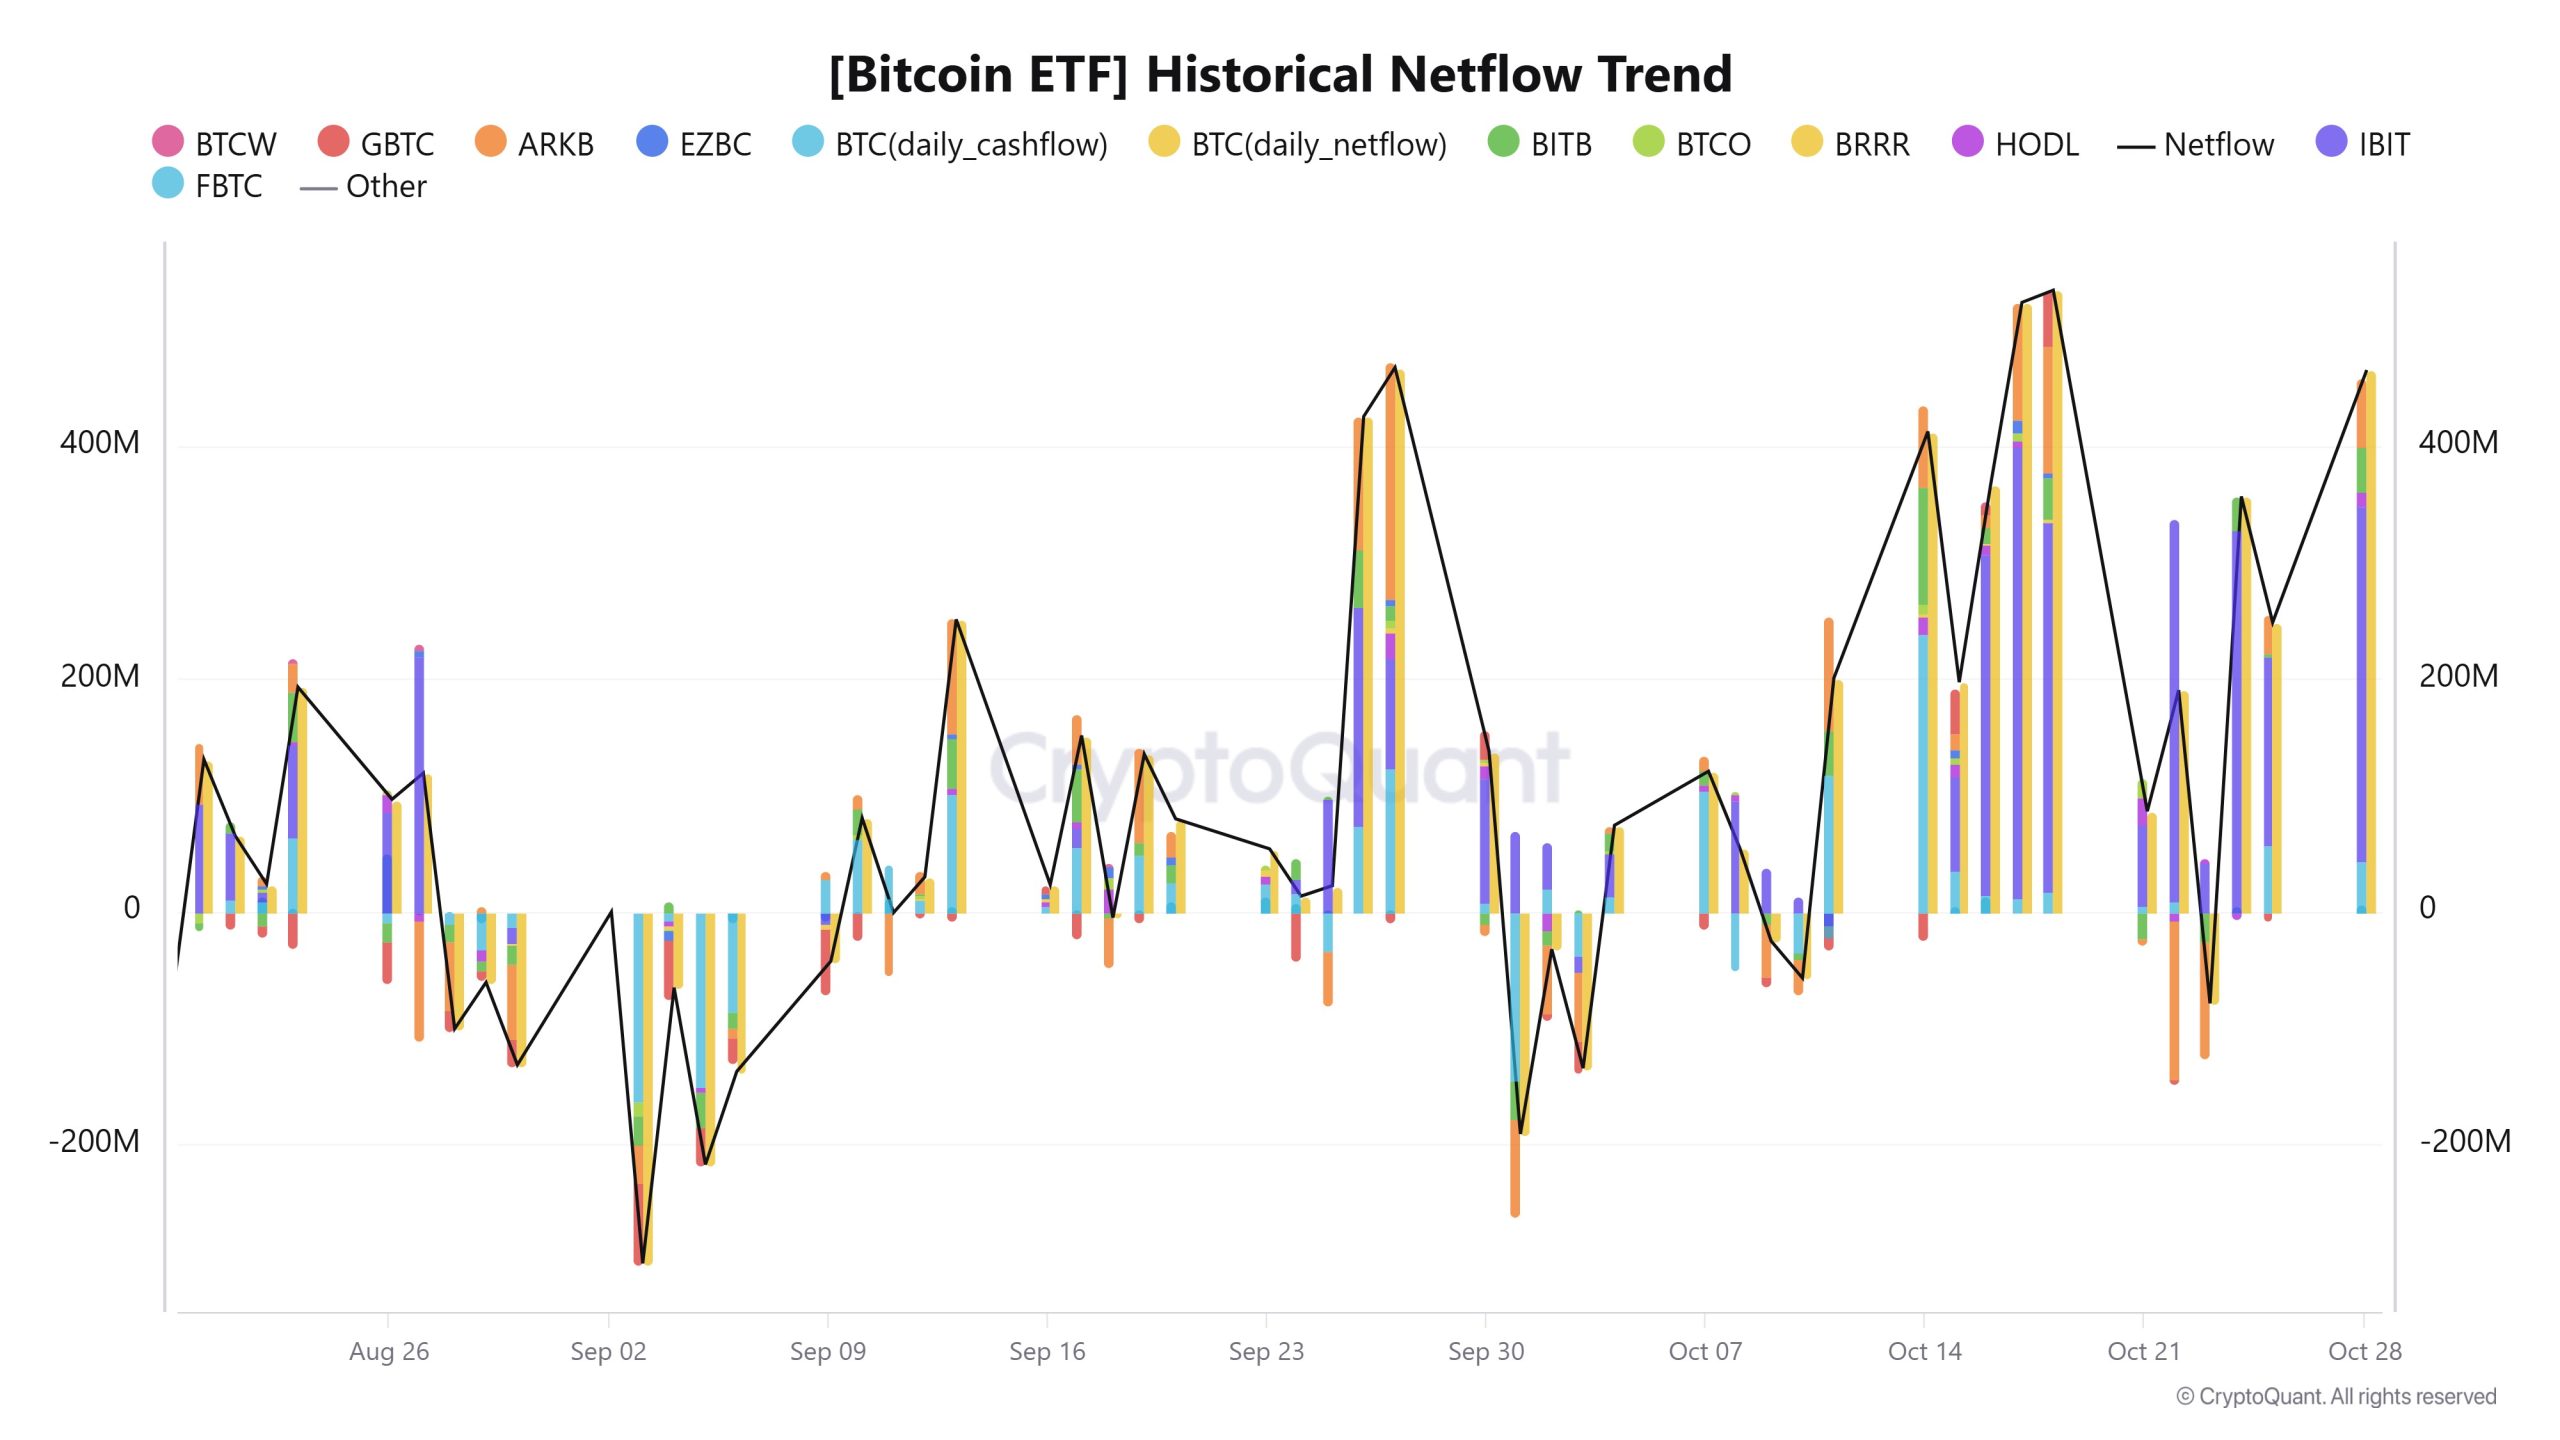
Historic Volume Increase in Spot Bitcoin ETFs
Spot Bitcoin ETFs in the US attracted attention with a trading volume of more than $4.5 billion on October 29. BlackRock’s spot Bitcoin ETF led the way with $3.3 billion in volume. This increase in trading volume is associated with the rise in Bitcoin’s price. The rise in ETF volume is thought to be due to investors buying with FOMO effect.
China will have a big impact
“The effects will be inevitable,” said Arthur Hayes, suggesting that monetary expansion and credit growth in China will accelerate again, but this will take time. Giving the example of the sudden yuan devaluation in 2015, Hayes pointed out that Bitcoin increased 5 times at that time.
SEC Reviews Grayscale’s Cryptocurrency ETF Application
The US Securities and Exchange Commission (SEC) has received for review the application of Grayscale’s Digital Large Cap Fund to trade on the NYSE as an ETF. The ETF aims to offer investors a portfolio of Bitcoin, Ethereum and other cryptocurrencies. If the SEC approves, this development could lead to greater acceptance of cryptocurrencies in the traditional financial world.
HIGHLIGHTS OF THE DAY
Important Economic Calender Data
| Time | News | Expectation | Previous |
|---|---|---|---|
| Calestia (TIA) | 175.56MM Token Unlock | ||
| Helium – Community Call | |||
| Binance Blockchain Week | |||
| 12:15 | US ADP Nonfarm Employment Change (Oct) | 110K | 143K |
| 12:30 | US GDP (QoQ) (Q3) | 3.0% | 3.0% |
| 14:00 | US Pending Home Sales (MoM) (Sep) | 1.9% | 0.6% |
INFORMATION
*The calendar is based on UTC (Coordinated Universal Time) time zone.
The economic calendar content on the relevant page is obtained from reliable news and data providers. The news in the economic calendar content, the date and time of the announcement of the news, possible changes in the previous, expectations and announced figures are made by the data provider institutions. Darkex cannot be held responsible for possible changes that may arise from similar situations.
MARKET COMPASS
Bitcoin approached new record highs as global markets assessed existing risks and upcoming developments. Asian indices have a mixed outlook this morning after the US stock markets closed positive yesterday, led by technology companies. European indices are expected to start the new day with a decline. Today, markets will focus on critical data coming from the US.
Source: Bloomberg
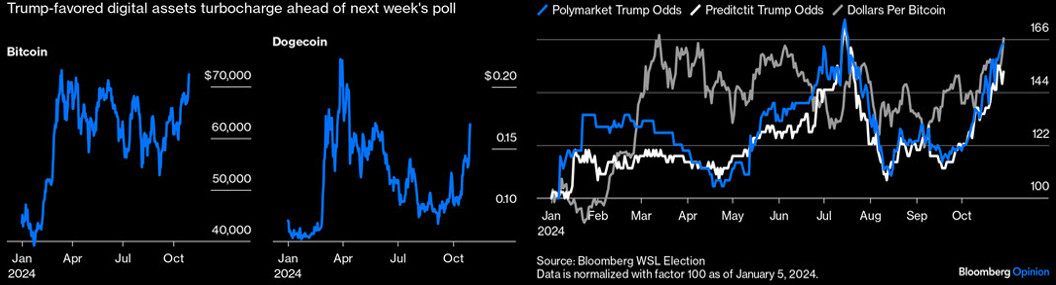
While spot gold broke a record with the pricing behavior brought on by the upcoming US elections and tensions in the Middle East, polls indicating that crypto-friendly Trump was ahead in the election race set the stage for Bitcoin to reach 74 thousand levels. We can also say that the increased demand for spot EFTs and cash inflows, which indicate that institutional investors’ interest in digital assets has increased, also contributed to the upward movement.
Source: CrypoQuant
Can US growth and employment data give direction to the markets?
One of the important data releases from the US today is the economic growth (GDP) data for the third quarter. The US economy is expected to have grown by 3% in the last quarter compared to the previous quarter. In the shadow of recent rumors that “the US economy remains hot and the Federal Reserve (FED) may follow a slower pace of interest rate cuts”, a GDP data that will exceed or fall short of the forecasts may cause a mixed market reaction. We consider data that may be in line with or slightly above expectations to be positive for digital assets, while data that may be much above expectations may have an initial positive and then a negative impact. It is worth noting that the opposite is true.
Just ahead of the GDP data, markets will see how many jobs the US private sector added in the non-farm sectors in October. The expectation is for 110k and we think this data will be an important indicator for the markets ahead of the critical non-farm payrolls change and other labor statistics to be released on Friday. The critical US employment data to be released on Friday is likely to be the most important development of this week. Click here to review our report on this subject.
The big picture from the short term
We maintain our expectation that the long-term trend in digital assets is upward, with the dynamics we often emphasize in our analysis. “Uptober” manifested itself, although it caused concern from time to time, and the data indicating that Trump was leading the race in the critical US presidential elections was the most important catalyst. We interpret the settlement in BTC after testing above the 73,500 level as a pricing that occurs due to the nature of the market, and we will not be surprised if the price can make horizontal and slight retracements at this level for a while.
TECHNICAL ANALYSIS
BTC/USDT
Global markets continue to price in the upcoming US elections and the Fed’s interest rate cut expectations. Shortly before the election, gold reached record highs, while Bitcoin also approached a record. Nasdaq, on the other hand, continues to rise under the leadership of technology companies. As the election atmosphere heats up, we can expect increased volatility in the markets in the coming days.
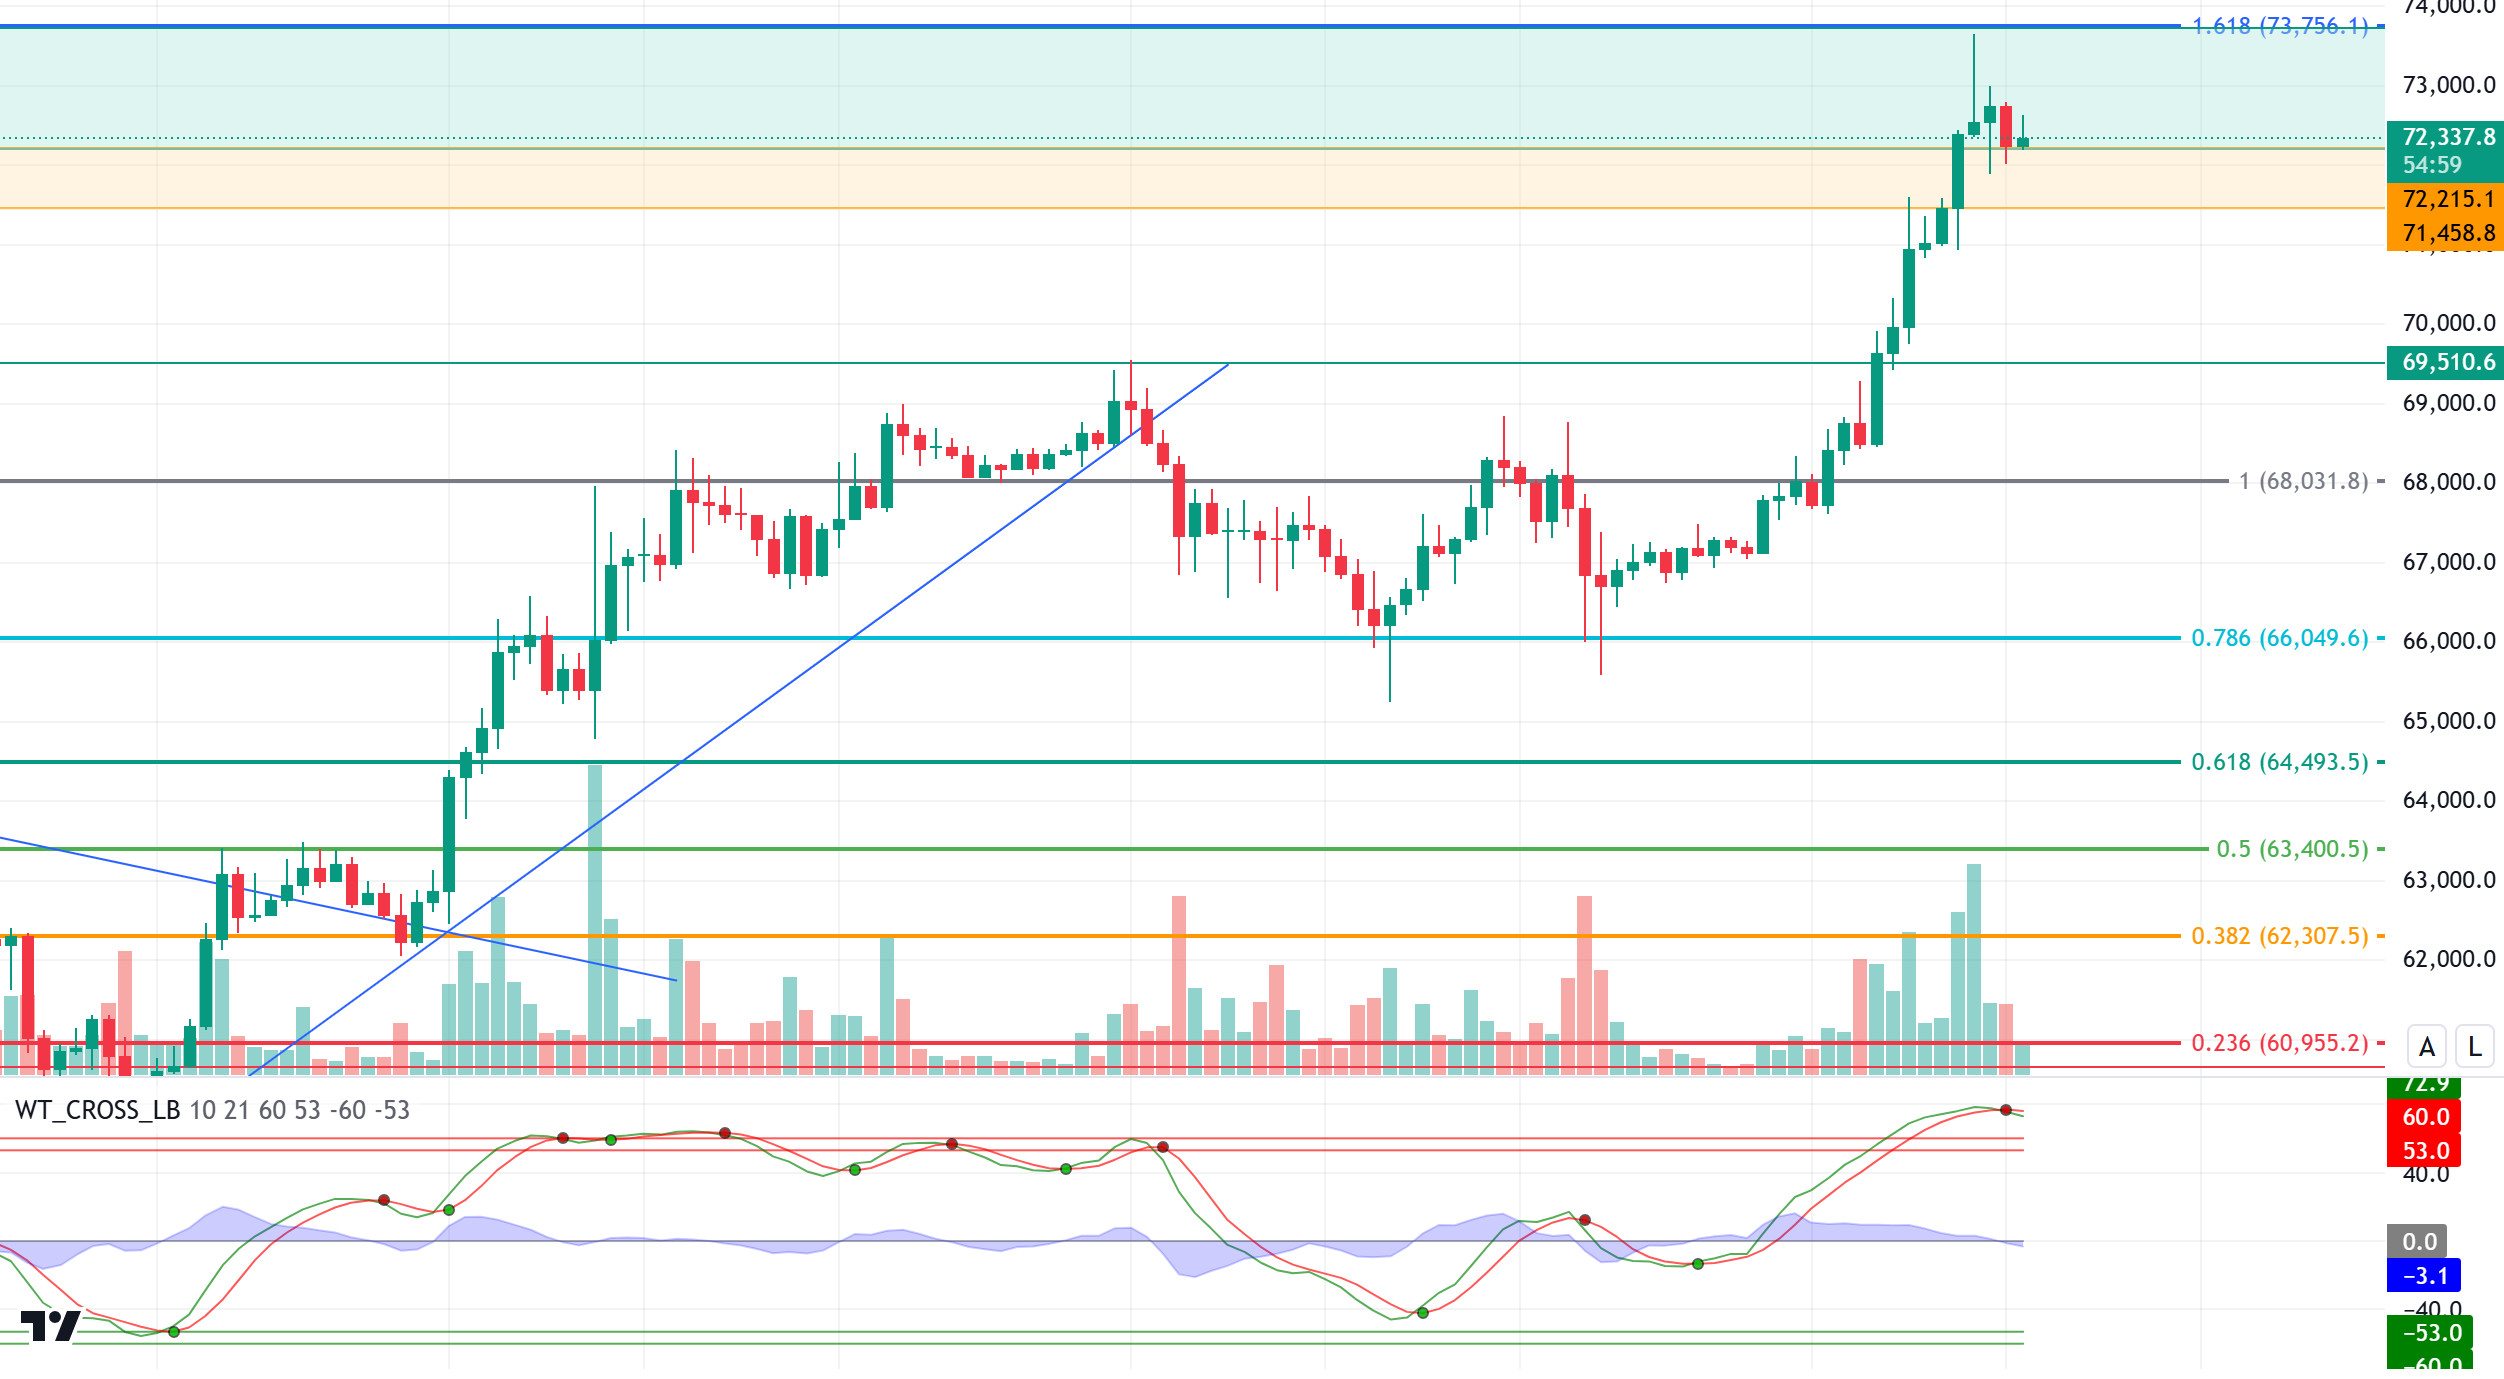
On the BTC technical outlook, the price tested the 73,600 level after breaking the last major resistance level at 71,458. Approaching the previous ATH level of 73,750, BTC is expected to regain momentum to repeat the record. In this process, it may experience a pullback towards the support level of 71,458 for a bullish correction. As a matter of fact, our wave trend oscillator confirms the pullback by generating a sell signal in the overbought zone. With the increasing risk appetite, the last level we will follow in the continuation of bullish movements will be the 73,750 ATH point.
Supports 71,458 – 69,510 – 68,125
Resistances 72,215 – 72,800 – 73,750
ETH/USDT
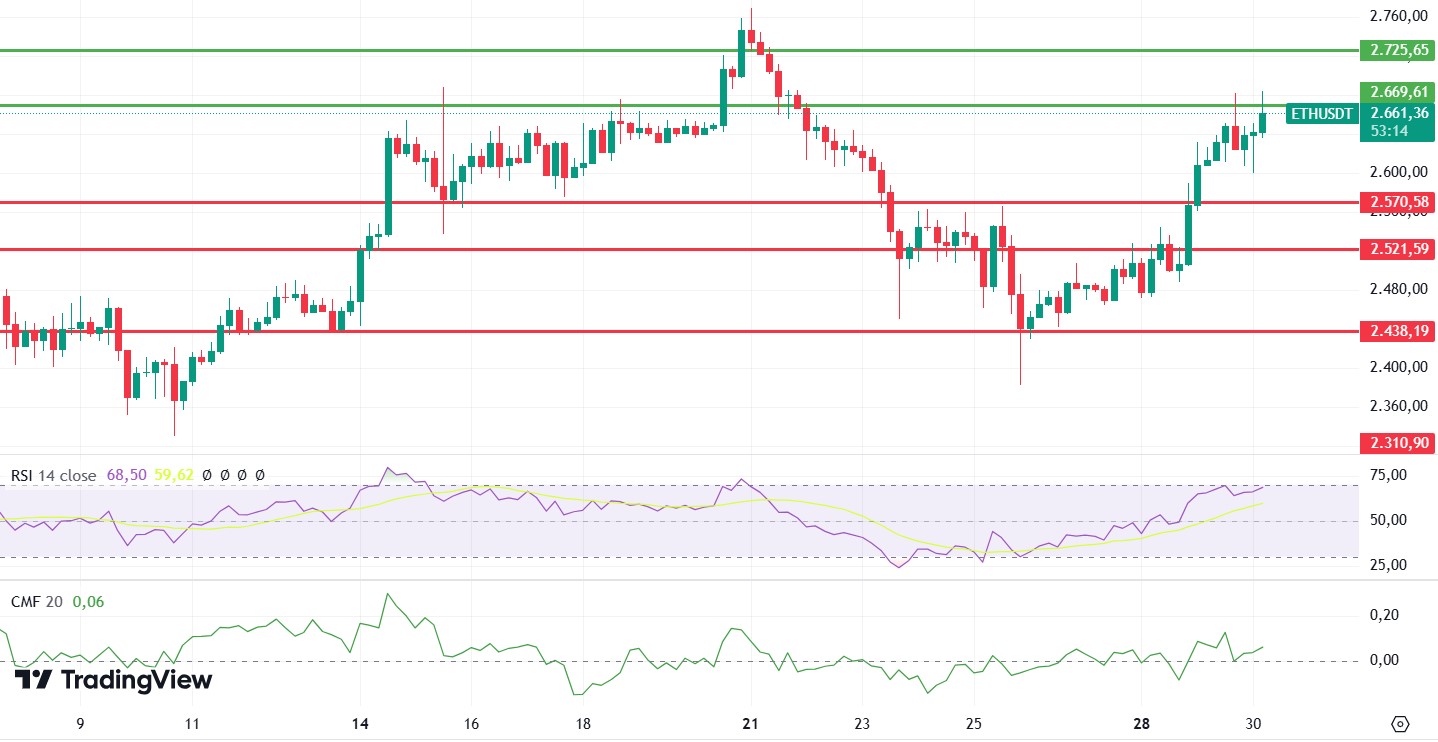
As mentioned in last night’s analysis, with Chaikin Money Flow (CMF) entering the positive area, ETH is having difficulty breaking above 2,669 resistance. Both the rise of the Relative Strength Index (RSI) to overbought levels and the negative outlook on On Balance Volume (OBV) make it likely that there will be some decline in ETH during the day. The 2,571 level is the most important support level, indicating that a break of this level could deepen the declines. Closures above the 2,669 level may disrupt the negative outlook and bring a continuation of the rise. When we look at the Cumulative Volume Delta (CVD), we see that spot-weighted increases were realized. However, the fact that funding rates are positive and open interest data are very high shows that investors should be careful for a while.
Supports 2,571 – 2,521 – 2,438
Resistances 2,669 – 2,725 – 2,792
LINK/USDT
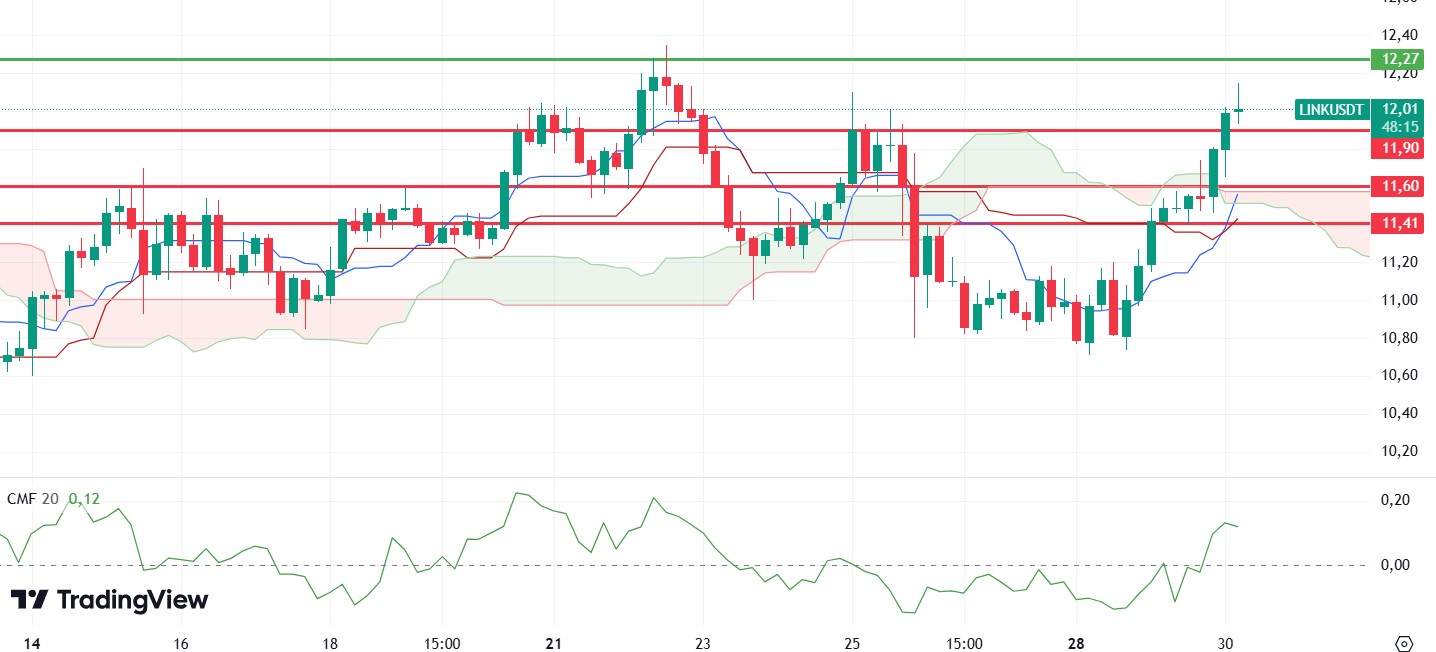
LINK is pricing above the 11.90 level, rising sharply after breaking the 10.60 level, which is one of the very important resistance points and also the upper line of the kumo cloud, with the rise it experienced yesterday. Chaikin Money Flow (CMF) also seems to support the positive outlook on the Ichimoku indicator. However, with the Relative Strength Index (RSI) level approaching the overbought zone, it is important for investors to be cautious. In summary, the rise may continue provided that the 11.90 level is not broken. However, a break of this level may bring declines to 11.60 levels.
Supports 11.90 – 11.60 – 11.41
Resistances 12.27 – 12.98 – 13.77
SOL/USDT
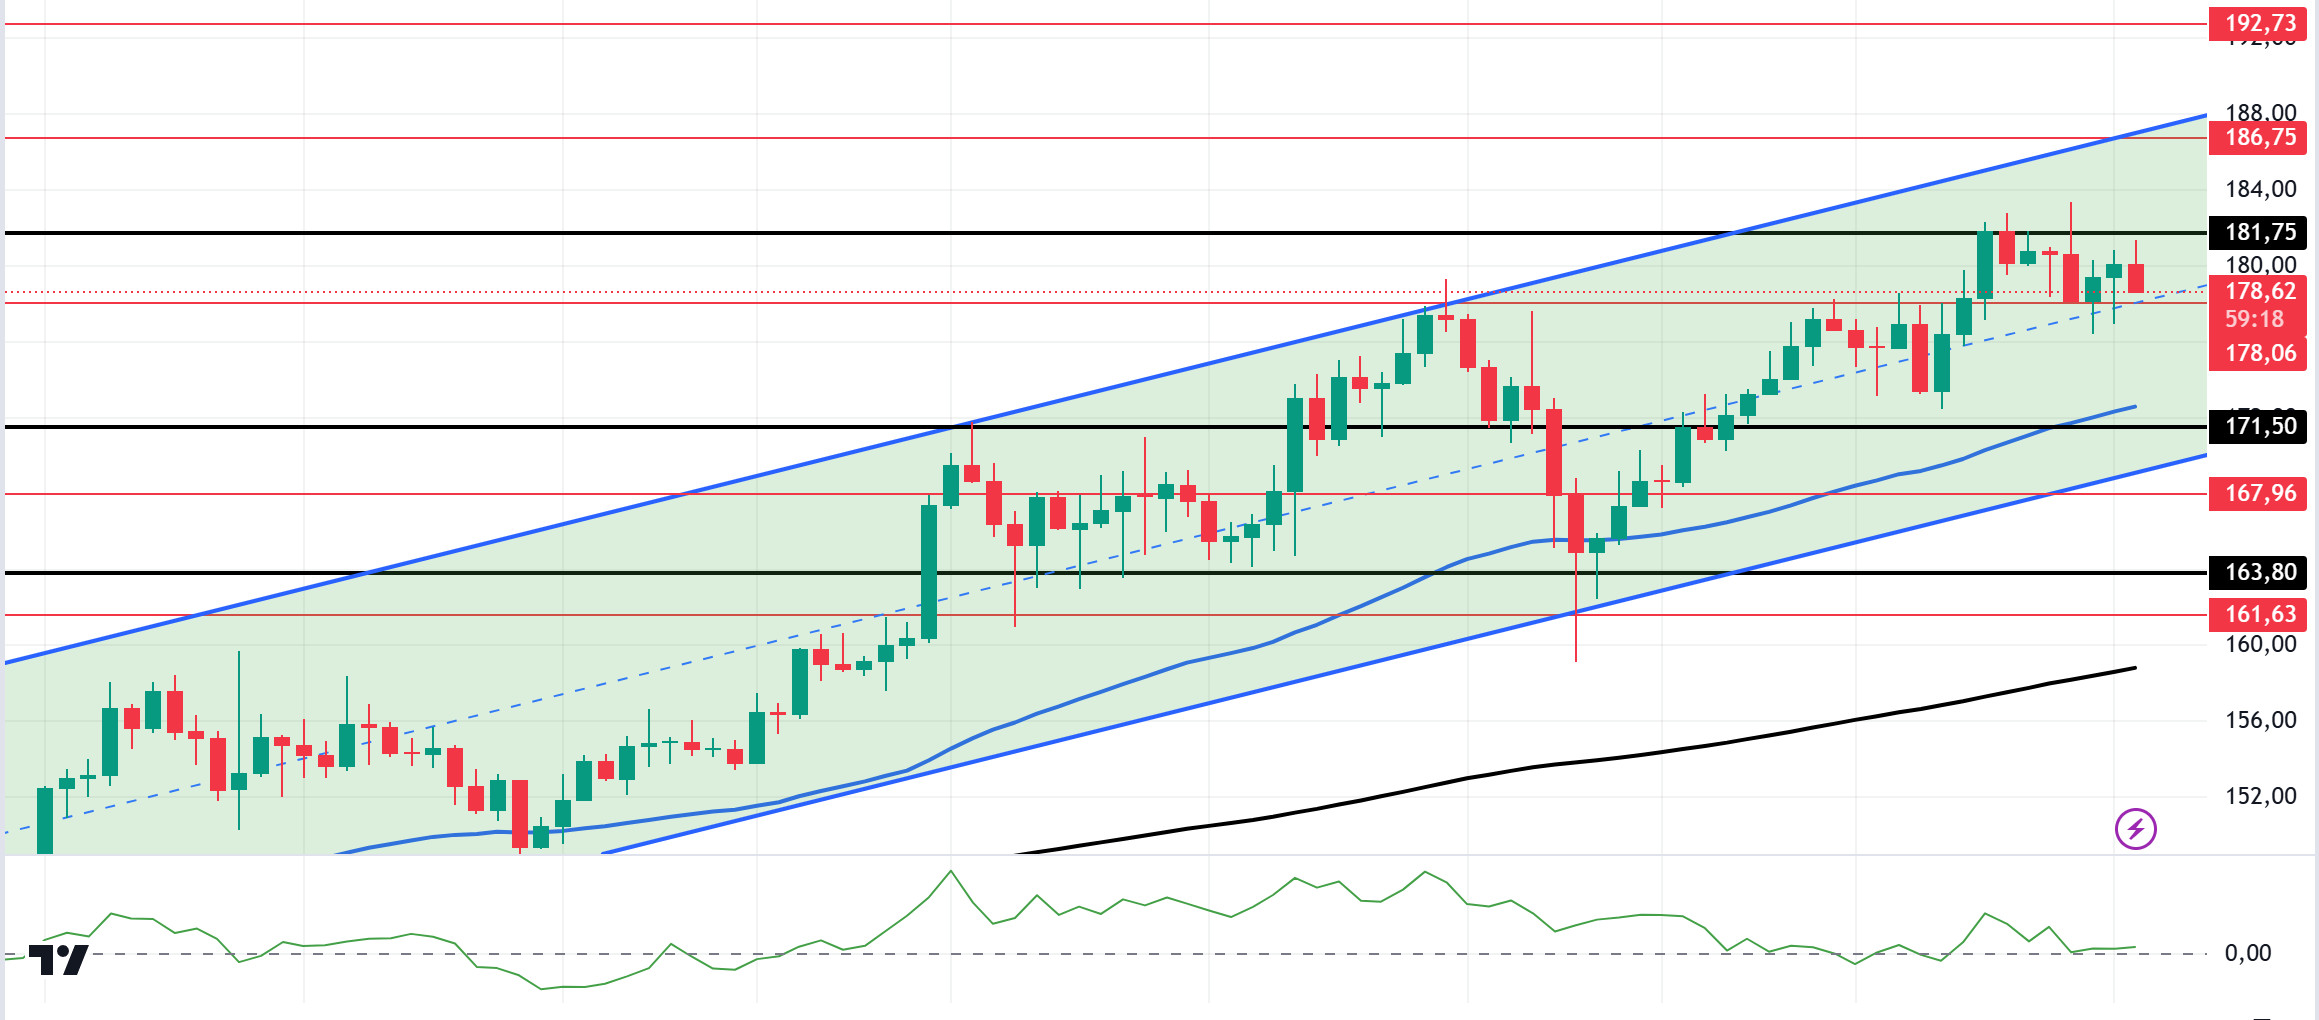
Today, the gross domestic product from the US will be announced. This data may cause fluctuations in price. In the crypto market, Tether (USDT), a stablecoin worth $ 1 billion, was printed. This signaled an influx of cash into the ecosystem. In the Solana ecosystem, there was an increase in the long-to-short ratio. Long positions account for about 52% of all positions. This could be an important data for the expected price rally. The ongoing meme token fury in the ecosystem continues. Solana’s meme coin market reached 12 billion dollars. This has also significantly increased the volume in Solana. SOL, which has been priced horizontally since our analysis in the morning, encountered resistance at the highest level of the last 3 months after a 4-day rise. On the 4-hour timeframe, SOL tested strong resistance at $181.75. The 50 EMA (Blue Line) continues to be above the 200 EMA (Black Line). This means that the uptrend will continue, but the large distance between them may bring possible declines. When we examine the Chaikin Money Flow (CMF)20 indicator, it moves horizontally but remains positive. The 181.75 level stands out as a very strong resistance point in the rises driven by both macroeconomic conditions and innovations in the Solana ecosystem. If it rises above this level, the rise may continue strongly. In case of possible political reasons or profit sales, the support levels of 171.50 and 163.80 may be triggered again. If the price comes to these support levels, a potential bullish opportunity may arise.
Supports 178.06 – 171.50 – 167.96
Resistances 181.75 – 186.75 – 192.73
ADA/USDT
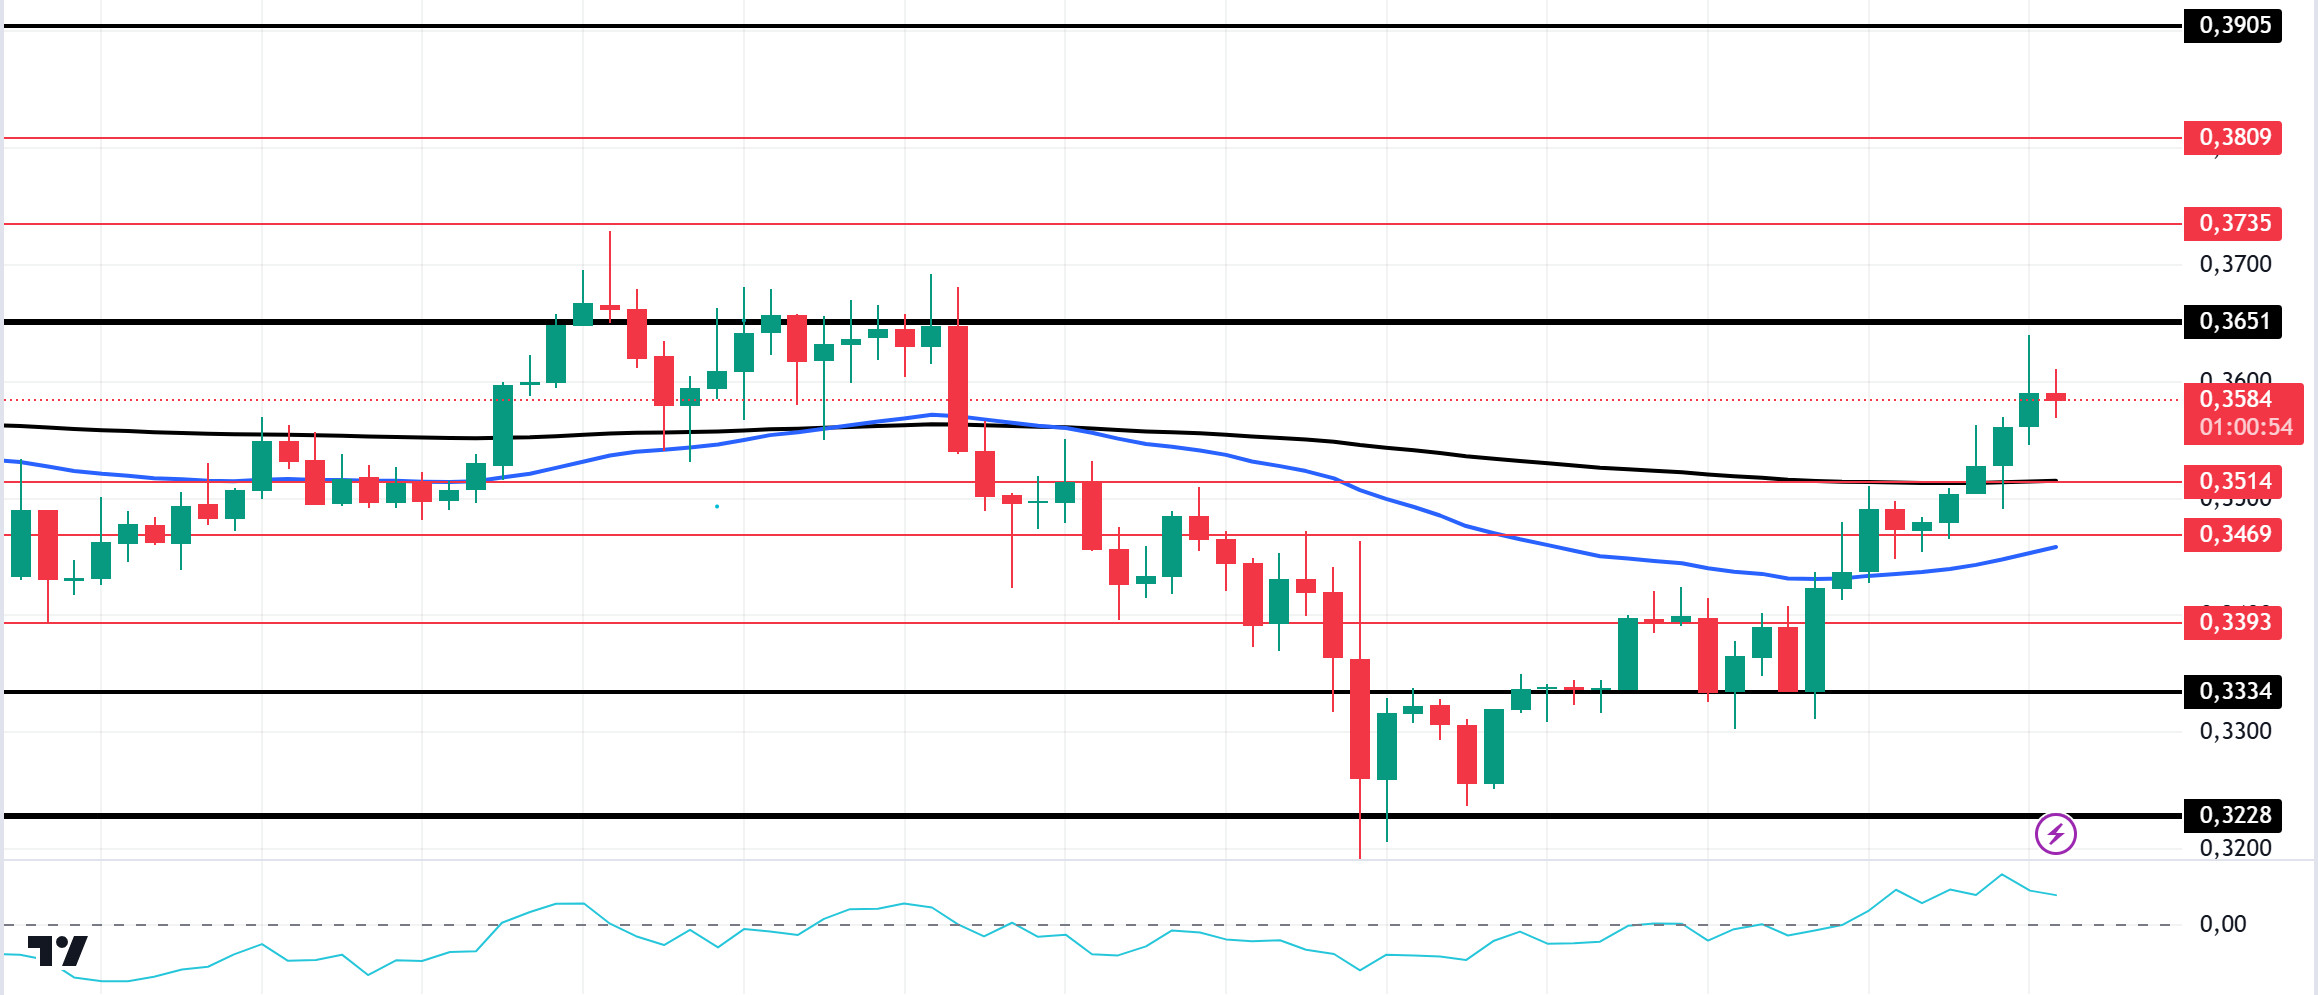
Today, the gross domestic product from the US will be announced. This data may cause fluctuations in price. In the crypto market, Tether (USDT), a stablecoin worth $ 1 billion, was printed. This signaled an influx of cash into the ecosystem. Founder Charles Hoskinson announced that Cardano will now be positioned as a Bitcoin Layer 2 solution. This new strategy means that Cardano will focus on making Bitcoin more functional, aiming to complement its current shortcomings. With this move, Cardano aims to increase Bitcoin’s potential by adding speed and new features. In the Cardano ecosystem, Phase 1 of the Cardano Chang Hard Fork went live weeks ago and EMURGO announced the 5 updates to watch for Phase 2. It will offer 5 important enhancements to increase the quest for decentralization. These are delegate representative (DRep) voting, SPO (Share Pool Operator) voting, governance actions, treasury withdrawals and an expanded constitutional committee. According to DefiLlama data, Total Value Locked (TVL) currently stands at $225.48 million, marking an increase of 1.58% in the last 24 hours. This represents a gradual increase in network usage and adoption of Cardano. Increased activity on the blockchain could contribute to upward price momentum, especially if the broader cryptocurrency market turns bullish in the coming weeks. Data from Coinglass also showed a significant increase in ADA’s trading volume, futures open interest and options activity. ADA’s futures trading volume increased by 184.18% to $7.33 billion. Technically, ADA is currently at a critical juncture and the price is showing signs of a potential breakout. The price continues to accelerate, increasing by 3.83% in the last 24 hours. On the 4-hour chart, the price has broken the 50 EMA (Blue Line) and 200 EMA (Black Line) to the upside. However, the 50 EMA is below the 200 EMA. This suggests that the trend is bearish. At the same time, ADA price is currently stuck in a three-month range after testing resistance twice and support three times. The Chaikin Money Flow (CMF)20 indicator is also positive, but inflows seem to have decreased. However, ADA may test the 0.3651 level once again. In the event of a decline due to the macroeconomic data and negativity in the ecosystem, it may test the support level of 0.3334 once again. It may be appropriate to buy when it reaches this price level. In the rises due to developments in the ecosystem, if the 0.3651 level is broken in volume, the upward acceleration will increase even more and the 0.3905 level should be followed as a retracement place.
Supports 0.3514 – 0.3469 – 0.3393
Resistances 0.3651 – 0.3735 – 0.3809
AVAX/USDT
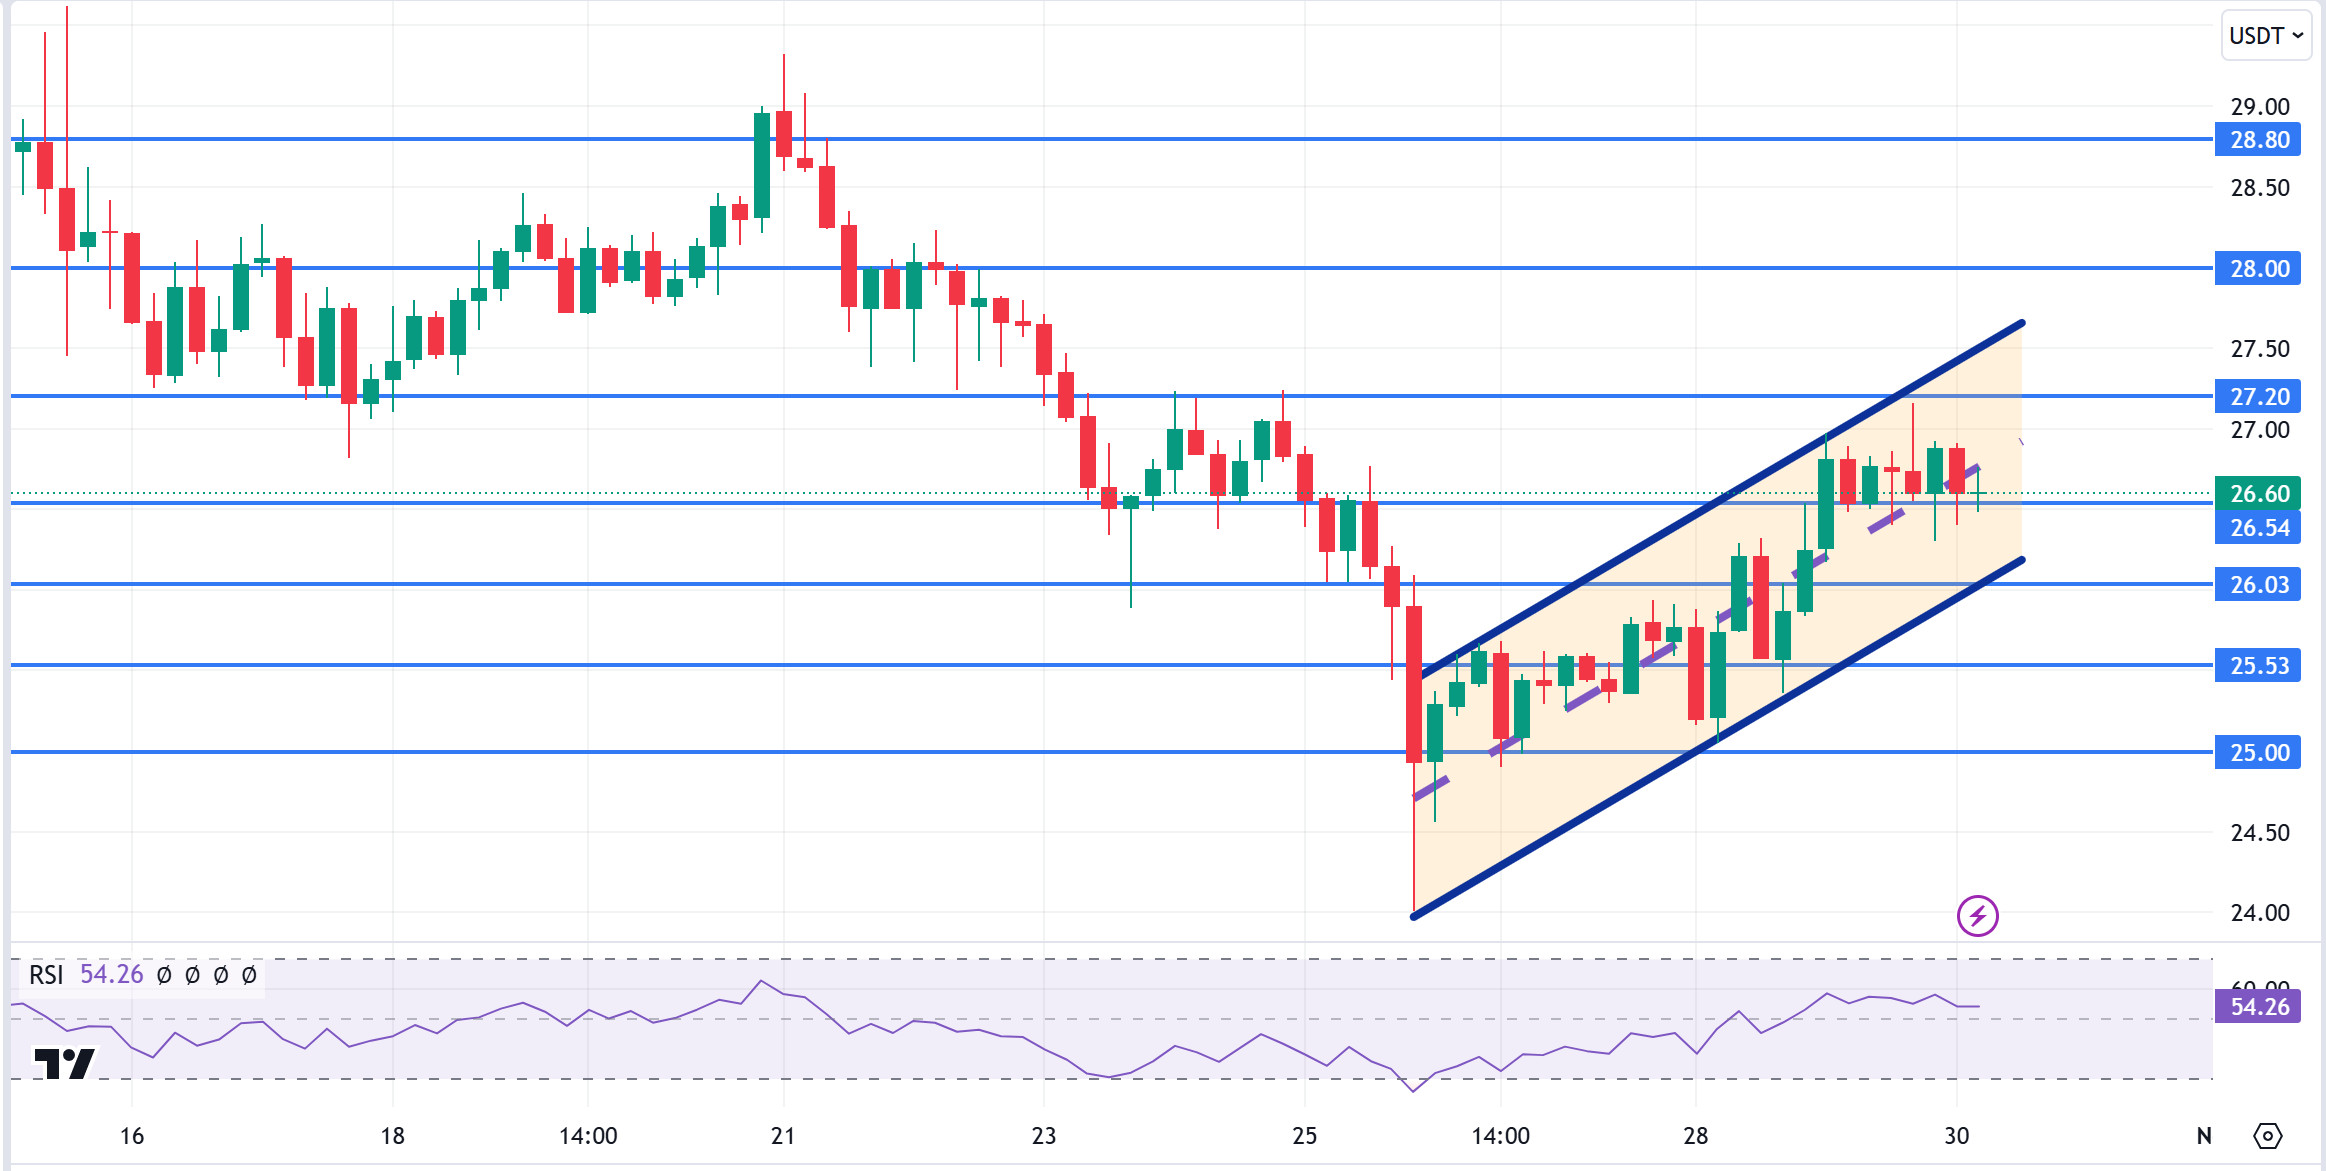
AVAX, which opened yesterday at 26.26, rose by about 2.5% during the day and closed the day at 26.88. Today, gross domestic product data will be released by the US. News flows from the Middle East will be important for the market.AVAX, currently trading at 26.60, is moving within the bullish channel on the 4-hour chart. It is in the middle band of the bullish channel and with a Relative Strength Index value of 54, some decline can be expected from these levels. In such a case, it may test 26.03 support. On the other hand, if today’s data has a positive impact or news that the tension in the Middle East is over, purchases may increase. In such a case, it may test the 27.20 resistance. As long as it stays above 25.00 support during the day, the desire to rise may continue. With the break of 25.00 support, sales may increase
Supports 26.54 – 26.03 – 25.53
Resistances 27.20 – 28.00 – 28.80
TRX/USDT
TRX, which started yesterday at 0.1642, rose about 1.5% during the day after Justin Sun’s post “Big news about to be announced on Tron” and closed the day at 0.1663. Today, gross domestic product is an important data that the market will follow. Volatility in the market may increase during the release of this data. The market will also be closely following the news flows regarding the tension in the Middle East.
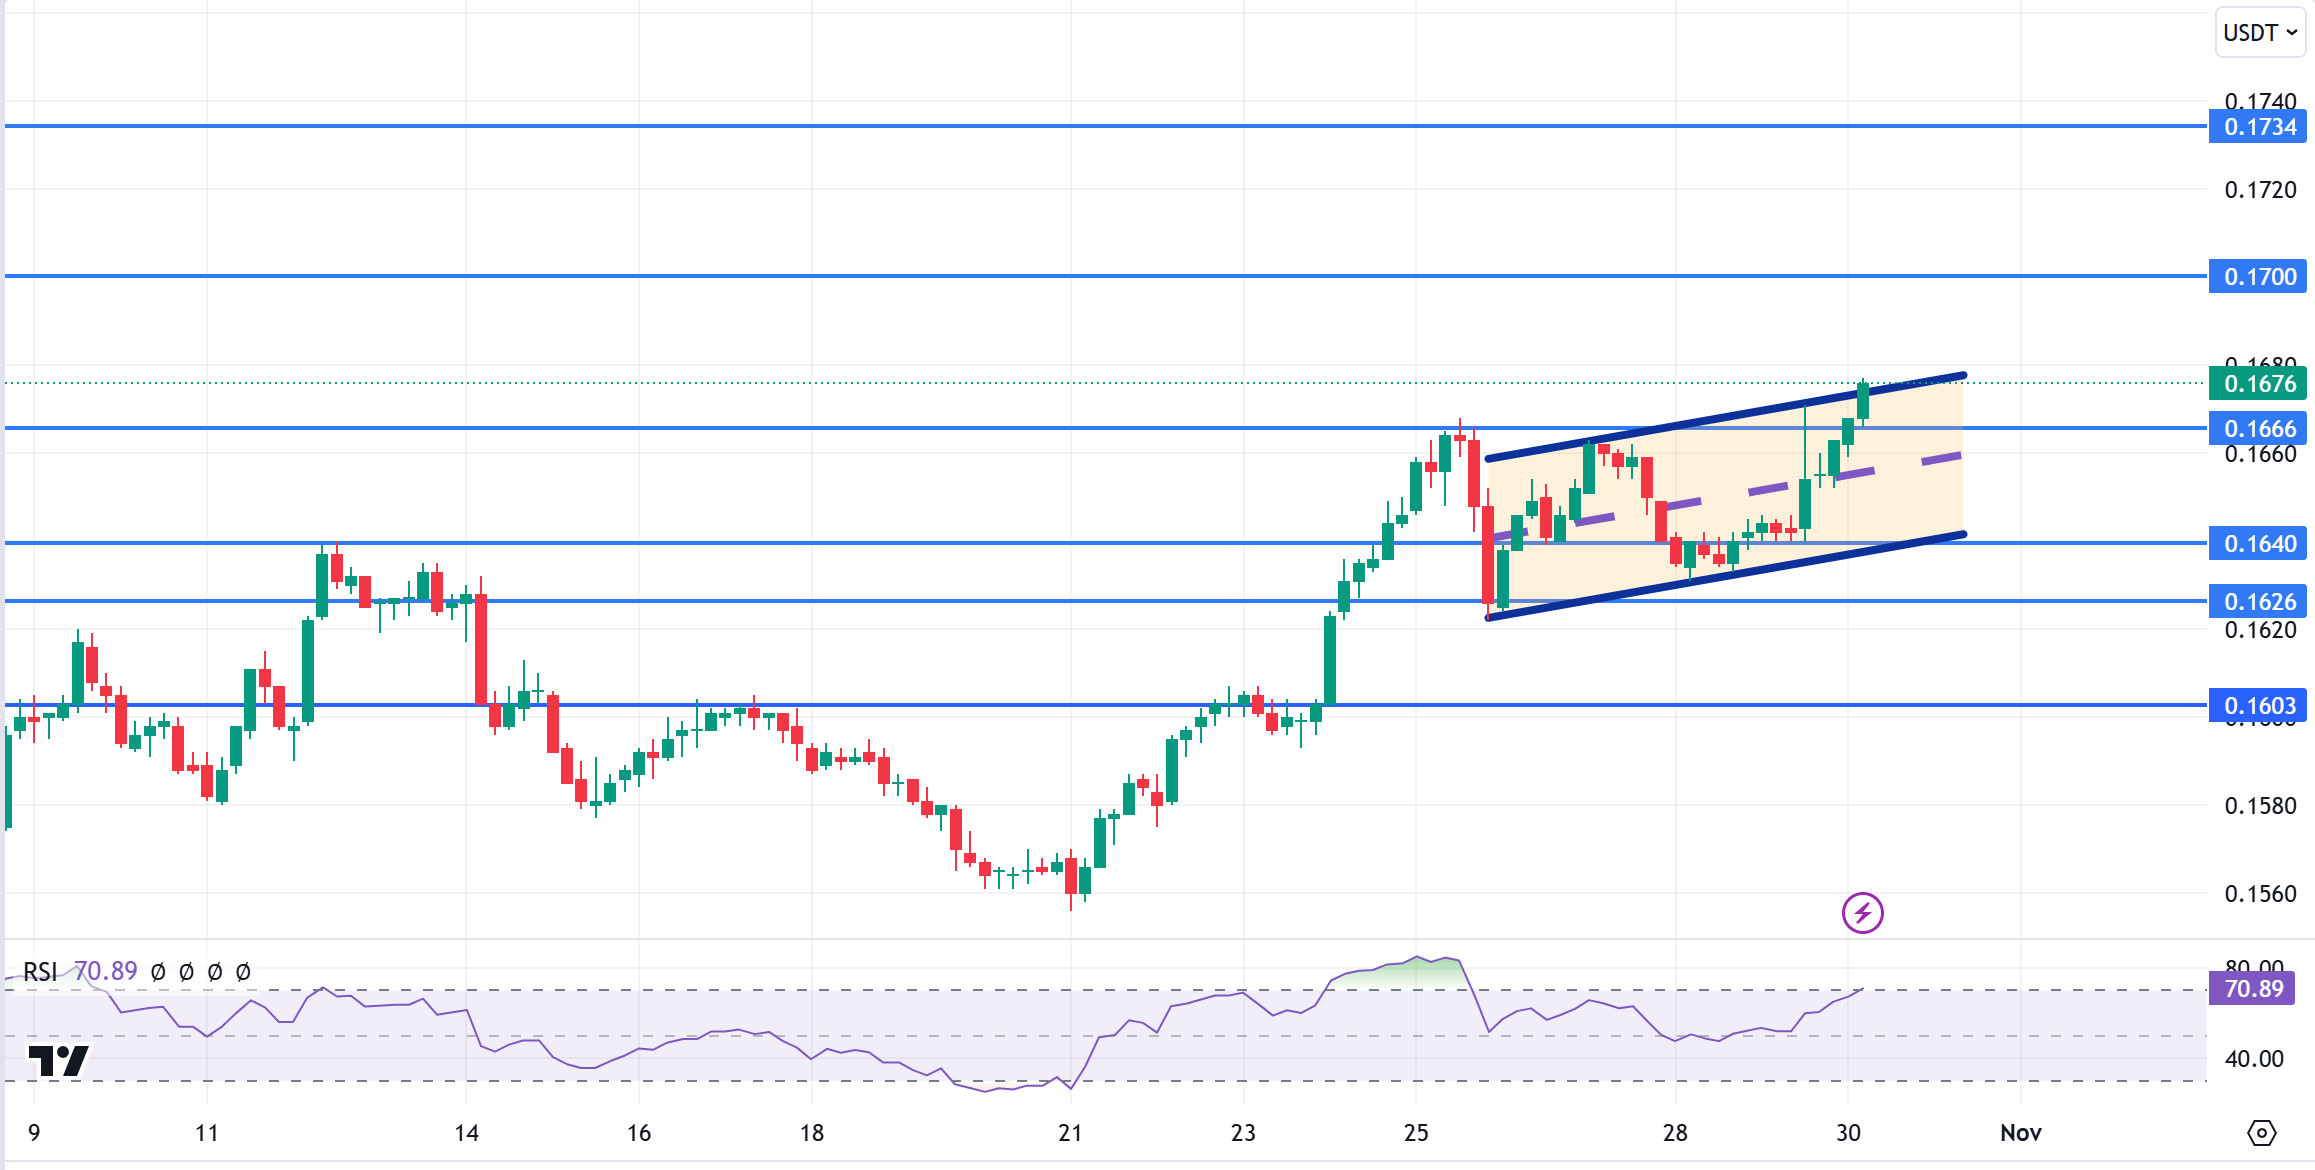
TRX, currently trading at 0.1673, is in the upper band of the bullish channel on the 4-hour chart. The Relative Strength Index value is 70 and is in overbought territory. Although it has the possibility of moving up during the day with the big news that Justin Sun stated in his post, it can be expected to make some decline from its current level. In such a case, it may move to the middle and lower band of the channel and test the 0.1666 and 0.1640 supports. However, it cannot close the candle below 0.1640 support and may test 0.1700 resistance with the buying reaction that will occur if the news to be announced makes a big impact. As long as TRX stays above 0.1482 support, the desire to rise may continue. If this support is broken downwards, sales can be expected to increase.
Supports 0.1666 – 0.1640 – 0.1626
Resistances 0.1700 – 0.1734 – 0.1779
DOT/USDT
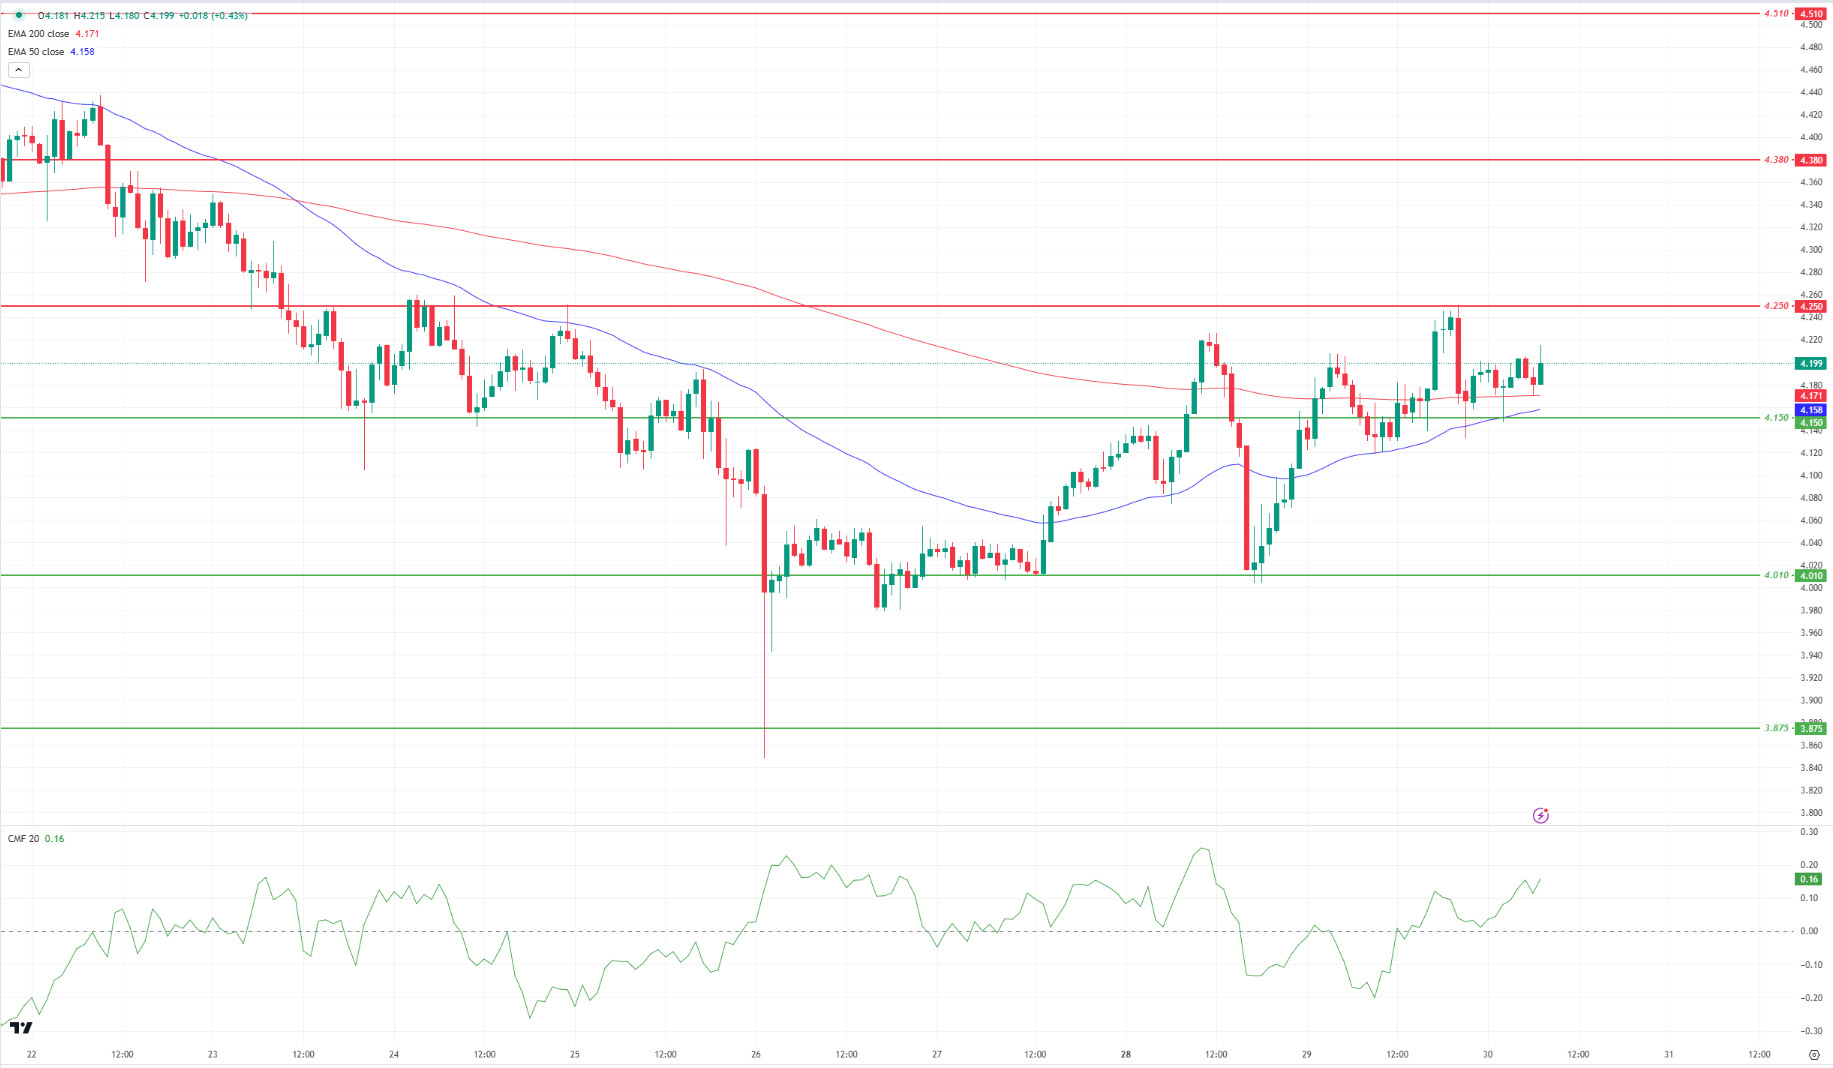
Polkadot (DOT) failed to break the selling pressure at 4,250. Having received support at 4.150, DOT is testing the selling pressure at 4.250. EMA50 (Blue Line) is preparing to break EMA200 (Red Line) upwards. Buyer pressure remains strong according to the Chaikin Money Flow (CMF) oscillator. In this context, the price may break the selling pressure at 4,250 and rally towards 4,380. On the other hand, if the selling pressure cannot be broken, if the price cannot hold above 4,150, retracements towards 4,010 support levels may be observed.
Supports 4,150 – 4,010 – 3,875
Resistances 4.250 – 4.380 – 4.510
SHIB/USDT
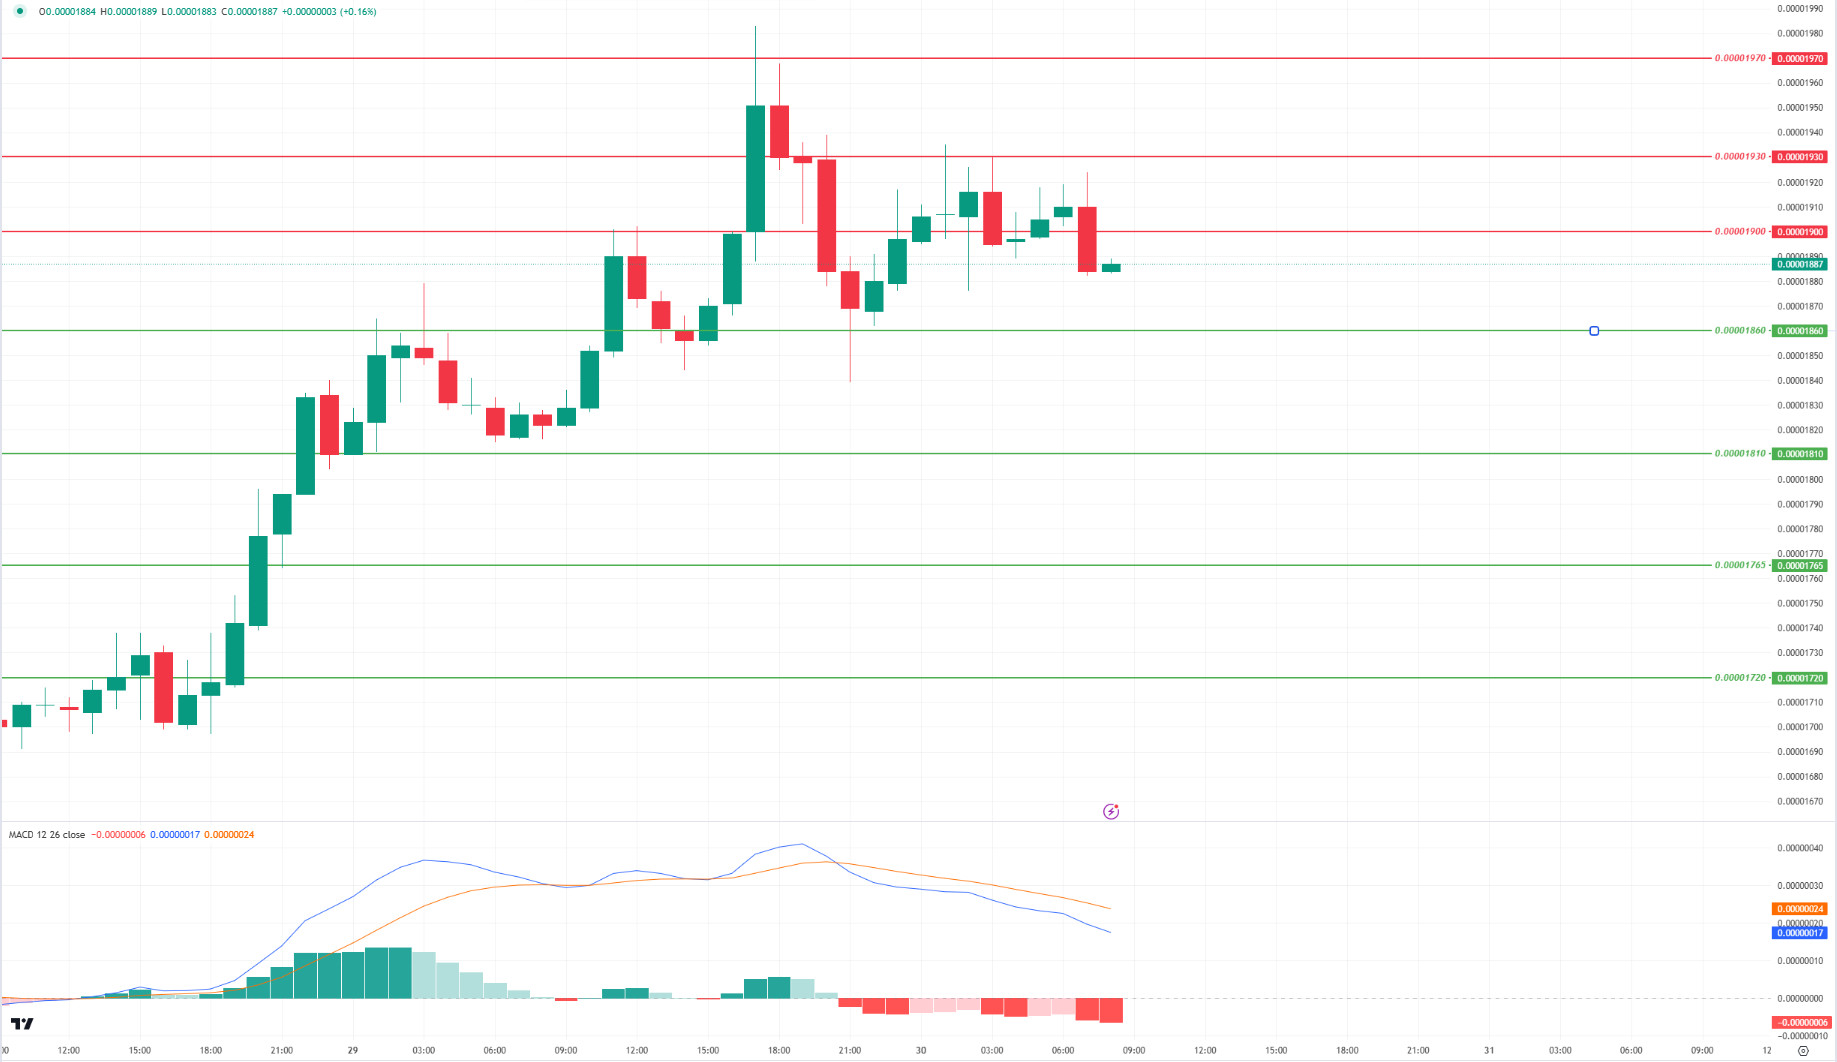
Shiba Inu (SHIB) was rejected from 0.00001970 resistance. SHIB, which was rejected at 0.00001970 with increasing selling pressure, continues to correct. When we examine the MACD oscillator, we can say that the selling pressure increased compared to the previous hour. In this context, we can expect the price to retreat to the 0.00001860 support level. On the other hand, if the buyer pressure increases, if the price persists above 0.00001900 with the realized burn rates, it may want to break the selling pressure at the 0.00001970 level again.
Supports 0.00001860 – 0.00001810 – 0.00001765
Resistances 0.00001900 – 0.00001930 – 0.00001970
LEGAL NOTICE
The investment information, comments and recommendations contained herein do not constitute investment advice. Investment advisory services are provided individually by authorized institutions taking into account the risk and return preferences of individuals. The comments and recommendations contained herein are of a general nature. These recommendations may not be suitable for your financial situation and risk and return preferences. Therefore, making an investment decision based solely on the information contained herein may not produce results in line with your expectations.

