
MARKET SUMMARY
Latest Situation in Crypto Assets
| Assets | Last Price | 24h Change | Dominance | Market Cap. |
|---|---|---|---|---|
| BTC | 72,246.00 | -0.14% | 59.00% | 1.43 T |
| ETH | 2,635.00 | -0.94% | 13.10% | 317.23 B |
| SOLANA | 173.72 | -2.77% | 3.37% | 81.63 B |
| XRP | 0.5172 | -1.25% | 1.21% | 29.38 B |
| DOGE | 0.1721 | -1.31% | 1.04% | 25.16 B |
| TRX | 0.1695 | 1.15% | 0.61% | 14.65 B |
| CARDANO | 0.3547 | -0.99% | 0.51% | 12.41 B |
| AVAX | 25.83 | -2.76% | 0.43% | 10.51 B |
| SHIB | 0.00001850 | -2.25% | 0.45% | 10.90 B |
| LINK | 12.11 | 1.00% | 0.31% | 7.60 B |
| DOT | 4.136 | -1.62% | 0.26% | 6.26 B |
*Prepared on 10.31.2024 at 06:00 (UTC)
WHAT’S LEFT BEHIND
MicroStrategy More Bitcoin Steps
MicroStrategy aims to raise $42 billion for Bitcoin purchases over the next three years. The company’s Bitcoin holdings reached 252,220 BTC, worth approximately $18.19 billion. The company, led by Michael Saylor, is pursuing a long-term value retention strategy with Bitcoin.
Canary Capital Makes Formal Application to SEC for Spot Solana ETF
Canary has filed with the SEC for its spot Solana ETF, officially launching the IPO process in the US. The ETF aims to allow investors to profit without directly owning Solana. The filing confirms the growing interest in cryptocurrency-based ETFs in the US.
BlackRock’s spot bitcoin ETF
BlackRock’s iShares Bitcoin Trust, the largest spot bitcoin exchange-traded fund by net assets in the US, recorded net inflows of over $872 million on Wednesday. This marks the largest inflow since the fund’s launch in January and surpassed the record high on March 12.
US government swaps Aragon’s ANT tokens for ETH
The US government has sold tokens seized from Sam Bankman-Fried’s defunct hedge fund Alameda Research, according to Arkham Research. The wallet, which holds about $974,000 worth of cryptocurrency, experienced movement in its wallet for the first time in nearly two years.
HIGHLIGHTS OF THE DAY
Important Economic Calender Data
| Time | News | Expectation | Previous |
|---|---|---|---|
| Optimism (OP) – Dev Tooling Program | |||
| Optimism (OP) – 31.34MM Token Unlock | |||
| Aleph Zero – 520M Max Supply and Inflation Changes Hit the Testnet | |||
| Flare (FLR) – Monthly Burn | |||
| Polkadot (DOT) – Polkadot Event | |||
| 12:30 | US Core PCE Price Index (MoM) (Sep) | 0.3% | 0.1% |
| 12:30 | US Core PCE Price Index (YoY) (Sep) | 2.6% | 2.7% |
| 12:30 | Employment Cost Index (q/q) | 0.9% | 0.9% |
| 12:30 | US Initial Jobless Claims | 229K | 227K |
| 13:45 | US Chicago PMI (Oct) | 46.9 | 46.6 |
INFORMATION
*The calendar is based on UTC (Coordinated Universal Time) time zone.
The economic calendar content on the relevant page is obtained from reliable news and data providers. The news in the economic calendar content, the date and time of the announcement of the news, possible changes in the previous, expectations and announced figures are made by the data provider institutions. Darkex cannot be held responsible for possible changes that may arise from similar situations.
MARKET COMPASS
In global markets, stock market indices declined on the back of the latest big corporate balance sheets, the dollar index and US Treasury bond yields held their recent gains, and gold and Bitcoin hovered near record highs. The rise in the crypto world, dominated by the expectation that Trump is leading the presidential election race, was also supported by data pointing to increased interest from institutional investors through ETFs. Markets are also wondering whether monetary policy will remain supportive of risky assets. For this reason, US data that may provide information about the US Federal Reserve’s (FED) interest rate change course remains under close scrutiny. Following yesterday’s employment and growth data, today’s PCE data, which the FED considers to monitor inflation, will be noteworthy. We think that PCE price index is as important as employment data.
Source: Darkex Research Team, Data Geeek
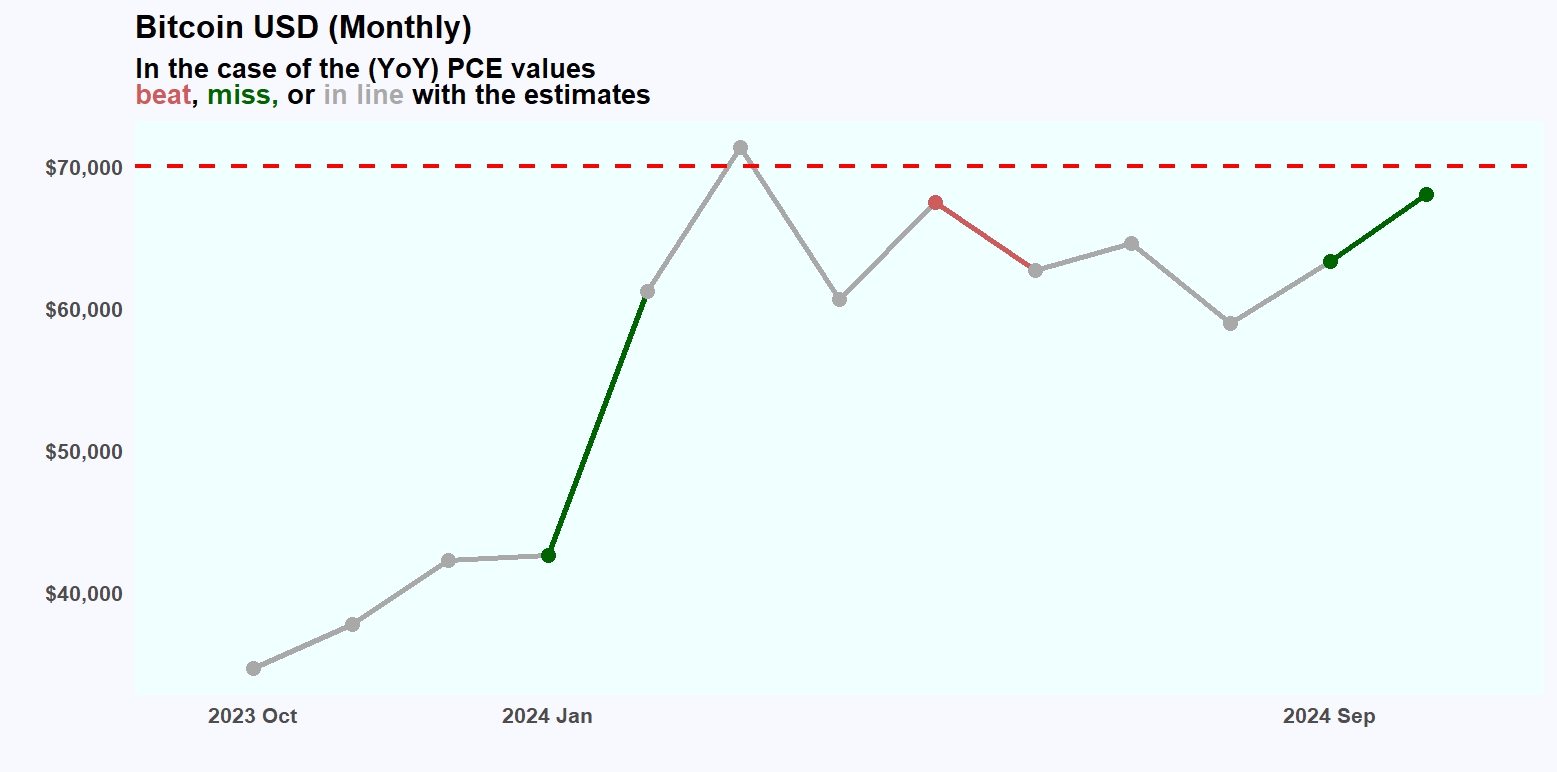
According to the statistical study conducted by Darkex Research Department, we believe that changes in PCE values (annualized) may positively affect Bitcoin prices, regardless of their distance from market expectations. In September, the PCE price index is expected to have realized at 2.6% compared to the same month of the previous year. On a monthly basis, the rise is estimated to have been realized at 0.3%. After this data set, critical employment indicators will be closely monitored by investors tomorrow. US critical employment data to be released on Friday seems to be the most important development of this week.
Click here to review our report on this subject.
The big picture from the short term
Bitcoin continues to hold on to its recent gains, near its record high. The largest cryptocurrency’s dominance is back above 60%. While we remain bullish for the long term, we do not rule out the possibility of a sideways pullback for the short term. Considering the pace of recent gains and the importance of the US employment data to be released tomorrow, we may see a sideways price change.
TECHNICAL ANALYSIS
BTC/USDT
In Bitcoin, which we expect to prepare for a correction, another good news came from MicroStrategy last night. MicroStrategy announced that it aims to raise $42 billion in funds for Bitcoin purchases over the next three years. If Microstrategy is successful in its $42 billion fundraising goal, this could mean that they will buy an average of $1.16 billion worth of Bitcoin per month. For comparison, the total net inflow into Bitcoin ETFs so far is $23.3 billion, which gives us a long-term message about where the market is headed.
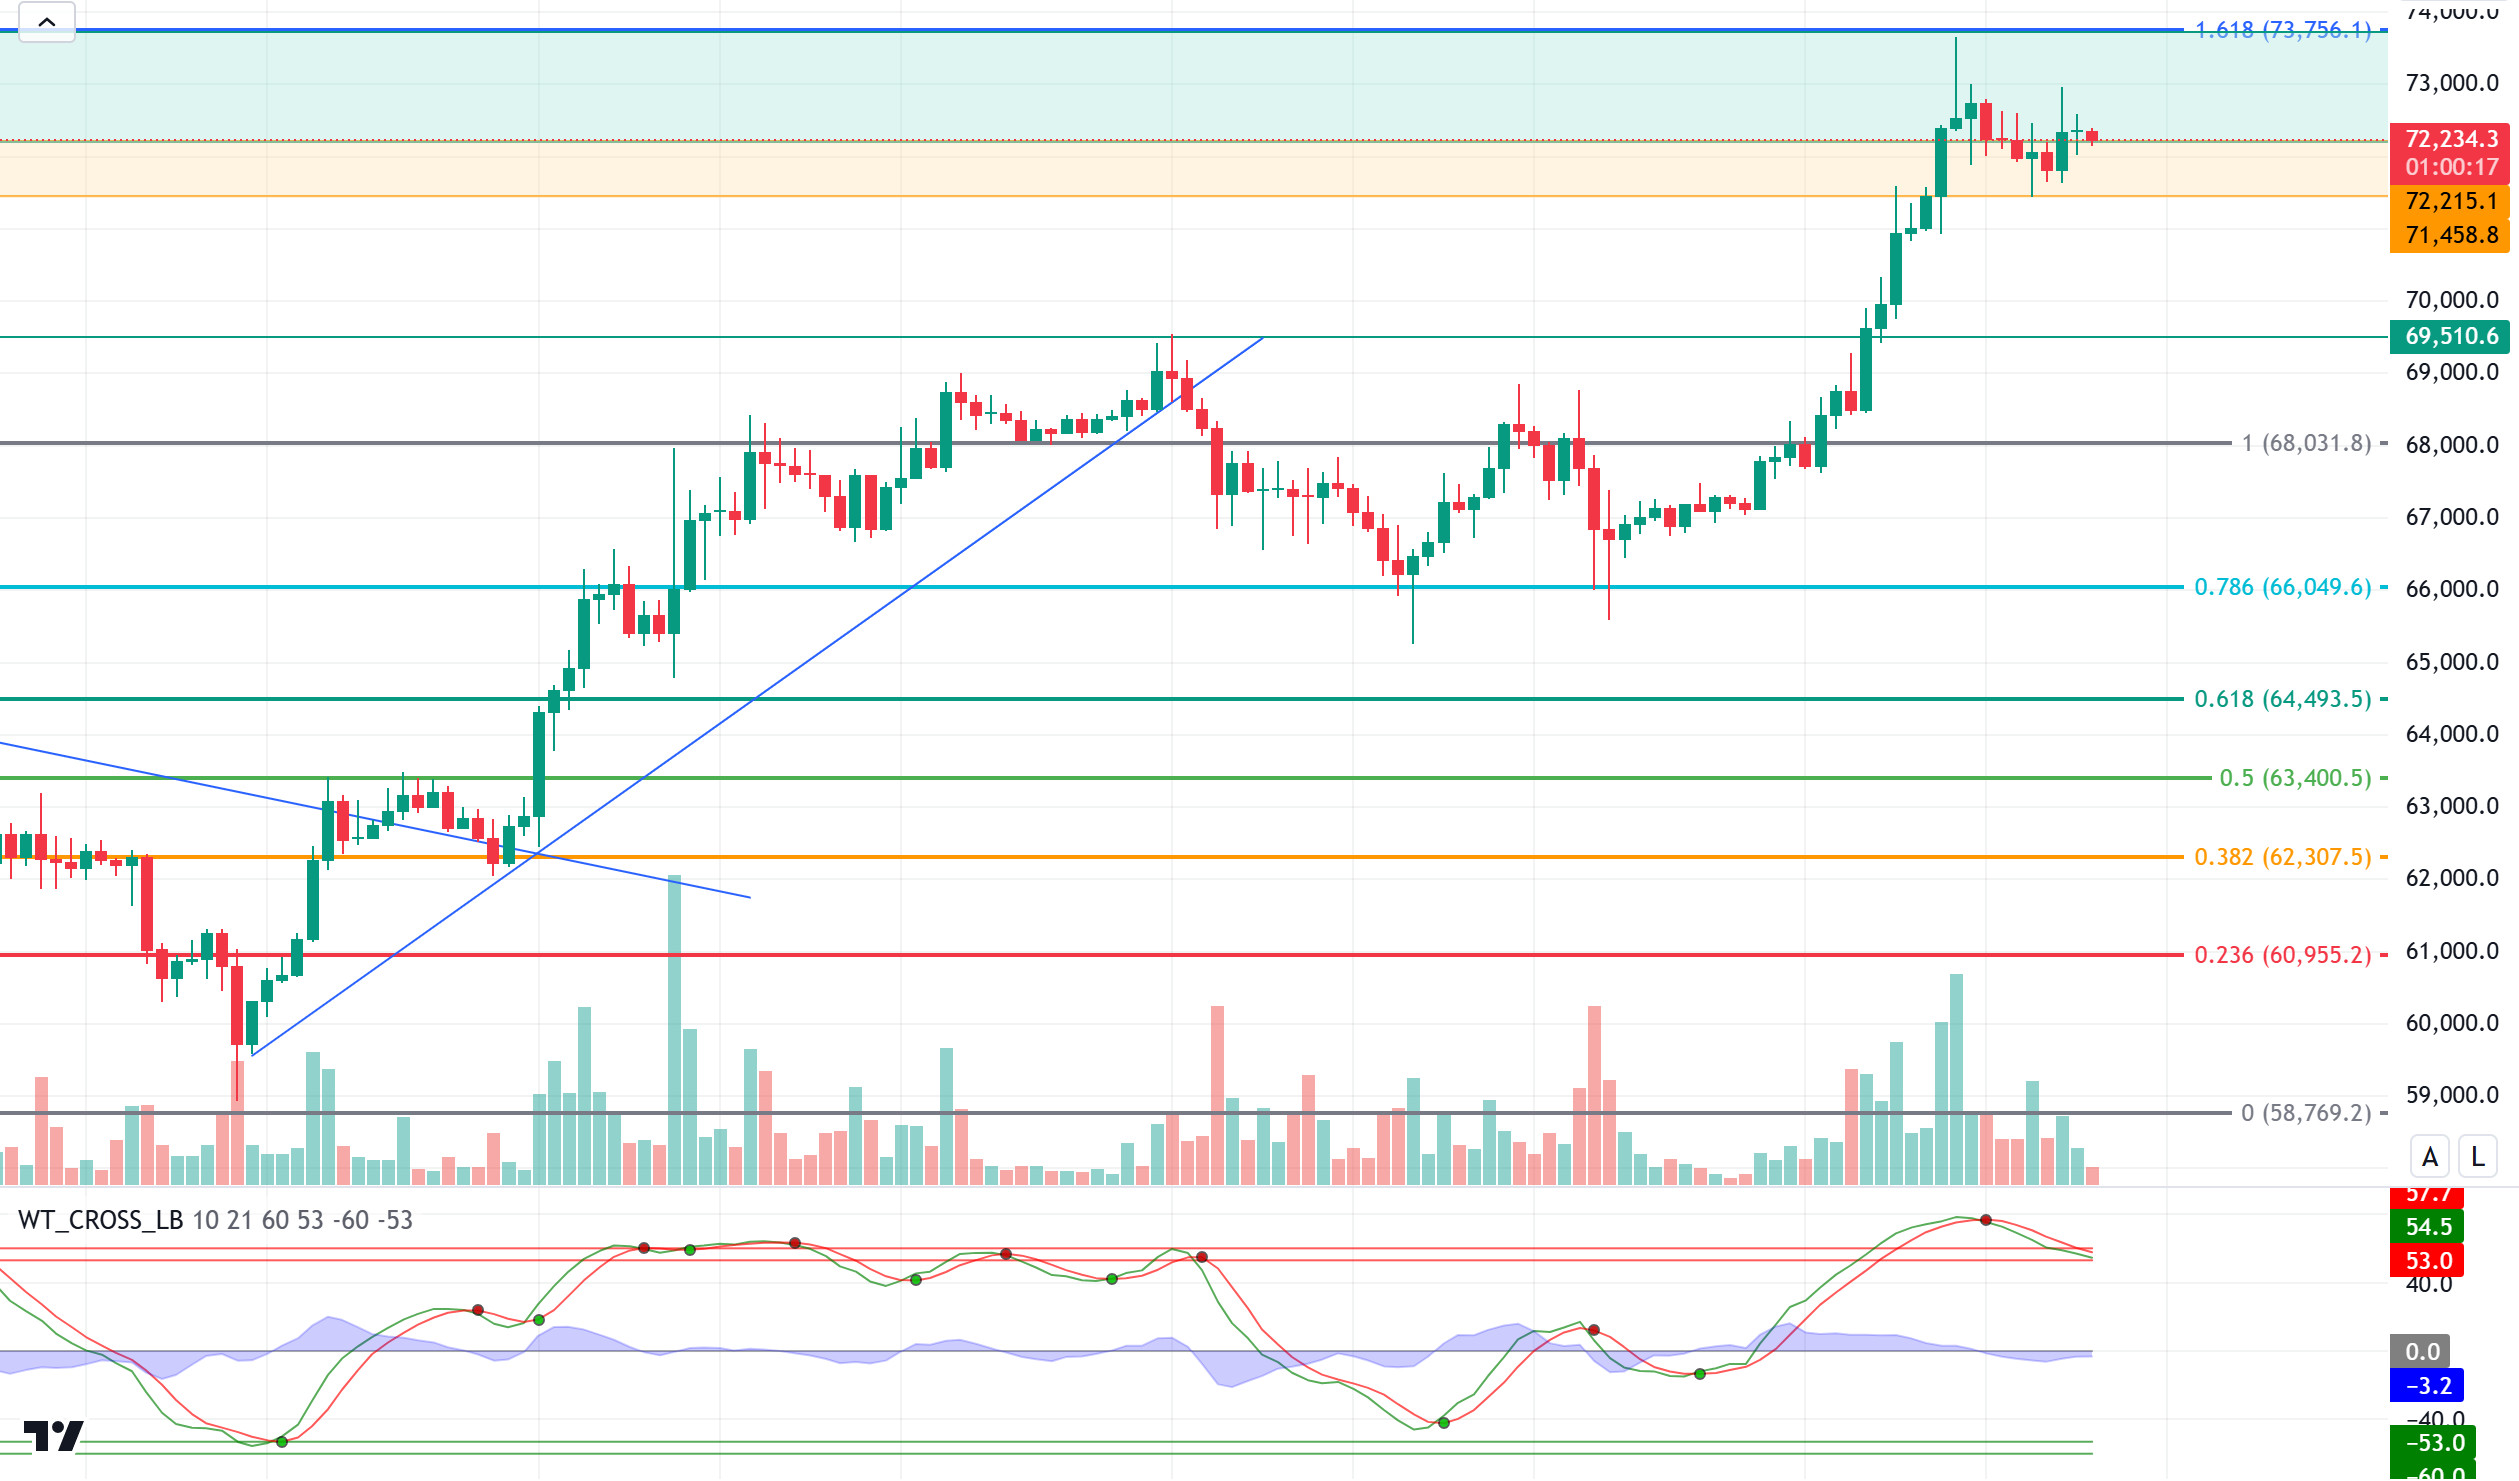
On the BTC technical outlook chart, we saw that the price was hovering around 71,700 before the news was announced, then turned upwards to 72,900. In BTC, where we expect a correction, the impact of the news continues to keep the price strongly above the minor support level of 72,215. Persistence above this level may allow the price to gain upward momentum and can be expected to target the ATH level of 73,750 again. However, it should be noted that technical indicators maintain the sell signal and the price may retest the 71,458 support level in the continuation of the correction movement as the impact of the news fades.
Supports 72,215 – 71,458 – 69,510
Resistances 72,800 – 73,750 – 83,018
ETH/USDT
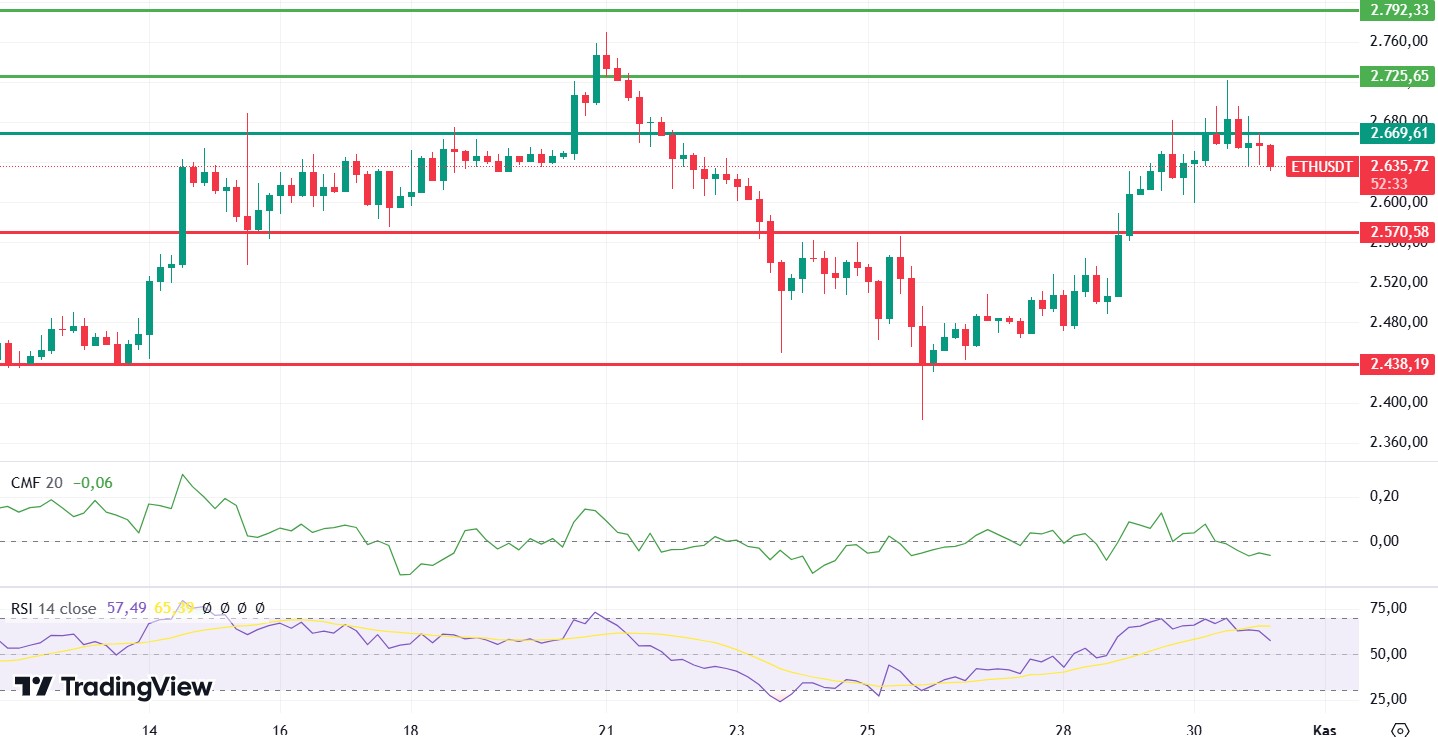
ETH rose as high as 2,725 yesterday, as expected. However, with a negative divergence on the Relative Strength Index (RSI), it reacted from this level and fell back below 2.669. This correction can be expected to continue for some more time during the day. The reasons could be the negative outlook on the Chaikin Money Flow (CMF) and the negative outlook on the RSI. Looking at the Cumulative Volume Delta (CVD), it is seen that the correction came from the futures side. While open interest fell slightly, the funding rate coming to extremely low levels can be seen as positive. In summary, 2,571 is the main support level, but breaks below this level may cause the decline to deepen. Closes above 2,669 may start an attack to 2,725 again.
Supports 2,571 – 2,438 – 2,310
Resistances 2,669 – 2,725 – 2,792
LINK/USDT
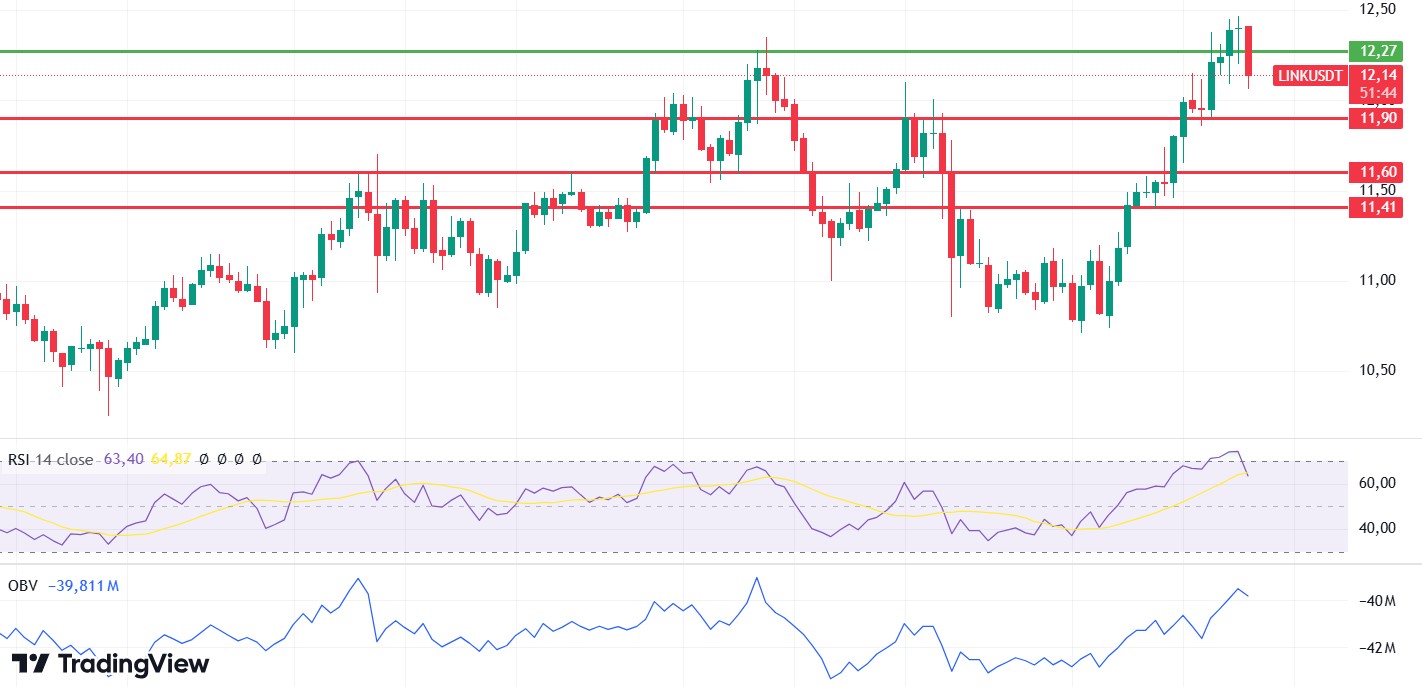
Although LINK exceeded the 12.27 level, it could not maintain above this level with the general correction movement in the market and draws a negative outlook again. Especially the outlook in Relative Strength Index (RSI) can be seen as one of the structures that strengthen the negative scenario. On-Balance Volume (OBV) is also showing a negative signal. With this data, it can be said that unless the 12.27 level is regained, the correction may continue until 11.90 – 11.60 levels, respectively. However, regaining the 12.27 level may disrupt the negative scenario and ensure the continuation of the bullish movement.
Supports 11.90 – 11.60 – 11.41
Resistances 12.27 – 12.98 – 13.77
SOL/USDT
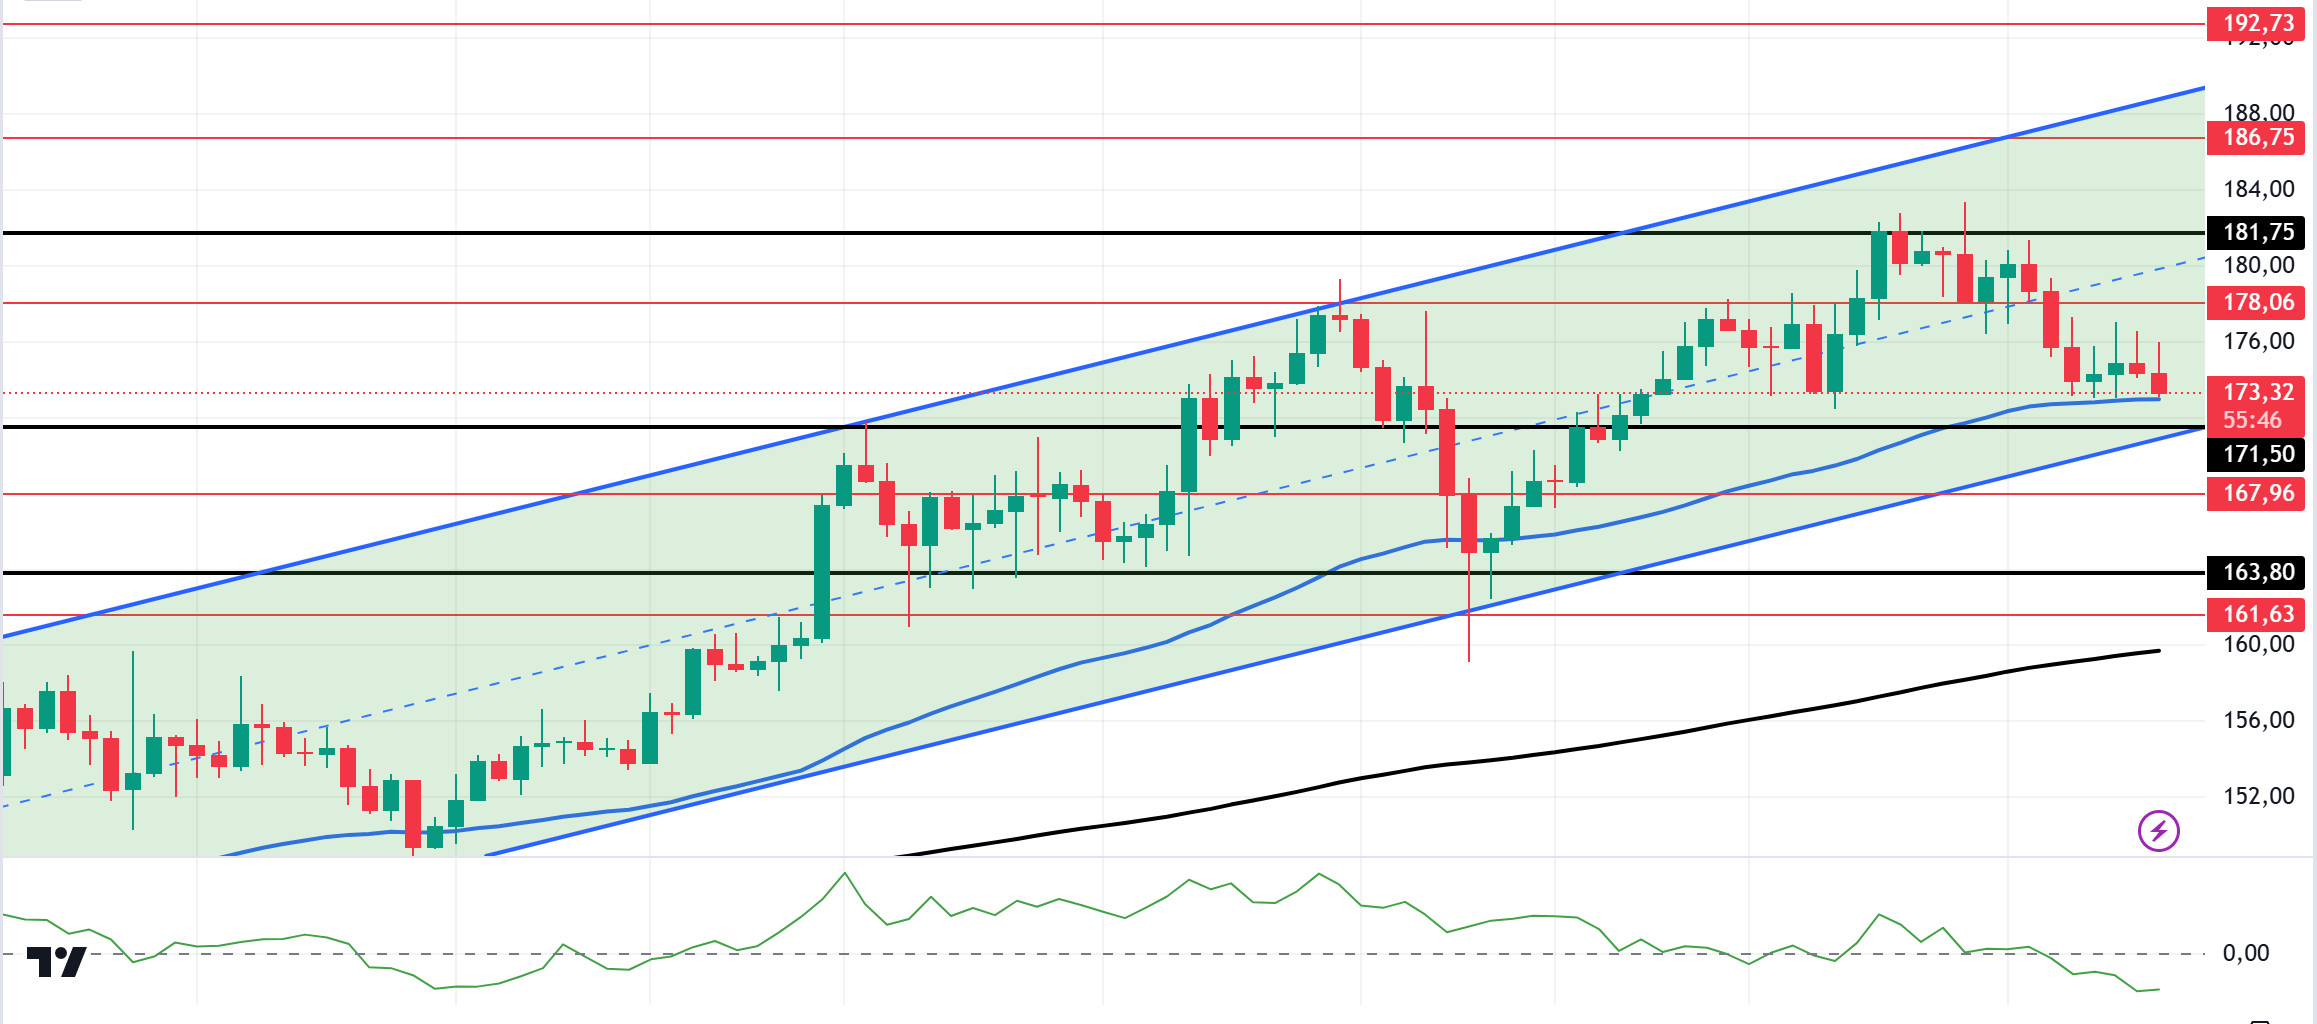
Today, the Core PCE price index from the US will be among the data to watch. In the Web3 space, amid the growing dominance of Solana (SOL), Canary Capital, an investment management firm founded by Steven McClurg, one of the founding team of Valkyrie Funds, has filed with the United States Securities and Exchange Commission (SEC) to offer its spot ETF. In network activity, three different cryptocurrency whales added more than $35 million SOL to their wallets in the last few days, according to data shared by Lookonchain. However, according to Token Terminal data, the number of active daily addresses on the Solana blockchain is approaching 10 million and daily revenues recently reached a six-month high of $2 million. Technically, SOL tested the 181.75 level but failed to turn it into support. On the 4-hour timeframe, the 50 EMA (Blue Line) continues to be above the 200 EMA (Black Line). This means that the rise will continue, but the excess distance between them may bring possible declines. When we examine the Chaikin Money Flow (CMF)20 indicator, it has crossed into negative territory. This shows us that the money outflow continues to increase. The 181.75 level stands out as a very strong resistance point in the rises driven by both macroeconomic conditions and innovations in the Solana ecosystem. If it rises above this level, the rise may continue strongly. In case of possible political reasons or profit sales, the support levels of 171.50 and 163.80 may be triggered again. If the price comes to these support levels, a potential bullish opportunity may arise.
Supports 171.50 – 167.96 – 163.80
Resistances 178.06 – 181.75 – 186.75
ADA/USDT
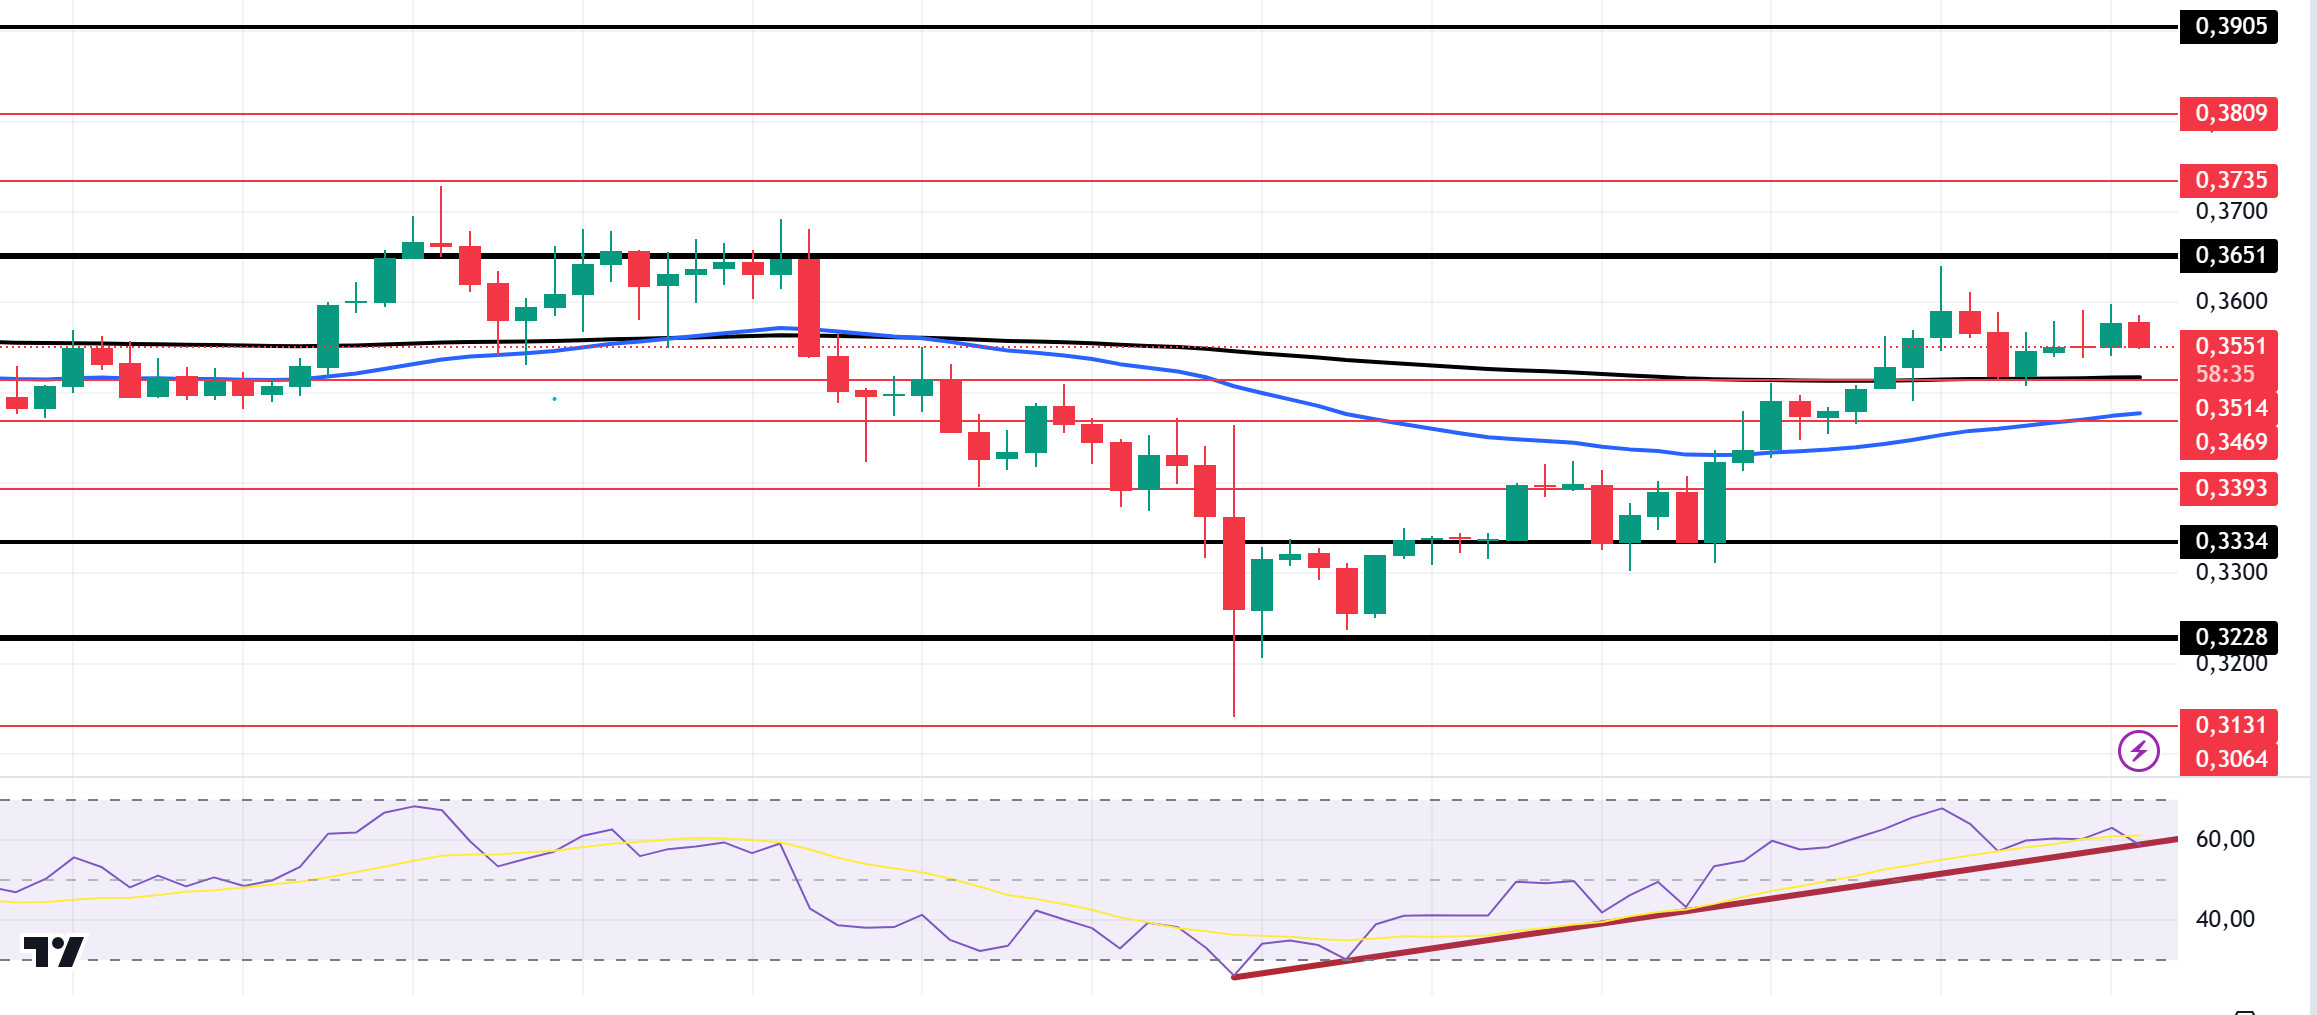
Today, the Core PCE price index from the US is among the data to watch. IntoTheBlock’s data shows that the altcoin’s holding period, the average time investors hold their coins before selling them, has increased by 371% over the last 7 days. It shows that when the holding period increases, investors are more confident about a coin’s long-term potential. Technically speaking, ADA is currently at a critical juncture and the price is showing signs of a potential breakout. The price has lost 1.20% in the last 24 hours, changing its direction from bullish to flat. On the 4-hour chart, the price broke the 50 EMA (Blue Line) and 200 EMA (Black Line) to the upside. However, the 50 EMA is below the 200 EMA. This shows us that the trend is bearish. At the same time, ADA price is currently stuck in a three-month range after testing resistance twice and support three times. The Relative Strength Index (RSI) remains flat at 14 overbought zones. It is also forming an uptrend, showing that moving averages can support the price. However, ADA may test the 0.3651 level once again. In the event of a decline due to the macroeconomic data and negativity in the ecosystem, the support level of 0.3334 should be followed. It may be appropriate to buy when it comes to this price level. In the rises due to developments in the ecosystem, if the 0.3651 level is broken in volume, the upward acceleration will increase even more and the 0.3905 level should be followed as a retracement place.
Supports 0.3514 – 0.3469 – 0.3393
Resistances 0.3651 – 0.3735 – 0.3809
AVAX/USDT
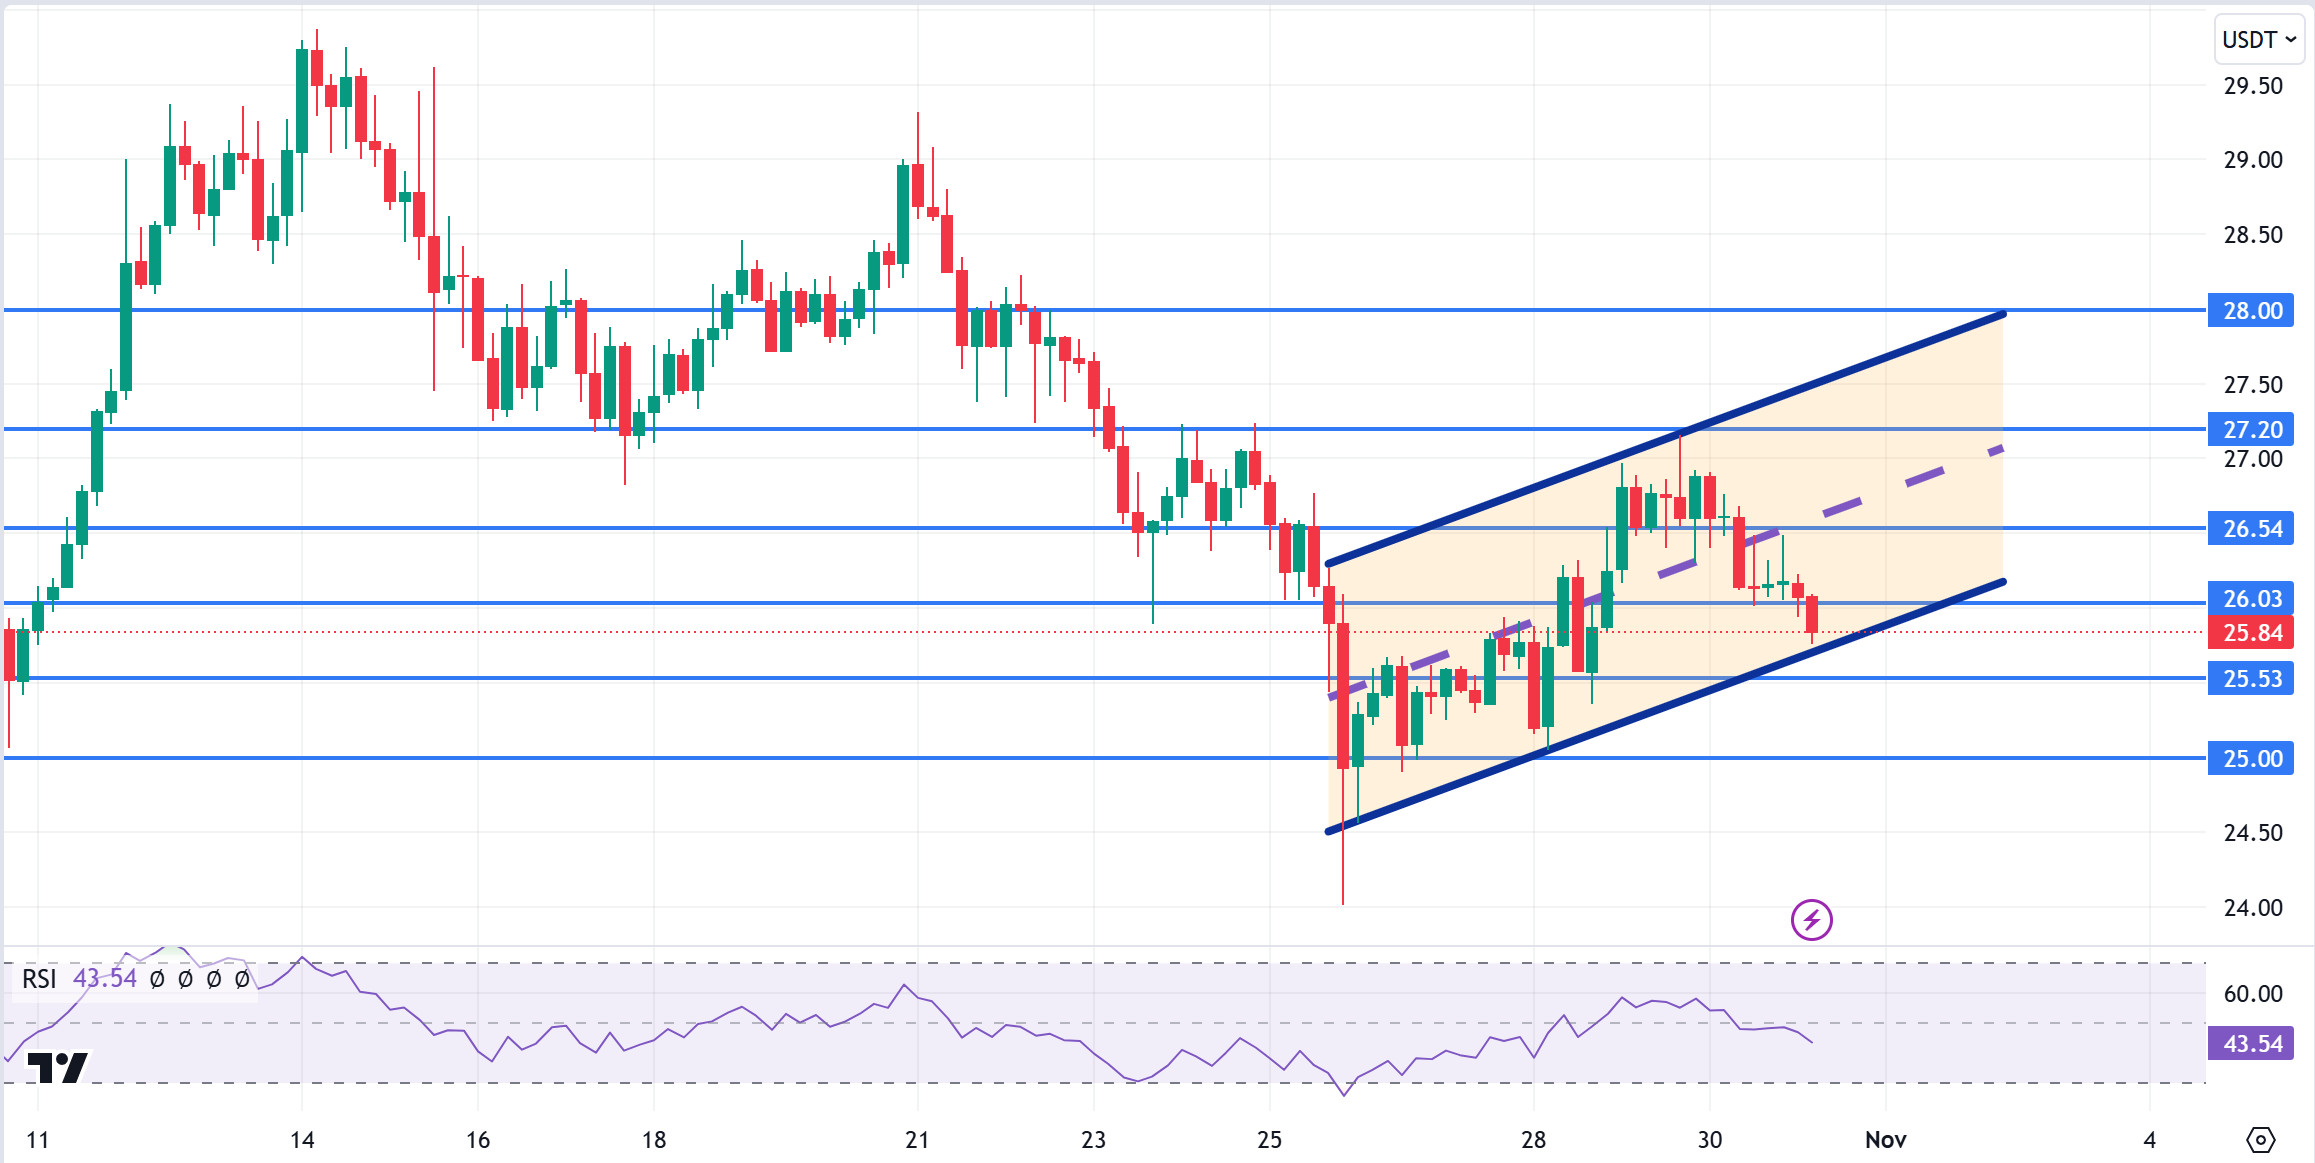
AVAX, which opened yesterday at 26.88, fell by about 2.5% during the day and closed the day at 26.18. Today, core personal consumption expenditures price index and unemployment claims data will be released by the US. News flows from the Middle East will be important for the market.
AVAX, currently trading at 25.84, is moving within the bullish channel on the 4-hour chart. It is in the lower band of the bullish channel and with a Relative Strength Index value of 43, it can be expected to rise slightly from these levels. In such a case, it may test the 26.54 resistance. On the other hand, selling pressure may increase if today’s data negatively affects the market or news of increased tension in the Middle East. In such a case, it may test 25.53 support. As long as it stays above 25.00 support during the day, the desire to rise may continue. With the break of 25.00 support, sales may increase.
Supports 26.03 – 25.53 – 25.00
Resistances 26.54 – 27.20 – 28.00
TRX/USDT
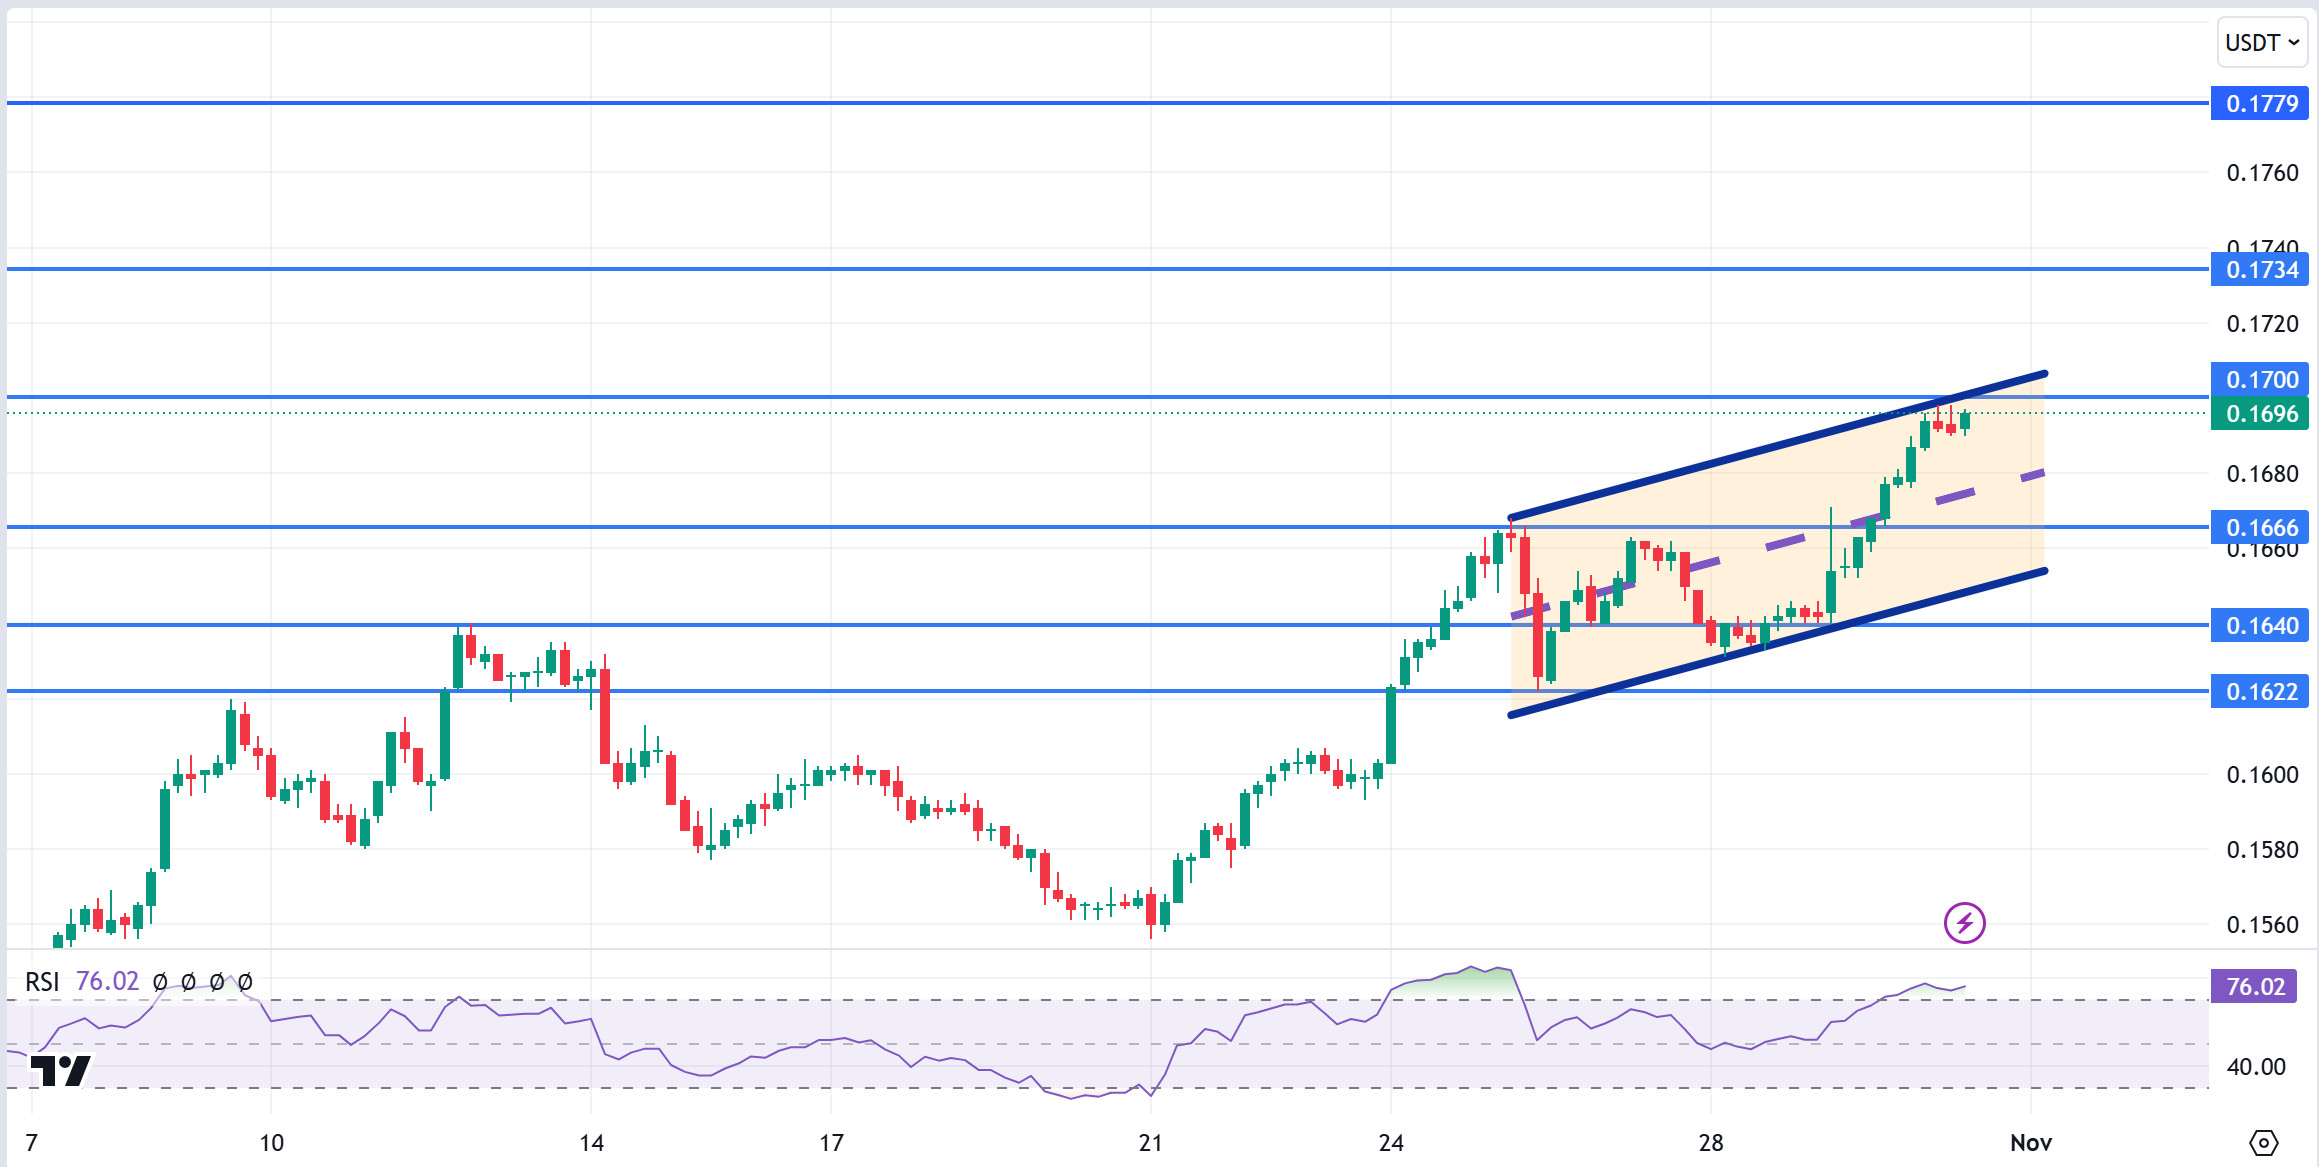
TRX, which started yesterday at 0.1662, rose about 2% during the day and closed the day at 0.1692. Today, the US core personal consumption expenditures price index and unemployment benefit claims are important data that the market will follow. Volatility in the market may increase during the release of this data. The market will also be closely monitoring the news flows regarding the tension in the Middle East.
TRX, currently trading at 0.1696, is in the upper band of the bullish channel on the 4-hour chart. The Relative Strength Index value is 76, which is in the overbought zone and can be expected to decline slightly from its current level. In such a case, it may move to the middle band of the channel and test the 0.1666 support. However, if it cannot close the candle under 0.1666 support, it may test 0.1734 resistance with the buying reaction that will occur. As long as TRX stays above 0.1482 support, the desire to rise may continue. If this support is broken downwards, sales can be expected to increase.
Supports 0.1666 – 0.1640 – 0.1626
Resistances 0.1700 – 0.1734 – 0.1779
DOT/USDT
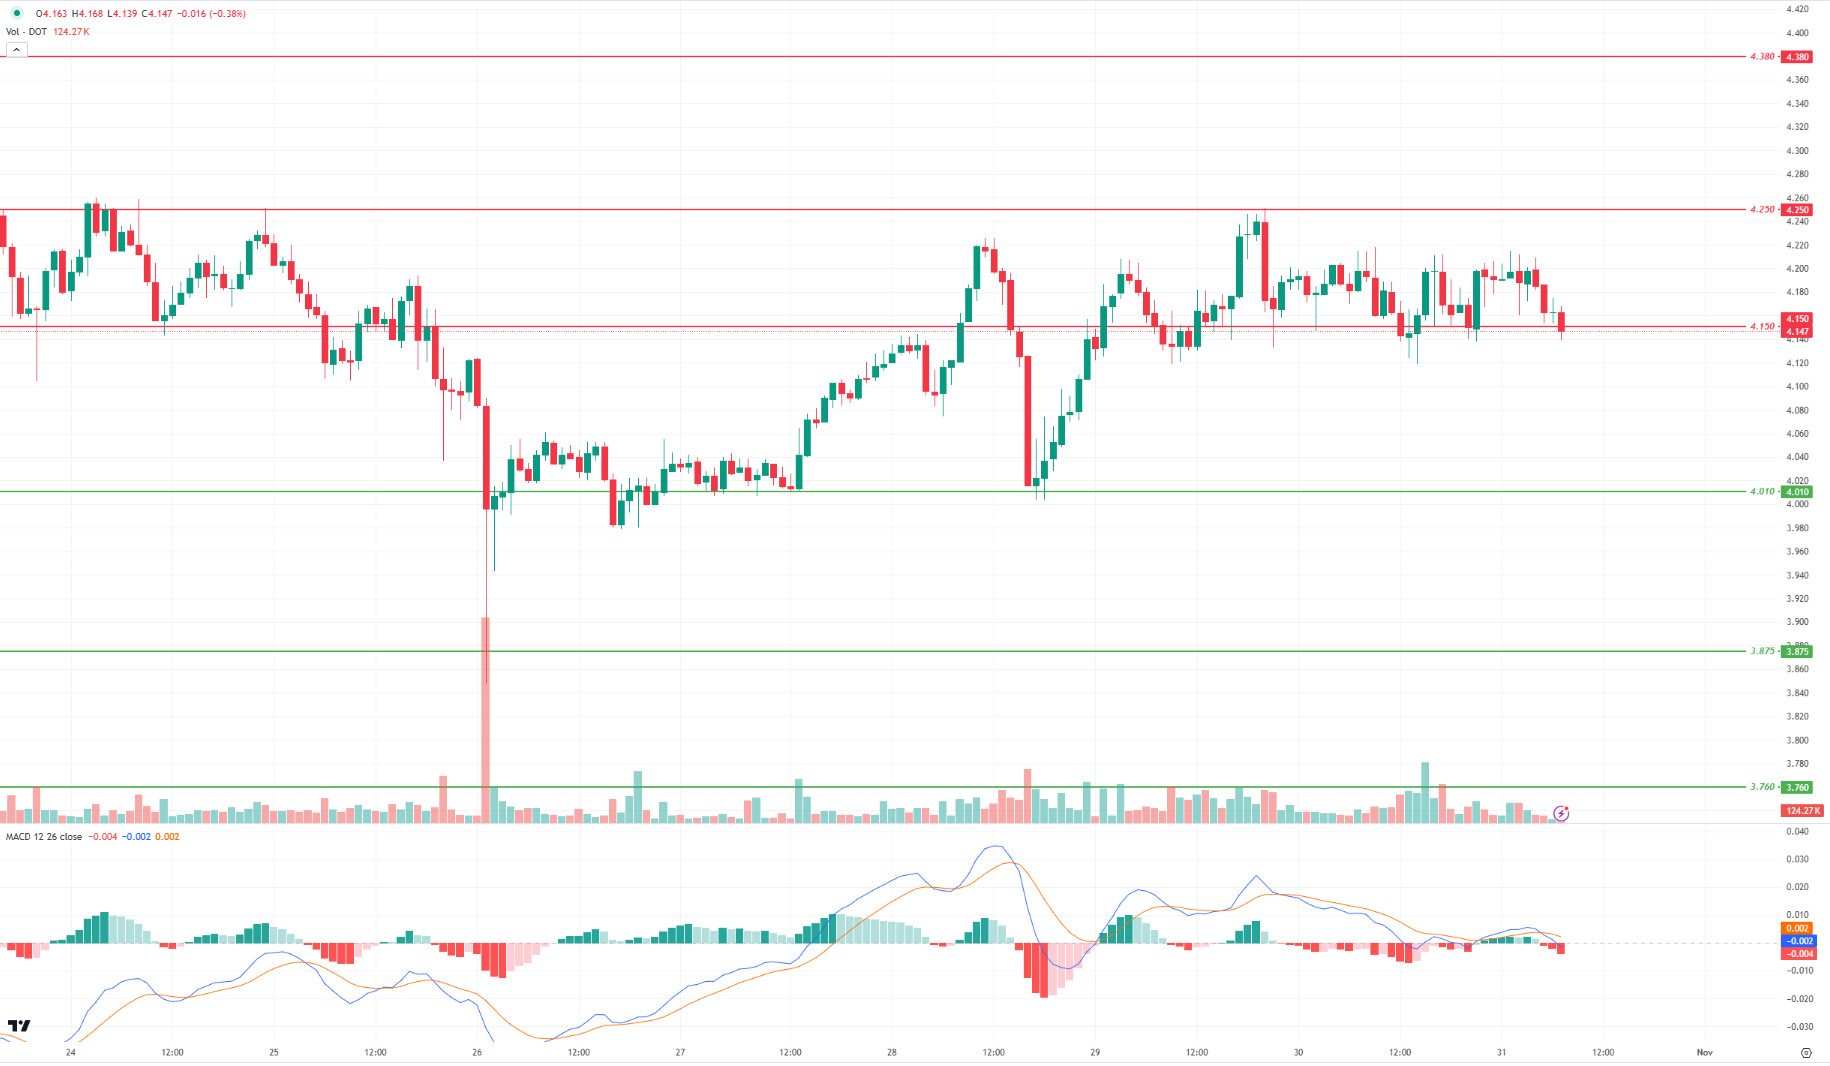
After the positive divergence between Polkadot (DOT) price and On Balance Volume (OBV), the price rose above 4.150, but the price could not sustain above 4.150. When we analyze the MACD oscillator, we see that the selling pressure increased compared to the previous hour. In this context, the price may retreat towards 4.010 levels. On the other hand, if the price maintains above the 4.150 level, it may want to break the 4.250 band, which is the next resistance level.
Supports 4.010 – 3.875 – 3.760
Resistances 4.150 – 4.250 – 4.380
SHIB/USDT
With the strong support of its community, Shiba Inu has called on Binance to list its ecosystem’s BONE token. The fact that Binance is heeding community requests for a listing suggests that BONE could potentially find a place on Binance. If BONE is listed, this could increase the token’s visibility and create a demand-driven increase in its price. Shiba Inu’s move also highlights the impact of community support on token success.
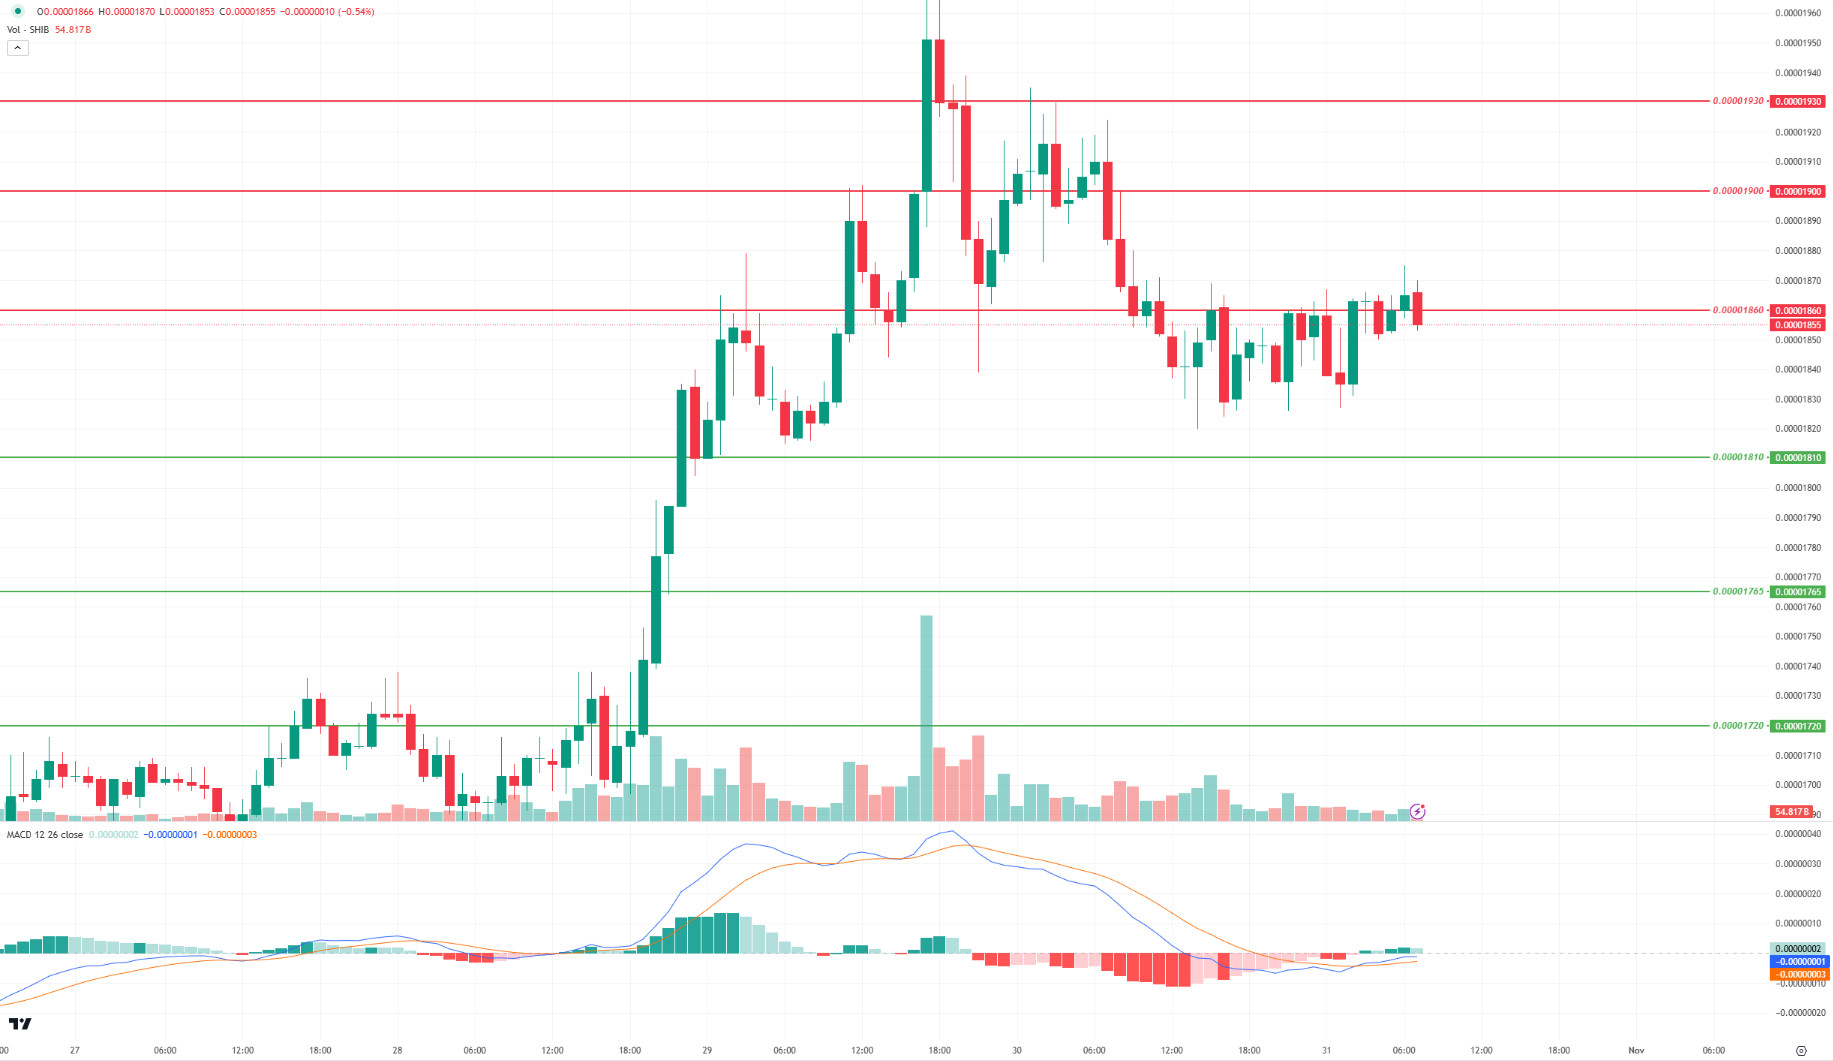
On the SHIB chart, the price failed to break the selling pressure at 0.00001860. When we examine the MACD oscillator, we can say that the buyer appetite has decreased compared to the previous hour. In this context, the price may retreat towards the 0.00001810 band, the first support level. On the other hand, if the price maintains above the 0.00001860 level, we may see a movement towards the next resistance level of 0.00001900 band.
Supports 0.00001810 – 0.00001765 – 0.00001720
Resistances 0.00001860 – 0.00001900 – 0.00001930
LEGAL NOTICE
The investment information, comments and recommendations contained herein do not constitute investment advice. Investment advisory services are provided individually by authorized institutions taking into account the risk and return preferences of individuals. The comments and recommendations contained herein are of a general nature. These recommendations may not be suitable for your financial situation and risk and return preferences. Therefore, making an investment decision based solely on the information contained herein may not produce results in line with your expectations.
