
MARKET SUMMARY
Latest Situation in Crypto Assets
Cryptocurrency Market Data
| Assets | Last Price | 24h Change | Dominance | Market Cap |
|---|---|---|---|---|
| BTC | $62,491.00 | 0.24% | 56.72% | $1.23 T |
| ETH | $2,450.00 | 1.36% | 13.54% | $294.84 B |
| SOL | $143.99 | 0.76% | 3.11% | $67.60 B |
| XRP | $0.5325 | 0.74% | 1.39% | $30.16 B |
| DOGE | $0.1093 | 2.14% | 0.73% | $15.99 B |
| TRX | $0.1597 | 2.42% | 0.64% | $13.83 B |
| CARDANO | $0.3471 | -0.96% | 0.56% | $12.14 B |
| AVAX | $26.56 | 0.77% | 0.50% | $10.80 B |
| SHIB | $0.00001779 | 0.37% | 0.48% | $10.52 B |
| LINK | $10.87 | -1.64% | 0.31% | $6.82 B |
| DOT | $4.134 | 0.46% | 0.29% | $6.23 B |
*Prepared on 10.2.2024 at 06:00 (UTC)
WHAT’S LEFT BEHIND
HBO Documentary
The HBO documentary “Money Electric” suggests that Peter Todd is Satoshi Nakamoto, the pseudonymous creator of Bitcoin.
US Elections
According to Polymarket, crypto bettors are increasingly predicting that former president Donald Trump could win the 2024 presidential election, betting more than $369 million on this hypothesis.
Xrp Spot ETF
Canary Capital Group, a new digital asset-focused investment firm founded in September, filed paperwork with the Securities and Exchange Commission on Tuesday to launch the Canary XRP ETF.
Highlights of the Day
| Date | Event | Impact | Actual | Forecast | Previous |
|---|---|---|---|---|---|
| 2024-10-08 | Non-Farm Payrolls | High | 250K | 200K | 300K |
| 2024-10-09 | Consumer Price Index | Medium | 2.5% | 2.3% | 2.4% |
| 2024-10-10 | Federal Reserve Rate Decision | High | 5.00% | 5.00% | 5.00% |
INFORMATION:
*The calendar is based on UTC (Coordinated Universal Time) time zone. The economic calendar content on the relevant page is obtained from reliable news and data providers. The news in the economic calendar content, the date and time of the announcement of the news, possible changes in the previous, expectations and announced figures are made by the data provider institutions. Darkex cannot be held responsible for possible changes that may arise from similar situations.
MARKET COMPASS
The perception that the slowdown in China’s economy may not be avoided, tensions in the Middle East and expectations that the US Federal Reserve (FED) will narrow the size of interest rate cuts are the main factors that continue to shape asset prices in global markets. The US 10-year bond yield remains above 4.0% while the greenback is holding on to its gains. European futures contracts indicate that stock markets in the continent will start the day on a flat note. Digital assets, on the other hand, followed a flat trend.
While the bad atmosphere that emerged after the statements from the Chinese front did not meet market expectations has dissipated to some extent, there is talk that the country may announce a stimulus of 2-3 trillion yuan on October 12. Apart from that, investors will try to gather new information on the interest rate path of the Federal Open Market Committee (FOMC) today. In their statements so far, Collins and Bostic underlined that they will be data-driven and made statements indicating that interest rate cuts may continue. FOMC officials have a busy schedule today. In addition, the most important development of the day will be the minutes of the last FOMC meeting.
We have not changed our views on the short-term direction in our recent analysis and we believe that the markets are more likely to follow the upside with new potential news flows that could trigger risk appetite than the downside. The risk to this outlook is that there could be worse developments in the Middle East. At this point, we will continue to monitor the possible outcomes of the Israeli Foreign Minister’s visit to Washington today.
TECHNICAL ANALYSIS
BTC/USDT
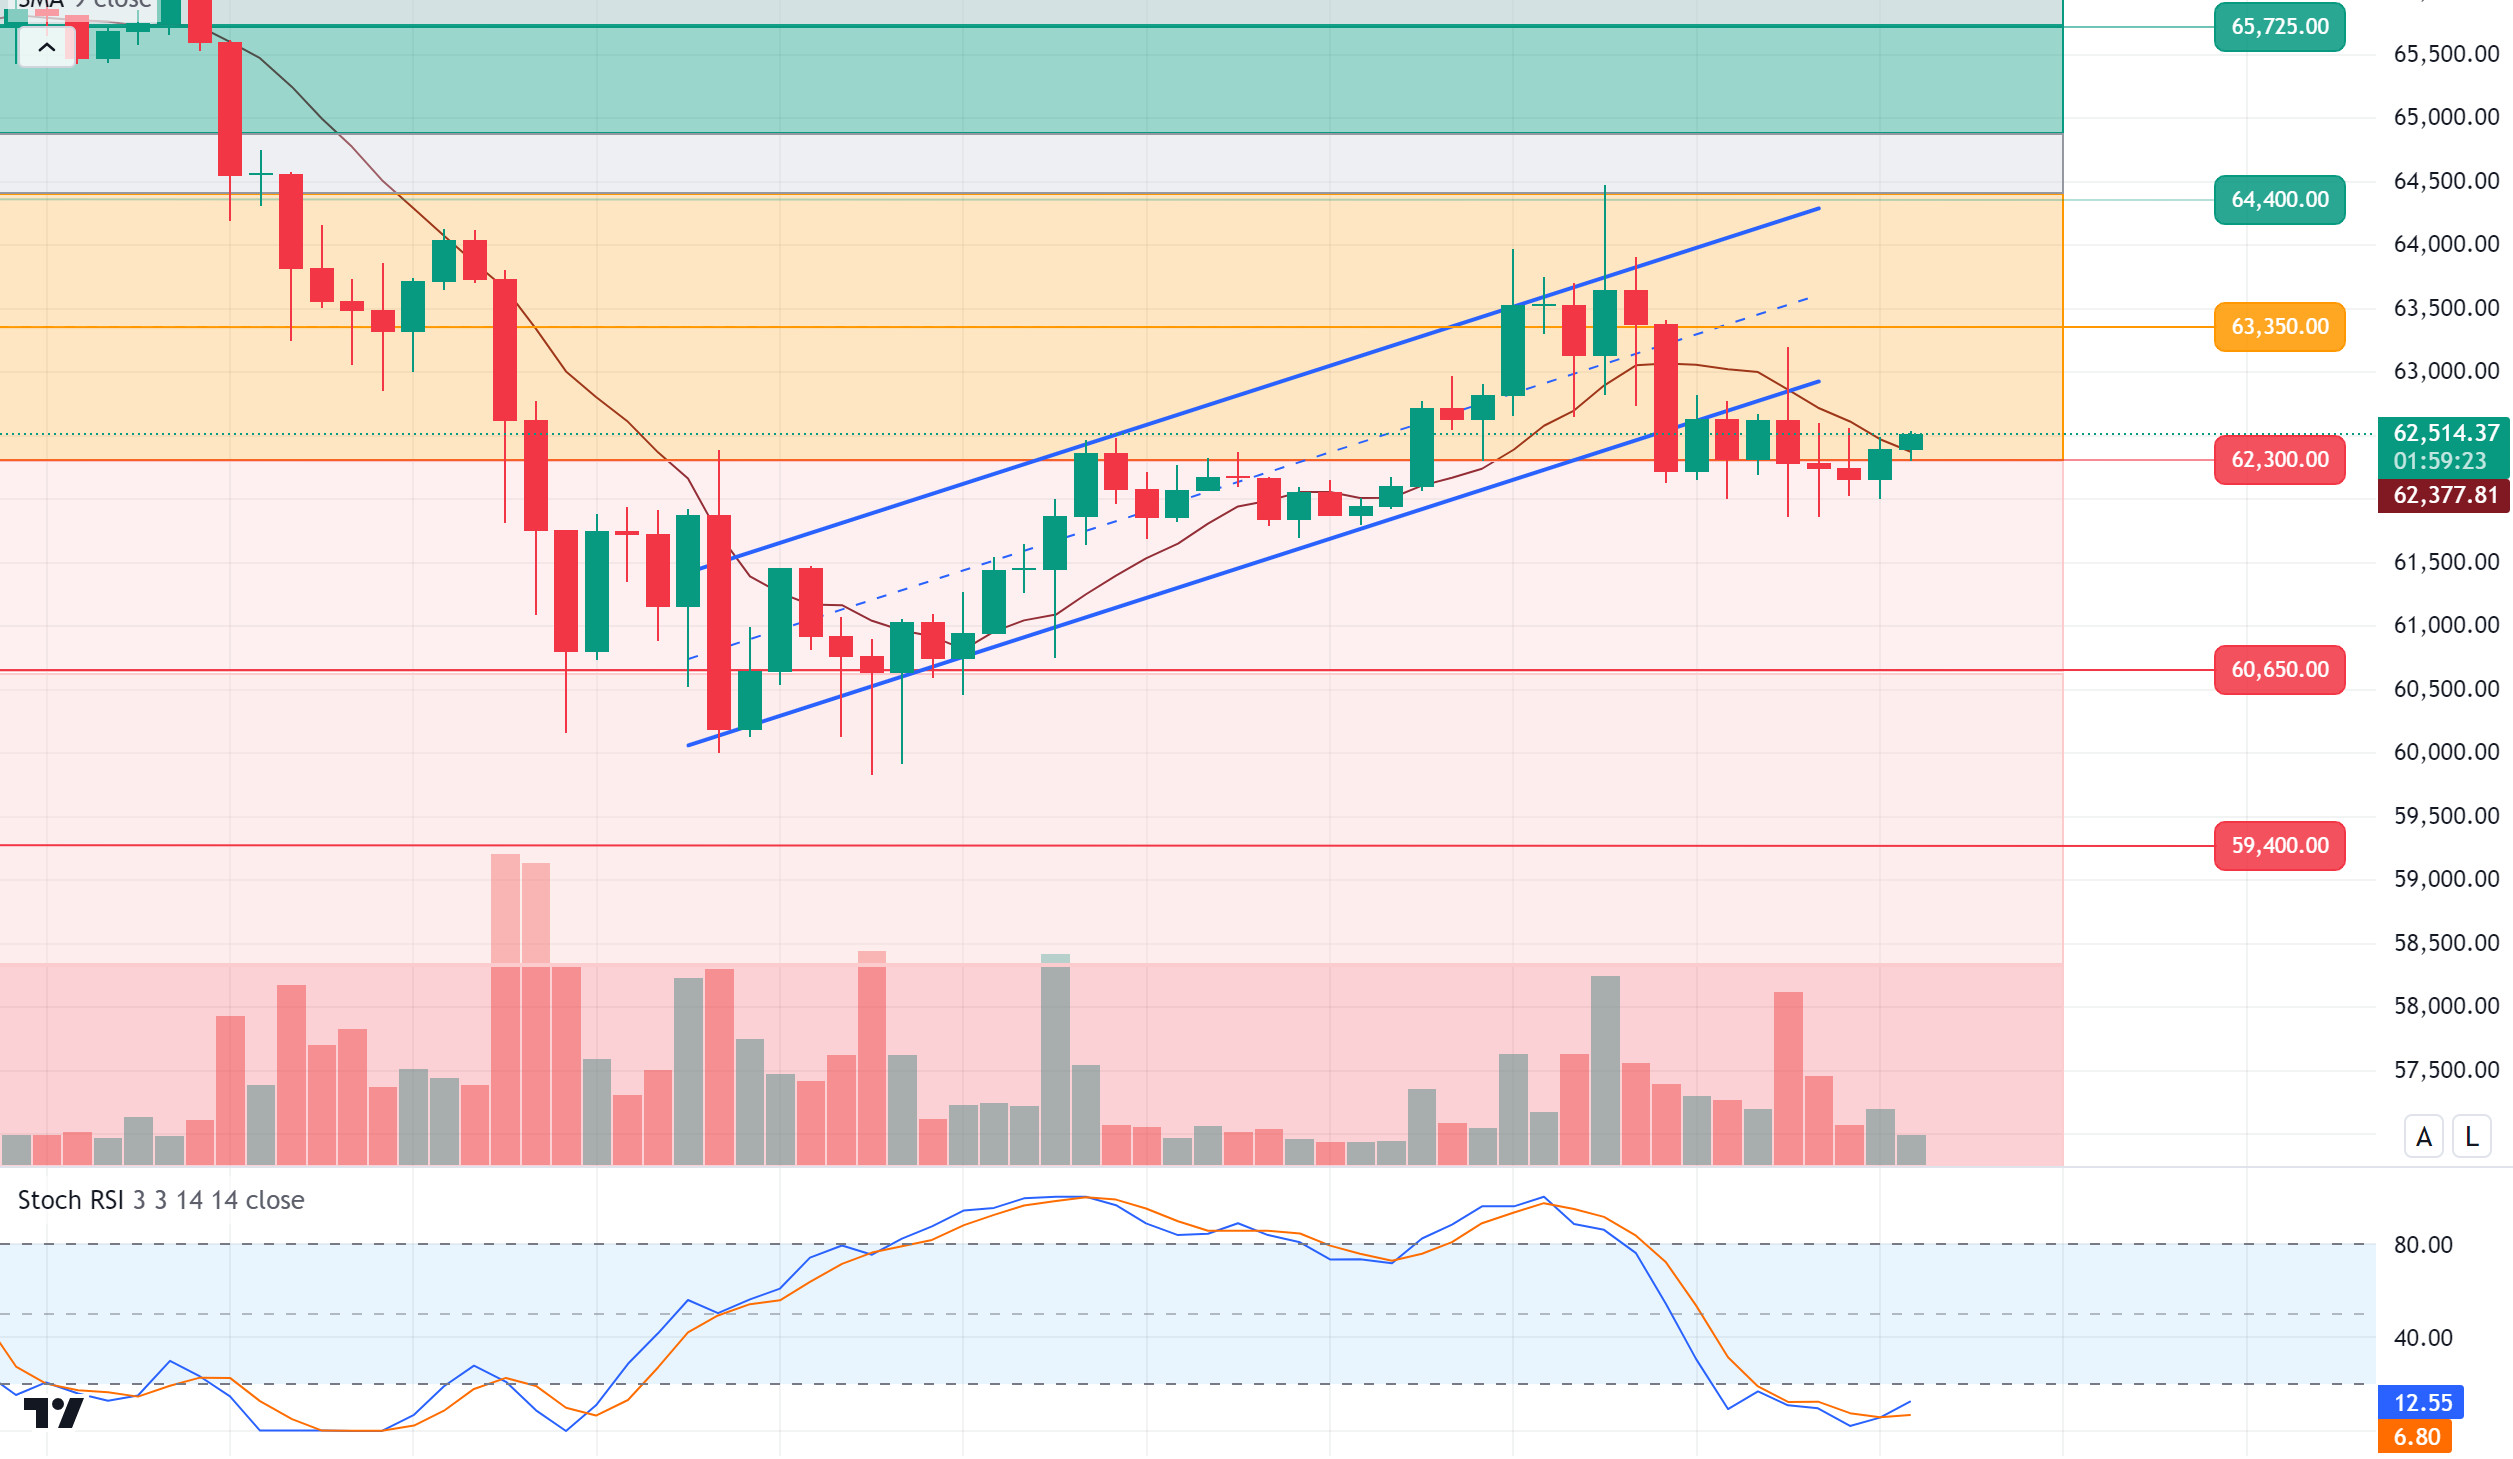
Stagnation in Bitcoin! Signs of consolidation continue in Bitcoin before US inflation data, one of the critical macroeconomic indicators. The possible flow of funds that may come to the market with interest rate cuts is not enough to overcome the resistances in Bitcoin, causing the October bullish expectations to decrease for the time being. As a matter of fact, the ongoing tensions in the Middle East, the backward step towards the stimulus package on the Chinese side and the US election process creating uncertainty on the market remain among the other factors that reduce hopes.
If we look at the BTC 4-hour technical analysis, the compression of prices as prices break out of the rising channel and the formation of low-volume candles causes a loss of momentum. BTC, which is currently priced at 64,480 just above the 62,300 point, which is the support level in the orange band range, can be expected to attempt a new upward attack as it gains strength in this region. In this direction, we may encounter the minor resistance level of 63,350. If the RSI, one of our technical indicators, turns upwards and the price rises above the short-term moving average, it may increase the chances of an upward attack. In case of a pullback, hourly and 4-hour closures below the major support level of 62,300, which we should pay attention to, may deepen the decline.
Supports 62,300 – 60,650 – 59,400
Resistances 64,400 – 65,750 – 67,300
ETH/USDT
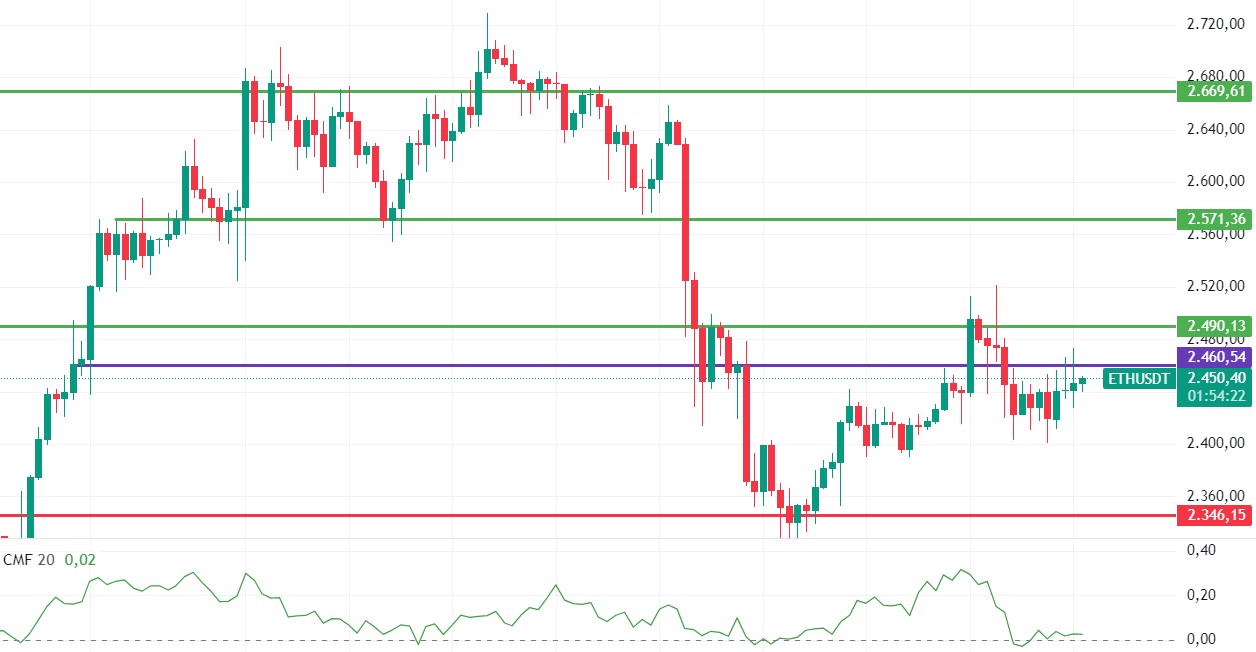
As of yesterday evening, Ethereum, which tried to exceed the 2,460 level, is exposed to hard sell orders above this level. While there are positive outlooks on RSI, momentum and OBV, we see that the positive mismatch on CMF continues. It is noteworthy that the Kijun level rose to 2,455. The start of a positive trend for Ethereum seems possible after closing above the 2,455 – 2,460 levels. In this case, 2,490 and then 2,520 levels can come quickly. However, with the continued selling pressure, breaking the 2,400 support may bring declines to the region between 2,346 – 2,270 levels.
Supports 2,400 – 2,346 – 2,270
Resistances 2,460 – 2,490 – 2,510
LINK/USDT
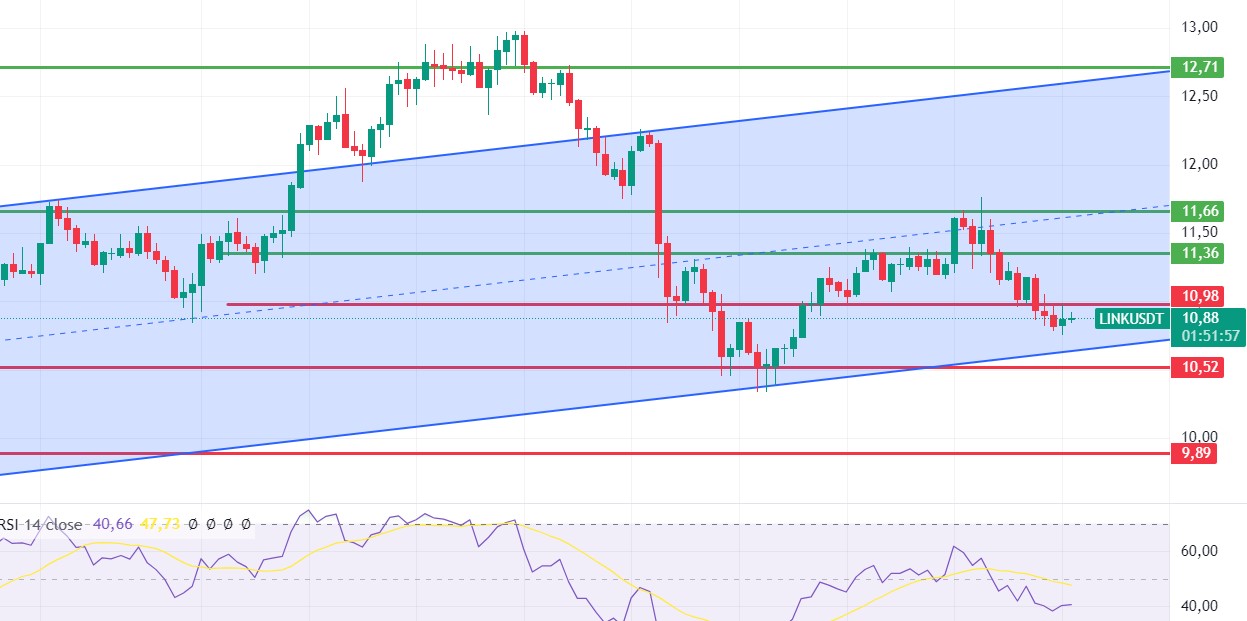
LINK failed to hold on to the 10.98 level and fell a little more, and although it wants to move above this zone again, the selling pressure seems to have grown. RSI, OBV and momentum have switched from neutral to slightly positive. In the light of this data, we can comment that we can see rises up to 11.36 with the regain of 10.98 during the day. However, failure to exceed the level may bring a decline to 10.52 levels with selling pressure.
Supports 10.52 – 10.17 – 9.89
Resistances 11.36 – 11.66 – 12.71
SOL/USDT
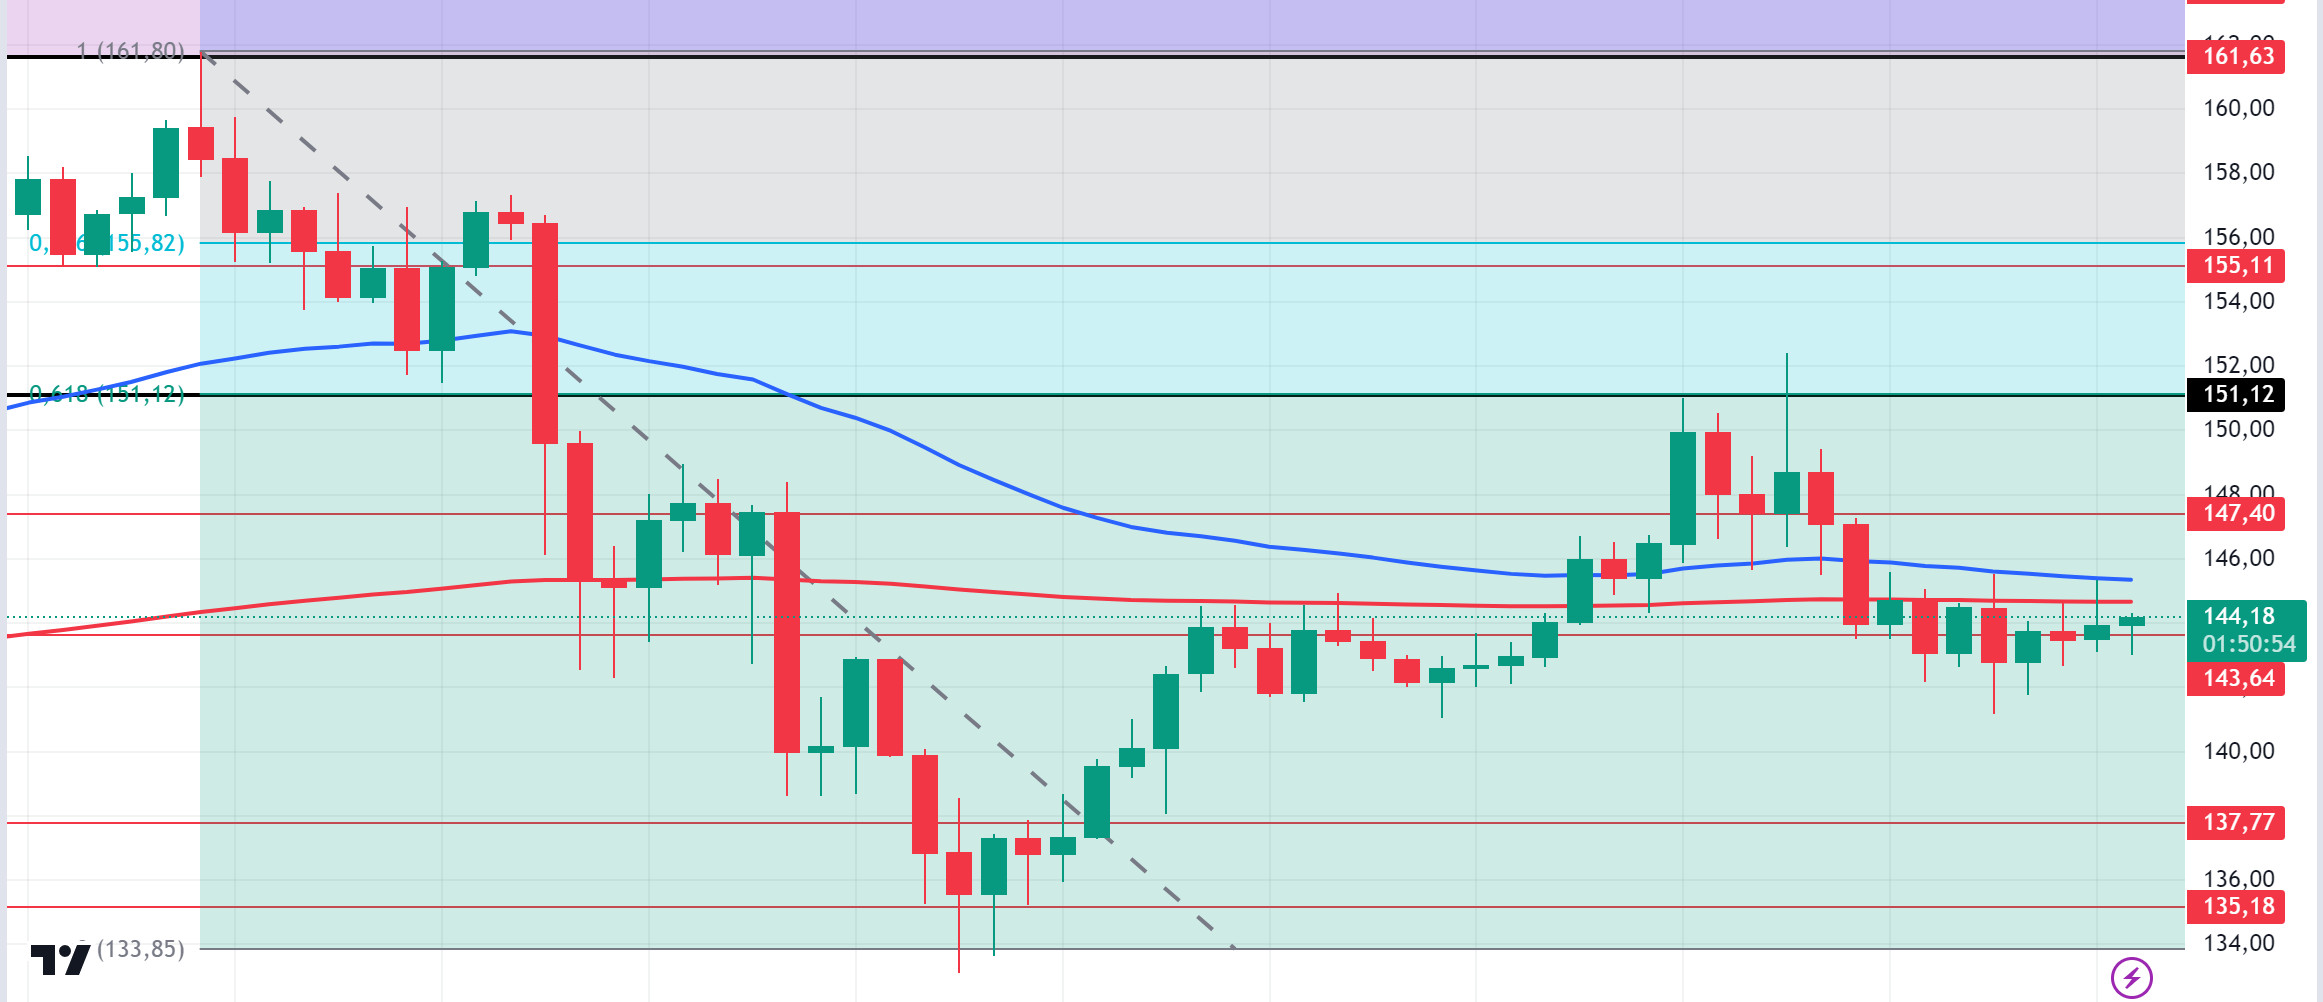
SOL has been moving sideways since our analysis yesterday. The price continues to accumulate in the 127.17 – 161.63 band since August 8. It encountered resistance from the Fibonacci retracement at 0.618 (151.12). On the 4-hour chart, the 50 EMA seems to have received support from the 200 EMA. The 151.12 level appears as a resistance point in the uptrend driven by both macroeconomic conditions and innovations in the Solana ecosystem. If it does not fall below this level, the rise may continue. In the sales to be made by investors due to political and macroeconomic conditions, the support levels of 143.64 – 137.77 should be followed. If the price comes to these support levels, a potential bullish opportunity may arise.
Supports 143.64 – 137.77 – 135.18
Resistances 147.40 – 151.12 – 155.11
ADA/USDT
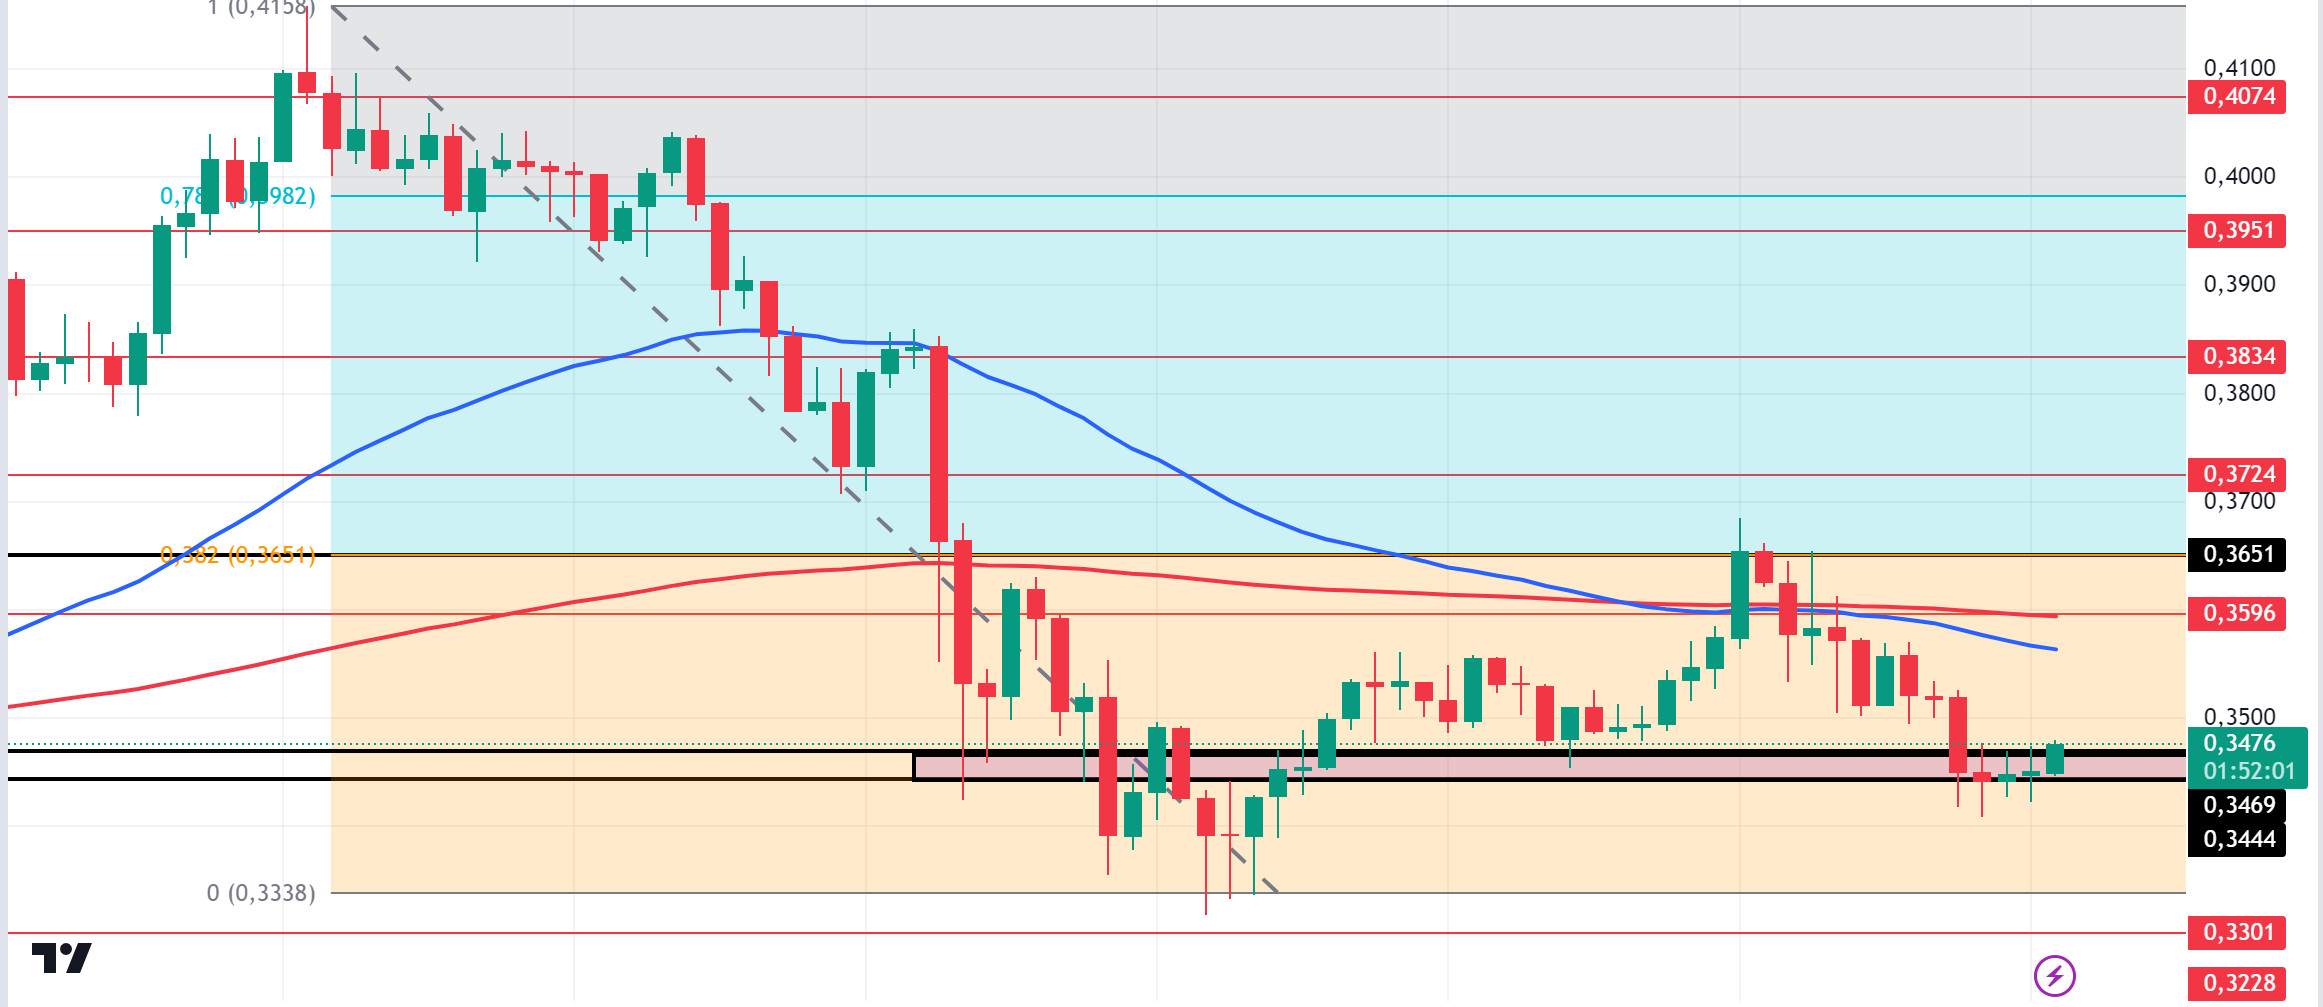
According to data from Intotheblock, the price in the ADA ecosystem, which exceeded the 0.4000 level with high whale activity late last month, seems to have entered a cooling period as this activity has subsided. The number of large transactions has been steadily decreasing. It fell to 2,300 on October 6 and recovered slightly to 3,000 on October 7. Without strong large-scale trading activity, ADA may not be in a clear uptrend or downtrend, suggesting that market participants are waiting for new developments or clearer signals before making their next significant move. This period of low trading volume could mean that ADA is in a holding pattern. Technically, on the 4-hour chart, the 50 EMA has broken the 200 EMA to the downside. This could be a sign that the decline in ADA may deepen. On the other hand, when we look at the Fibonacci retracement, the retracement of the decline that started on September 27 has met resistance at the Fibonacci value of 0.382 (0.3651). The 0.3469 – 0.3444 band appears as a strong support in the pullbacks to be experienced with possible political and macroeconomic news. If the positive atmosphere in the ecosystem continues, the 0.3651 level should be followed as a strong resistance.
Supports 0.3444 – 0.3301 – 0.3228
Resistances 0.3596 – 0.3651 – 0.3724
AVAX/USDT
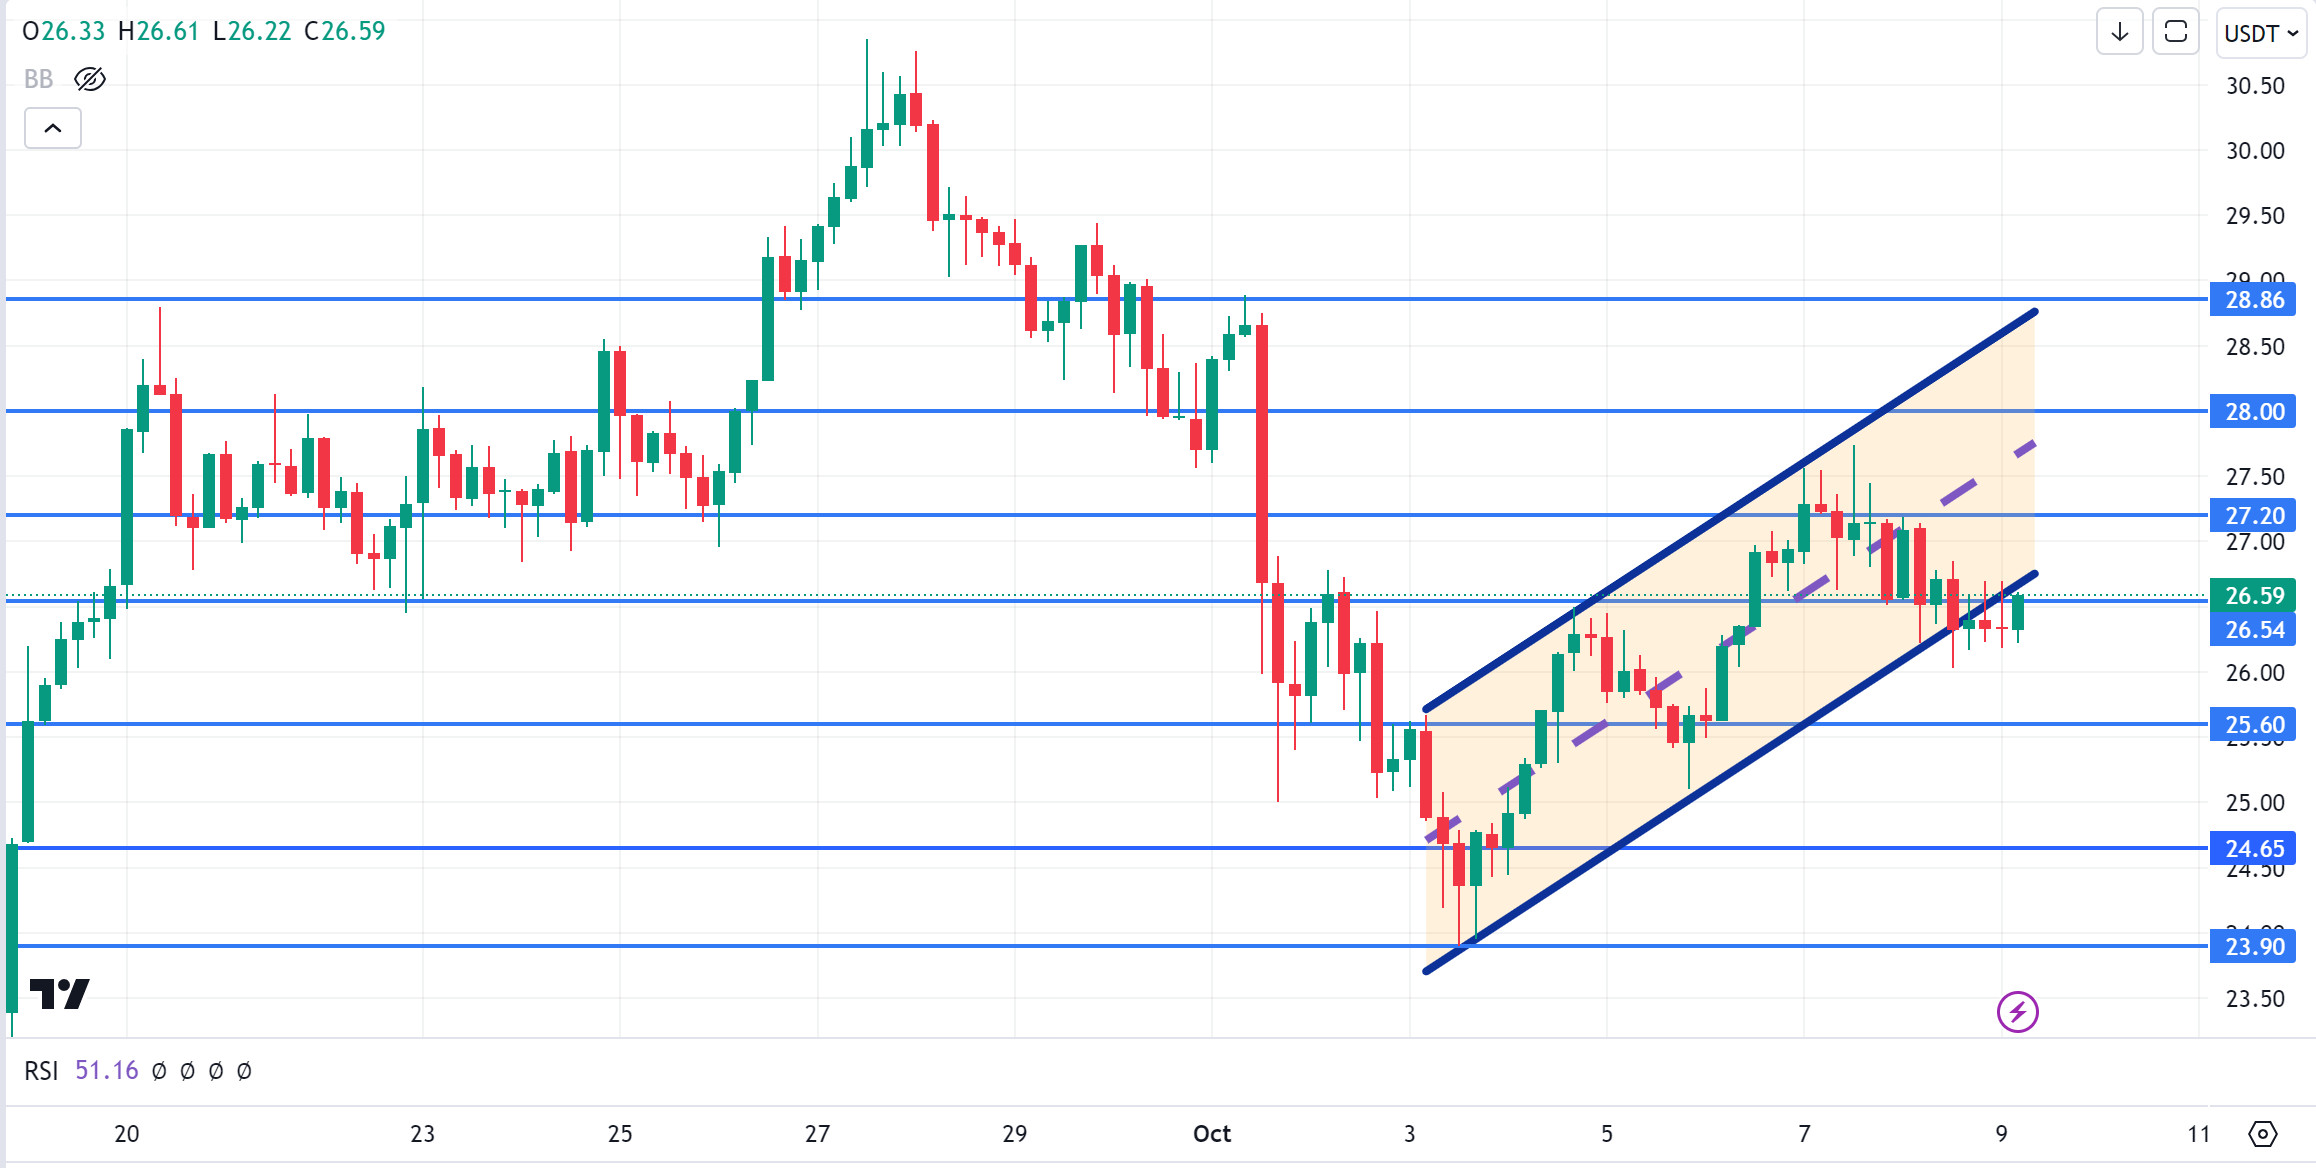
AVAX, which opened yesterday at 26.57, fell by about 1% during the day and closed the day at 26.34. Today, there is no planned data from the US that we expect to affect the market. It will be important for news flows from the Middle East.
AVAX, currently trading at 26.58, is trying to break the lower band of the rising channel upwards on the 4-hour chart. With the candle closing above 26.54 resistance, it will re-enter the channel and can be expected to move towards the middle band of the channel. In such a case, it may test the 27.20 resistance. In case of news of increasing tension in the Middle East, sales may increase and test 25.60 support. As long as it stays above 24.65 support during the day, the desire to rise may continue. With the break of 24.65 support, sales may increase.
Supports 25.60 – 24.65 – 23.90
Resistances 26.54 – 27.20 – 28.00
TRX/USDT
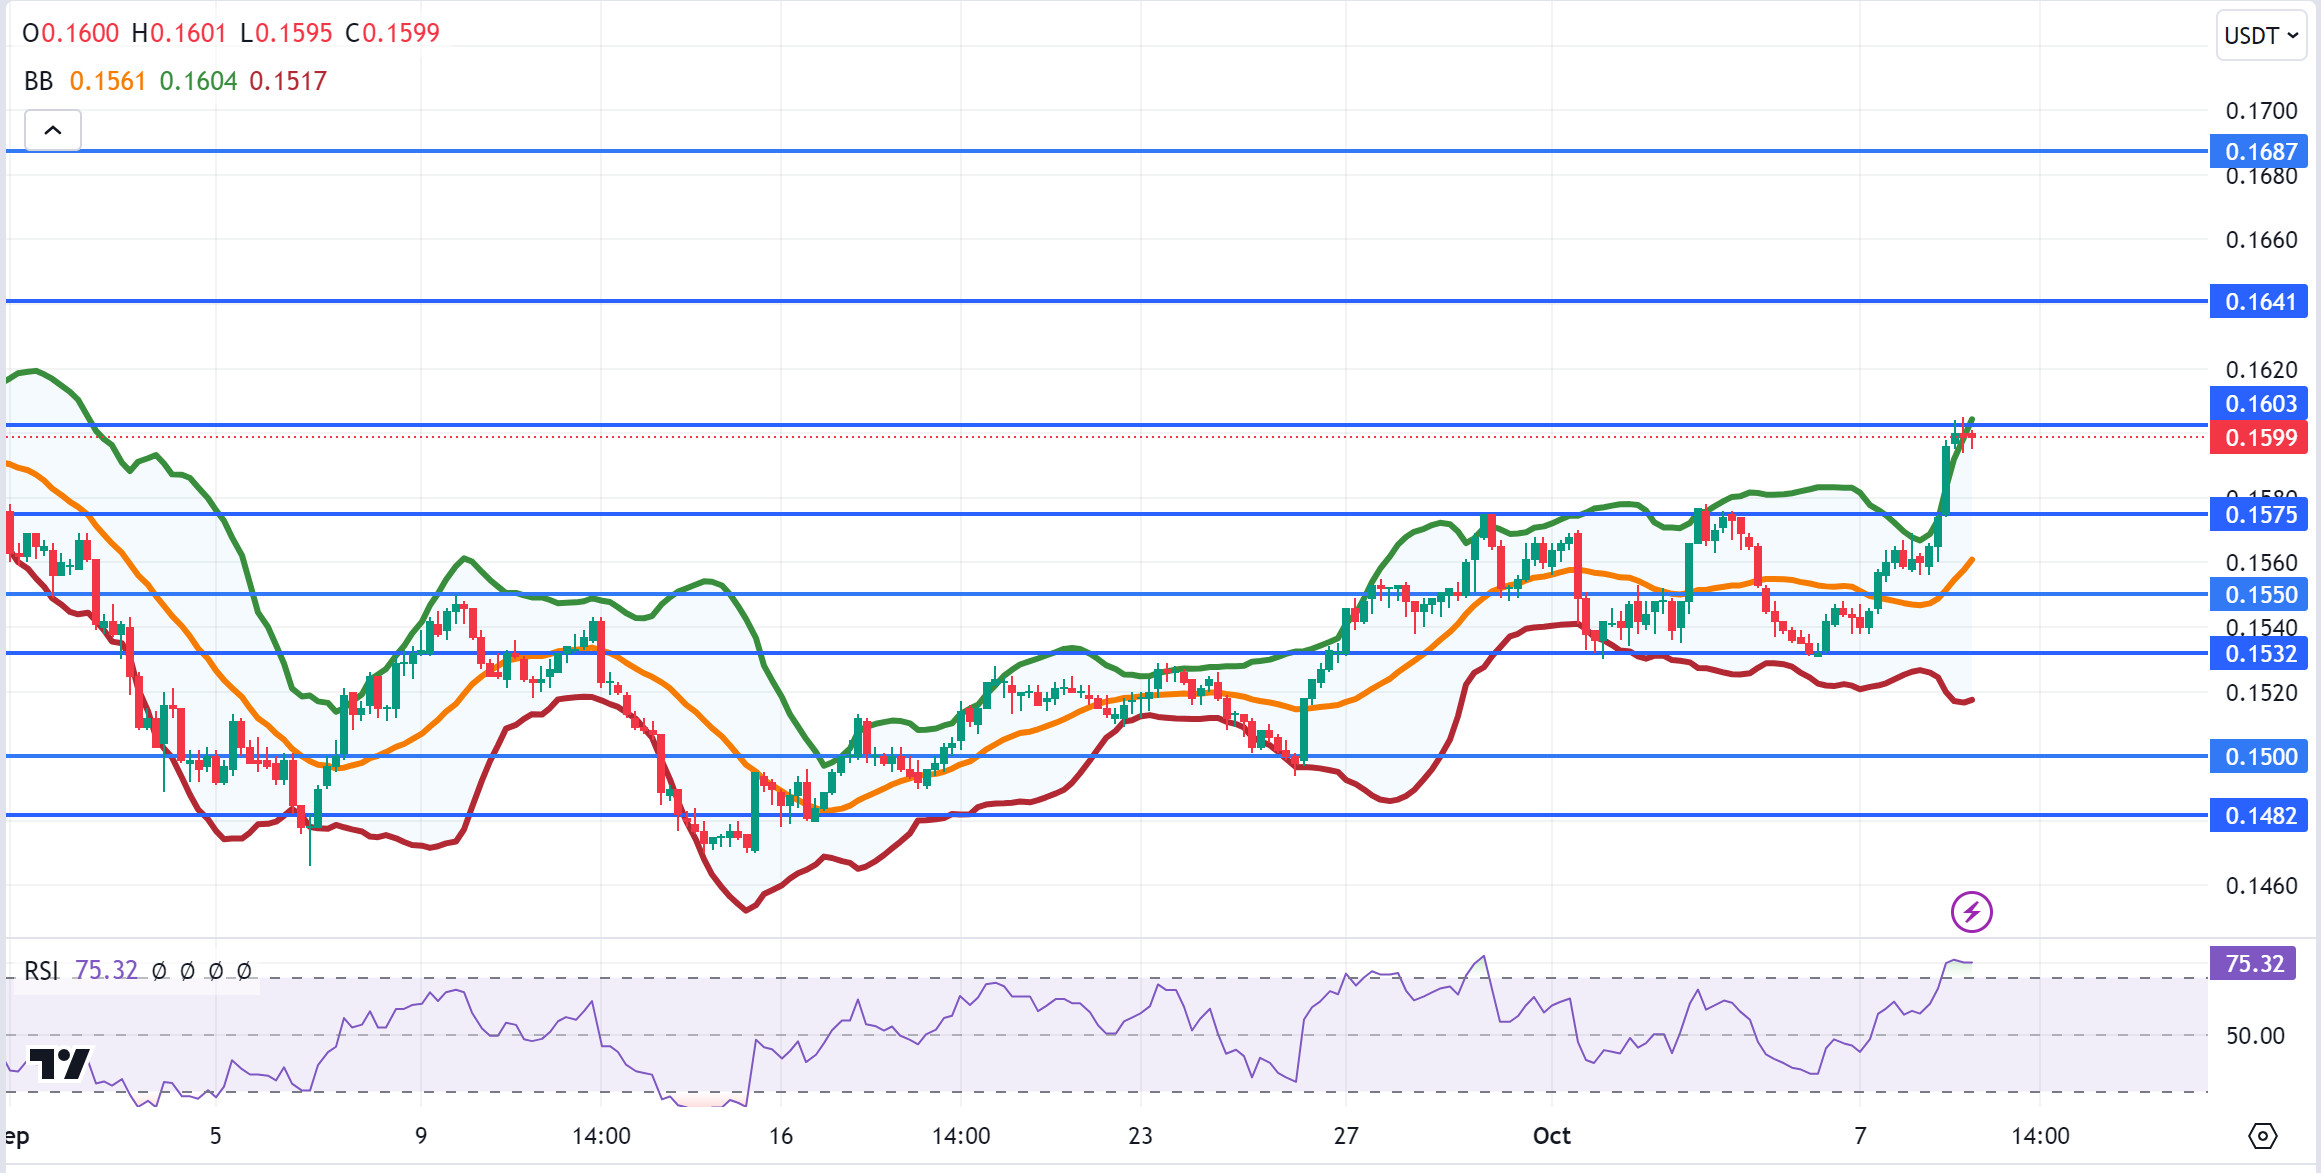
TRX, which started yesterday at 0.1558, rose about 2.5% during the day and closed the day at 0.1600. There is no scheduled data expected to affect the market today. The market will be closely following the news flows regarding the tension in the Middle East. TRX, currently trading at 0.1599, is moving down towards the Bollinger mid-band on the 4-hour chart. The RSI 75 value is in the overbought zone and can be expected to decline slightly from its current level. In such a case, it may move to the Bollinger middle band and test the 0.1575 support. If the tension in the Middle East decreases, it may test 0.1641 resistance with future purchases. As long as TRX stays above 0.1482 support, the desire to rise may continue. If this support is broken downwards, sales can be expected to increase.
Supports 0.1575 – 0.1550 – 0.1532
Resistances 0.1603 – 0.1641 – 0.1687
XRP/USDT
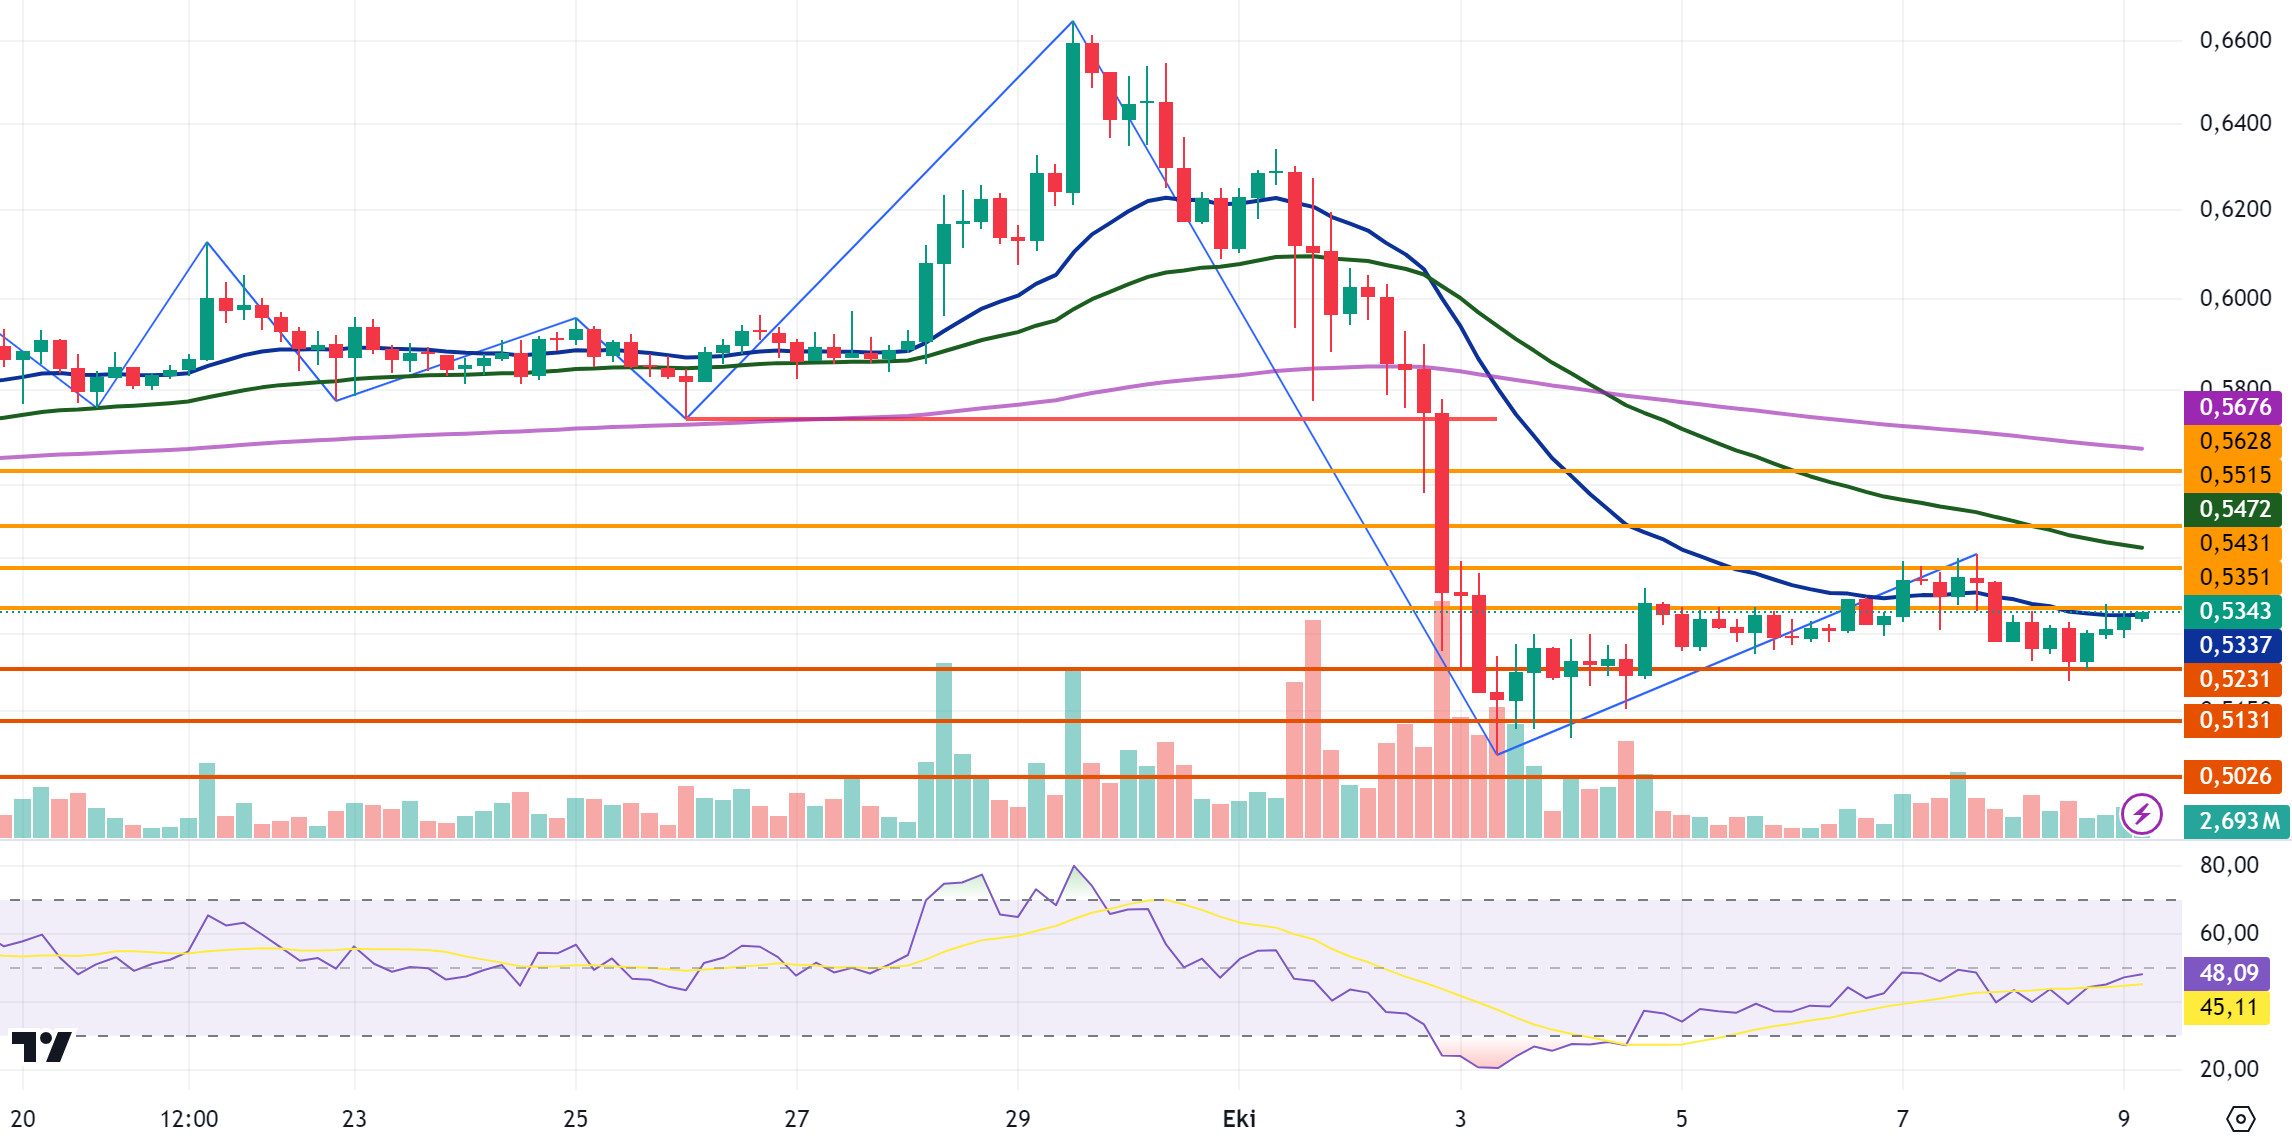
XRP tested and failed to break the 0.5231 support level with the decline it experienced in the 4-hour analysis yesterday and rose with the incoming purchases and the daily close was realized at 0.5308. Today, XRP, which continued to rise at the opening candle in the 4-hour analysis, tested the EMA20 level with its rise. With the sales coming at the EMA20 level, XRP, whose rise stopped at this level, continues to test this level. If the EMA20 level is broken with its rise, it may test the resistance levels of 0.5351-0.5431-0.5515 in the continuation of the rise. In the event that the EMA level in question cannot be broken and declines with the sales that may come, it may test the support levels of 0.5231-0.5131-0.5026 with its decline. RSI (14) value 48.09. XRP, whose RSI data is in the neutral zone, may continue its movement within the horizontal band and may offer short-term trading opportunities with momentary bearish and bullish movements within the horizontal band.
If the EMA20 level is broken in its rise and the rise continues, it may decline with possible sales at 0.545 and may offer a short trading opportunity. In its decline, it may rise with possible purchases at 0.52 and may offer a long trading opportunity.
EMA20 (Blue Line) – EMA50 (Green Line) – EMA200 (Purple Line)
Supports 0.5231 – 0. 5131 – 0.5026
Resistances 0.5351 – 0.5431 – 0.5515
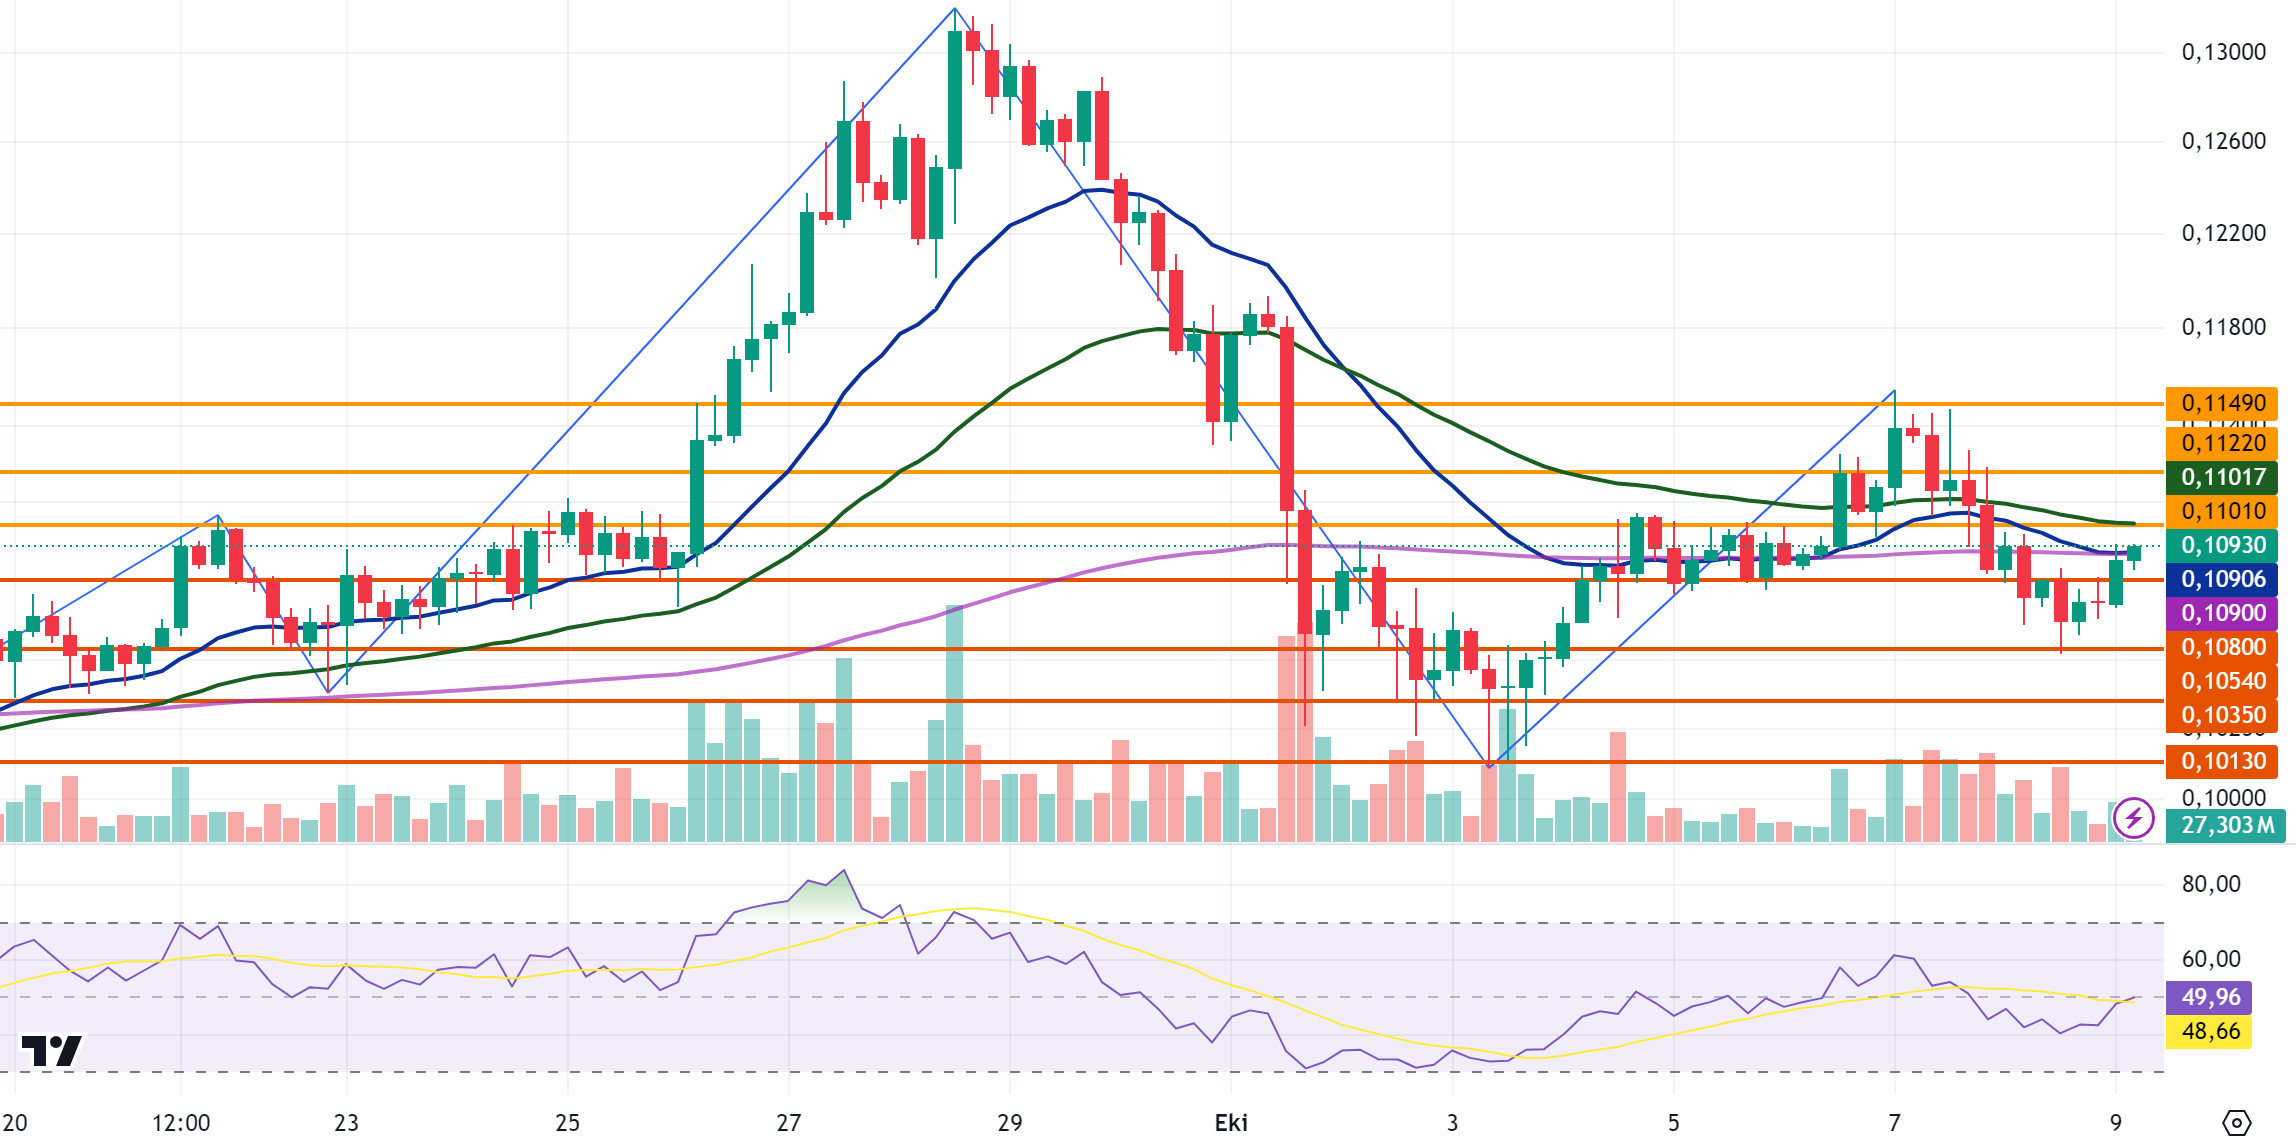
DOGE/USDT
Yesterday, DOGE traded in a horizontal band between 0.1054 and 0.1080 levels after the decline in the opening candle in the 4-hour analysis, and the daily close was at 0.1070. Today, DOGE tested the EMA20 and EMA200 levels after breaking the 0.1080 resistance level with its rise on the opening candle in the 4-hour analysis and continues to trade above these levels at 0.1093. In the 4-hour analysis, if the candle closes above the EMA20 and EMA200 levels and continues to rise, it may test the resistance levels of 0.1101-0.1122-0.1149. If it is traded below the EMA levels, it may decline with the selling pressure that may occur and test the support levels of 0.1080-0.1054-0.1035 with its decline. The RSI (14) value is 47.22 and is in the neutral zone and it is foreseeable that the movement within the horizontal band will continue with the rise and fall it may experience. Within the horizontal band, DOGE may rise with the purchases that may come at 0.1054 in the decline it may experience and may offer a long trading opportunity. In its rise, if it is traded above the EMA20 and EMA200 levels, it may decline with possible sales at the EMA50 and 0.11 levels and may offer a short trading opportunity.
EMA20 (Blue Line) – EMA50 (Green Line) – EMA200 (Purple Line)
Supports 0.1080 – 0.1054 – 0.1035
Resistances 0.1101 – 0.1122 – 0.1149
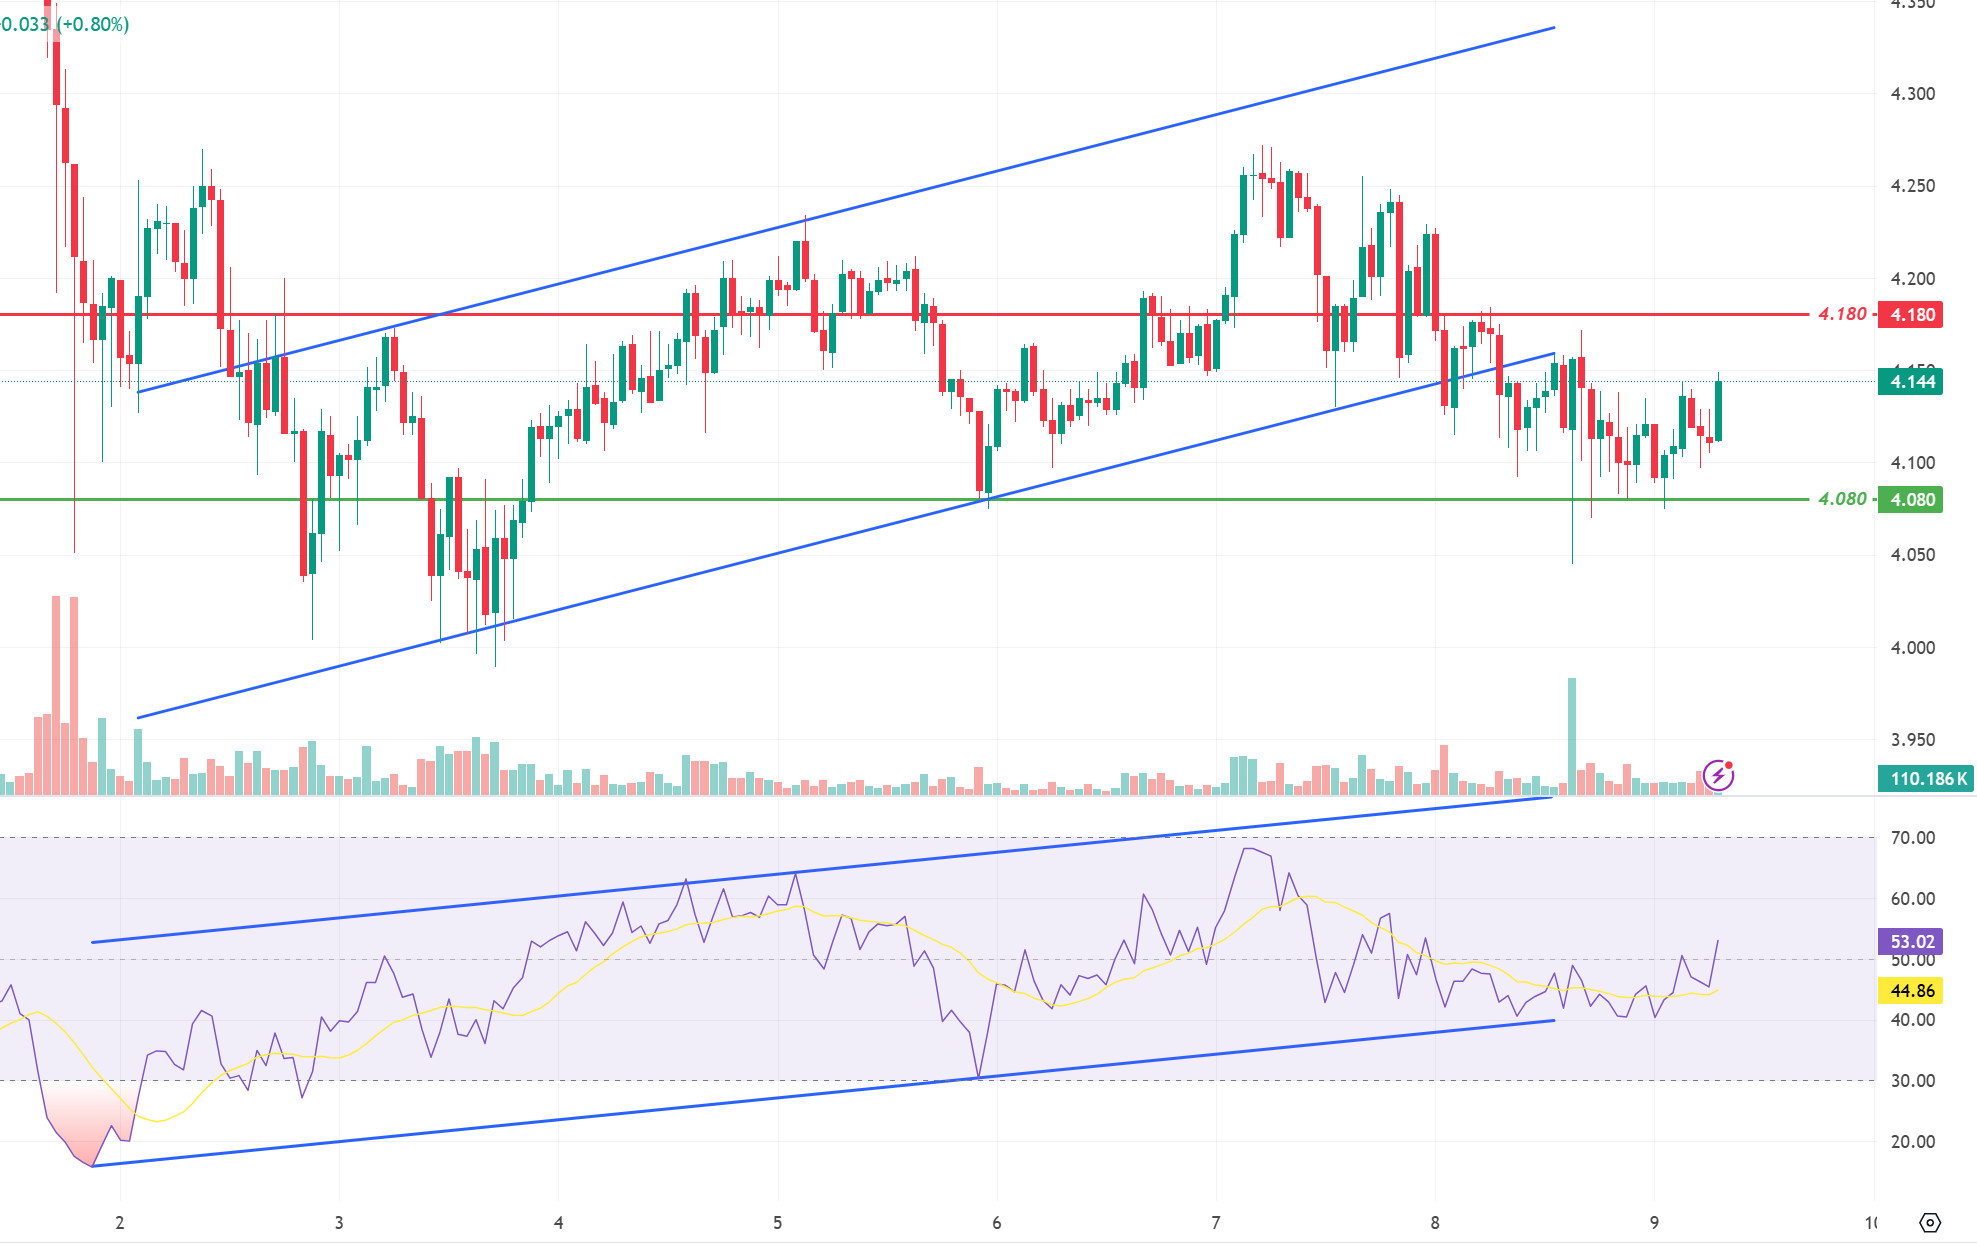
DOT/USDT
On the Polkadot (DOT) chart, the price reacted from the 4.080 support band. Selling at the 4,180 resistance level, DOT reacted from the 4,080 support level and moved back into the channel. When we examine the RSI, we see that it reacted from the lower band of the rising channel. In a positive scenario, the price may break the selling pressure at the 4,180 resistance level and re-enter the rising channel. On the other hand, if the selling pressure at the 4.180 resistance level cannot be broken, the price may retreat towards the first support level of 4.080.
Supports 4.080 – 3.975 – 3.875
Resistances 4.180 – 4.210 – 4.265
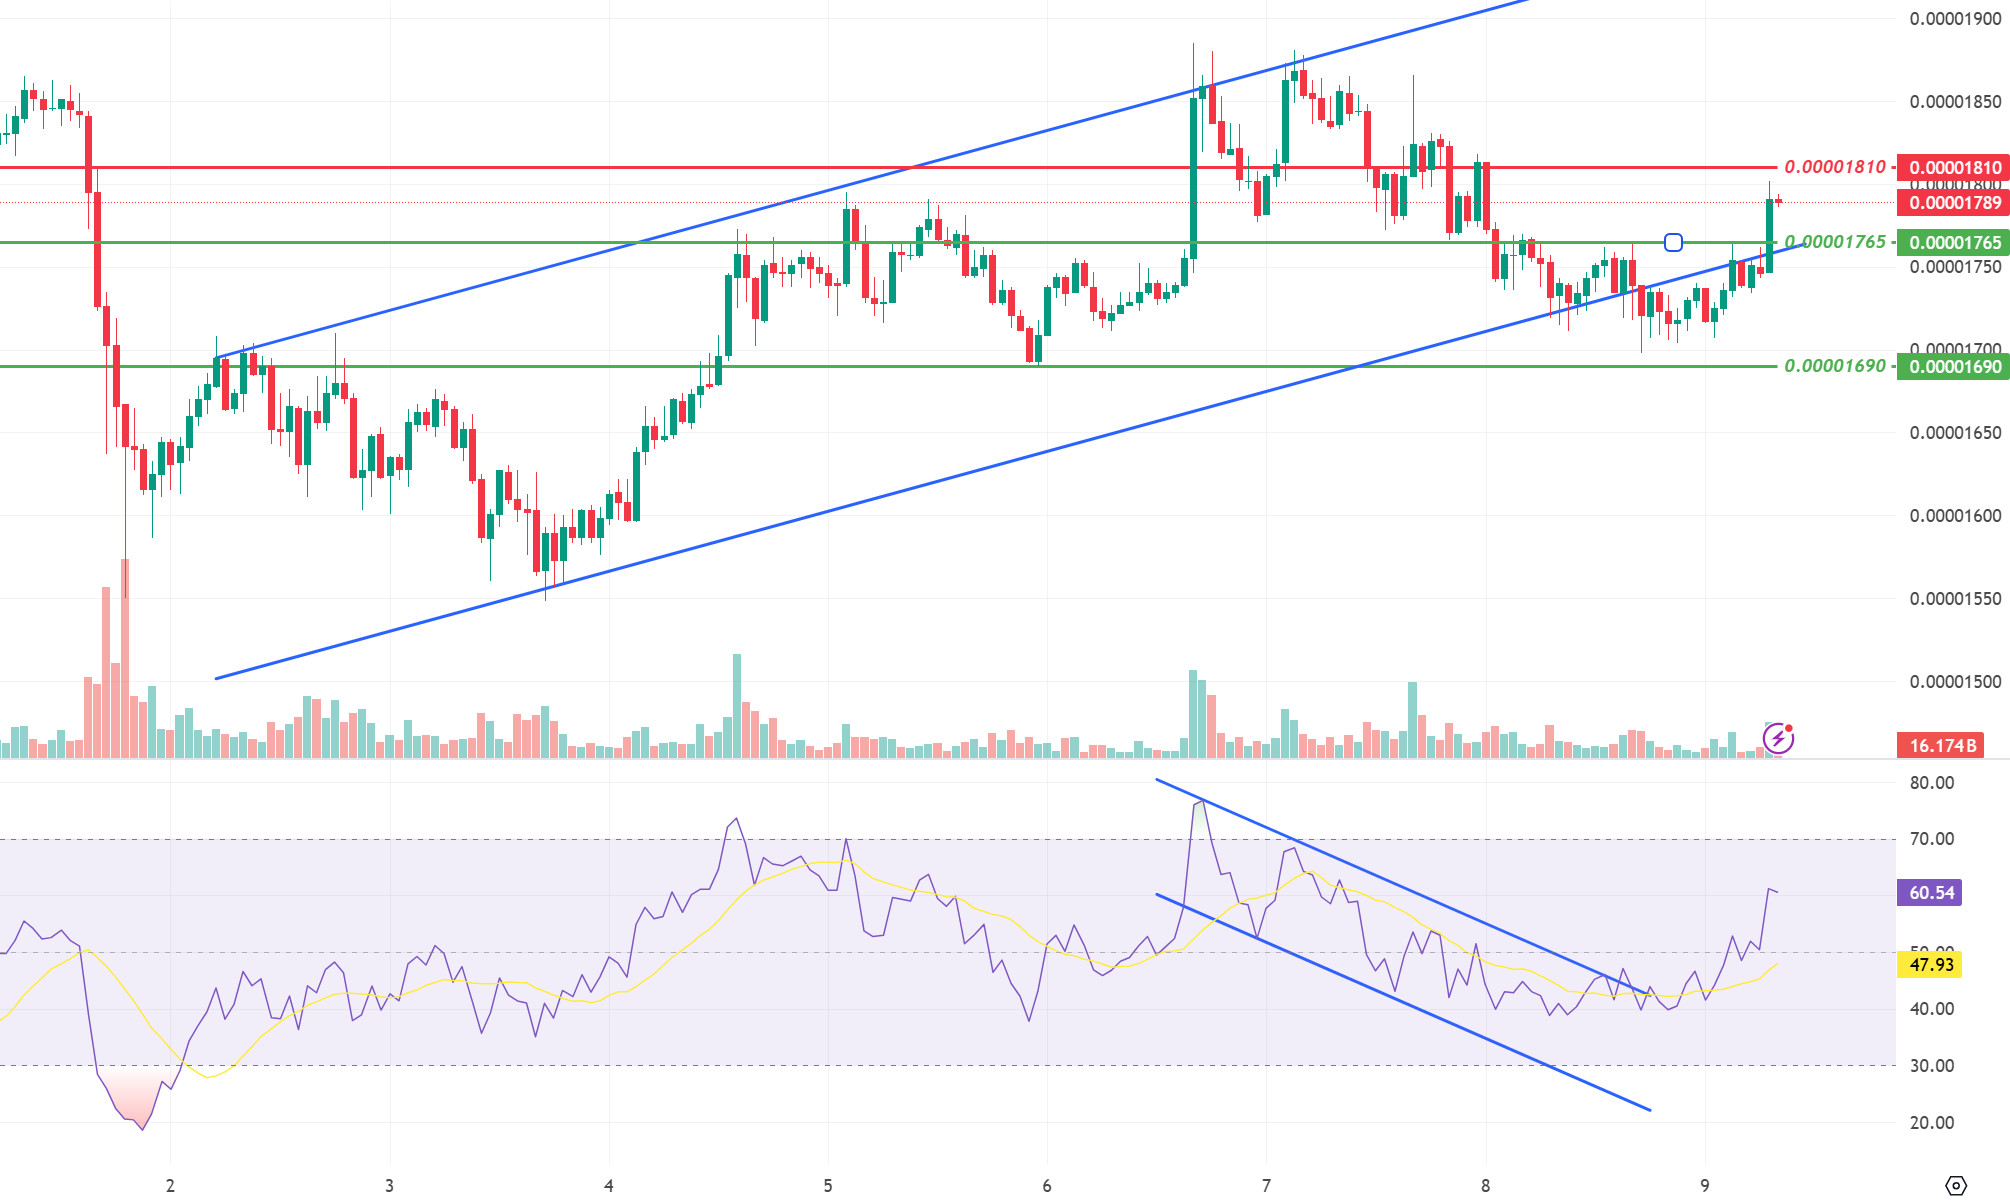
SHIB/USDT
Shiba Inu (SHIB) broke above the 0.00001765 resistance level with the upside break of the RSI descending channel. Moving towards the 0.00001810 level, SHIB continues to move within the ascending channel. If the 0.00001810 resistance level is not exceeded, we may see a retracement towards 0.00001765 levels. On the other hand, if the 0.00001810 level is exceeded, the price may rise towards the next resistance level of 0.00001895.
Supports 0.00001765 – 0.00001690 – 0.00001630
Resistances 0.00001810 – 0.00001895 – 0.00001945
LEGAL NOTICE
The investment information, comments and recommendations contained herein do not constitute investment advice. Investment advisory services are provided individually by authorized institutions taking into account the risk and return preferences of individuals. The comments and recommendations contained herein are of a general nature. These recommendations may not be suitable for your financial situation and risk and return preferences. Therefore, making an investment decision based solely on the information contained herein may not produce results in line with your expectations.
