MARKET SUMMARY
Latest Situation in Crypto Assets
*Prepared on 20.09.2024 at 07:00 (UTC)
WHAT’S LEFT BEHIND
Rate Cut Forecasts from Citi
Analysts at Citi, one of the largest financial institutions in the US, stated that they expect the labor market figures to continue to slow down and that they think this will cause the Fed to cut by 50 basis points once again. Citi analysts, who expect a 50 basis point cut in November, stated that a 25 basis point cut is expected in December, so they predict that 2024 will be completed with a 125-basis point cut in total.
Bank of Japan keeps interest rates unchanged
The Bank of Japan (BoJ) left the policy rate unchanged at 0.25 percent. BoJ announced its decisions after the two-day monetary policy meeting. Accordingly, the short-term interest rate was left unchanged at 0.25 percent with a unanimous decision. In the statement, it was stated that the recovery in Japan’s economy continued and inflationary pressures softened with the decline in import prices but are expected to continue.
Terraform Labs’ Bankruptcy Proceedings Come to an End
Terraform Labs has settled with the SEC and will be liquidated. According to the settlement, the SEC’s $4.4 billion demand will be met only by payments for confirmed receivables and crypto loss claims.
HIGHLIGHTS OF THE DAY
 INFORMATION:
*The calendar is based on UTC (Coordinated Universal Time) time zone. The economic calendar content on the relevant page is obtained from reliable news and data providers.
The news in the economic calendar content, the date and time of the announcement of the news, possible changes in the previous, expectations and announced figures are made by the data provider institutions. Darkex cannot be held responsible for possible changes that may arise from similar situations.
MARKET COMPASS
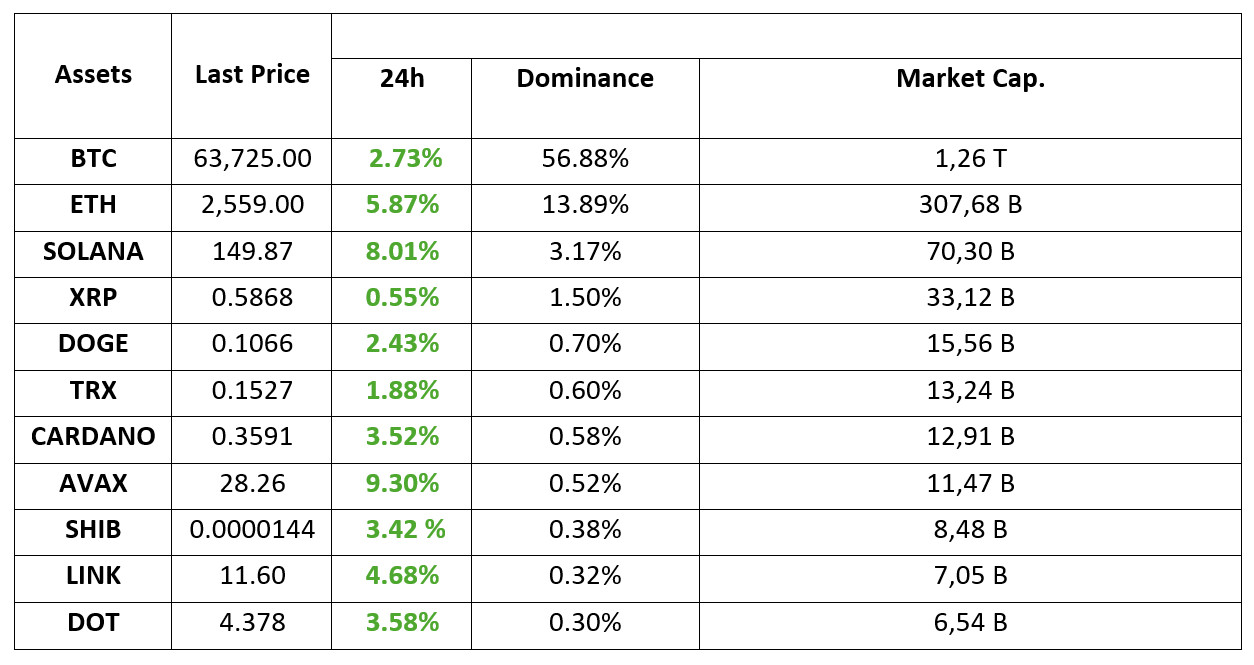
Digital assets gained momentum after the US Federal Reserve’s “jumbo” interest rate cut. We also saw that US stock markets recorded significant rises yesterday. Asian stock markets were also affected. On the last working day of the week for traditional markets, European and US futures contracts point to more conservative openings.
The FED’s big step in the interest rate cut cycle keeps the demand for risky assets alive. On the other hand, the central banks of the UK, Japan and China did not change their interest rates this week. Although the dollar showed a positive movement with crypto assets by showing a tendency to recover for a while after the wounds it received after the FED decisions, it continued to decline as the risk appetite increased the demand for other assets.
The rises in digital assets triggered by macro developments, combined with the specific news flows of these assets, also contributed to the rises. There was also a significant amount of short liquidation in Bitcoin. Ethereum and Solano stood out in this respect.
It’s been a week of smiling faces for crypto investors. As we shared in our analysis yesterday evening, our expectation that the uptrend will continue for a while was realized during the Asian session. While we think there is still some room for upside movement, we see the possibility of a correction on Friday. It would not be surprising to see downward-horizontal price changes for a while at the end of the week after the rises are limited, in line with the classic market movement after the important news flows are left behind.
TECHNICAL ANALYSIS
BTC/USDT
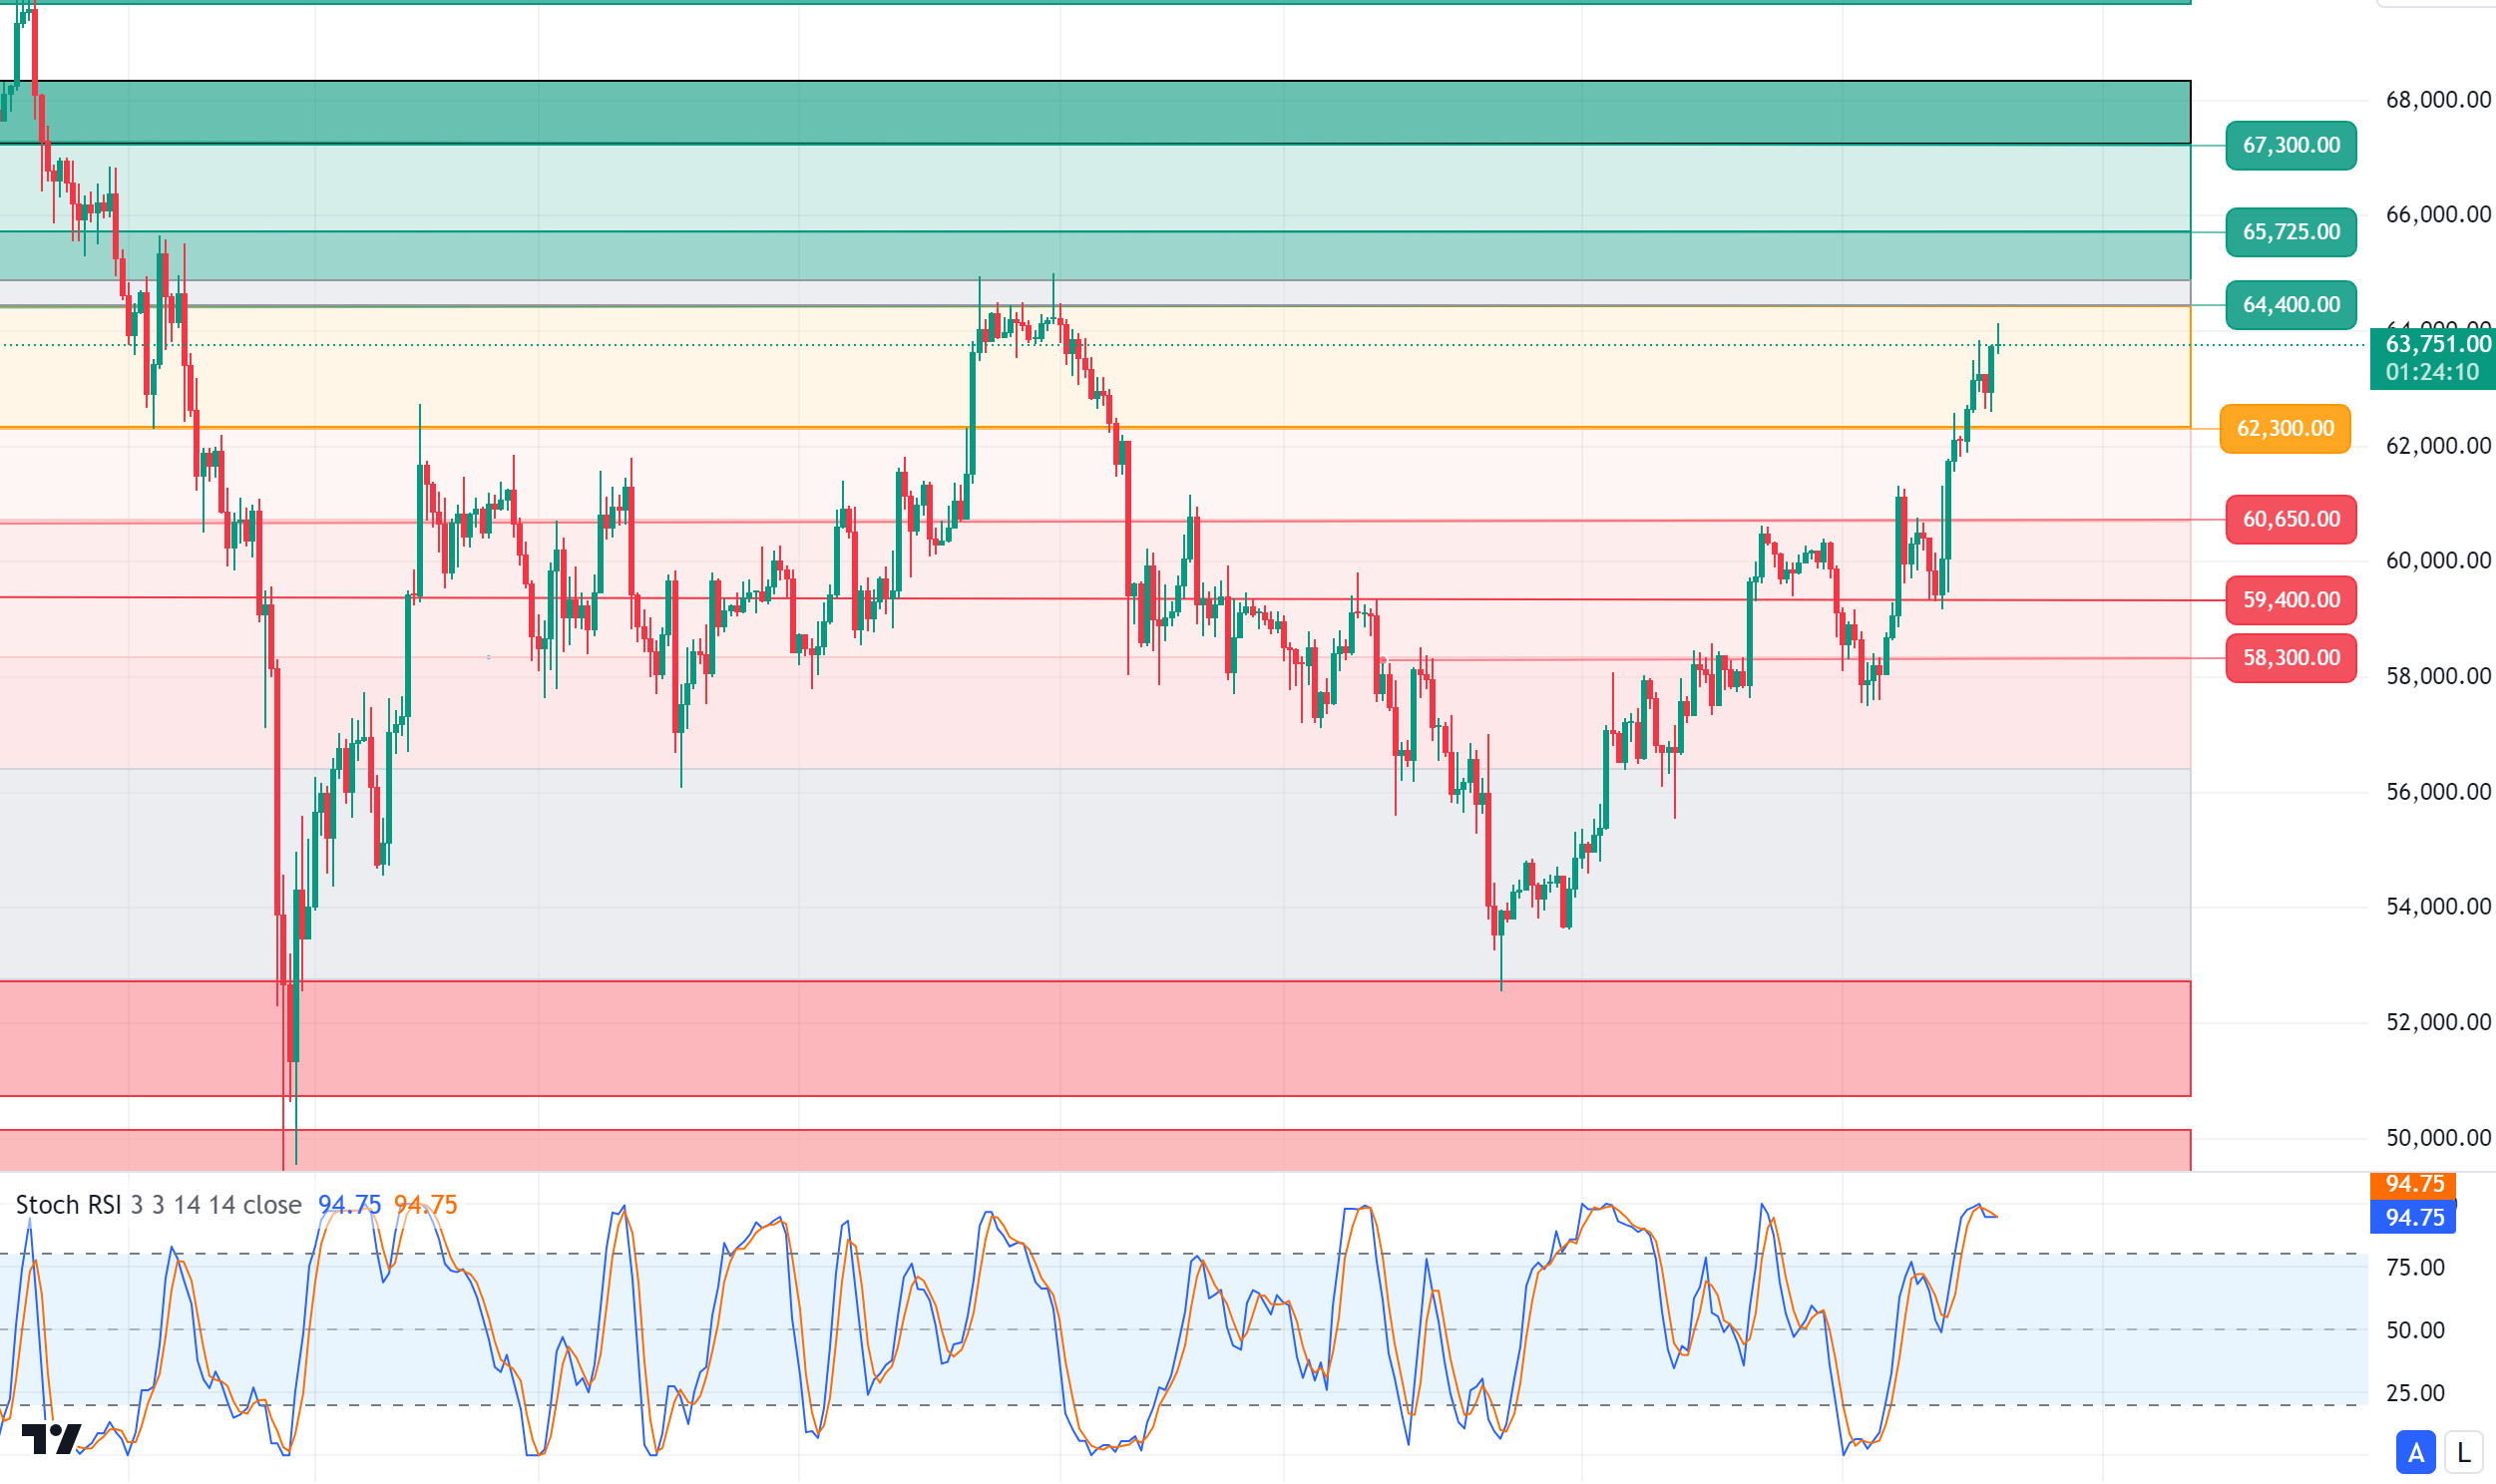
Strong stance from Bitcoin! With the FED starting to cut interest rates, the crypto market started to breathe. Bitcoin, which entered a downtrend, started a new uptrend with the discount. The fact that interest rate cuts will continue seems to continue to shed light on the market for the future. Another development that reinforced the positive atmosphere in the market was that the central bank of Japan changed its interest rate stance and decided to keep the policy rate constant. Previously, the surprise interest rate hike by the Japanese central bank had led to deeper declines in the Bitcoin market. Finally, significant ETF flows with the interest of institutional investors give us important messages about the future of Bitcoin. In the BTC 4-hour technical analysis, we observe that the price is approaching the 64,000 level by exceeding the 62,300 level, which was previously seen as resistance. Although technical indicators are signaling a correction, positive developments are contributing to the price staying strong. If the resistance level of 64,400 is tested, a correction may come from here. In a possible pullback, the 62,300 level will be an important support point.
Supports 62,300 – 60,650 – 59,400
Resistances 64,450 – 65,725 – 67,300
ETH/USDT
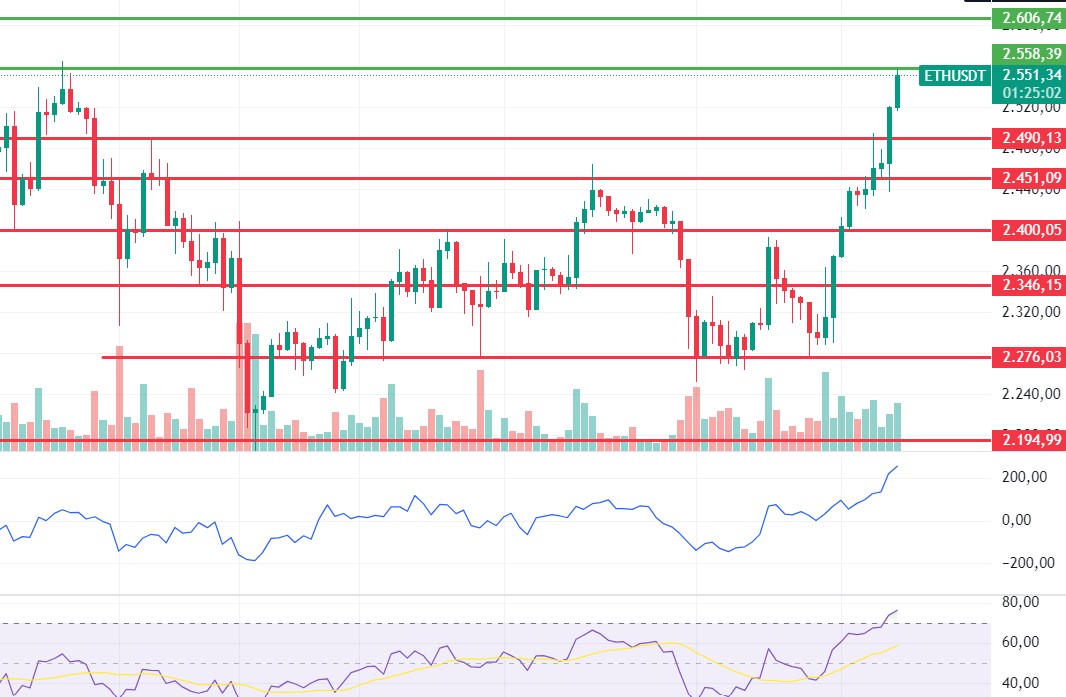
The positive outlook continues for Ethereum, which rose to 2,558 as expected. Although the RSI is in the overbought zone, a further rise can be expected with the positive outlook in momentum. With the 2,558-level exceeded, we can see a rapid rise in the price to 2,606 and then to 2,669, which is the most important main resistance level and also the cloud bottom resistance level on the daily timeframe. The 2,490 level stands out as the first support point. A re-test to the 2,450 level may come on closes below this level.
Supports 2,490 – 2,451 – 2,400
Resistances 2,558 – 2,606 – 2,669
LINK/USDT
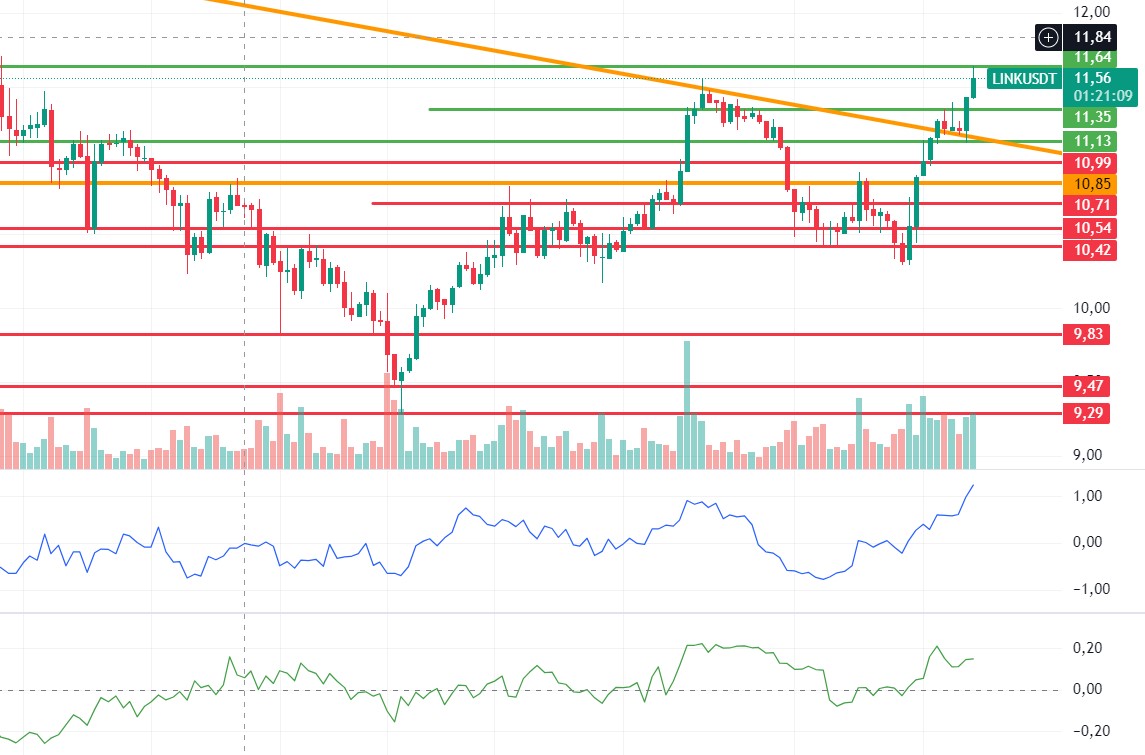
LINK retreated a bit, rising to the 11.64 level we had previously set with the rise at night. With the rise in momentum and the positive outlook in CMF, it seems possible that the upward pricing will continue during the day. It can also be said that the positive structure is strengthening with the break and re-test of the trend. Closures below 11.35 may bring declines to 11.13.
Supports 11.13 – 10.85 – 10.54
Resistances 11.35 – 11.64 – 12.19
SOL/USDT
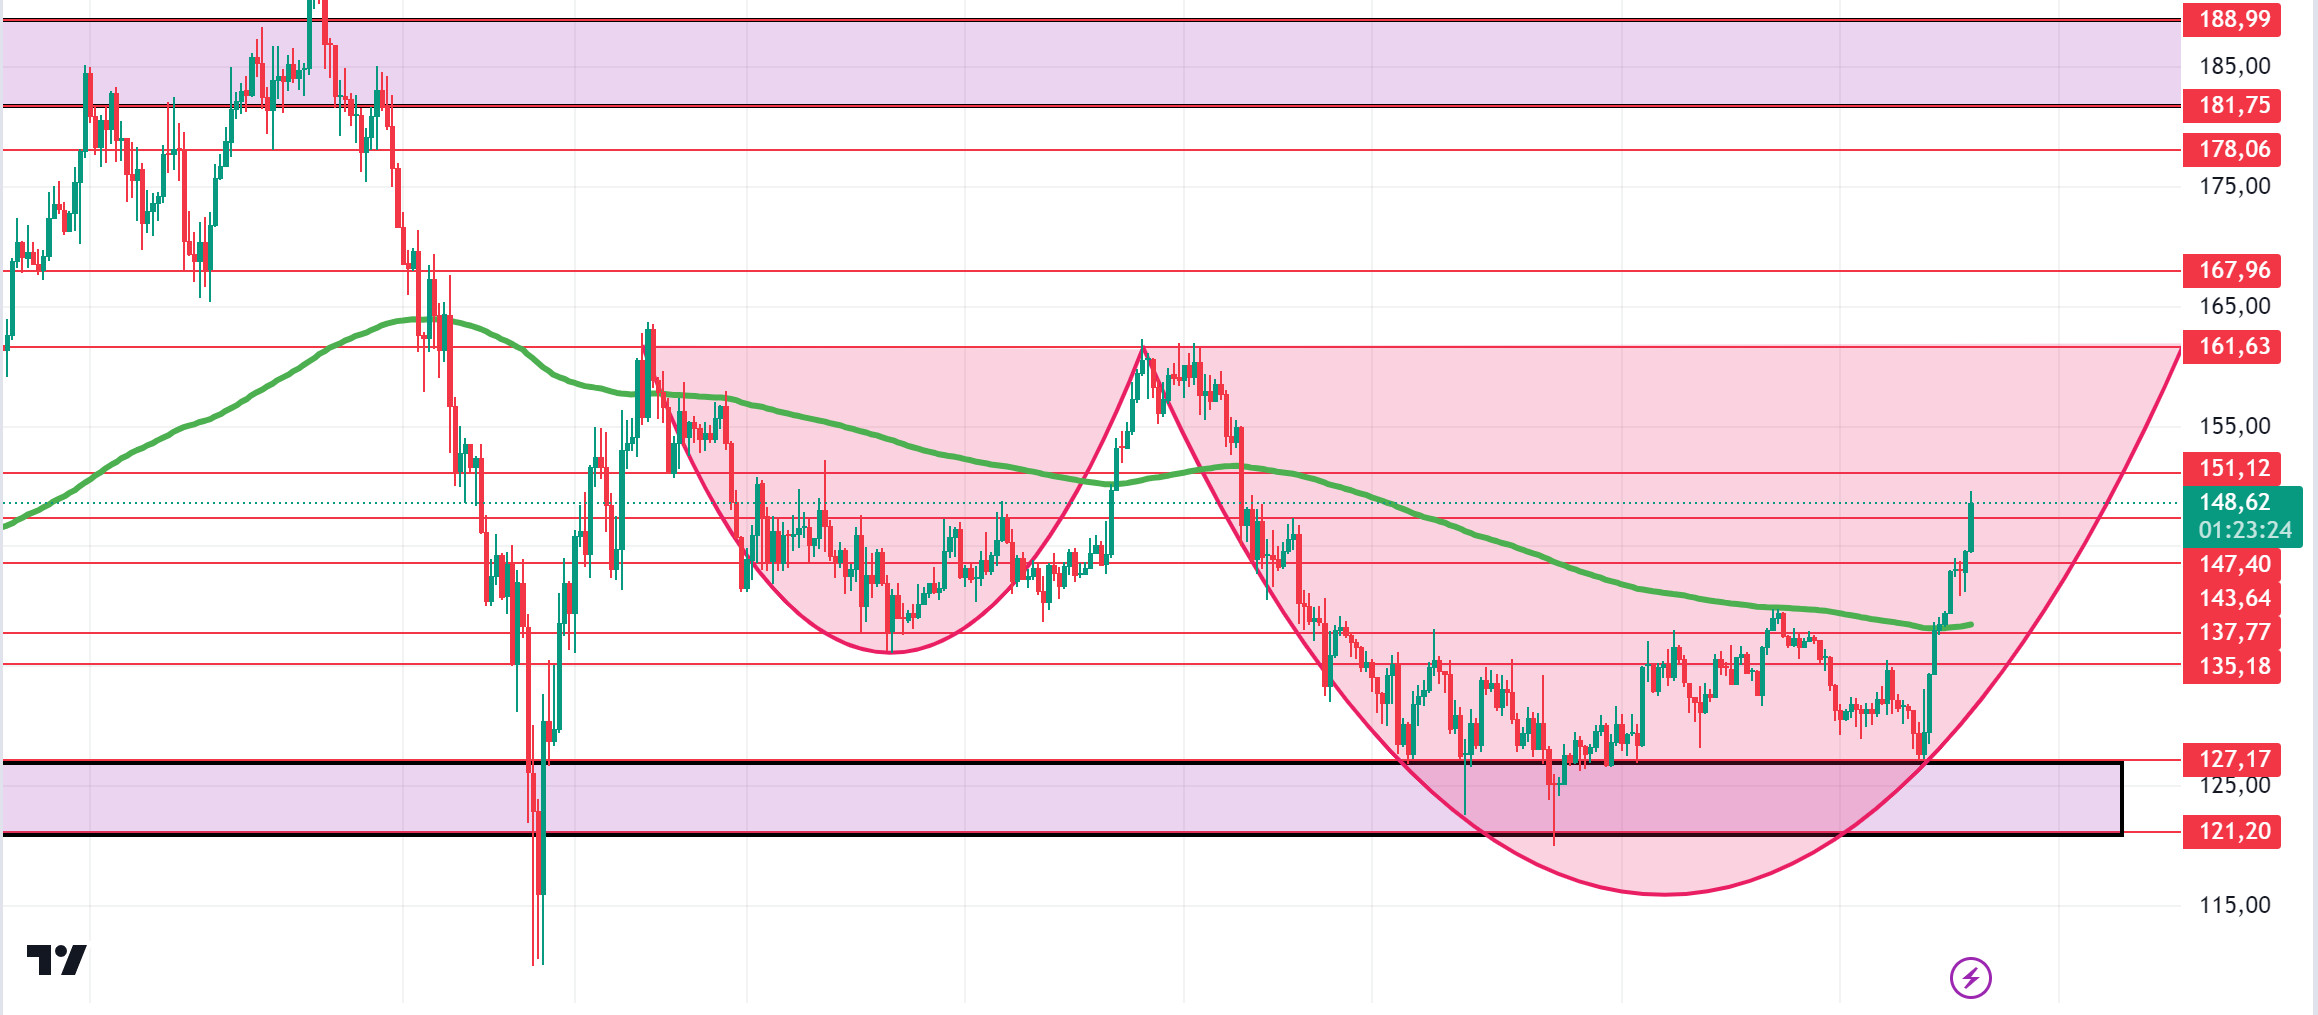
BoJ announced its decision after the monetary policy meeting. Accordingly, the short-term interest rate was left unchanged at 0.25 percent with a unanimous decision. In the Solana ecosystem, Solana Mobile, the phone manufacturing unit of Solana Lab, introduced its newest phone “Seeker” and collected pre-orders. So far, more than 140,000 pre-orders have been received in 57 countries. Key features of Seeker include Seed Vault Wallet, the mobile-first crypto wallet integrated with Seed Vault for seamless web3 experiences. Developed specifically for Seeker in collaboration with Solflare, the wallet offers two-touch transactions and simplified account management. Meanwhile, blockchain storage layer Xandeum announced today that it will unveil its plan to scale Solana storage at Breakpoint 2024. This will allow dapps to scale with access to virtually unlimited storage. Technically speaking, SOL price has increased by over 7.78% in the last 24 hours. Also, the Fed rate cuts are likely to help the token break the consolidation it has been sustaining since around April. The token is on the verge of hitting around $150, but a profit sell-off may prevent it from breaking the consolidation zone yet. On the other hand, a cup-and-handle pattern is likely to form on the 4-hour chart. Both macroeconomic conditions and innovations in the Solana ecosystem, 151.12 – 161.63 levels appear as resistance levels. If it rises above these levels, the rise may continue. It can support the 200 EMA average in the pullbacks that will occur if investors make profit sales. 147.40 – 143.64 levels can be followed as support. If it comes to these support levels, a potential rise should be followed.
Supports 137.77 – 135.18 – 129.28
Resistances 143.64 – 147.40 – 151.12
ADA/USDT
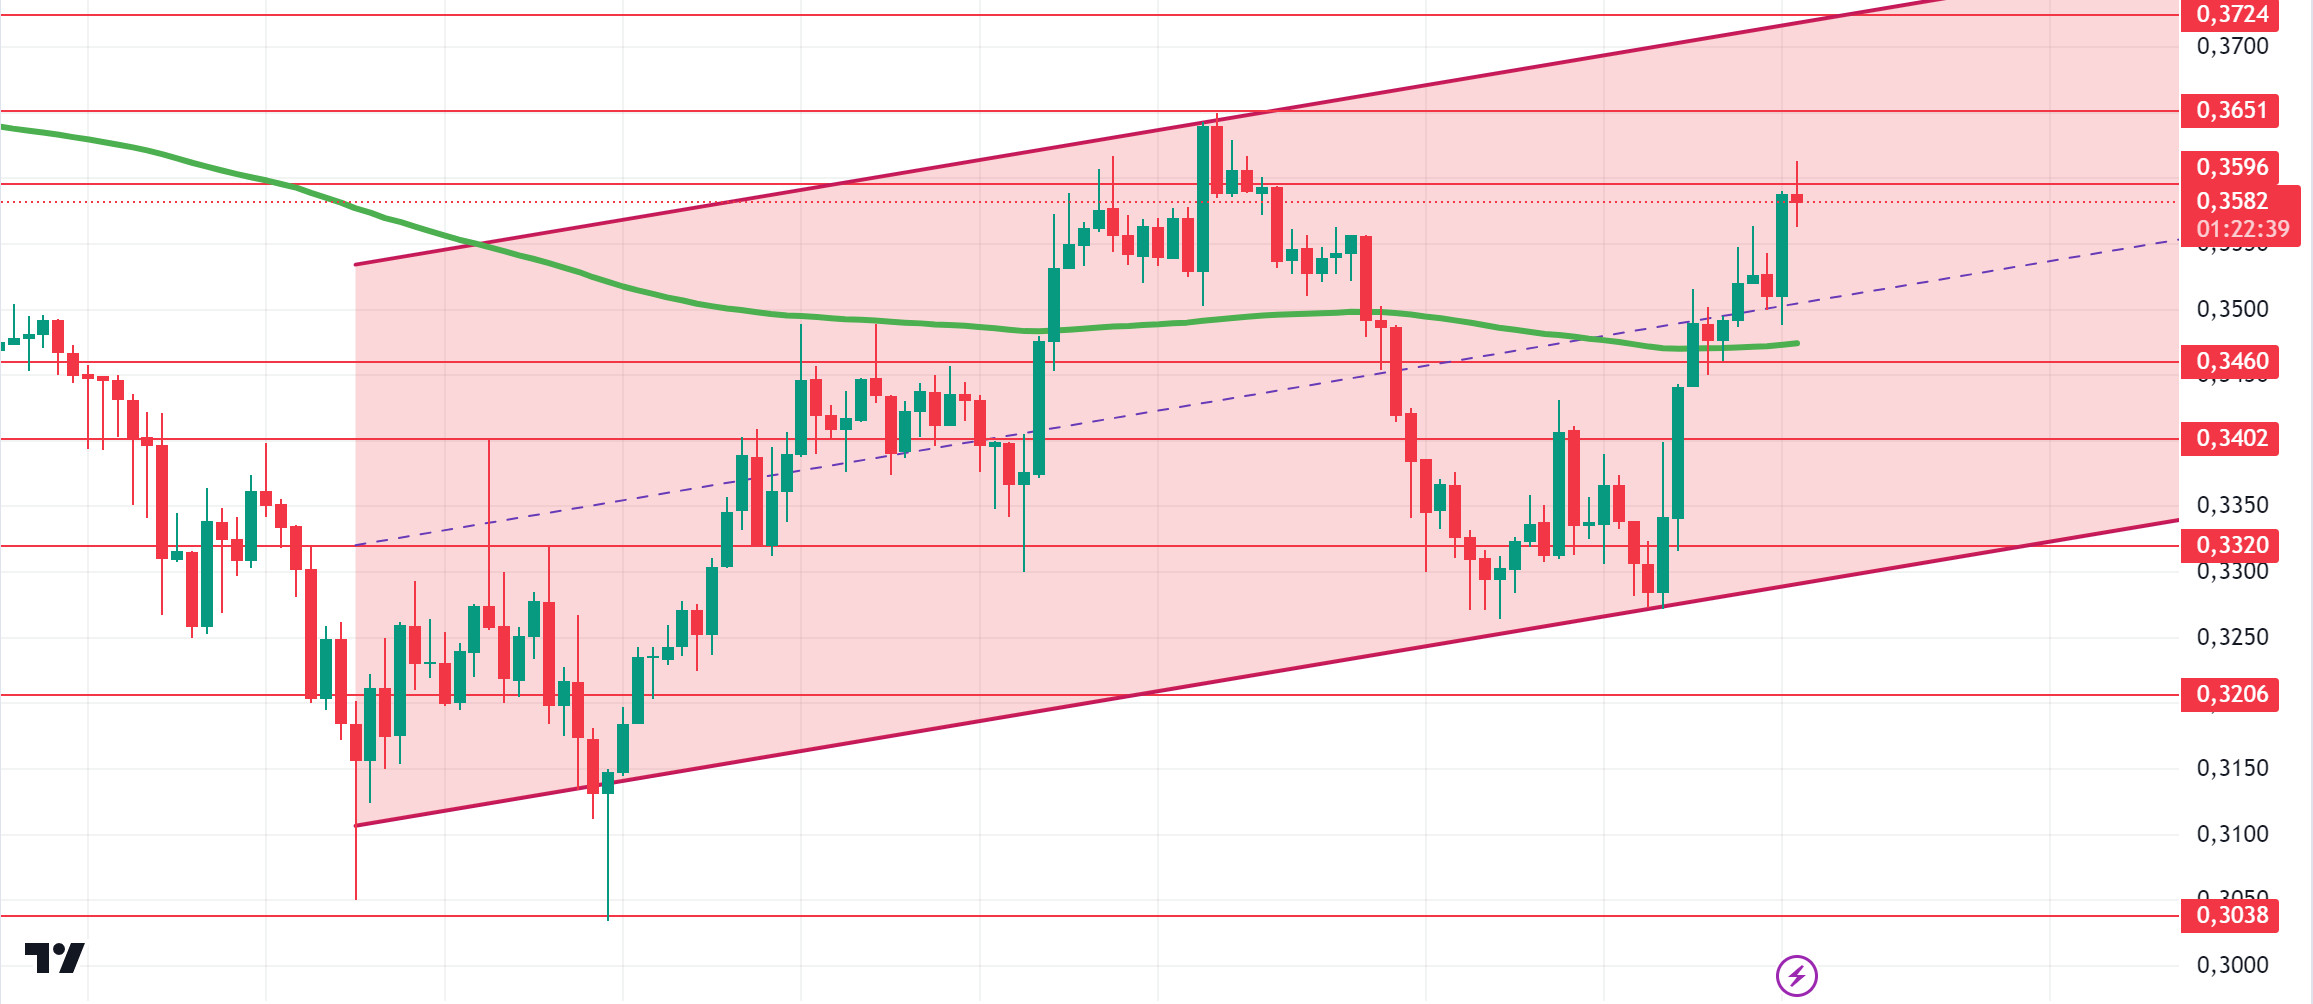
BoJ announced its decision after the monetary policy meeting. Accordingly, the short-term interest rate was left unchanged at 0.25 percent with a unanimous decision. In the Cardano ecosystem, founder Charles Hoskinson will meet with Argentine President Javier Milei in October to discuss the role of blockchain in shaping future economies. On the other hand, Cardano recorded a huge growth with over 70,000 new smart contracts in 2024. When we look technically, ADA, which is priced with bullishness, increased by 2.96% in the last 24 hours. With this increase, it is priced from the upper zone of the rising channel formed since September 4. In retracements due to possible profit sales, 0.3460 – 0.3402 levels appear as support. As the interest rate cut continues to be priced in, 0.3596 – 0.3651 levels can be followed as resistance levels in the rises that will take place with the continuation of the positive atmosphere.
Supports 0.3460 – 0.3320 – 0.3288
Resistances 0.3596 – 0.3651 – 0.3724
AVAX/USDT
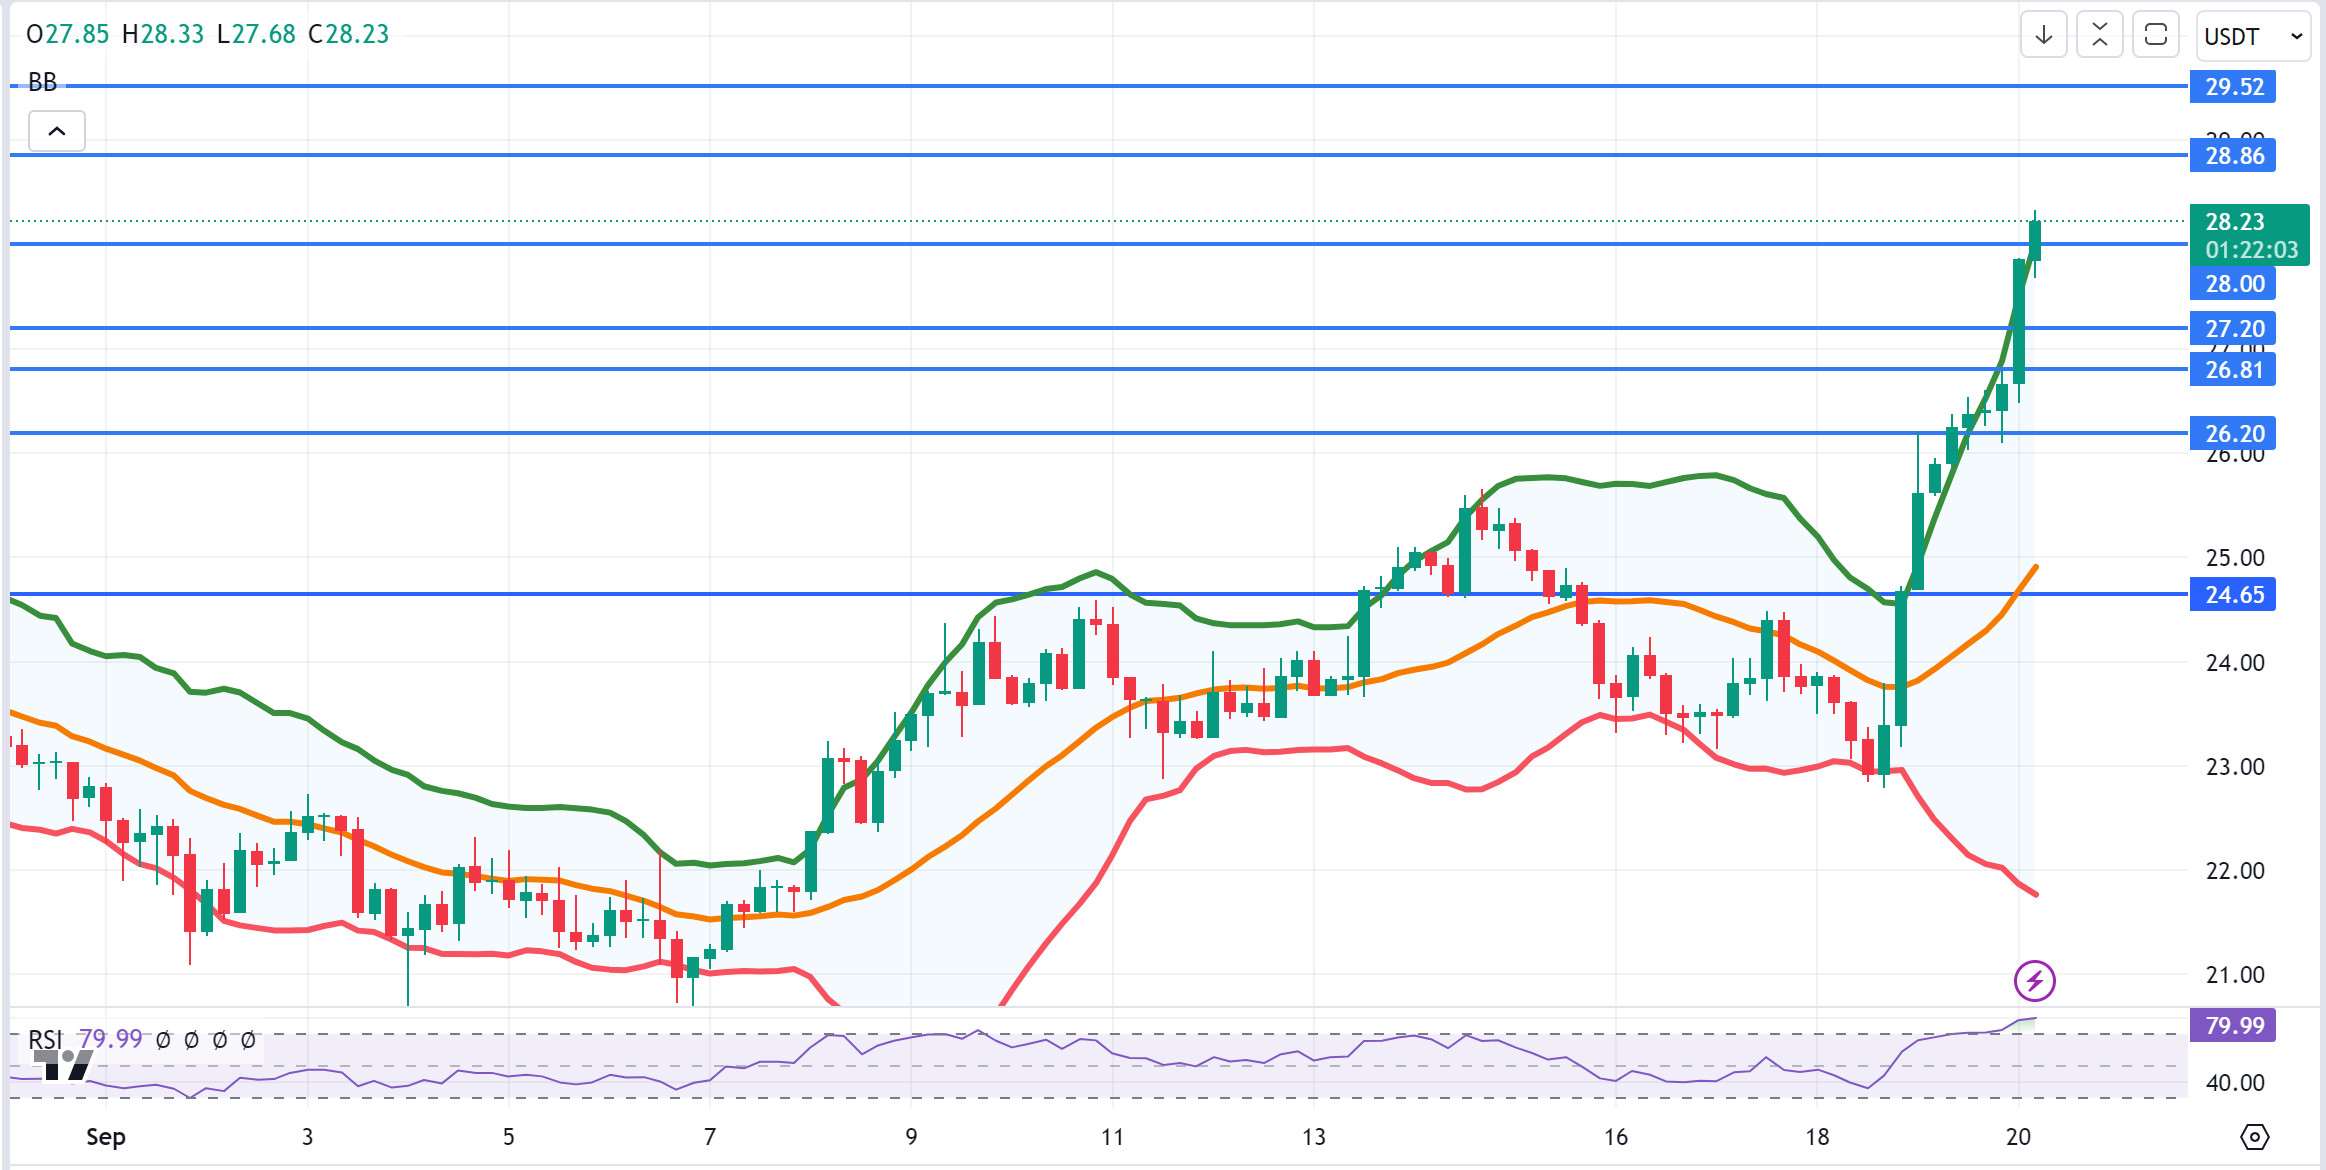
AVAX, which opened yesterday at 24.70, rose by about 8% during the day and closed the day at 26.66. Today, it continued to rise after the decision of the central bank of Japan to leave interest rates unchanged and is currently trading at 28.23.
On the 4-hour chart, it has risen above the Bollinger upper band. AVAX, which is in the overbought zone with RSI 80, may receive a sales reaction from these levels. It is currently trying to break the 28.00 resistance. If it fails to close above this support, it may test the supports of 27.20 and 26.81. With the candle closure above 28.00 resistance, it may want to test 28.86 resistance by making some more upside. As long as it stays above 24.65 support during the day, the desire to rise may continue. With the break of 24.65 support, selling pressure may increase.
Supports 27.20 – 26.81 – 26.20
Resistances 28.00 – 28.86 – 29.52
TRX/USDT
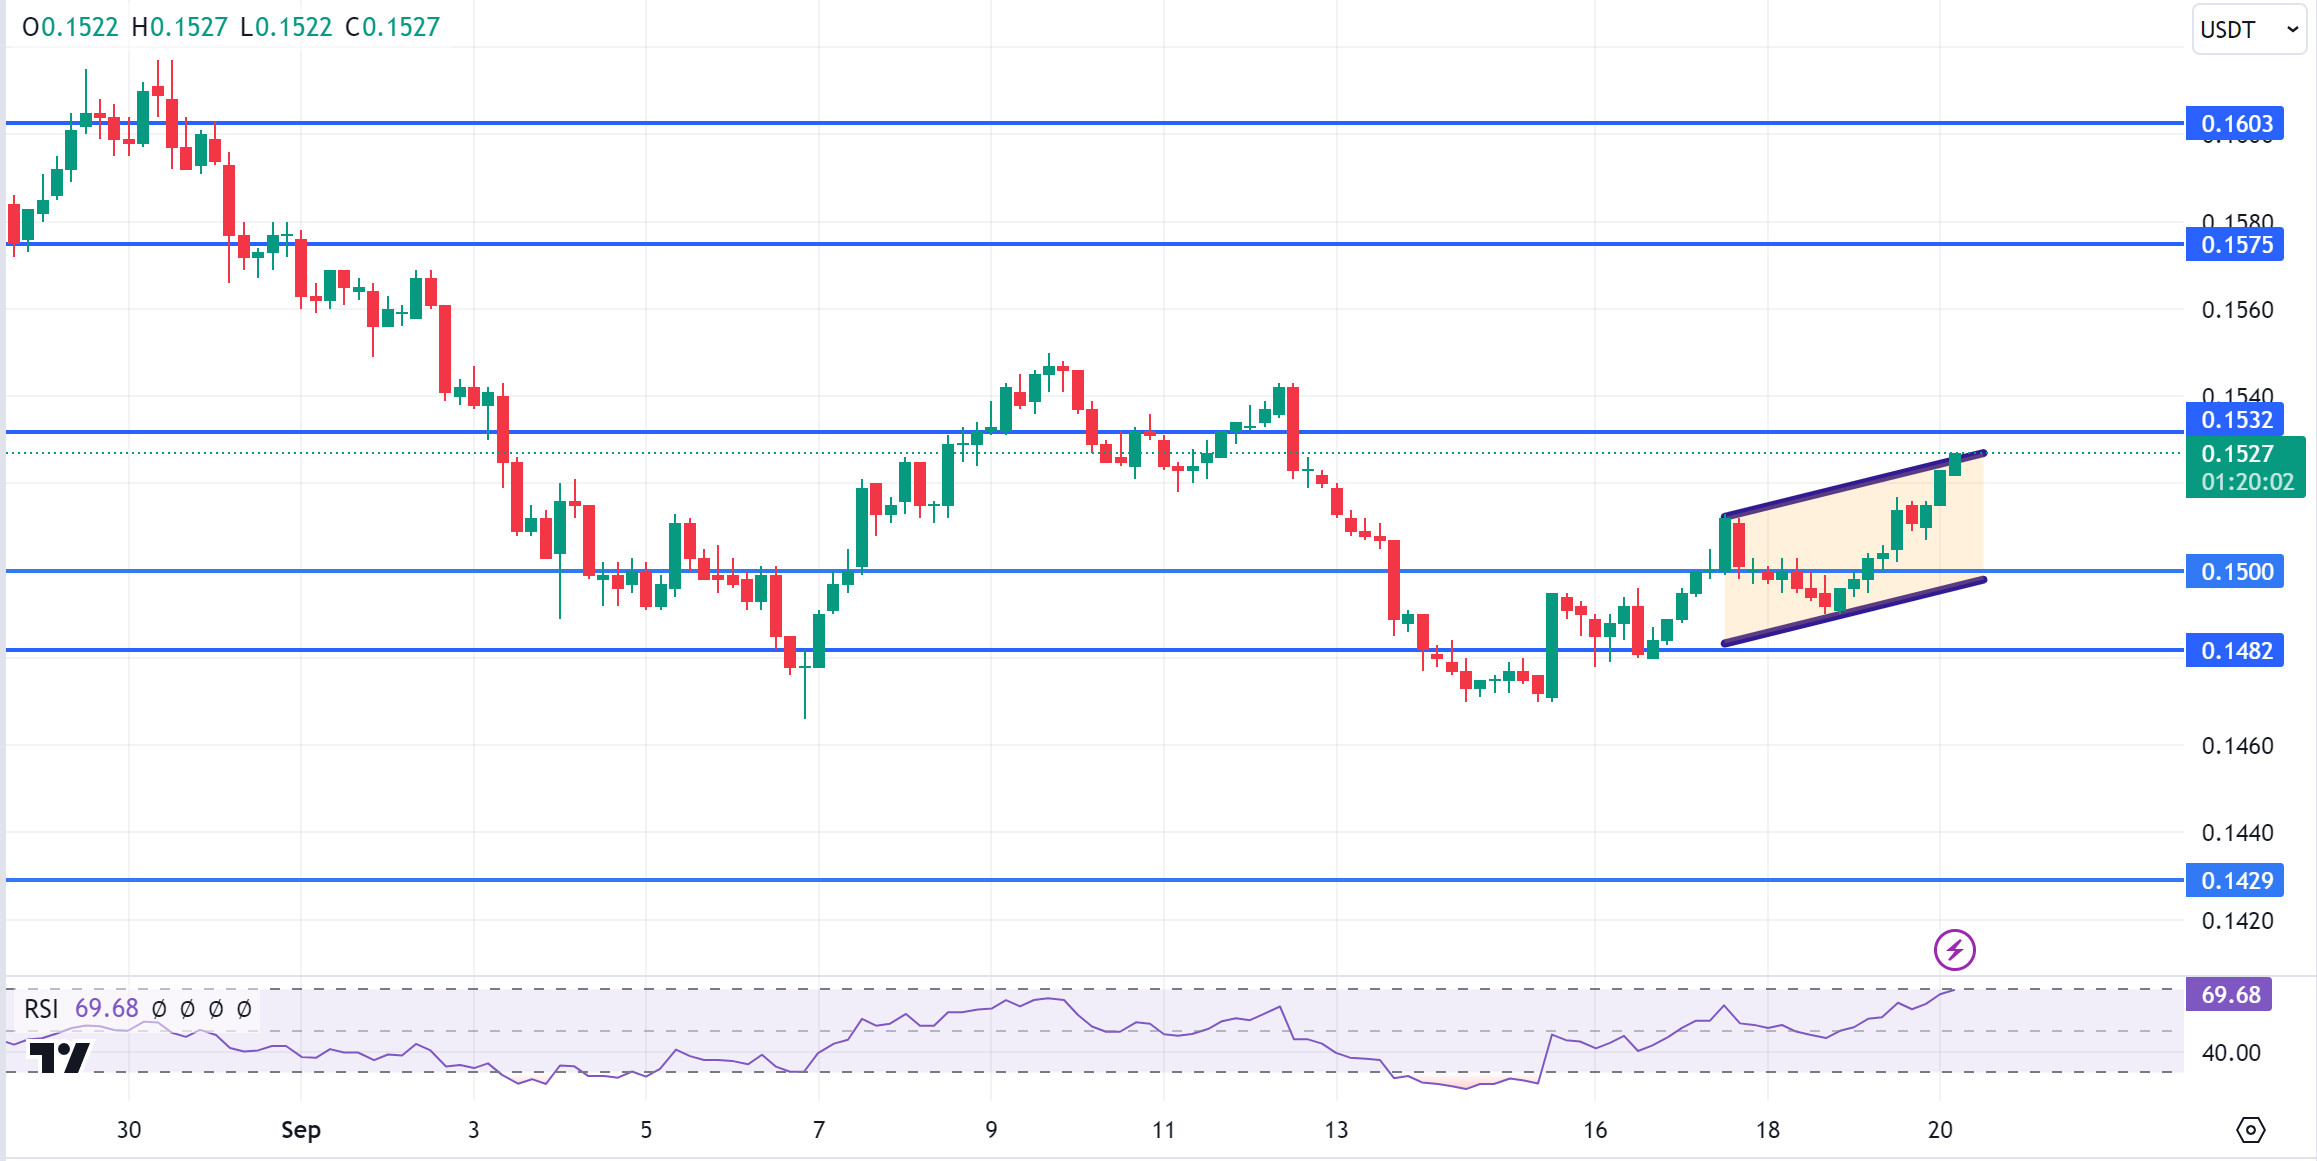
TRX, which started yesterday at 0.1496, closed the day at 0.1515. The central bank of Japan announced that it left the interest rate unchanged in the early hours of the morning and this decision had a positive impact on the FED market and TRX. It is currently trading at 0.1527 and moving within the ascending channel on the 4-hour chart. The RSI is in the overbought zone with a value of 70 and in the upper band of the rising channel and a selling reaction can be expected from here. In such a case, it may move to the lower band of the channel and test the 0.1500 support. If it breaks the channel upwards with volume purchases from the upper band of the channel, it may want to test the 0.1575 resistance by passing the 0.1532 resistance. TRX may continue to be bullish as long as it stays above 0.1482 support. If this support breaks down, sales can be expected to increase.
Supports 0.1500 – 0.1482 – 0.1429
Resistances 0.1532 – 0.1575 – 0.1603
XRP/USDT
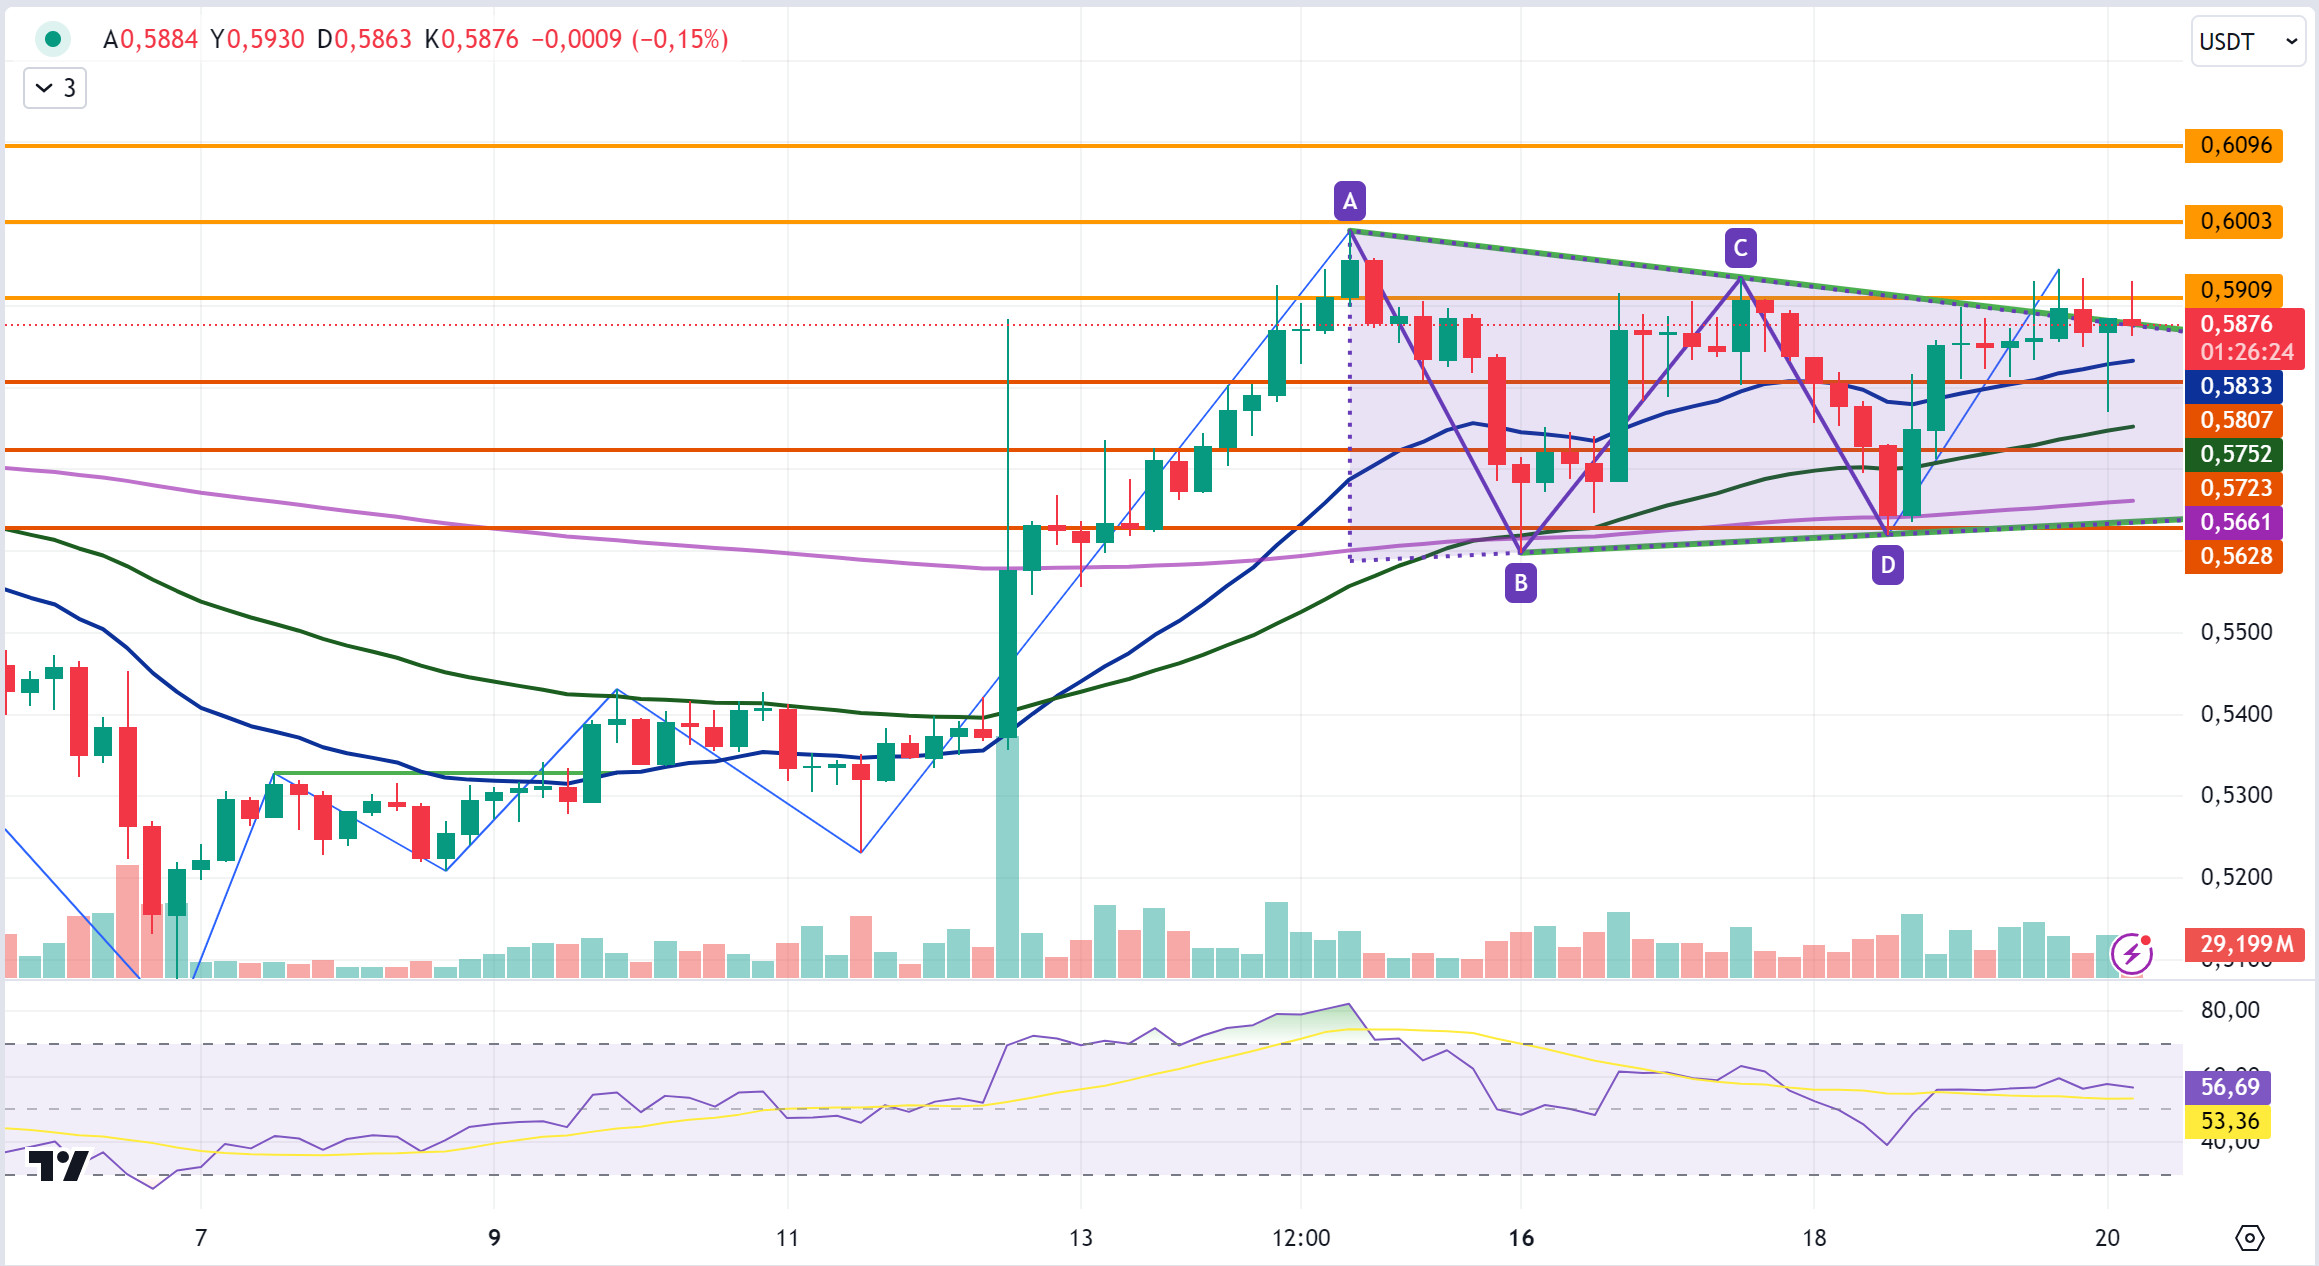
Yesterday, the daily close was realized at 0.5867. When we analyses the 4-hour analysis, XRP continues to trade at 0.5876 in a horizontal band with purchases and sales after the decline and rise it experienced. XRP fell into a triangle pattern after testing and failing to break the 0.5909 resistance level more than once in its rise. XRP is currently trading at the border in the upper region of the triangle pattern and if it breaks the triangle pattern and the 0.5909 resistance level upwards, it may test the 0.6003-0.6096 resistance levels with the continuation of the uptrend. On the contrary, if it cannot break these levels and declines with the sales that may come, it will retest the 0.5807 support level and if it breaks it, it may test the 0.5723-0.5628 support levels in the continuation of the decline.
If XRP breaks the triangle pattern and the 0.5909 resistance level with its rise, the upward momentum may increase and may offer a long trading opportunity. On the contrary, if the 0.5909 resistance level cannot be broken, it may decline with possible sales and may offer a short trading opportunity. When it falls, it may rise with the purchases that may come at the EMA20 and 0.5807 support level.
EMA20 (Blue Line) – EMA50 (Green Line) – EMA200 (Purple Line)
Supports 0. 5807 – 0.5 723 – 0.5628
Resistances 0.5909 – 0.6003 – 0.6096
DOGE/USDT
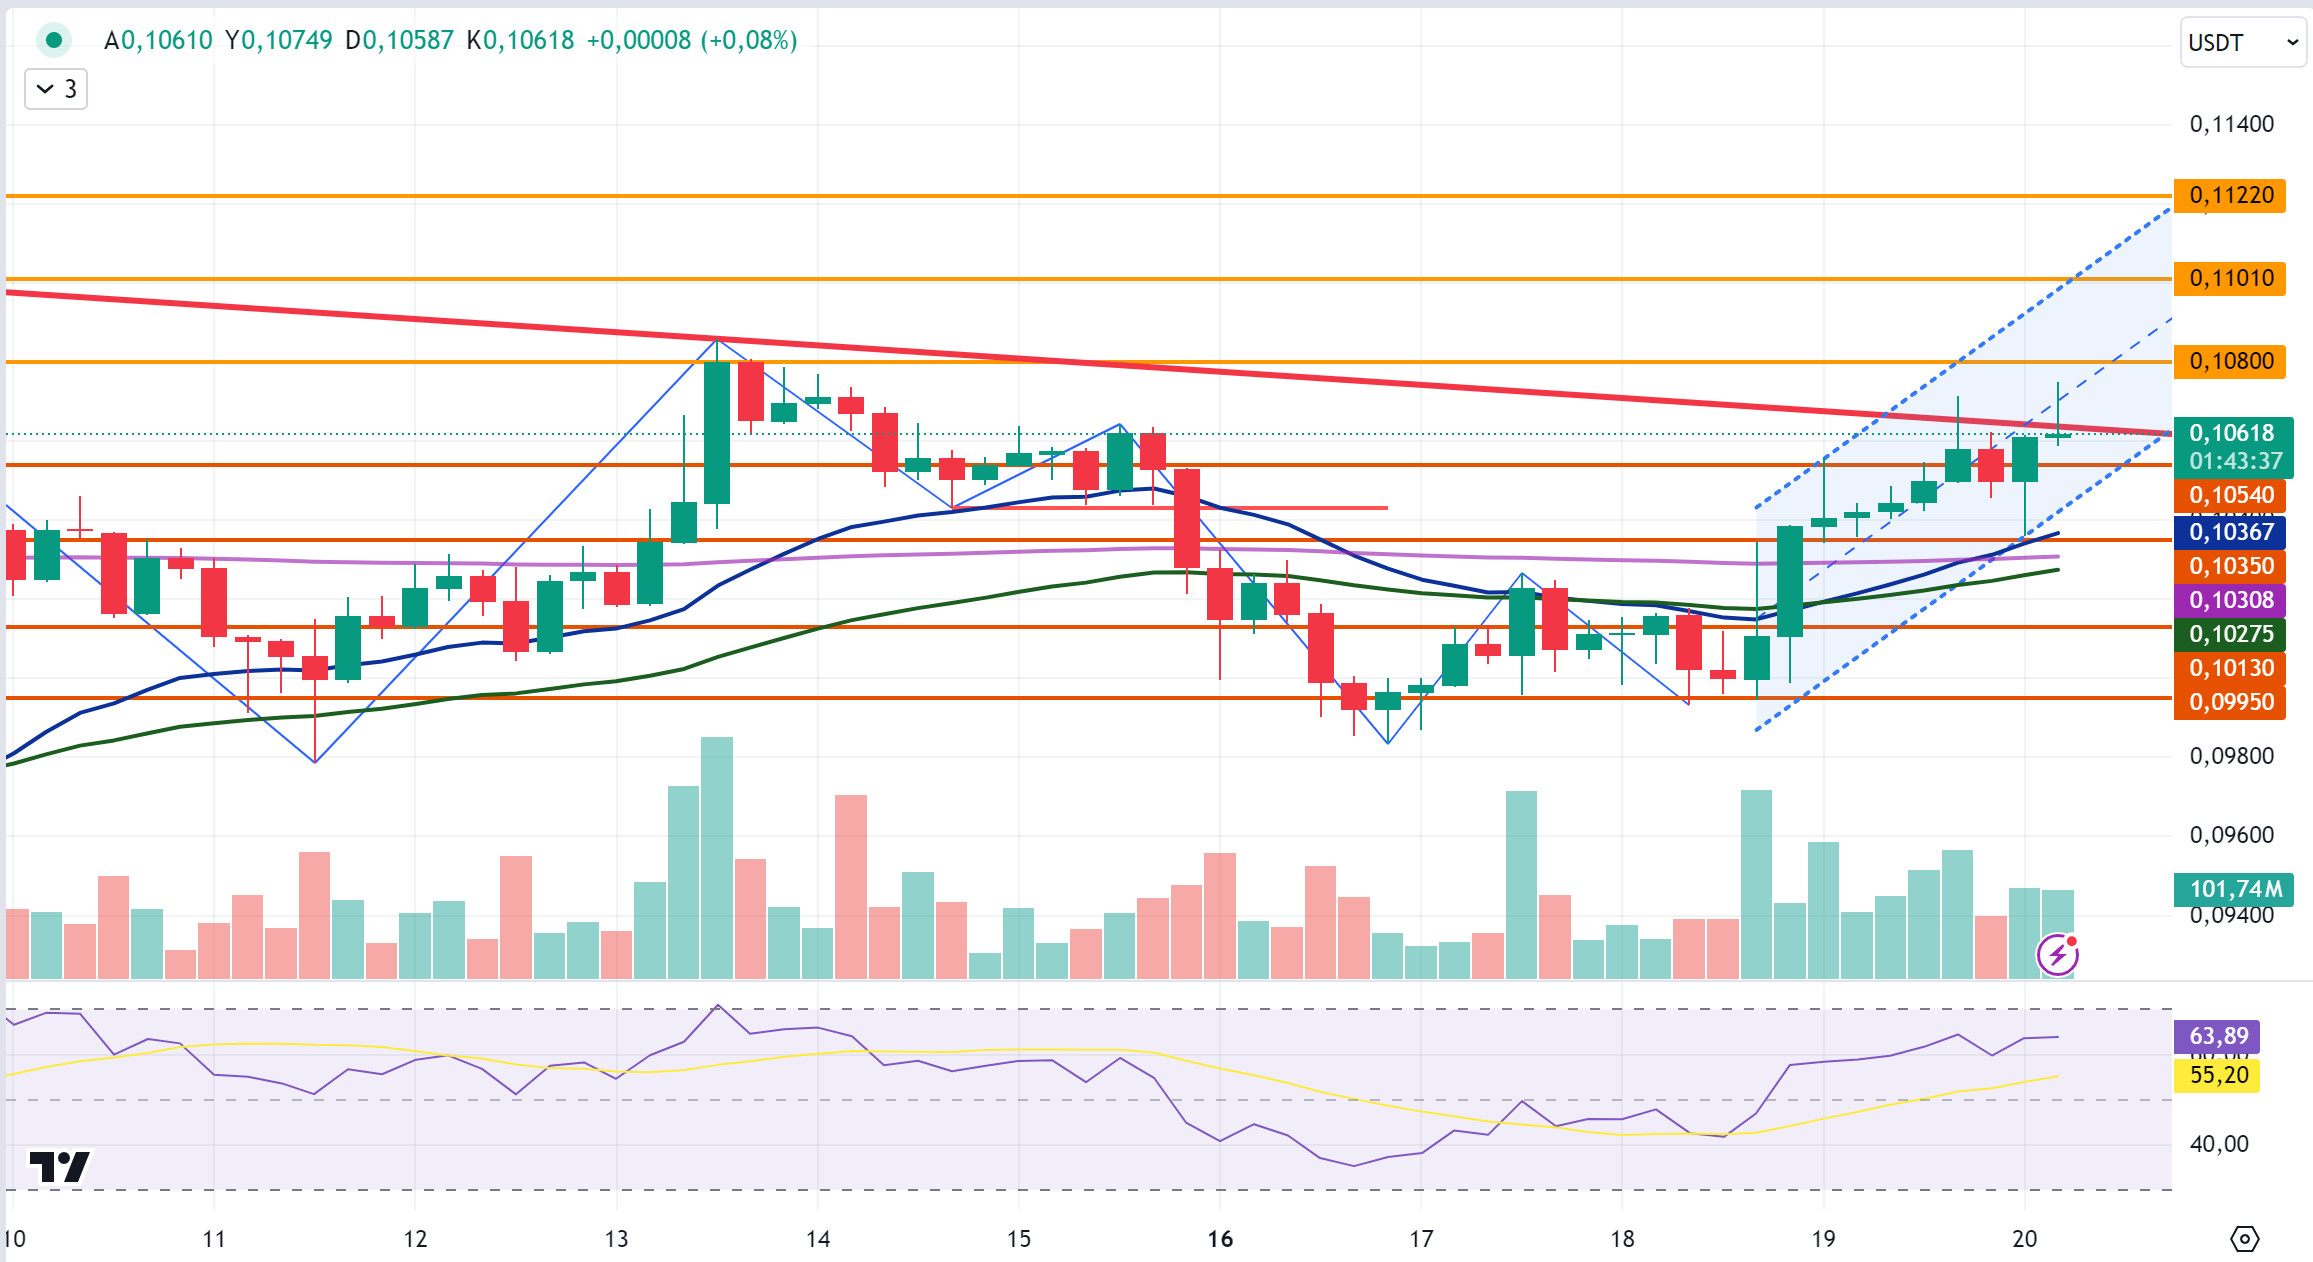
The rise in the crypto market after the US interest rate decision was seen in DOGE yesterday. DOGE, which was in an uptrend yesterday, declined at the closing candle in the 4-hour analysis and its daily close was at 0.1049. Today, DOGE, which fell to 0.1035 with a decline in the opening candle, rose with the incoming purchases and closed the opening candle at 0.1060 with a 1% increase in value after the Japanese interest rate decision. In the 4-hour analysis, DOGE, which continued to rise in the last candle today, rose as high as 0.1074, then declined with incoming sales and is currently trading at 0.1061. DOGE, which is traded in the ascending channel, may test the resistance levels of 0.1080-0.1101-0.1122 if the rise continues. Otherwise, it may test the support levels of 0.1054-0.1035-0.1013 if it declines with possible sales.
EMA20 (Blue Line) – EMA50 (Green Line) – EMA200 (Purple Line)
Supports 0.1035 – 0.1013 – 0.0995
Resistances 0.1054 – 0.1 080 – 0.1109
DOT/USDT
Polkadot has introduced a new feature called Agile Coretime to improve network efficiency. This feature, introduced as part of the Polkadot 2.0 updates, replaces the old static auction system with a dynamic model that allows resources to be adjusted according to demand. This innovation aims to make more efficient use of network resources and lower the barriers to entry for projects, so that smaller projects can participate with less collateral.
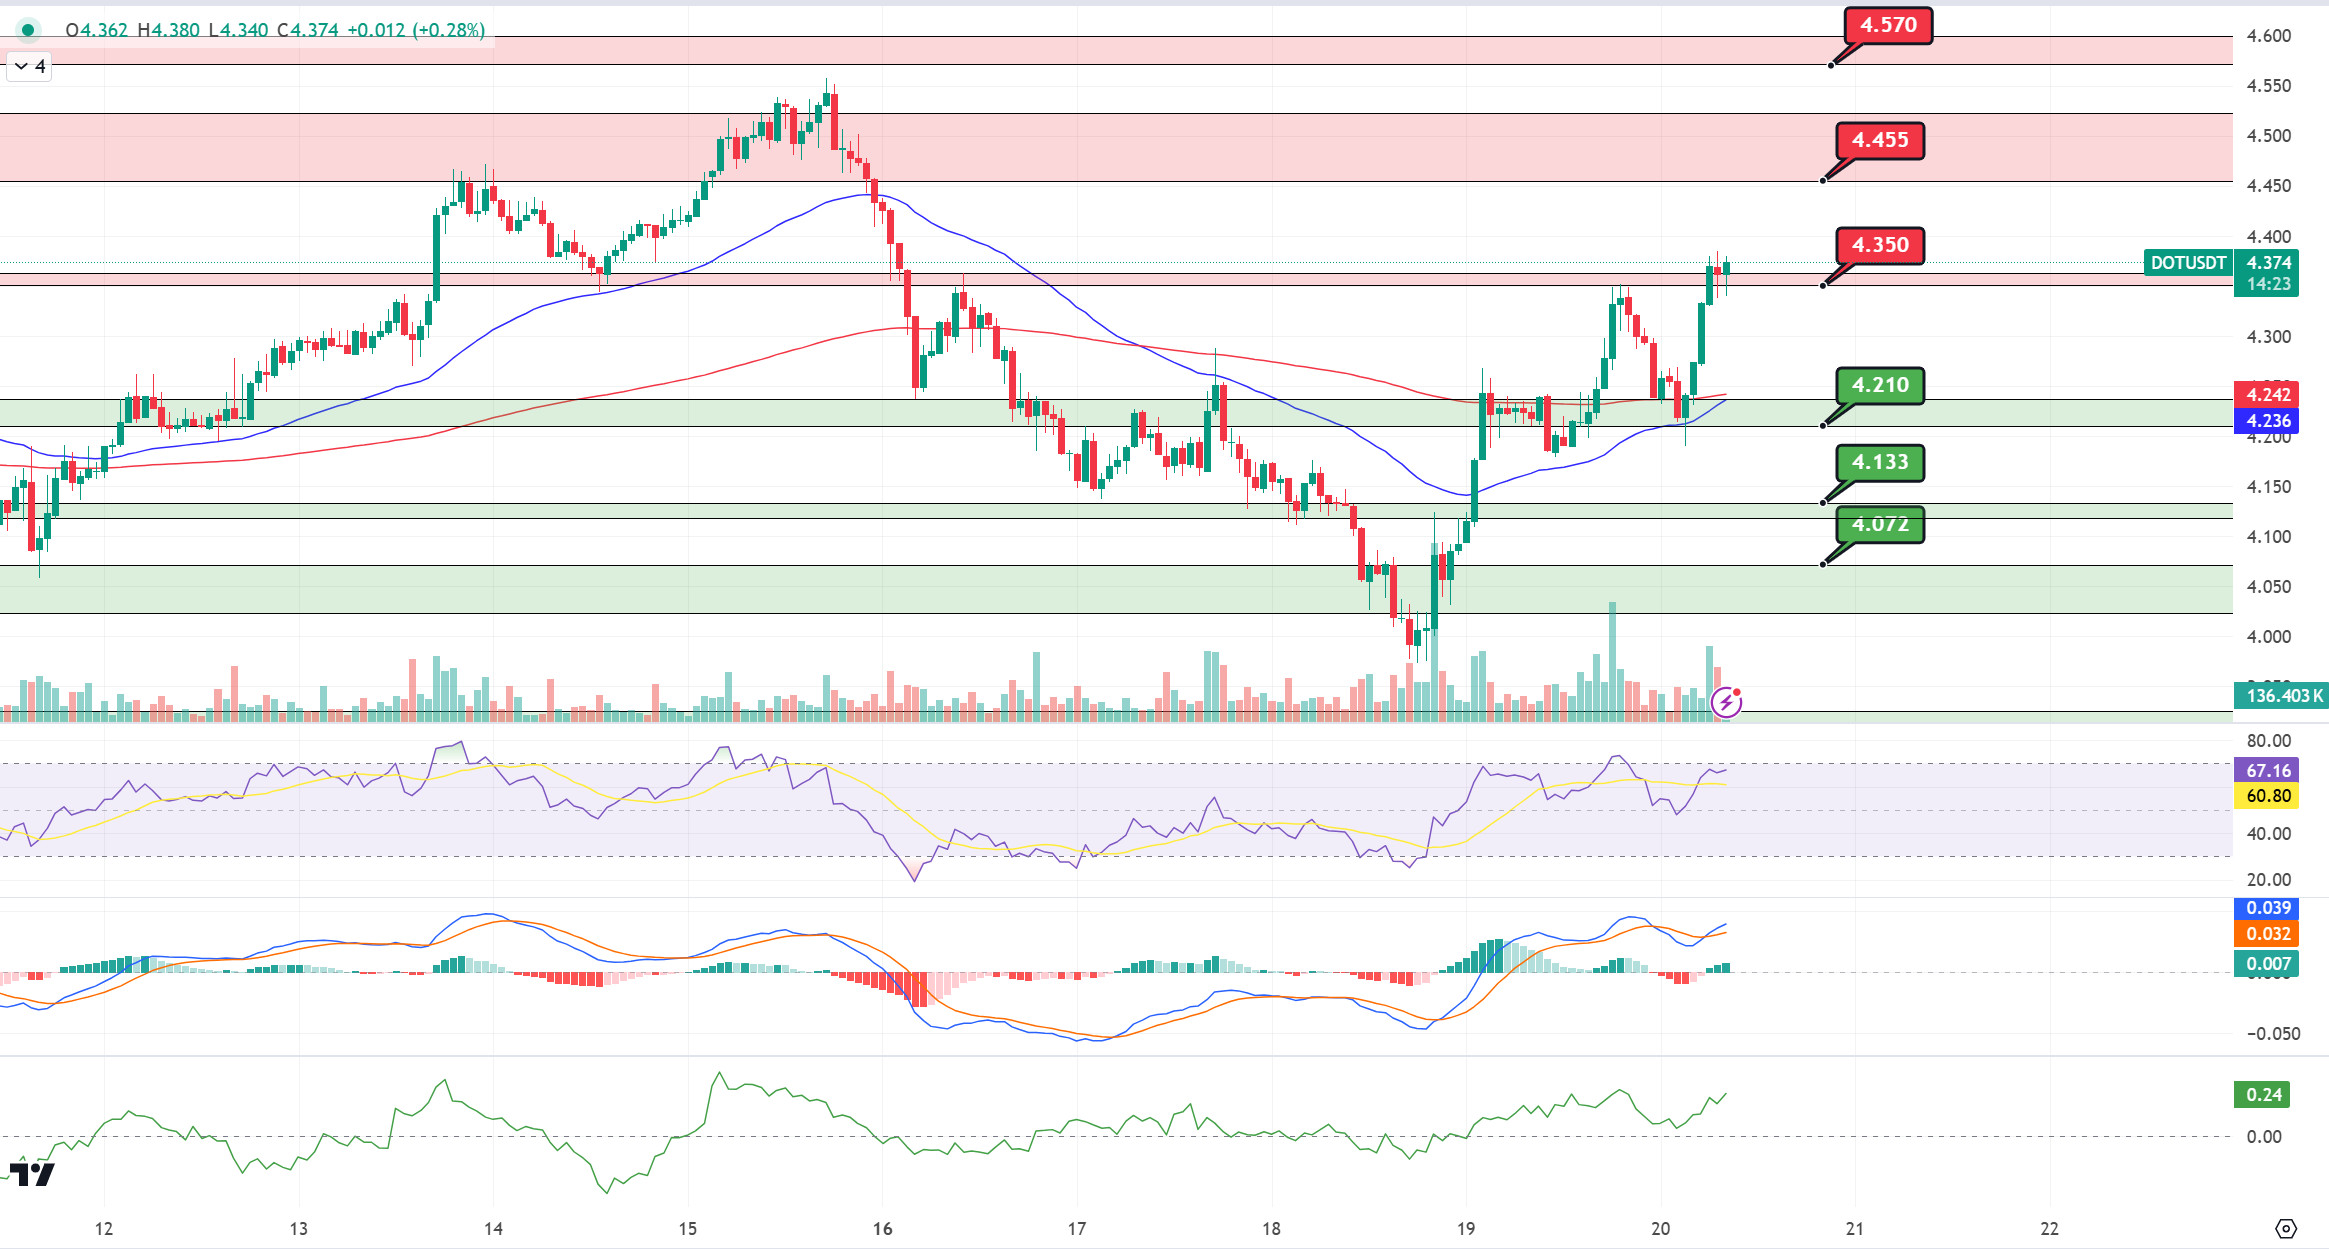
When we examine the Polkadot chart, we see that the price broke the 4,210 resistance and rose to 4,350 resistance. When we examine the RSI, we see that there is a negative mismatch between it and the price. In this context, we can expect the price to retreat towards 4.210 levels. On the other hand, the EMA50 seems to break the EMA200 upwards (Golden Cross). If this happens, the price may break the 4,350 resistance upwards.
(Blue line: EMA50, Red line: EMA200)
Supports 4,210 – 4,133 – 4,072
Resistances 4.350 – 4.455 – 4.570
SHIB/USDT
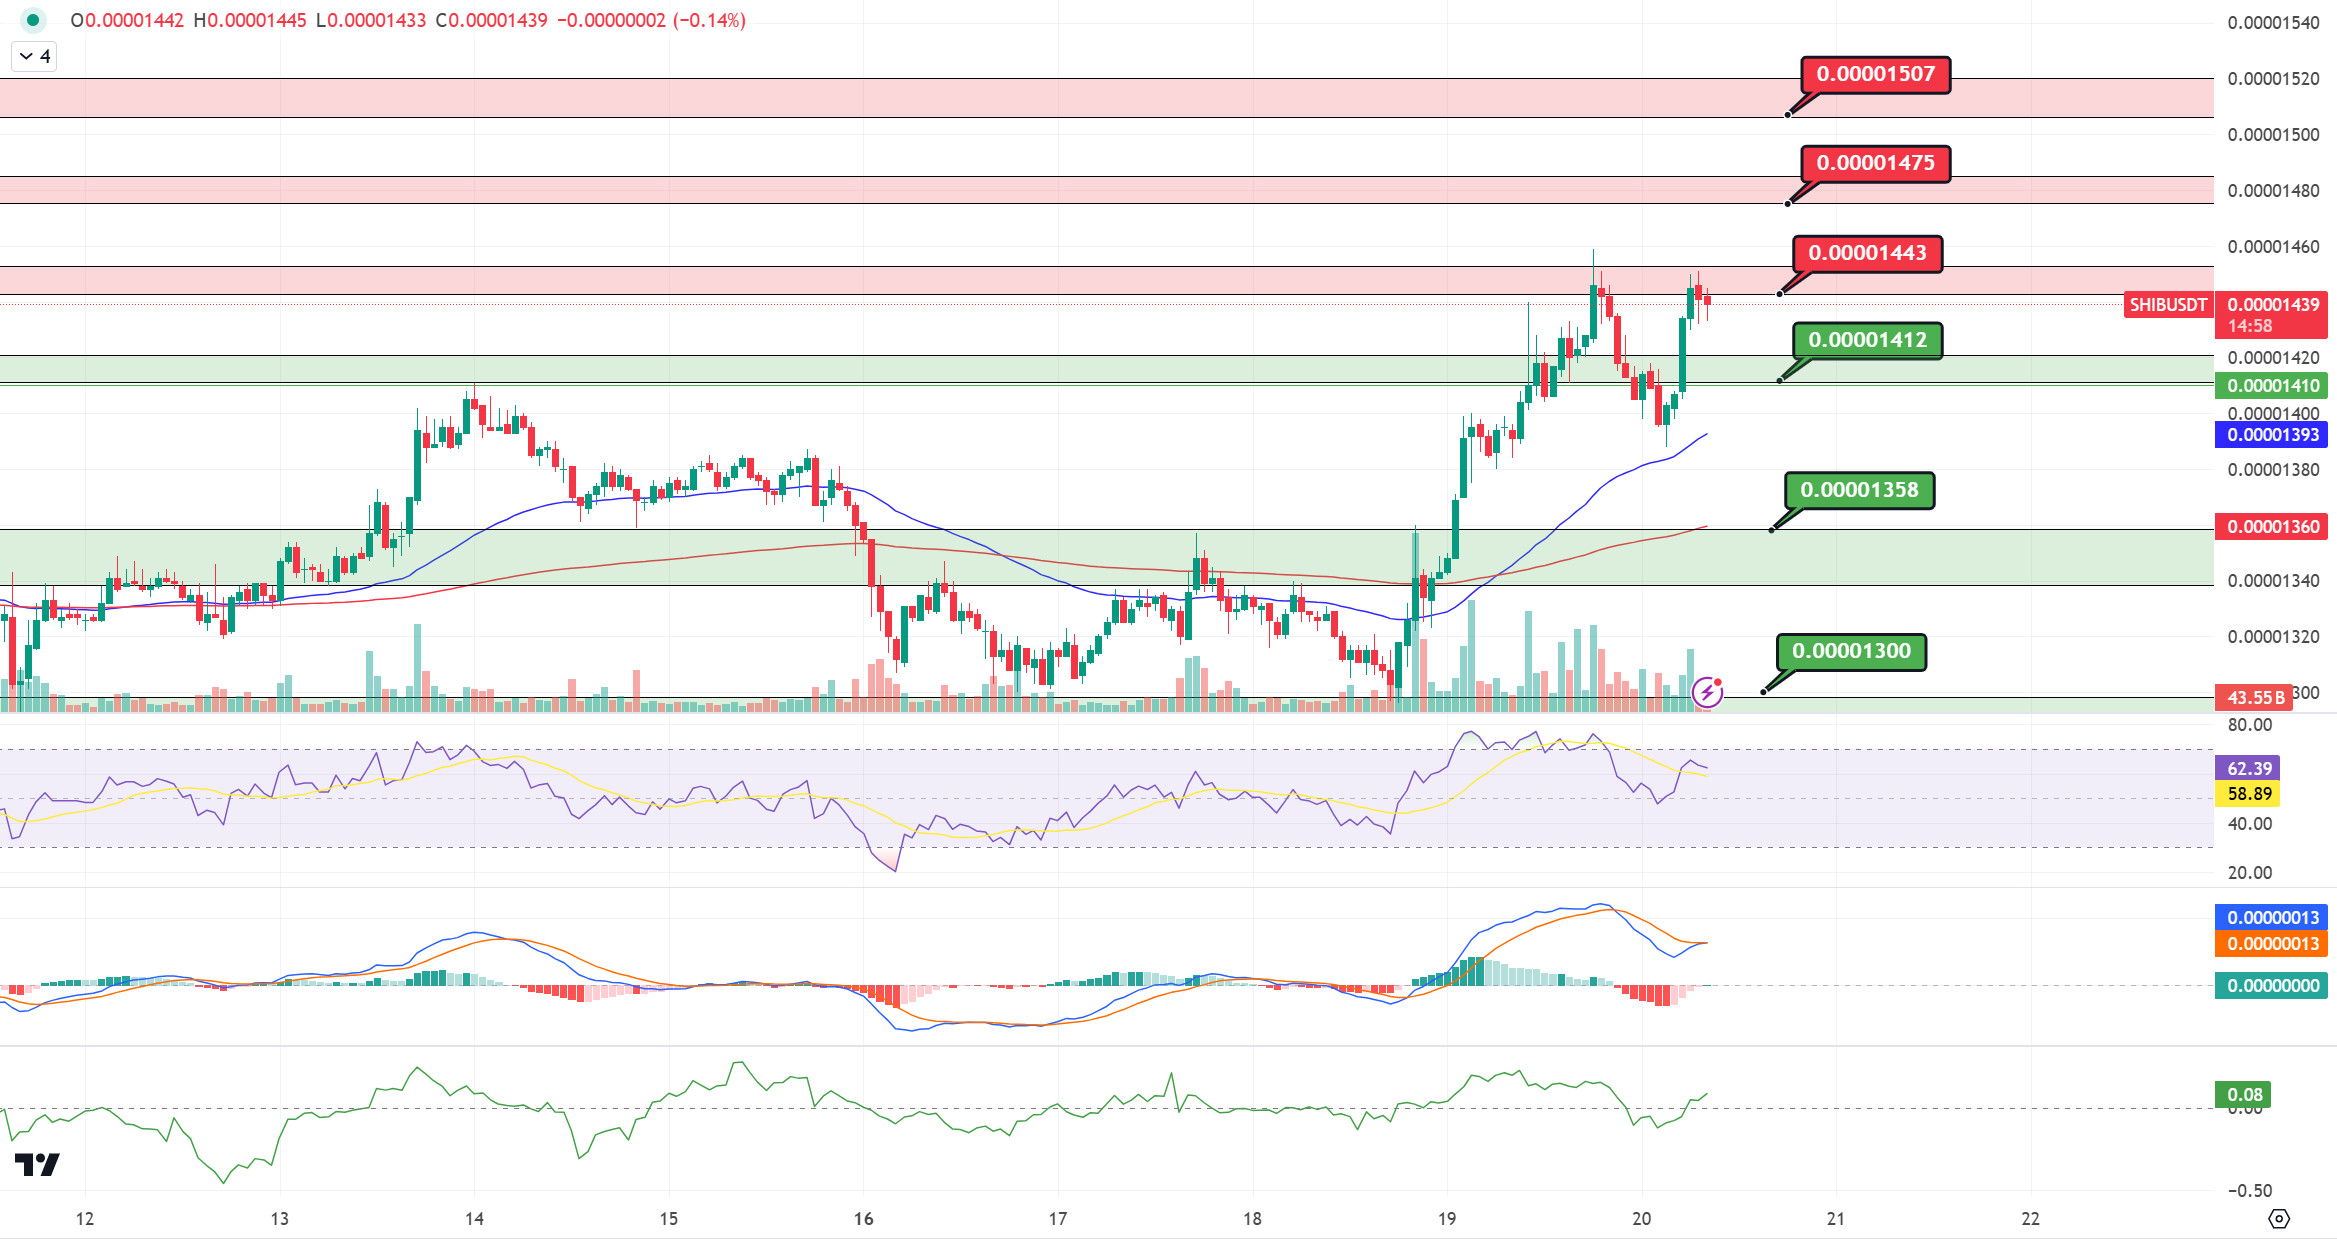
When we examine the chart of Shiba Inu (SHIB), the price fell towards the EMA50 levels with increasing selling pressure and then rose towards the 0.00001443 resistance level. When we examine the MACD and CMF oscillators, we see that the selling pressure is decreasing. In a positive scenario, if the price stays above 0.00001443, its next target may be 0.00001475 levels. On the other hand, if the selling pressure continues at 0.00001443, the price may want to test the EMA50 levels again.
(Blue line: EMA50, Red line: EMA200)
Supports 0.00001412 – 0.00001358 – 0.00001300
Resistances 0.00001443 – 0.00001475 – 0.00001507
LEGAL NOTICE
The investment information, comments and recommendations contained herein do not constitute investment advice. Investment advisory services are provided individually by authorized institutions taking into account the risk and return preferences of individuals. The comments and recommendations contained herein are of a general nature. These recommendations may not be suitable for your financial situation and risk and return preferences. Therefore, making an investment decision based solely on the information contained herein may not produce results in line with your expectations.


