
MARKET SUMMARY
Latest Situation in Crypto Assets

*Prepared on 25.09.2024 at 07:00 (UTC)
WHAT’S LEFT BEHIND
Spot ETF
Bitcoin ETFs continue to attract a lot of interest from institutional investors with a net inflow of $136 million in recent days. Ethereum ETFs, on the other hand, are also attracting attention with net inflows of $62.5 million. Ethereum’s strong performance and the growth in the DeFi (Decentralized Finance) and NFT (Rare Digital Asset) ecosystems are increasing investor interest in this area.
SEC Ruling on Options Based on BlackRock’s Spot Ethereum ETF
The US Securities and Exchange Commission (SEC) postponed its decision on options on BlackRock’s spot Ethereum ETF until November 10, 2024. The postponement had a negative impact on investor expectations, leading to a limited decline in the price of the ETH. The SEC’s decision is expected to have a major impact on the market.
HIGHLIGHTS OF THE DAY
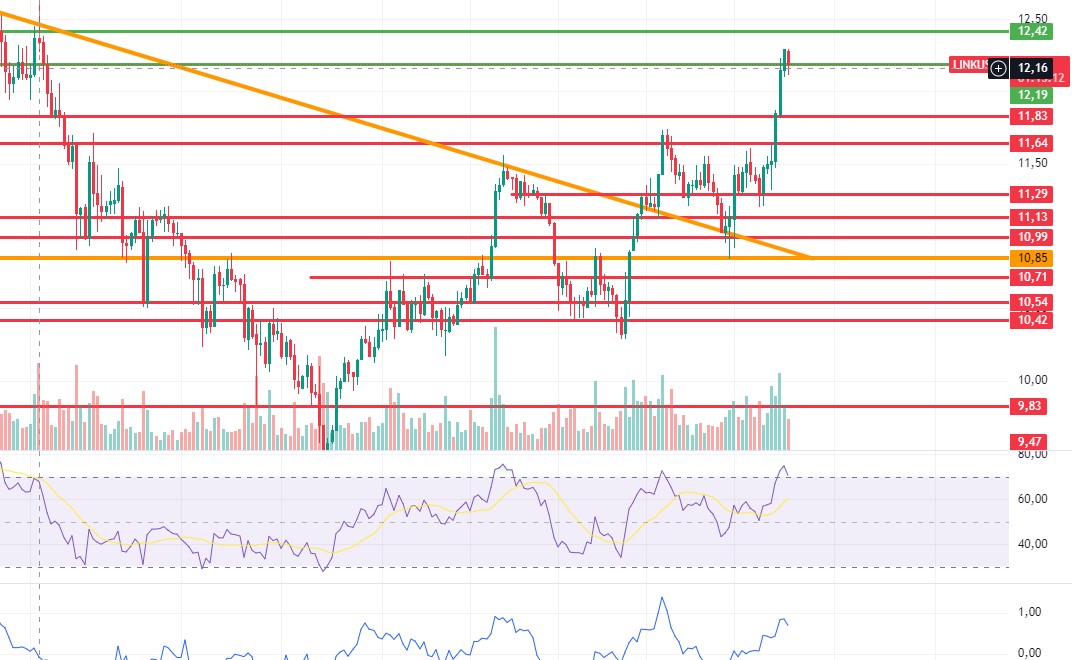
INFORMATION
*The calendar is based on UTC (Coordinated Universal Time) time zone. The economic calendar content on the relevant page is obtained from reliable news and data providers. The news in the economic calendar content, the date and time of the announcement of the news, possible changes in the previous, expectations and announced figures are made by the data provider institutions. Darkex cannot be held responsible for possible changes that may arise from similar situations.
MARKET COMPASS
In global markets, central banks remain on the agenda. Following the 50 basis point cut by the US, eyes are now turning to other central banks. Following a series of easing steps yesterday, the People’s Bank of China (PBOC) cut the medium-term lending facility rate by 30 basis points to 2% this morning.
As central banks continue to take easing steps to support their economies, markets seem to be resting after the recent rises. In Asia this morning, apart from the rises in China, stock markets are mixed. European and US futures indices also point to a lower opening compared to yesterday. In addition, the dollar index is looking for stabilization after yesterday’s losses.
With these components of the equation, we also saw gains in digital assets. After approaching around $65,000, BTC eased slightly and accompanied the respite in global markets. As we mentioned in yesterday’s bulletins, the bullish possibility continues to weigh on the current situation. However, a pullback would not be surprising after the recent gains with rising risk appetite. After this correction, which may occur within the nature of the market, if the current mood can be maintained, we can watch the continuation of the upward movement in digital assets. There is no news flow that can change the direction in global markets during the day. The focus is on the US PCE Price Index data to be released on Friday. Before that, the impact of central banks’ steps to loosen financial conditions and the expectations that the US economy will manage to avoid recession and make a “soft landing” seem to be the main headlines that will shape the basic market perception.
TECHNICAL ANALYSIS
BTC/USDT
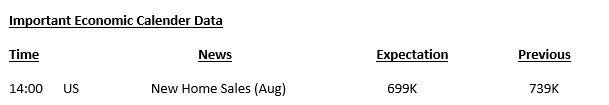
Bitcoin continues to gain traction with a net inflow of $136 million into spot ETFs in recent days. This suggests that investor confidence in Bitcoin is growing and demand for it continues. In the BTC 4-hour technical analysis, we see that the price, which retreated to the 62,700 level as of yesterday, made an upward attack again and tested the 64,700 level, where the weighted short trades were liquidated. BTC, which was trading at 63,900 at the time of writing the technical analysis, can move us to 65,725 if it persists above the resistance level of 64,450 and 4-hour candle closures. In case of a pullback, it is possible that an intense long transaction accumulated at 62,300, the support level, and wants to test it.
Supports 62,300 – 60,650 – 59,400
Resistances 64,450 – 65,725 – 67,300
ETH/USDT
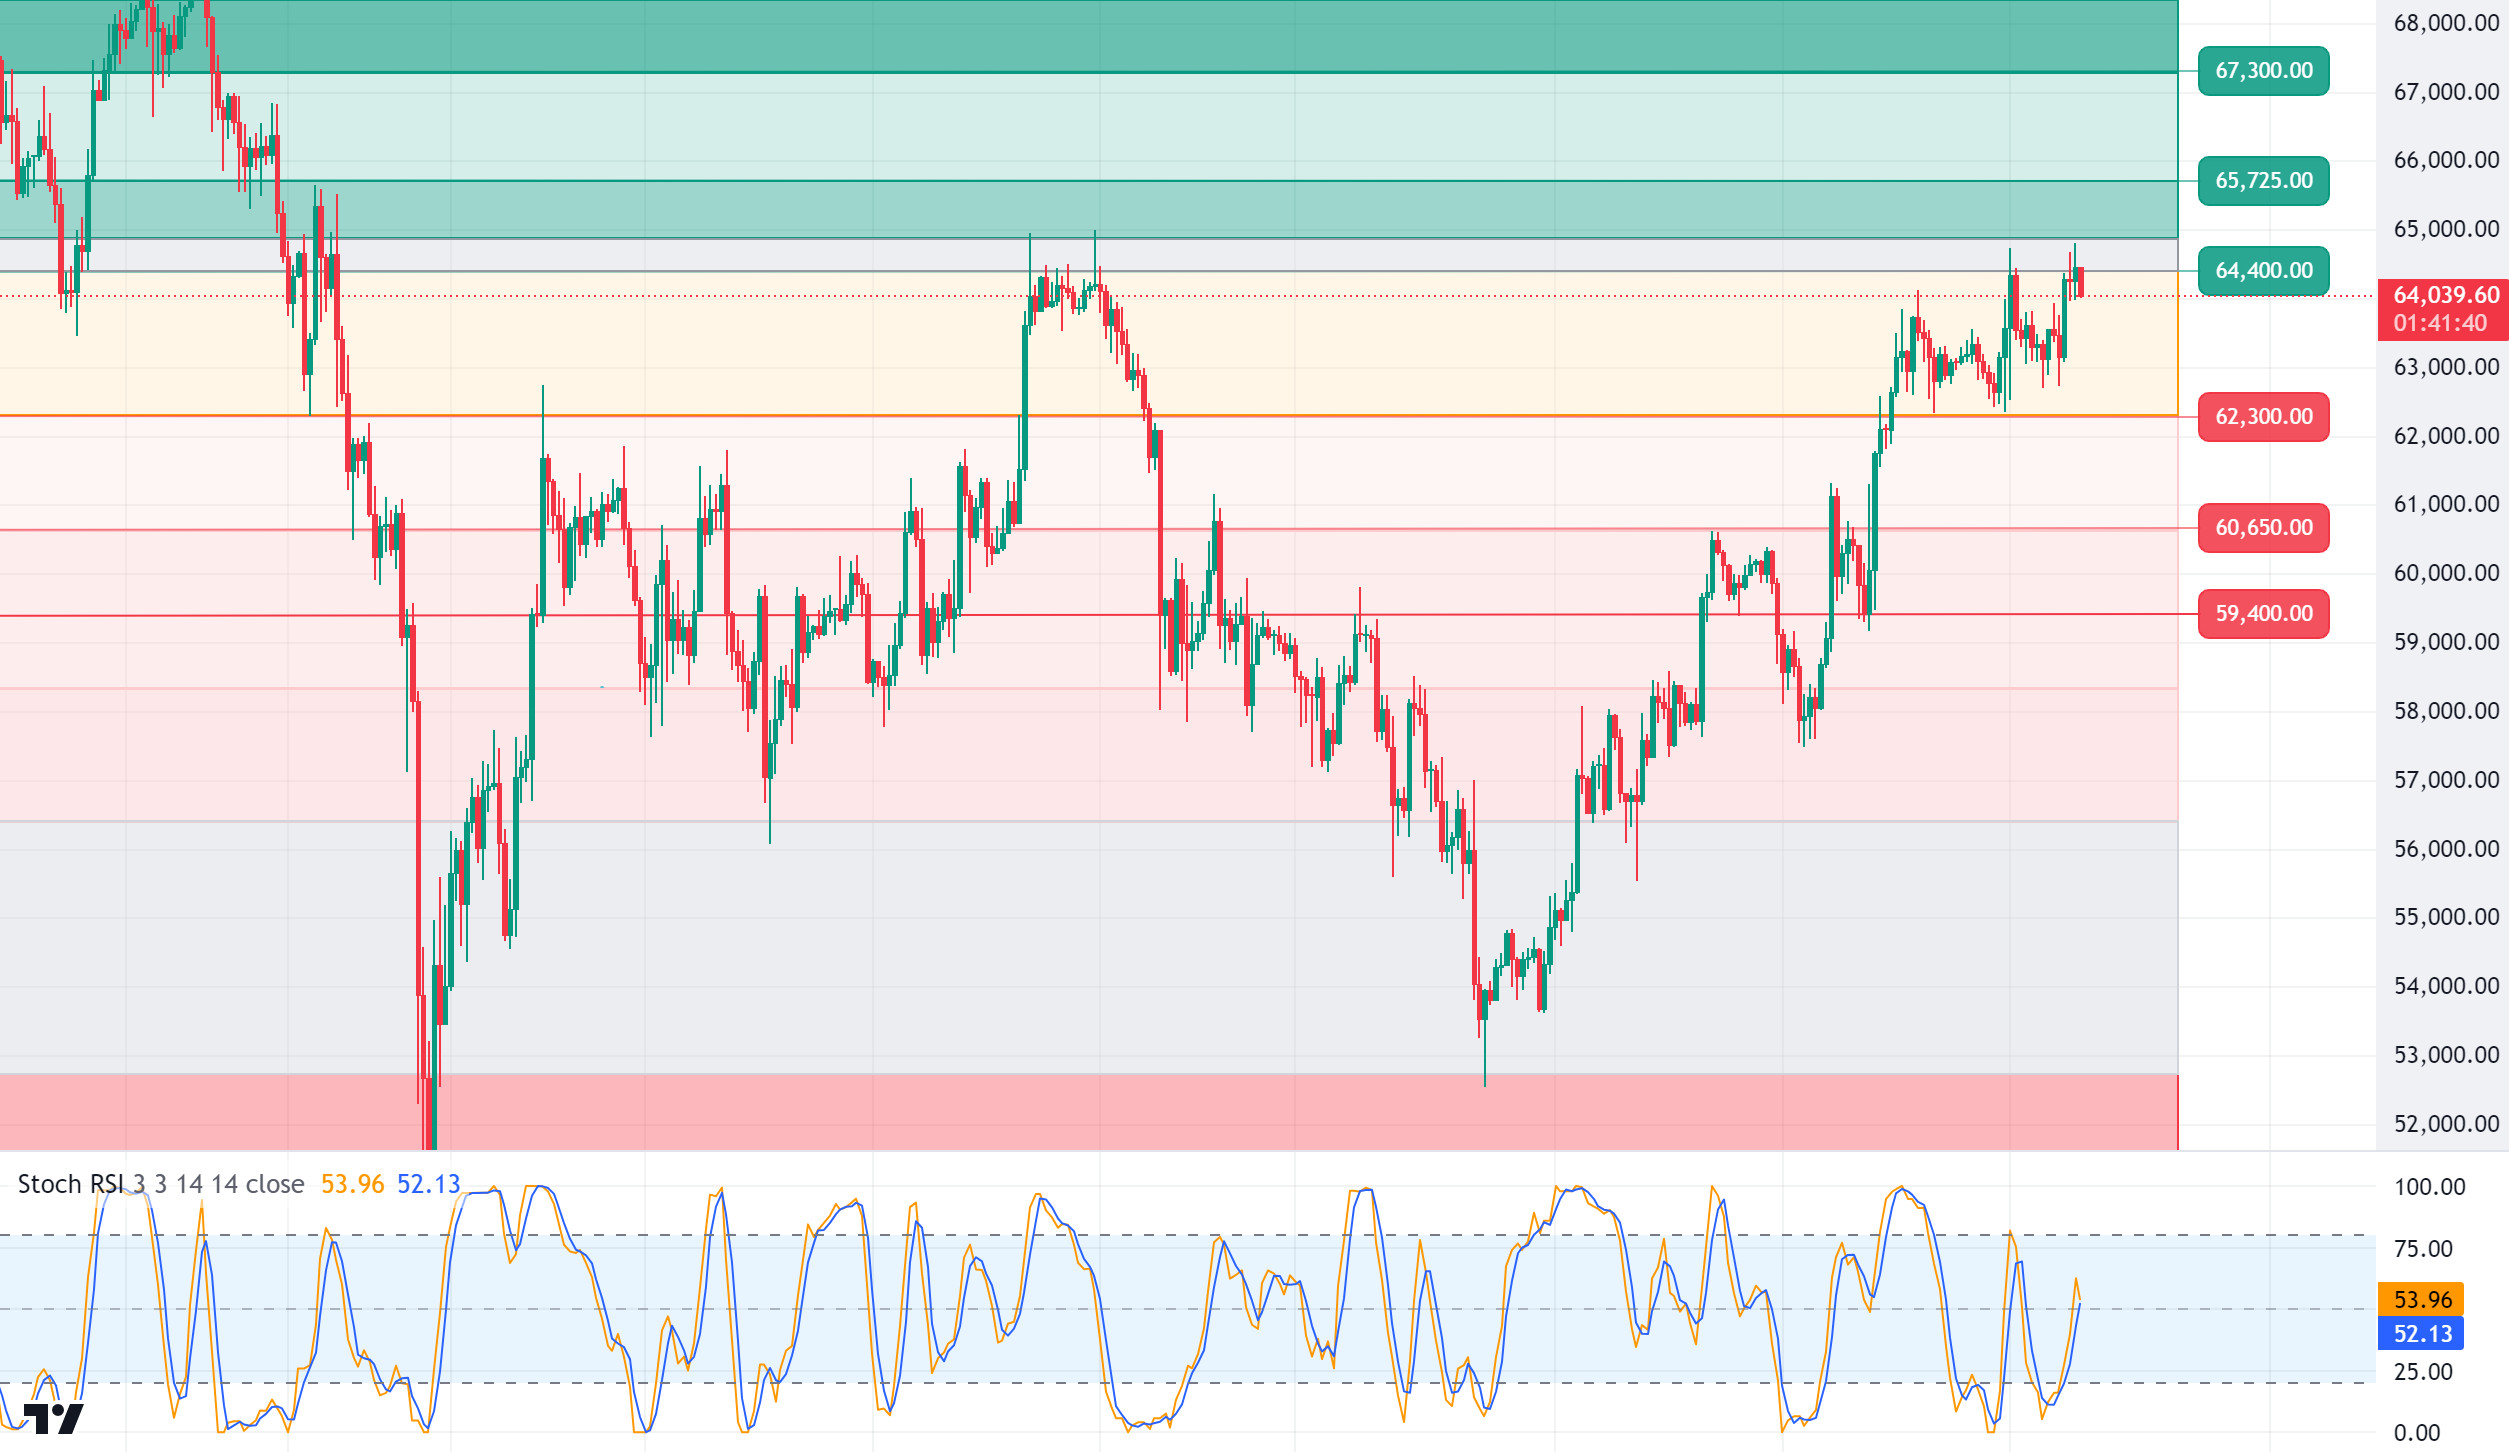
Rejected at 2,669 resistance, Ethereum is trying to hold on to the 2,606 kijun level. The negative structures formed in RSI and CMF seem to remain valid. Loss of the kijun level may bring a decline to 2,558 levels. Looking at open interest and CVDs, it seems that open positions are closed, and selling is coming from the futures channel. In this context, it can be said that the declines may remain as a classic correction movement until the 2,558 level. Closures below 2,558 may disrupt the uptrend and cause deeper declines. Exceeding the 2,669 level may ensure the continuity of the uptrend and start an attack to 2,721 levels.
Supports 2,606 – 2,558 – 2,490
Resistances 2,669 – 2,721 – 2,815
LINK/USDT
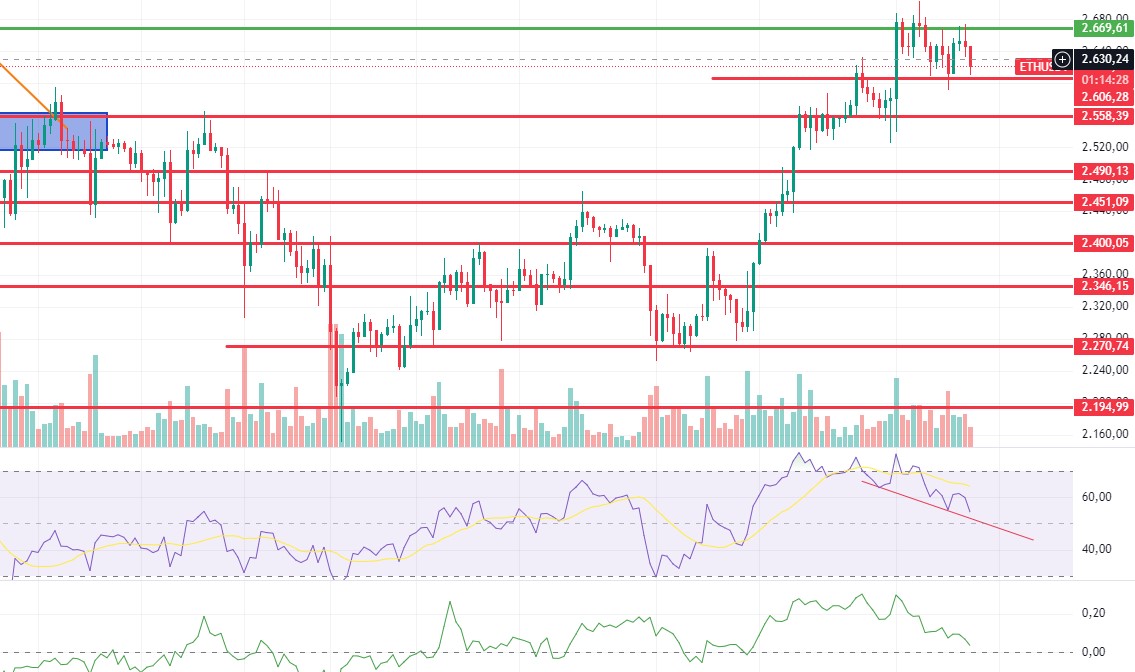
For LINK, which has experienced a voluminous rise by exceeding the 11.64 level, there is a sell signal in RSI. There are similar outlooks when looking at OBV and momentum. In a possible correction movement, a retracement to 11.83 levels can be expected. Closures above 12.19 may bring the continuation of the movement towards 12.42.
Supports 11.83 – 11.64 – 11.29
Resistances 12.19 – 12.42 – 12.71
SOL/USDT
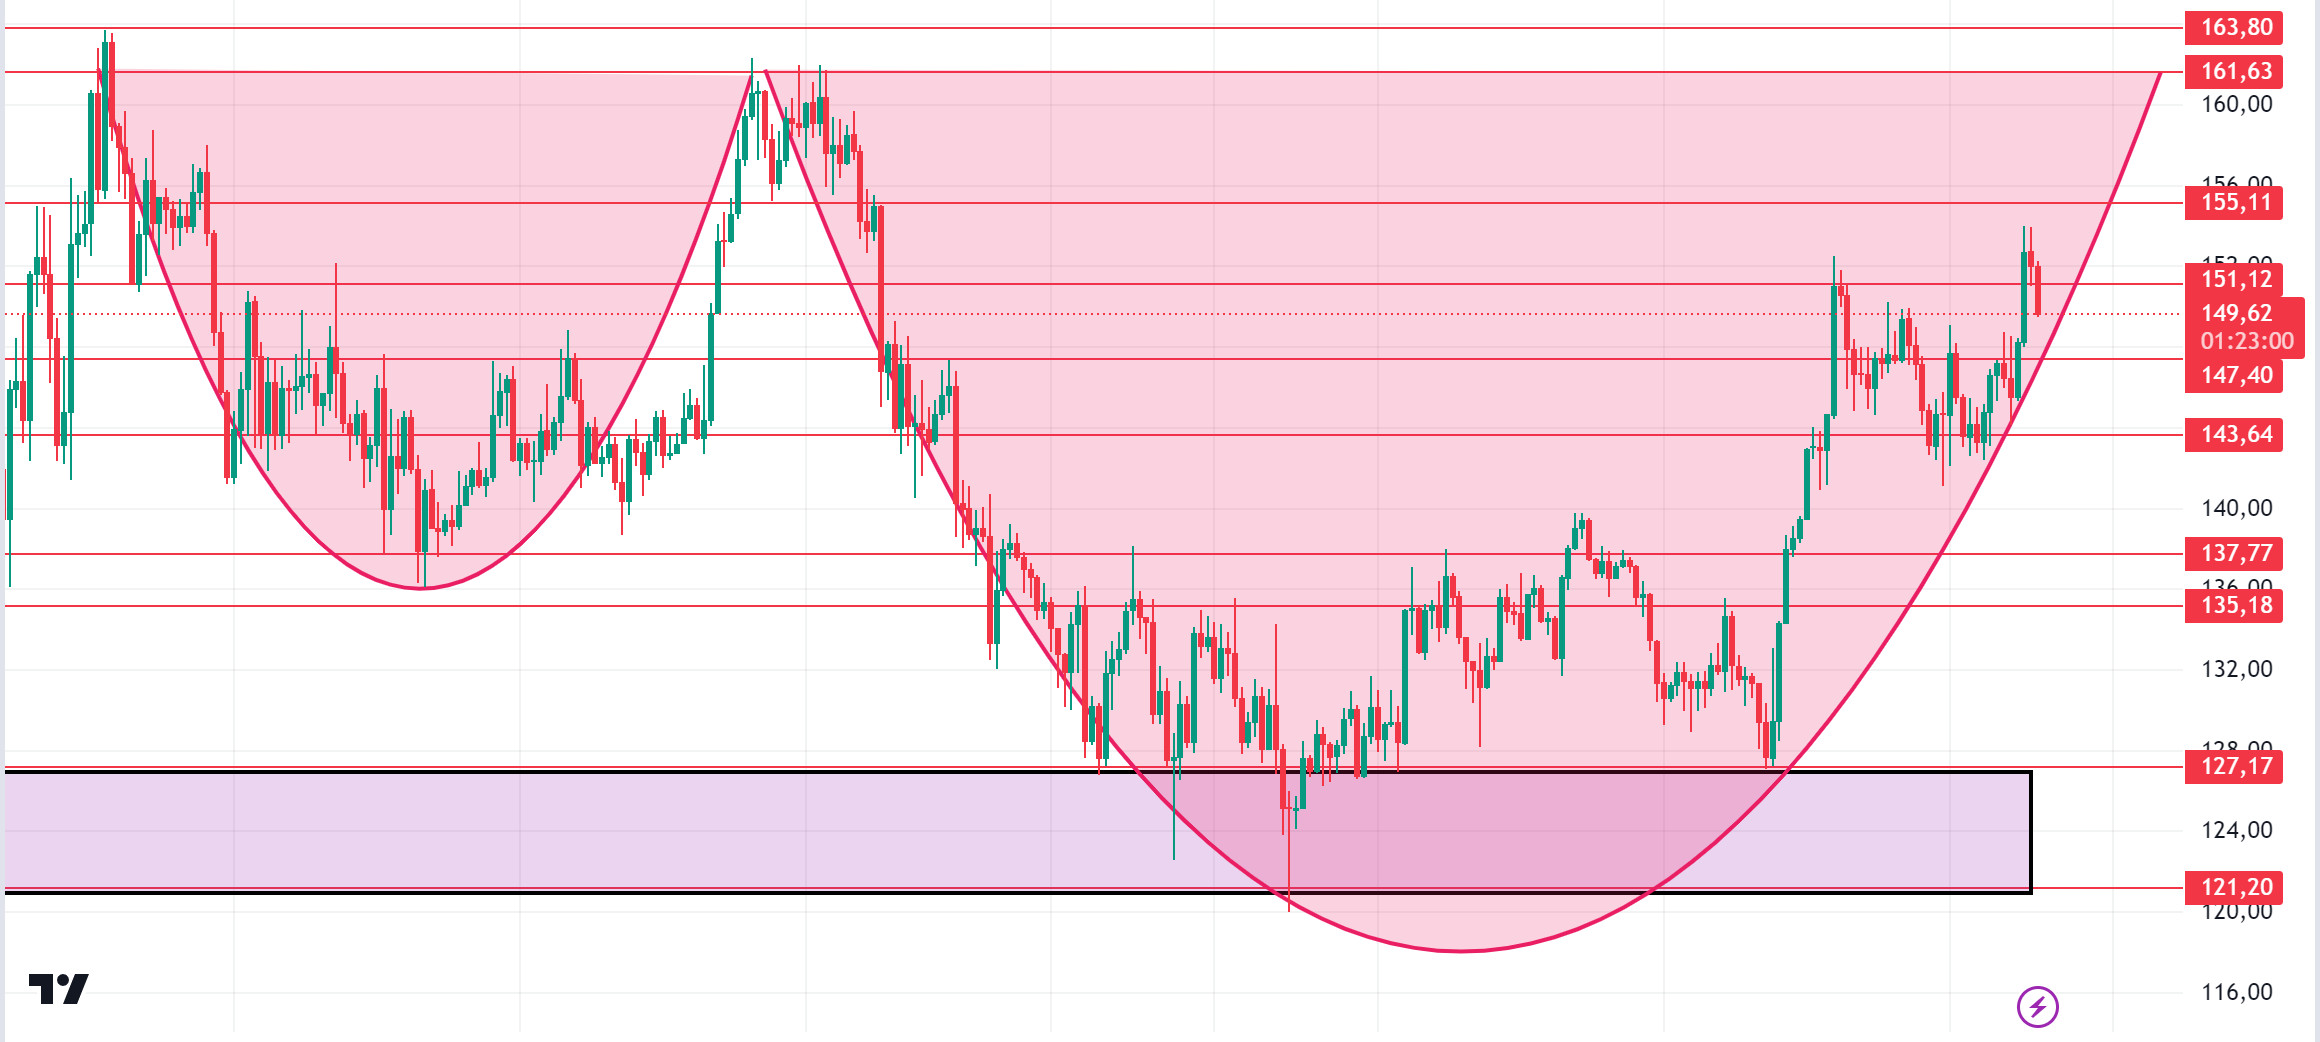
In yesterday’s SEC speech, Committee Chairman McHenry said, “Under Mr. Gensler, the SEC has become an agency that has done worse and worse things instead of better. The SEC under Gensler will be remembered as a corrupt agency. This seems to have broken the SEC’s pressure on cryptocurrency markets. In the Solana ecosystem, the effects of Breakpoint are reflected in the price. Technically, SOL, which broke 150, seems to have kept pace with the market. SOL, which has increased by 3.28% since yesterday, continues to move in a cup-and-handle pattern. The levels of 155.11 – 161.63 appear as a resistance point in the rises driven by both macroeconomic conditions and innovations in the Solana ecosystem. If it rises above these levels, the rise may continue. It can support the 200 EMA average in the pullbacks that will occur if investors make profit sales. 147.40 – 143.64 levels can be followed as support. If it comes to these support levels, a potential rise should be followed.
Supports 147.40 – 143.64 – 137.77
Resistances 155.11 – 161.63 – 163.80
ADA/USDT
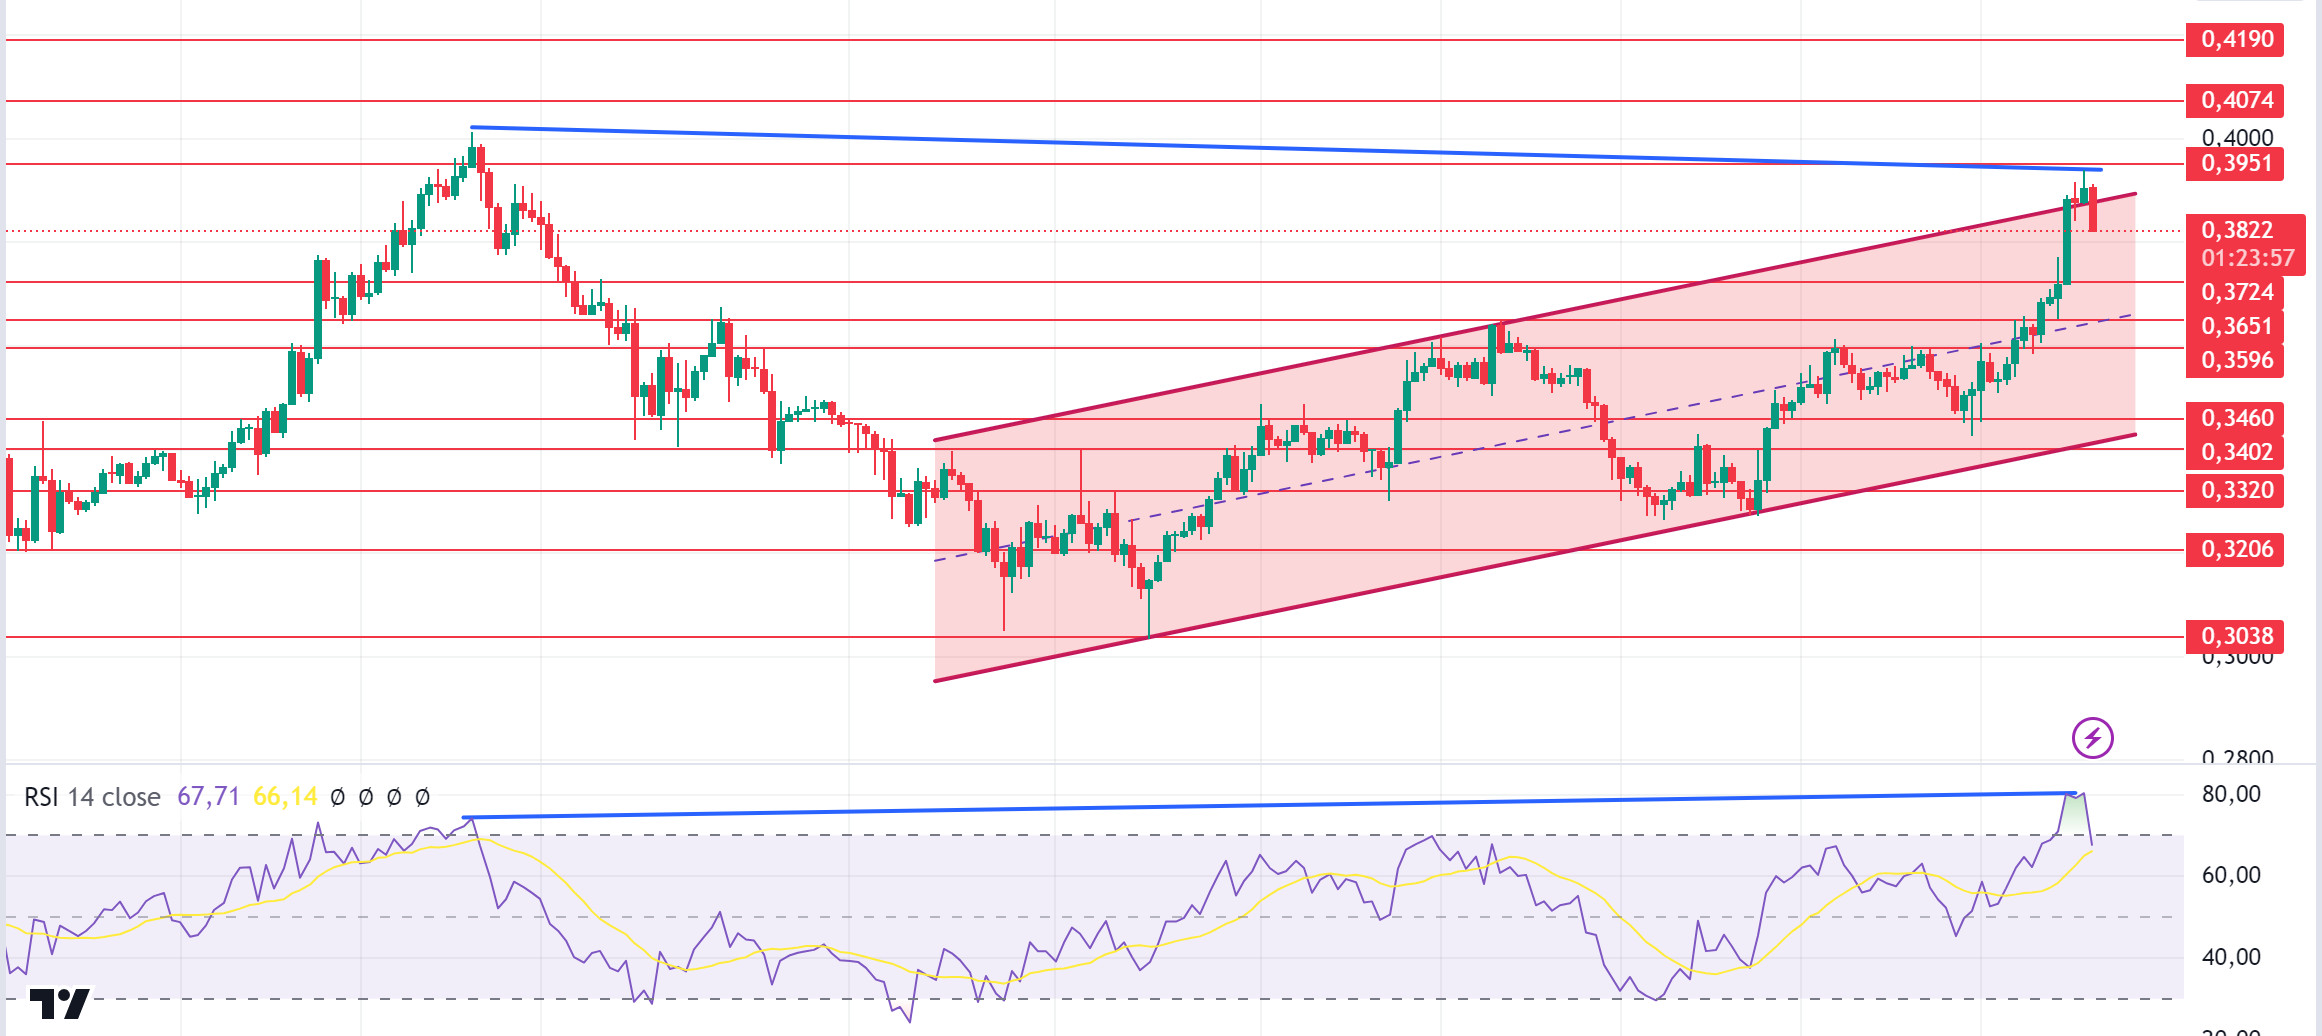
Cardano founder Charles Hoskinson claims Ethereum is a ‘dictatorship’. Hoskinson started a new debate by saying that the Ethereum network resembles a “dictatorship” where Vitalik Buterin has too much influence over the development of the decentralized network. Technically, the bitcoin price held above the $63,000 level, while major altcoins such as ADA experienced a similar move, breaking out of their main psychological levels. With increased volatility in the market, traders entering short-term trades may sell profits, causing the price to fall. It also jumped 6.56% in the last 24 hours with a trading volume of $347.74 million. Additionally, Cardano’s Open Interest (OI) rose 11% to $235.08 million, reflecting increased speculative activity. This accumulation in Open Interest means that there are investors who anticipate the ADA price to rise. Since September 2, ADA, which has been moving in a bullish channel, broke the resistance level of the channel. ADA, which is currently priced at 0.3843, can use the resistance of the rising channel as support and continue its rises if it manages to price above the 0.3951-dollar level. On the other hand, with the RSI reaching the saturation point and the mismatch on the 4-hour chart, the 0.3651 level appears as a strong support in the retracements caused by possible profit sales. With the continuation of the positive atmosphere in the ecosystem, the 0.3951 level can be followed as resistance in the rises that will take place.
Supports 0.3724 – 0.3651 – 0.3596
Resistances 0.3951 – 0.4074 – 0.4190
AVAX/USDT
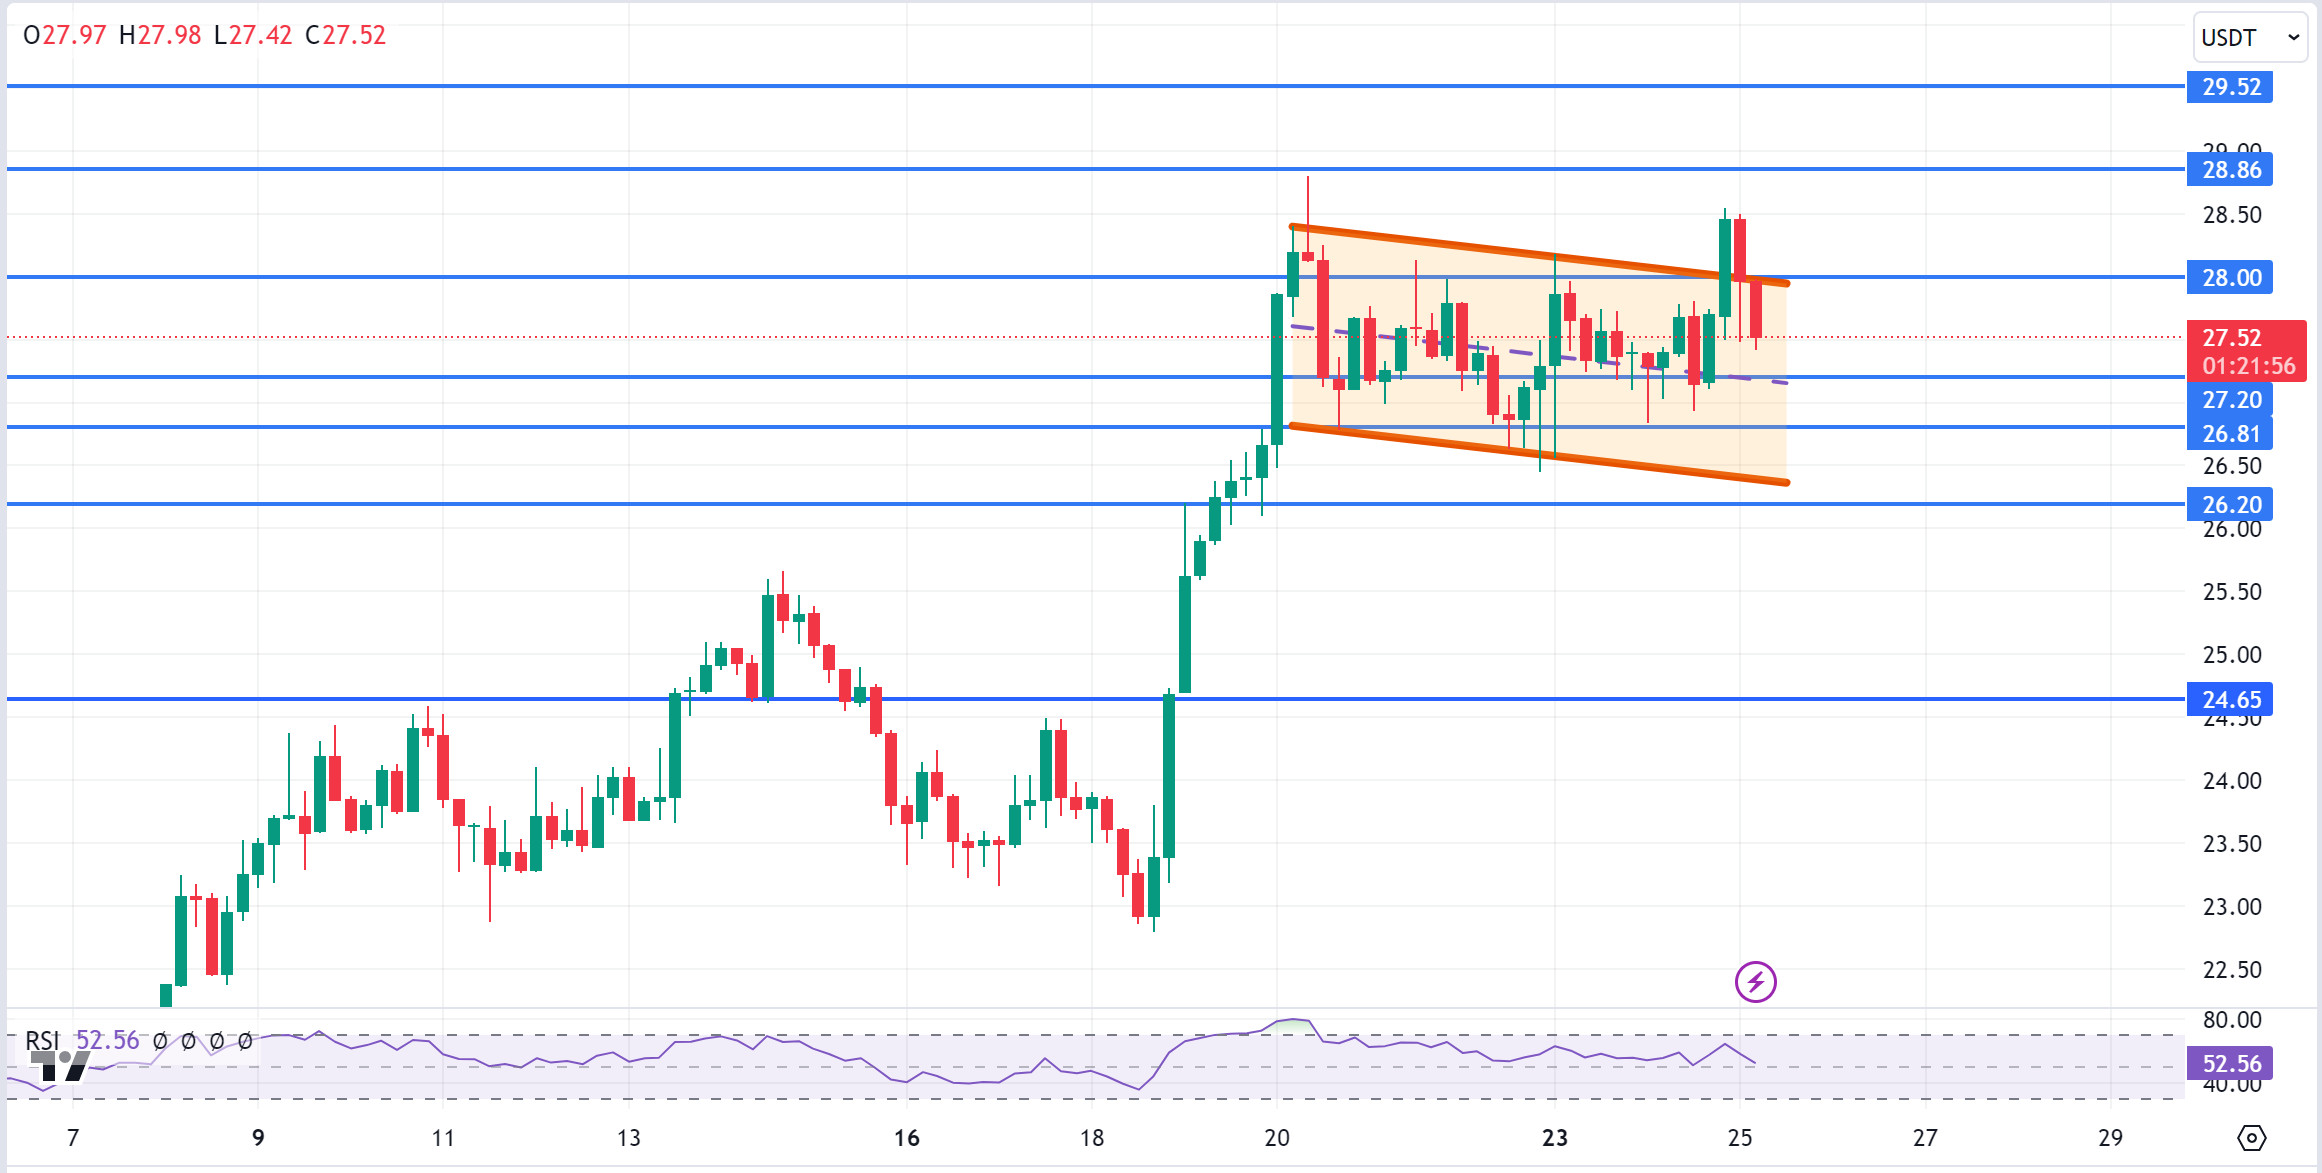
AVAX, which opened yesterday at 27.39, rose by about 4% during the day and closed the day at 28.46. Since there is no planned data flow that will affect the market today, it may be a day with lower volume compared to other days and therefore we may see limited movements.
We see a rising flag pattern on the 4-hour chart for AVAX, which is currently trading at 27.52. It continues to consolidate in the falling channel near the horizontal and can be expected to break the channel upwards after moving in the channel for a while. In such a case, it may test the 28.86 and 29.52 resistances. If recession concerns in the market create selling pressure, it may break the channel downwards. In this case, it may test the 27.20 and 26.81 supports. As long as it stays above 24.65 support during the day, it can be expected to continue its upward trend. With the break of 24.65 support, selling pressure may increase.
Supports 27.20 – 26.81 – 26.20
Resistances 28.00 – 28.86 – 29.52
TRX/USDT
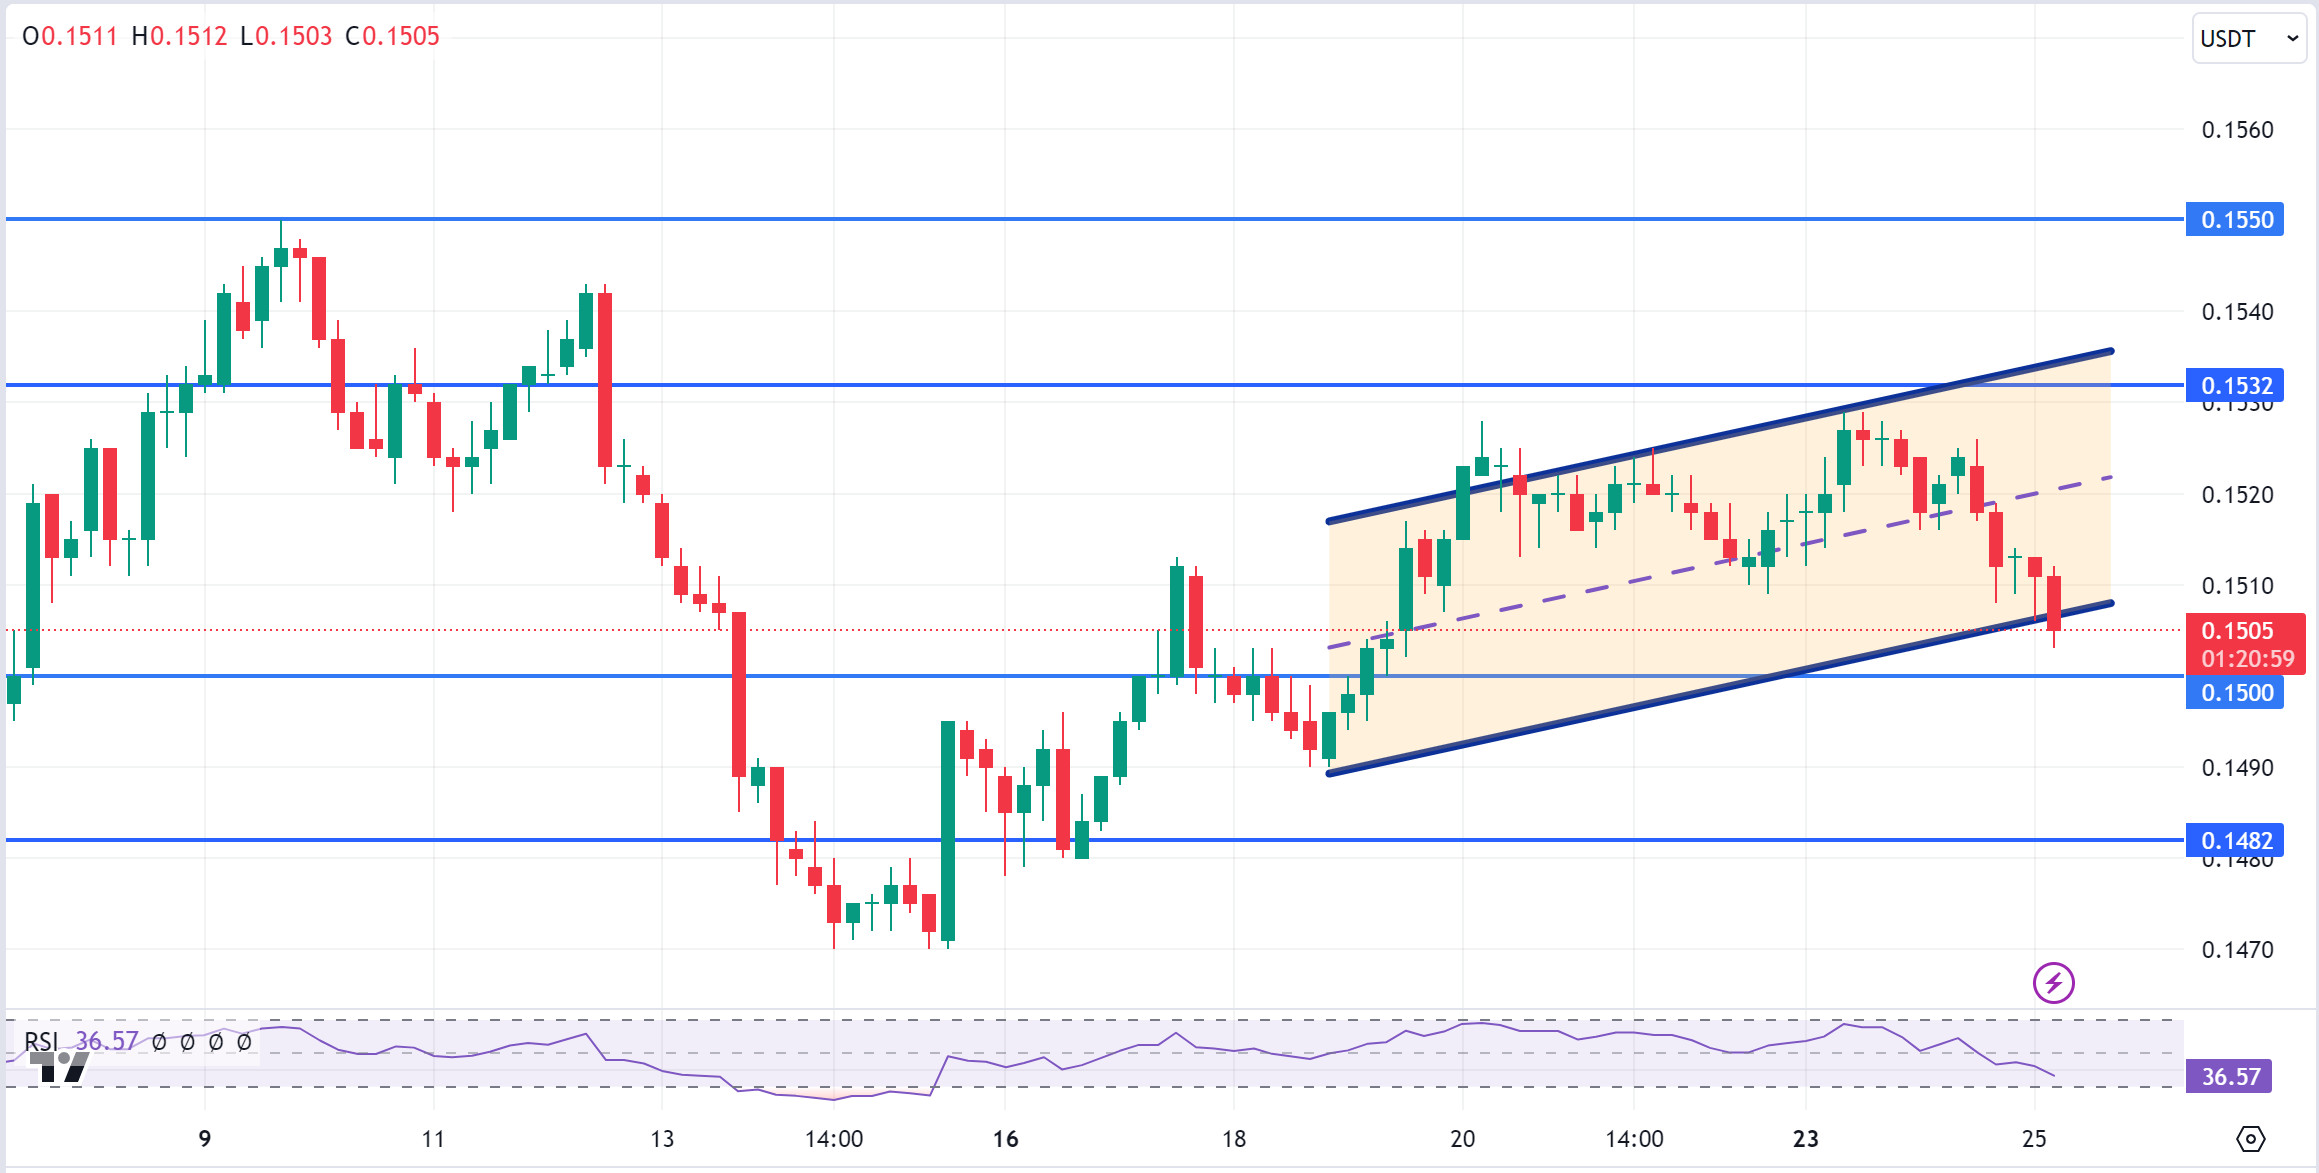
TRX, which started yesterday at 0.1524, fell slightly during the day and closed the day at 0.1513. There is no important data expected to be released today that will affect the market and therefore the market can be expected to be less volatile and less voluminous.
TRX, currently trading at 0.1505, is in an ascending channel on the 4-hour chart. The RSI is in the lower band of the rising channel with a value of 36 and a rise can be expected from here. In such a case, it may move to the middle and upper band of the channel and test the 0.1532 support. However, it may break the channel downwards with the selling pressure from the lower band of the channel. In such a case, it may test 0.1500 support. As long as TRX stays above 0.1482 support, the desire to rise may continue. If this support is broken downwards, sales can be expected to increase.
Supports 0.1500 – 0.1482 – 0.1429
Resistances 0.1532 – 0.1575 – 0.1603
XRP/USDT
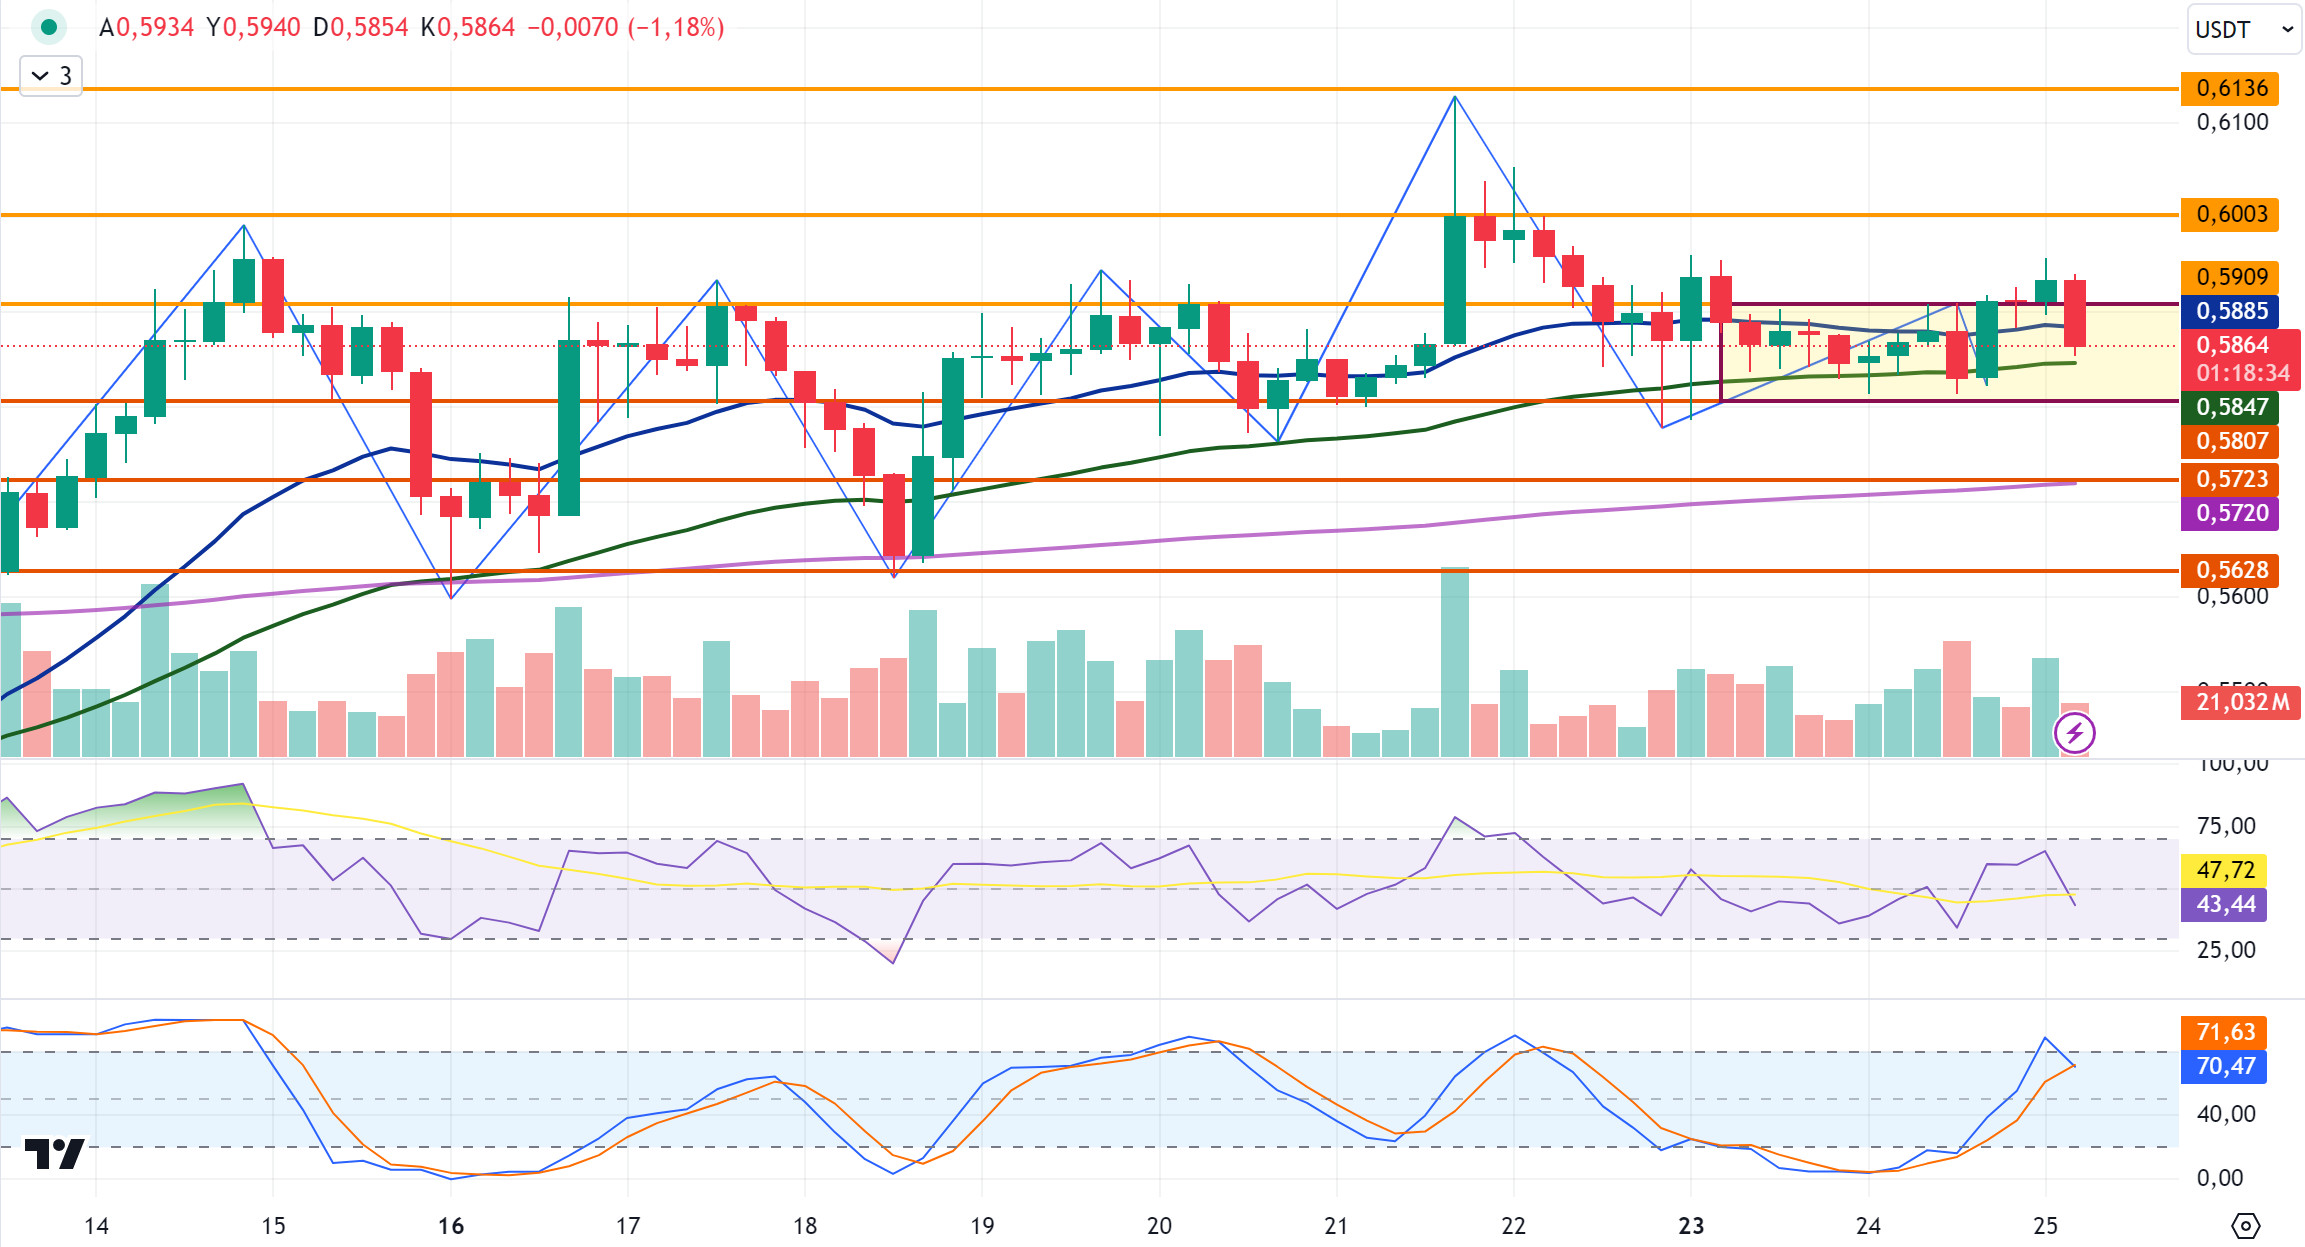
Yesterday, the daily close was realized at 0.5909 with a 1% increase in value on a daily basis. XRP, which started today with a rise in the 4-hour analysis, fell with the sales at 0.5956 and fell into a horizontal band between the EMA20 and EMA50 levels with the decline in the last candle. Currently, XRP continues to trade at 0.5864. XRP may rise again with the purchases that may come during its movement within the horizontal band and if the candle closes above the EMA20 and 0.5909 resistance levels, it may test the 0.6003-0.6136 resistance levels with the continuation of the rise. In case of a decline, the decline may continue at the close of the candle below the EMA50 and 0.5807 support levels and test the support levels of 0.5723-0.5628.
XRP may rise with possible purchases at the 0.5723 support level on the decline and may offer a long trading opportunity. On the rise, it may fall with possible sales at 0.6003 and may offer a short trading opportunity.
EMA20 (Blue Line) – EMA50 (Green Line) – EMA200 (Purple Line)
Supports 0. 5807 – 0.5 723 – 0.5628
Resistances 0.5909 – 0.6 003 – 0.6136
DOGE/USDT
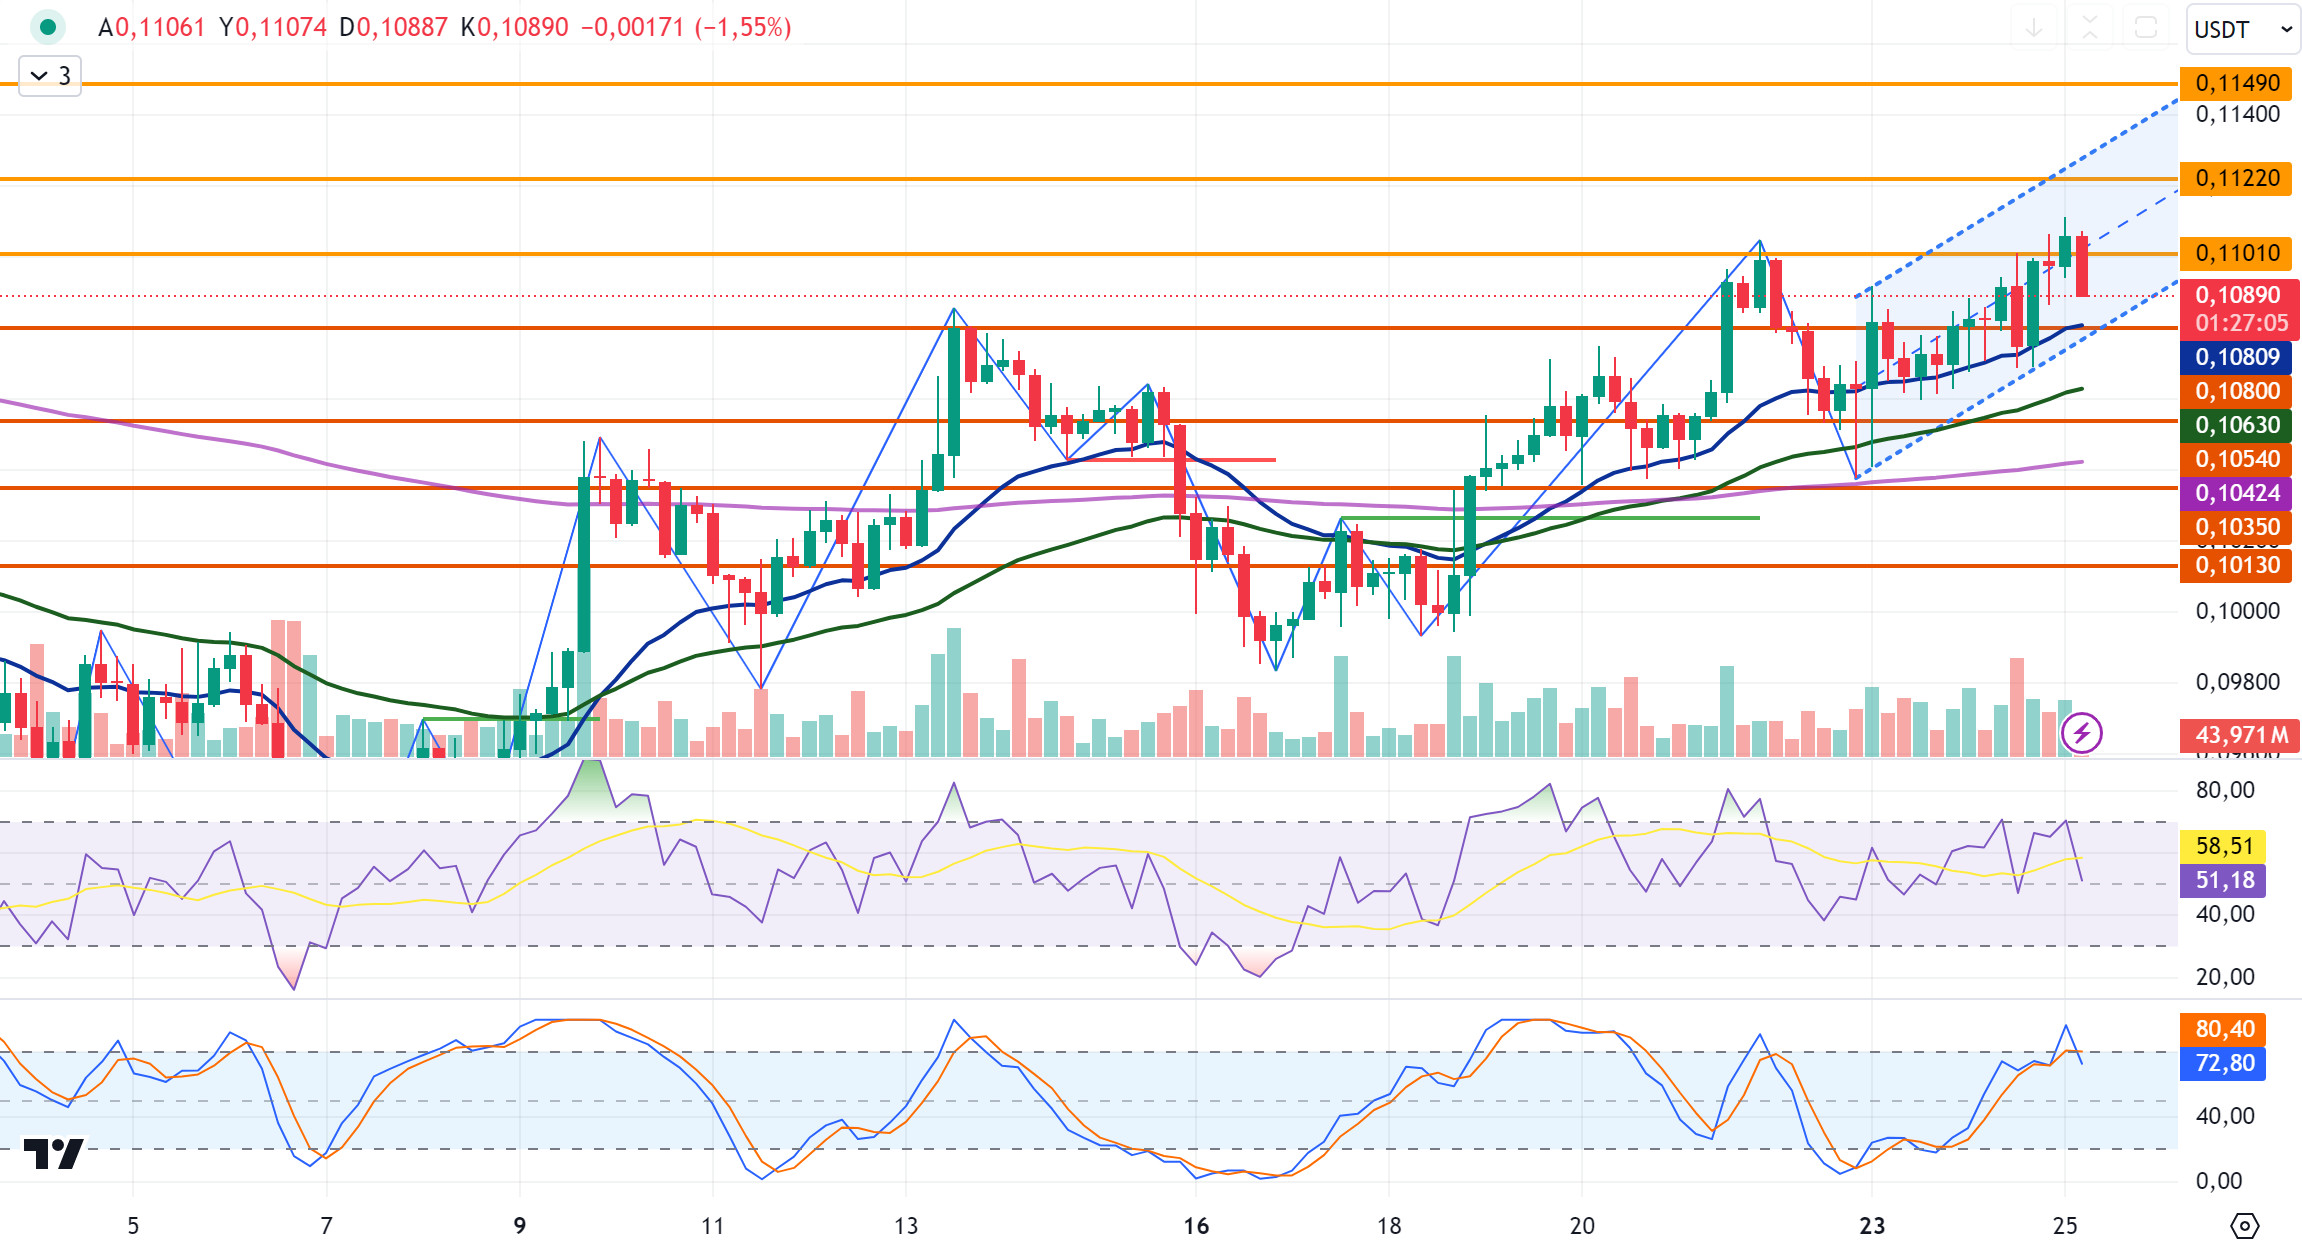
DOGE closed yesterday at 0.1097 with a value increase of 1.6%. DOGE, which started today with a rise in the 4-hour analysis, rose to 0.1111 and then fell with the sales and is currently trading at 0.1088. DOGE continues to trade in a horizontal band between 0.1080 and 0.1101 levels with the decline it experienced in the last candle in the 4-hour analysis. For DOGE, which is in the ascending channel, if it starts to rise again, it may test the resistance levels of 0.1101-0.1122-0.1149. If the decline in the last candle continues, DOGE may test support levels of 0.1080-0.1054-0.1035.
Purchases and sales that may come during its movement within the horizontal band may offer a short trading opportunity. In its decline, it may rise with purchases that may come at EMA20 and 0.1080 support levels and may offer a long trading opportunity. In its rise, the 0.11 resistance zone stands out and may decline with the sales that may come at this level and may offer a short trading opportunity.
EMA20 (Blue Line) – EMA50 (Green Line) – EMA200 (Purple Line)
Supports 0.1080 – 0.1054 – 0.1035
Resistances 0.1 101- 0.1122 – 0.1149
DOT/USDT
EasyA announced EasyA x Polkadot University, the world’s first blockchain-focused university. This university will focus on training the next generation of blockchain developers to launch projects in the Polkadot ecosystem. EasyA continues its educational initiatives in this field with already 1 million users and hackathons organized around the world.
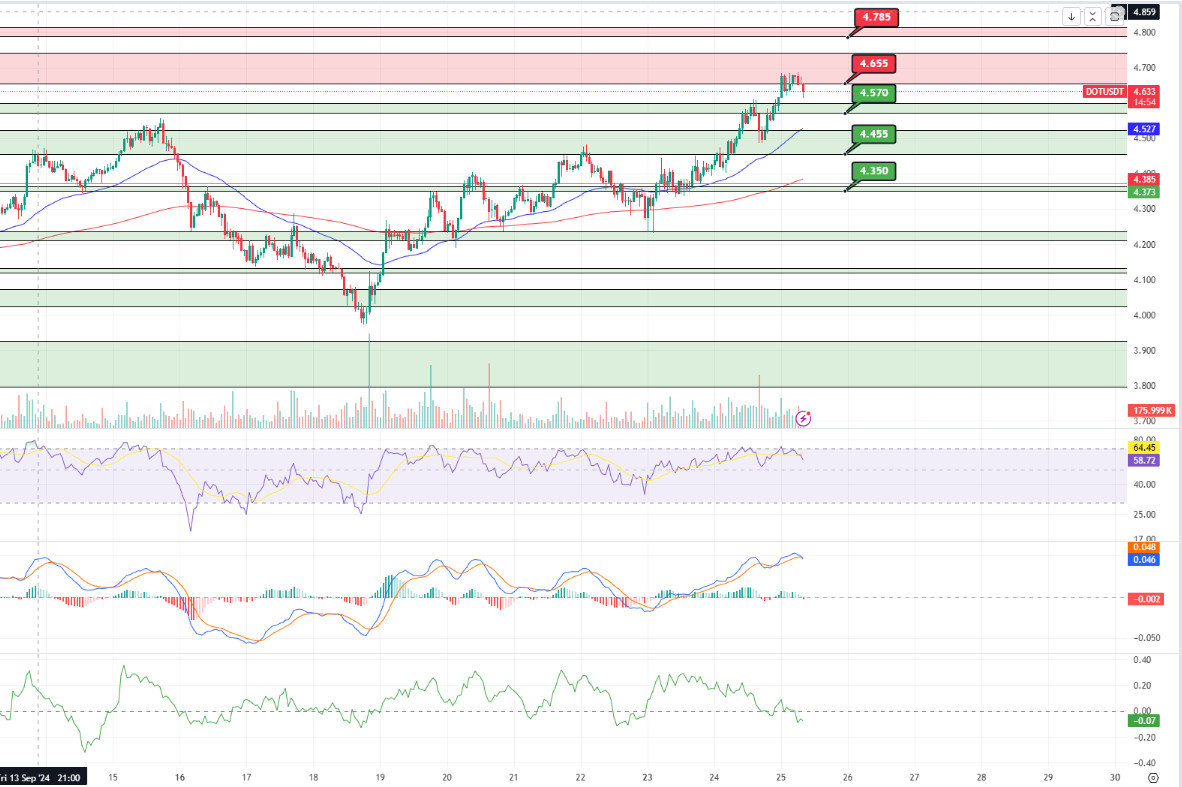
When we examine the Polkadot (DOT) chart, the price seems to have been rejected from the 4.655 resistance. When we examine the CMF oscillator, we can say that the seller pressure is strong. When we look at the MACD oscillator, we see that selling pressure is increasing. In this context, the price may retreat to the 4.570 support band. On the other hand, if the selling pressure decreases, the price may want to test the 4.655 resistance.
(Blue line: EMA50, Red line: EMA200)
Supports 4,570 – 4,455 – 4,350
Resistances 4.655 – 4.785 – 4.910
SHIB/USDT
Shytoshi Kusama, lead developer at Shiba Inu, said that next week could be critical for the SHIB ecosystem. In his remarks at the Token 2049 conference, Kusama hinted at the development of the TREAT token and the privacy-focused layer-3 network. He also emphasized that the SHIB ecosystem will focus on decentralized finance and that the Shibarium network will contribute to this process.
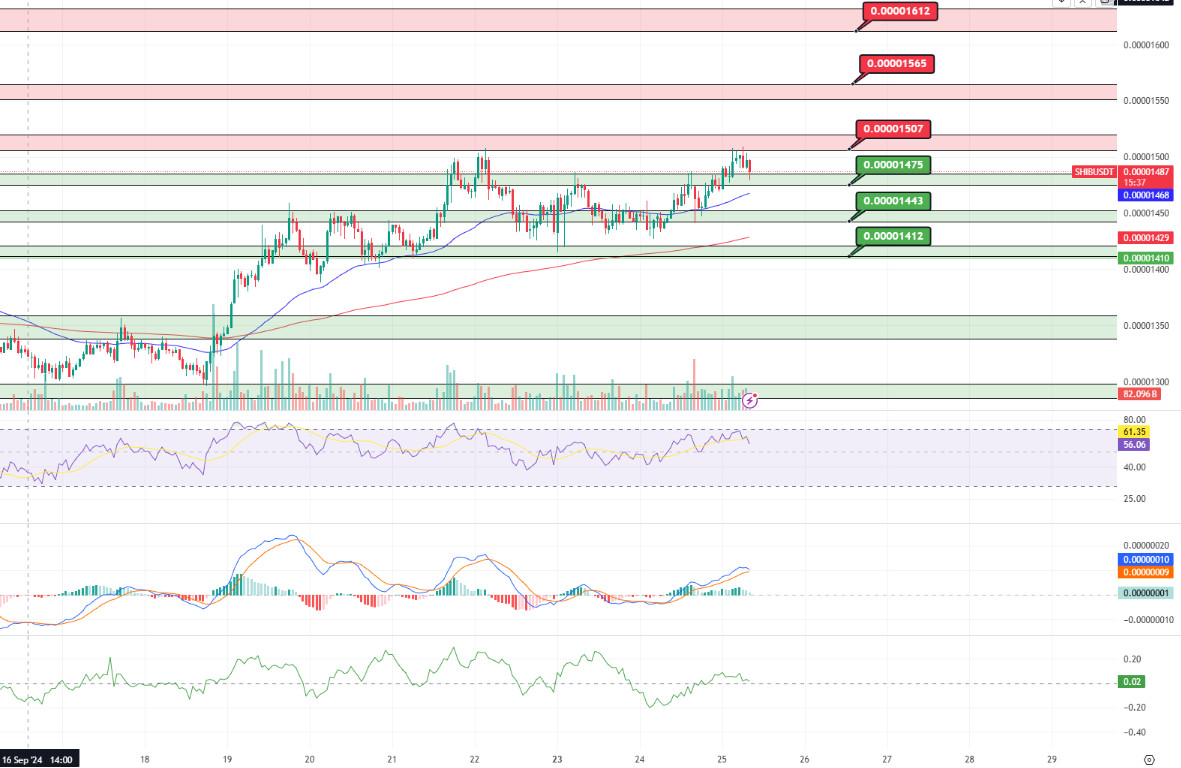
When we examine the chart of Shiba Inu (SHIB), the price seems to be rejected from the 0.00001507 resistance level. When we examine the MACD oscillator, we see that the buyer pressure is decreasing. If the price cannot maintain above the 0.00001475 level, the next support level may retreat to 0.00001443 levels. In the positive scenario, if the price can maintain above the 0.00001475 level, it may want to break the selling pressure at the 0.00001507 level.
(Blue line: EMA50, Red line: EMA200)
Supports 0.00001475 – 0.00001443 – 0.00001412
Resistances 0.00001507 – 0.00001565 – 0.00001612
LEGAL NOTICE
The investment information, comments and recommendations contained herein do not constitute investment advice. Investment advisory services are provided individually by authorized institutions taking into account the risk and return preferences of individuals. The comments and recommendations contained herein are of a general nature. These recommendations may not be suitable for your financial situation and risk and return preferences. Therefore, making an investment decision based solely on the information contained herein may not produce results in line with your expectations.
