MARKET SUMMARY
Latest Situation in Crypto Assets
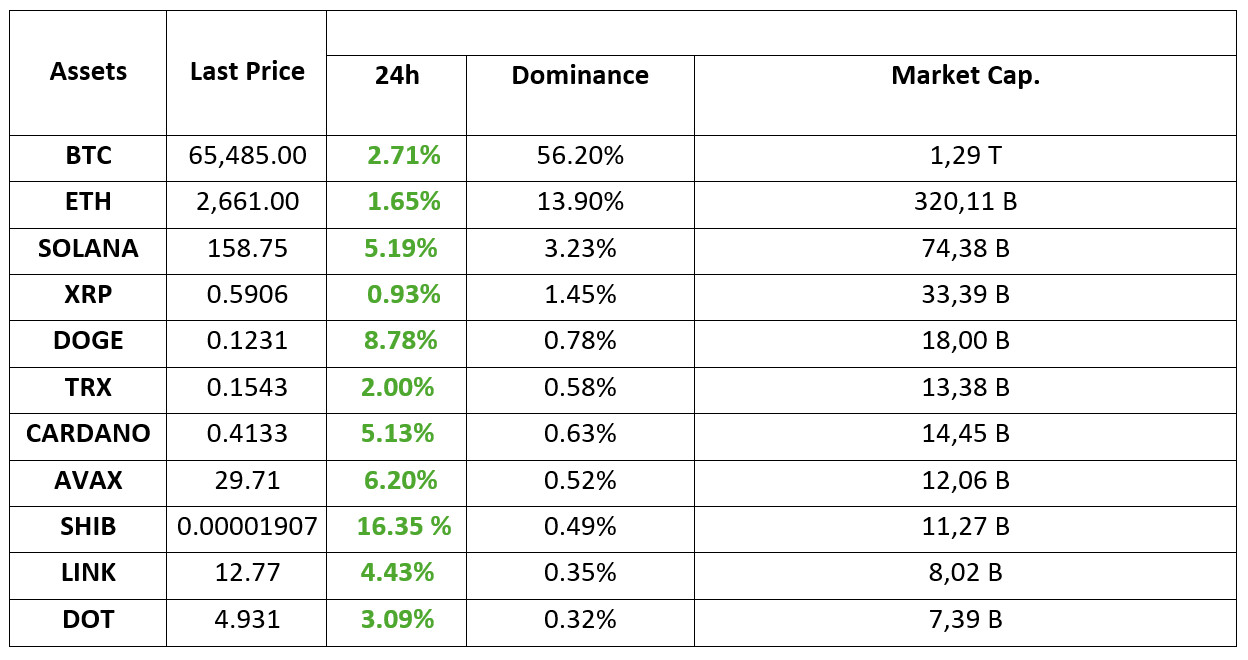
*Prepared on 27.09.2024 at 07:00 (UTC)
WHAT’S LEFT BEHIND
Bitcoin Exceeds $65,000!
Bitcoin $65,463 gained this week, crossing the $65,000 threshold. The rise is being driven by a rally in the stock market, positive US labor market data and China’s economic stimulus measures.
Options Traders Expect Bitcoin to Hit $100K by December 27!
Bitcoin options worth more than $5 billion will expire tomorrow. Analysts said the expiration of options could cause price fluctuations, while Deribit CEO Luuk Strijers said that demand for Bitcoin call options has increased, indicating bullish momentum.
New Development in XRP Case!
The SEC plans to appeal the July ruling in the Ripple case. In particular, the fact that XRP programmatic sales are not considered securities triggers the SEC’s appeal. The appeal is expected to be filed by October 7, 2024.
HIGHLIGHTS OF THE DAY
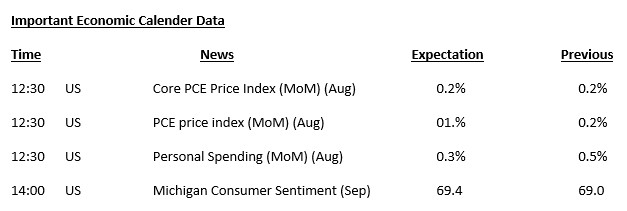
INFORMATION
*The calendar is based on UTC (Coordinated Universal Time) time zone. The economic calendar content on the relevant page is obtained from reliable news and data providers. The news in the economic calendar content, the date and time of the announcement of the news, possible changes in the previous, expectations and announced figures are made by the data provider institutions. Darkex cannot be held responsible for possible changes that may arise from similar situations.
MARKET COMPASS
In global markets, the easing steps of the central banks that manage the monetary policies of the world’s two largest economies continue to have an impact on prices. Following the US Federal Reserve’s “jumbo” interest rate cut of 50 basis points, the People’s Bank of China (PBOC) and other institutions announced incentives to reignite the economy. In line with this, increased risk appetite is dominating the markets.
Following the rise in major Asian stock markets, European indices are also expected to start the day positively this morning. US futures are flat. While digital assets benefit from the increased risk appetite, the continued inflow of money into ETFs is a supportive factor. Under this positive atmosphere, markets seem to think that it is better to ignore the developments in the Middle East and other negative dynamics.
FED and PCE Price Index
We think that the core PCE Price Index from the US today will be important for the continuation of the exuberant ecosystem in recent days. Yesterday, we saw better than expected data from the US. Markets interpreted this as a “recession-free stance”. However, it also means that the Fed may move away from rapid rate cuts. According to the CME FedWatch Tool, there is a 51% chance that the Fed will cut rates by 25 basis points on November 7th. Today’s data is important as it may shape these expectations.
We think that the core PCE Price Index, which the FED closely monitors for inflation, may have an impact on pricing. This macro indicator is expected to point to a 0.2% increase in August. While a lower-than-expected data could be bullish for digital assets on expectations that the FED may continue to stay close to big rate cuts, a higher-than-expected data could put pressure.
TECHNICAL ANALYSIS
BTC/USDT
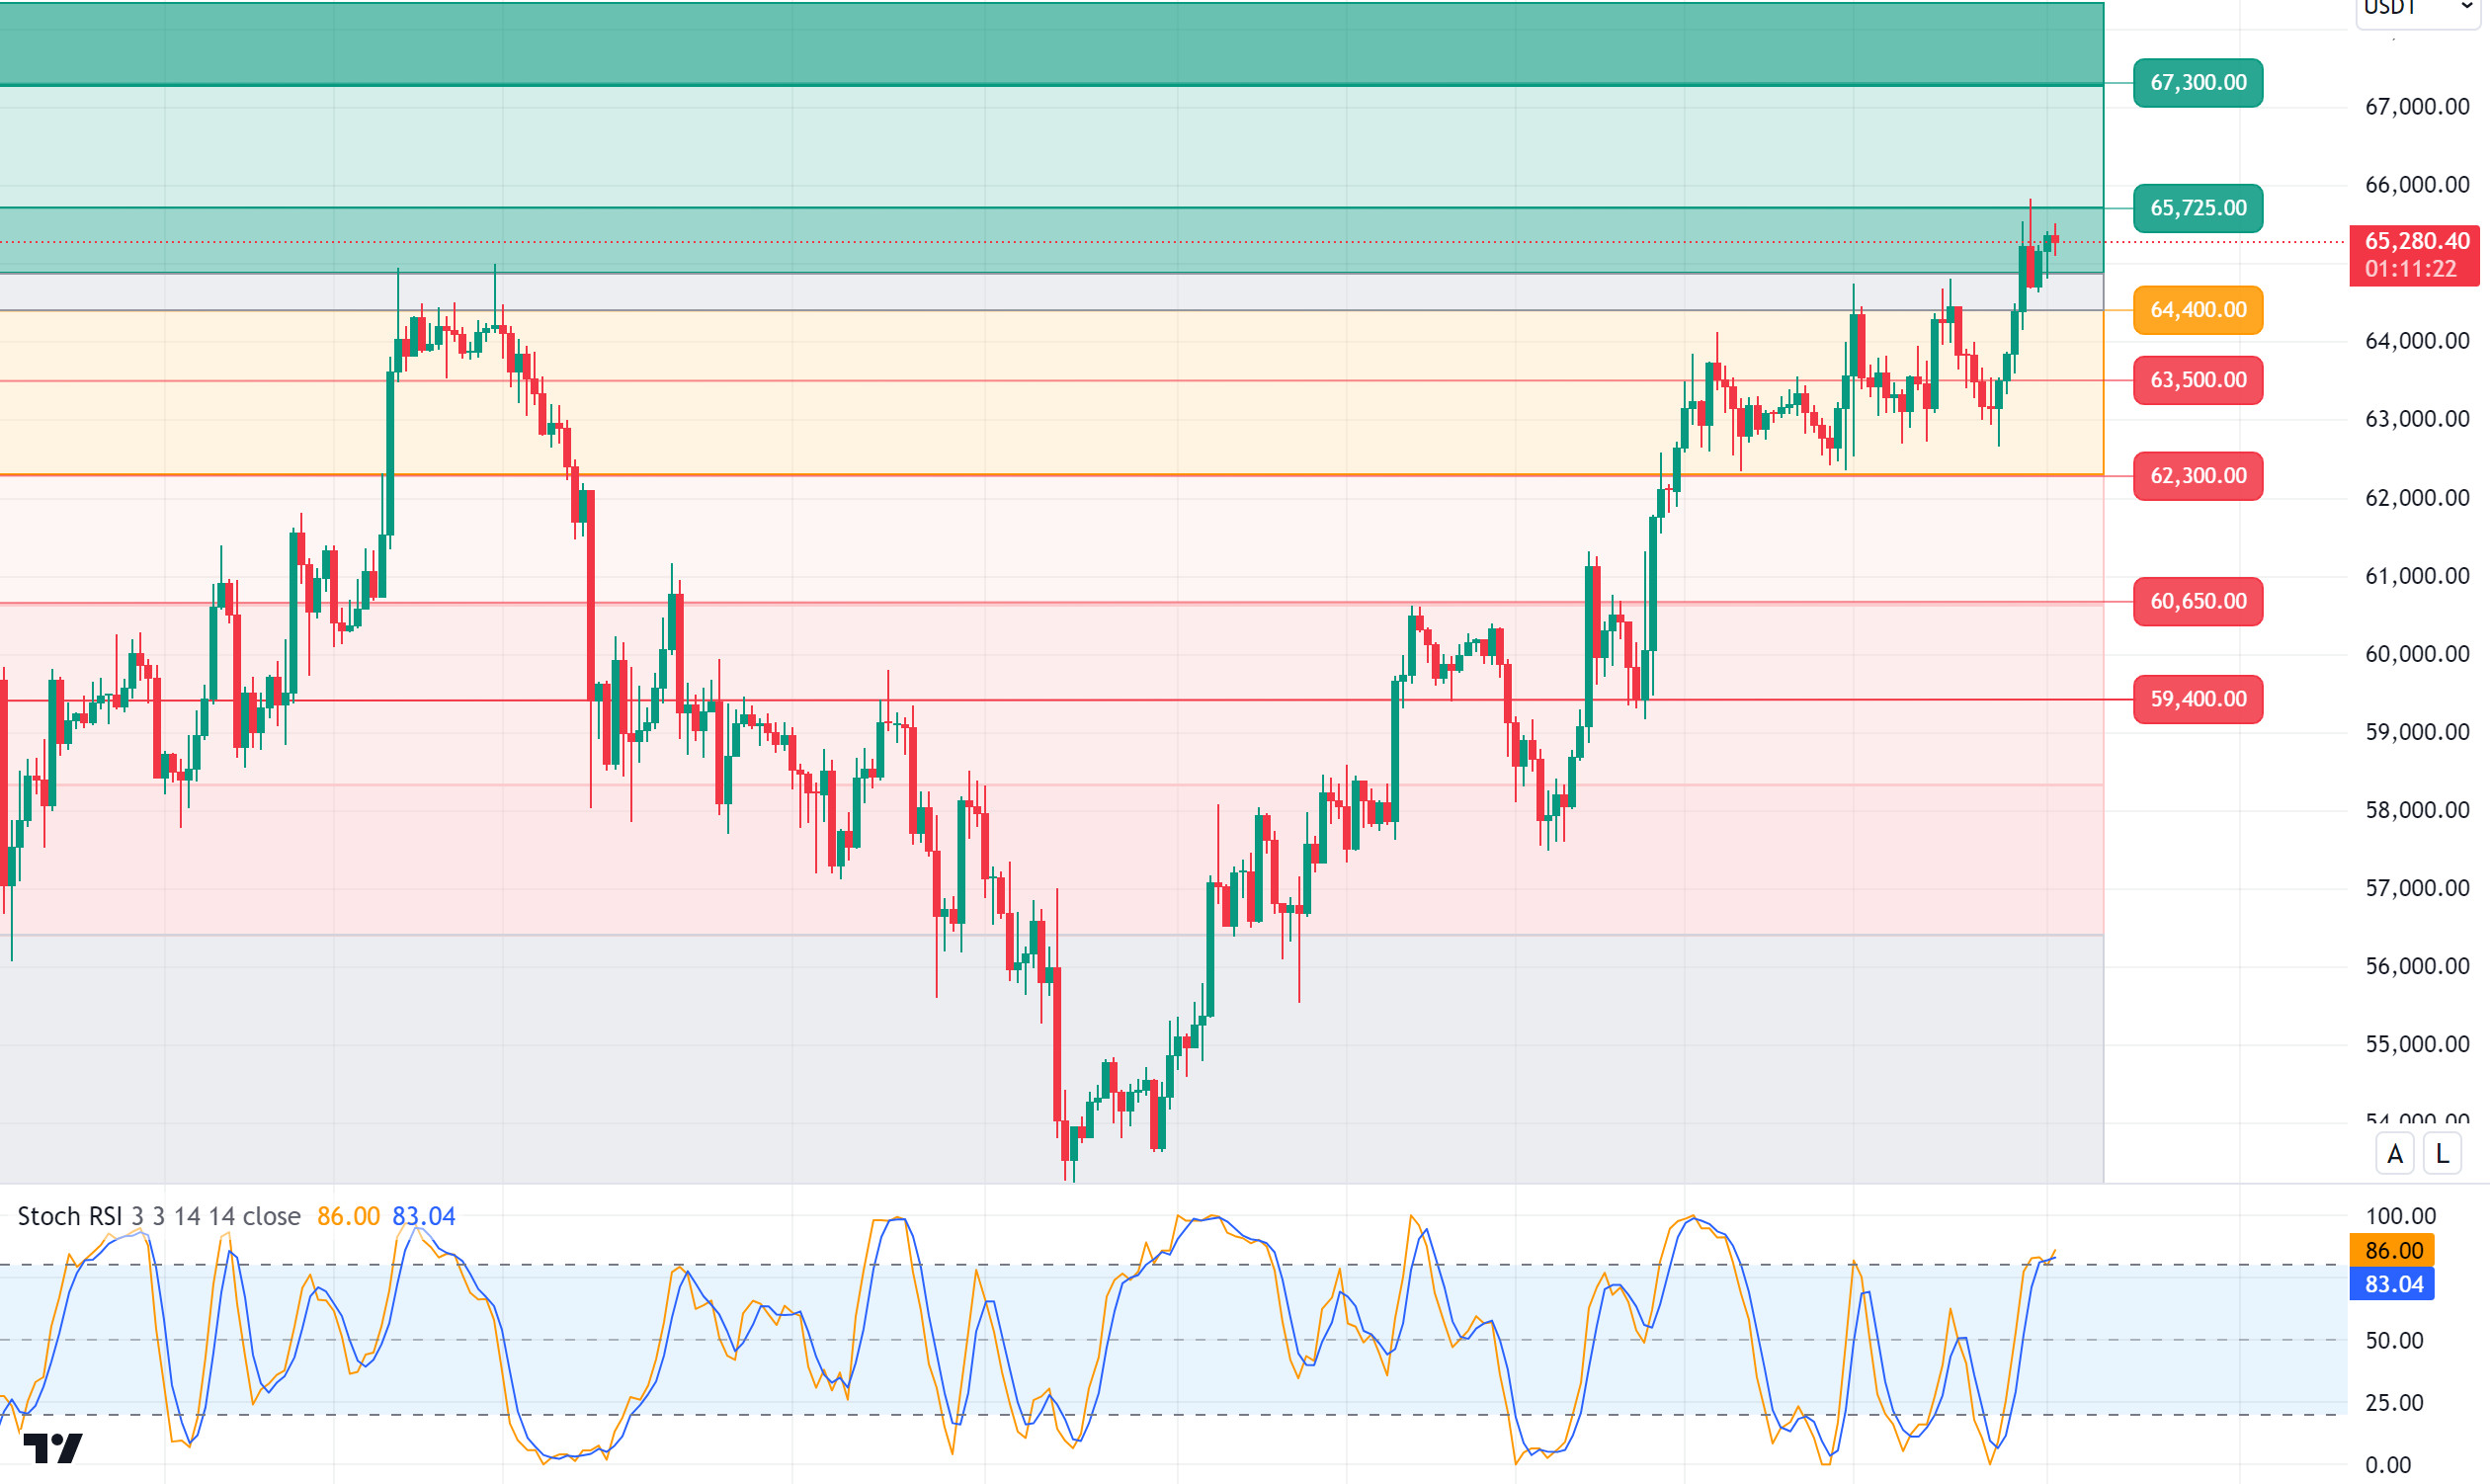
Bitcoin options! On the fundamental analysis side, the $5.8 billion Bitcoin option expiring today on the Deribit exchange is considered one of the most important option closures of 2024. Options contracts of this size can lead to fluctuations in the Bitcoin price as investors close or extend their positions. However, the fact that Bitcoin call options are more expensive than put options can provide a positive outlook. We can say that it is important for traders to take this into account in order to develop a strategy. In BTC 4-hour technical analysis, the price, which is on the rise with the break of the 64,400 level, which is the support point, is currently trading at 65,500. The level that I expect to appear as a resistance level is 65,750. If this level is passed, the upward momentum may continue to strengthen and 67,300 levels may be tested. Correctional movements in BTC, which is expected to reach the new ATH level in the coming month, may create a new buying opportunity. With the RSI reaching the oversold zone, the 64,400 level will be the new support point in case of a possible pullback.
Supports 62,300 – 60,650 – 59,400
Resistances 64,450 – 65,725 – 67,300
ETH/USDT
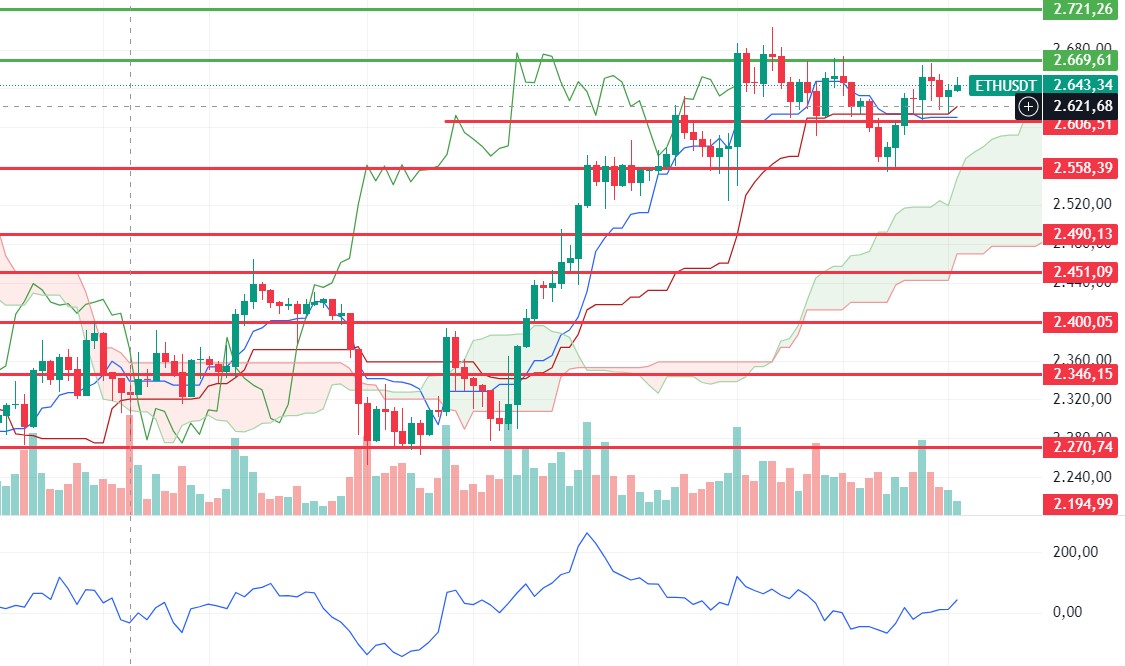
There does not yet seem to be a clear signal for Ethereum, which moves horizontally between 2,606 – 2,669 levels. However, looking at both CVDs and momentum, it is seen that the appetite for buying has decreased slightly. Considering that bitcoin is also at resistance levels, another correction movement may come during the day. Pullbacks up to 2.606 can be expected. The break of this level may bring 2,558 levels. For a positive scenario, it seems necessary to break the 2,669 level. After the breakout, 2,721 stands out as the first target.
Supports 2,606 – 2,558 – 2,490
Resistances 2,669 – 2,721 – 2,815
LINK/USDT
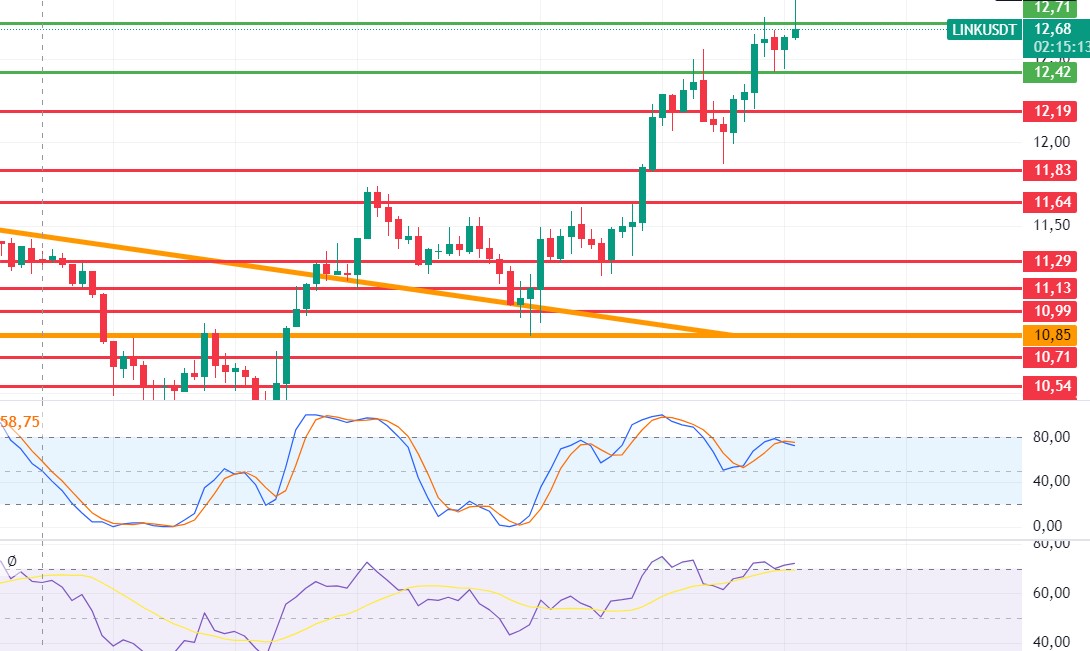
Although LINK crossed the 12.71 resistance, it quickly fell back below it again. After this move, a sell signal in stochastic and a negative mismatch in RSI have developed. In this context, a correction to 12.42 levels can be expected during the day. With the break of this level, the decline may deepen to 12.19 levels. Closes above 12.71 may disrupt the sell signal and mismatch and ensure the continuation of the uptrend.
Supports 12.42 – 12.19 – 11.83
Resistances 12.71 – 13.46 – 14.75
SOL/USDT
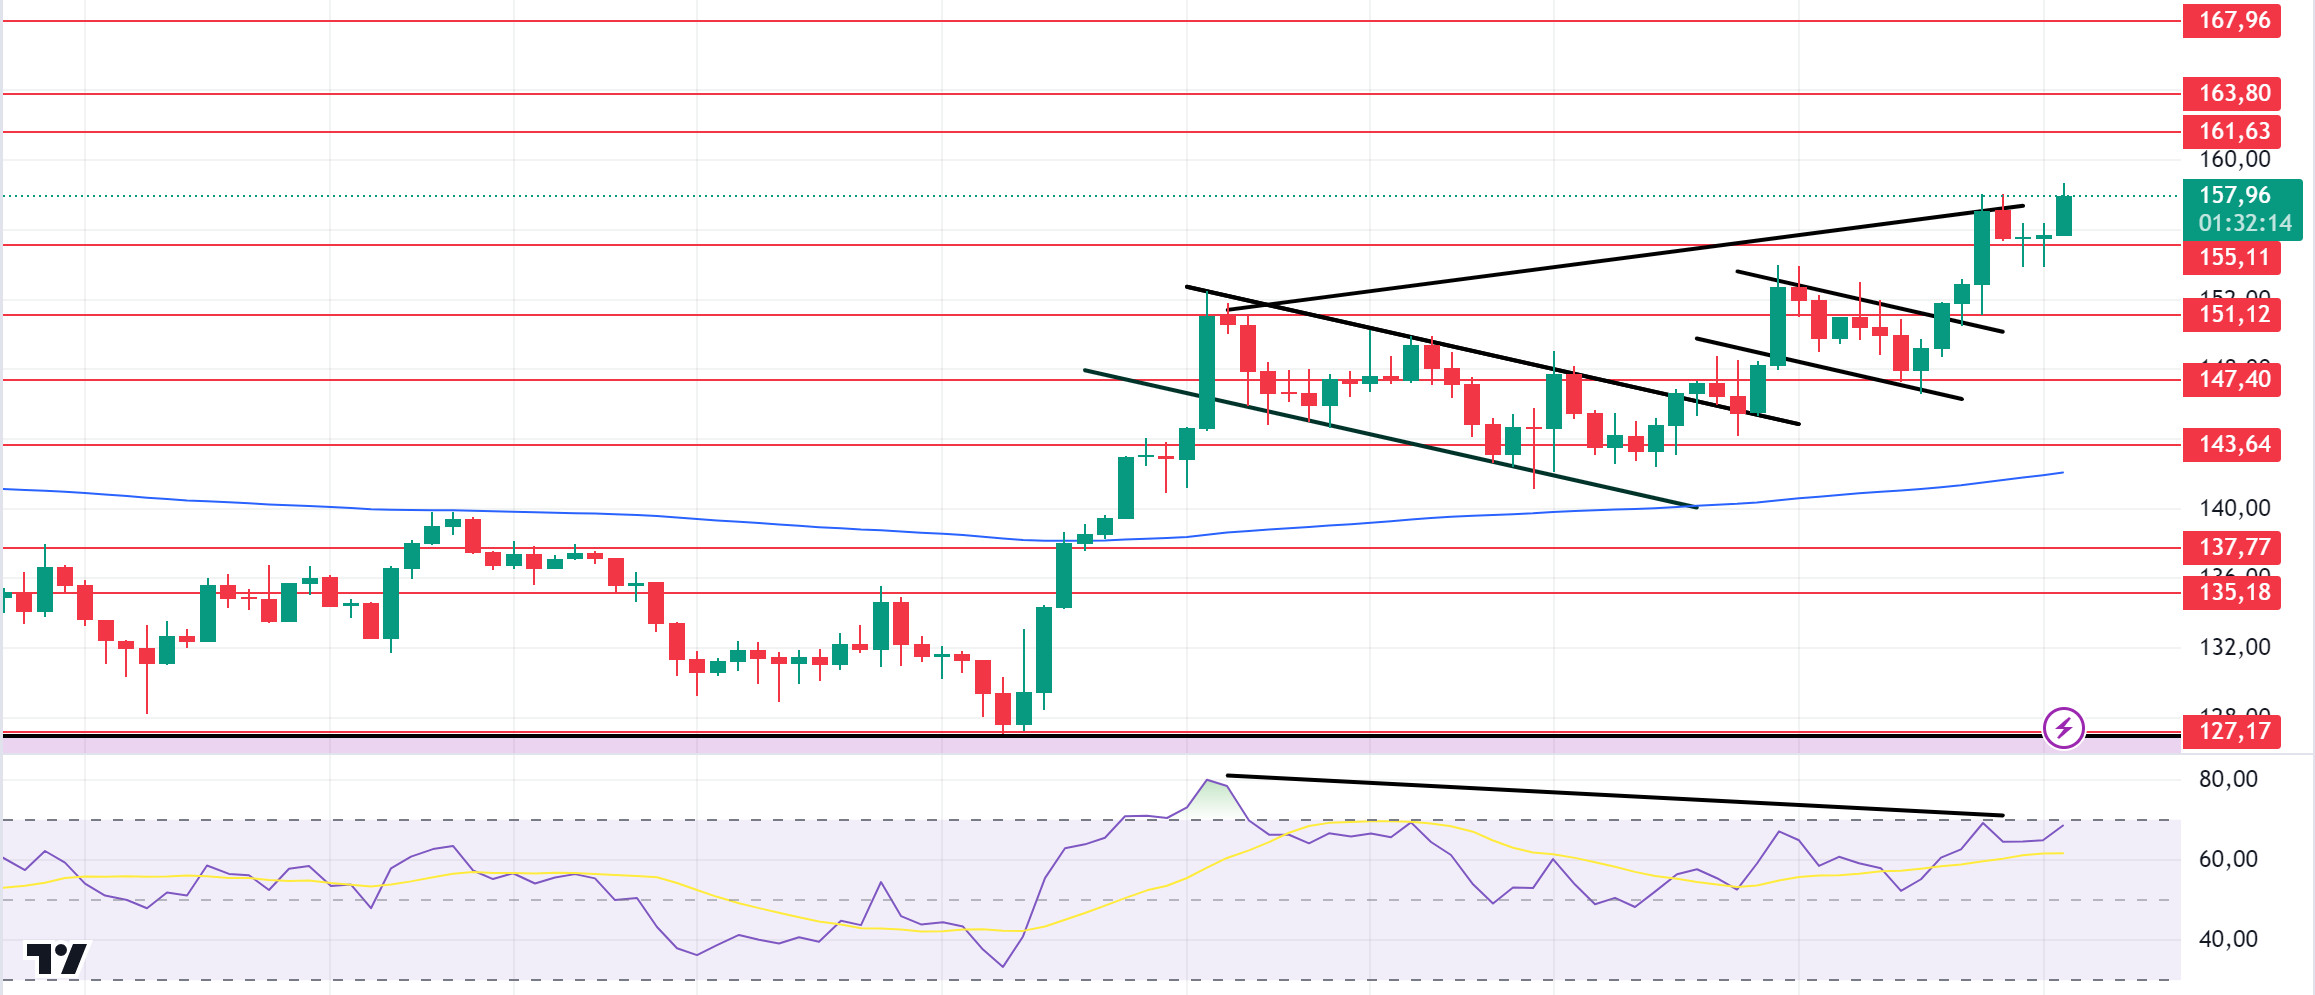
US Core PCE Price Index is among the data to follow today. Data from CME shows that the probability of a 50 basis point rate cut is 50.2%. In the Solana ecosystem, the Phantom wallet seems to increase the potential volume and inflows of the Solana ecosystem by integrating with dYdX, bringing deFi access to millions. Looking at the chart, SOL is about to reach a strong resistance point. The 161.63 – 163.80 band, which is the highest level of the last two months, could reverse the SOL price from here. When we look at the 4-hour rsi (14) indicator, there is a mismatch. This may cause pullbacks. Both macroeconomic conditions and innovations in the Solana ecosystem, 161.63 – 163.80 levels appear as a resistance place. If it rises above these levels, the rise may continue. If investors continue profit sales, the 200 EMA average and 155.11 – 151.12 levels appear as support in the retracements that will occur. If it comes to these support levels, a potential rise should be followed.
Supports 155.11 – 151.12 – 147.40
Resistances 161.63 – 163.80 – 167.96
ADA/USDT
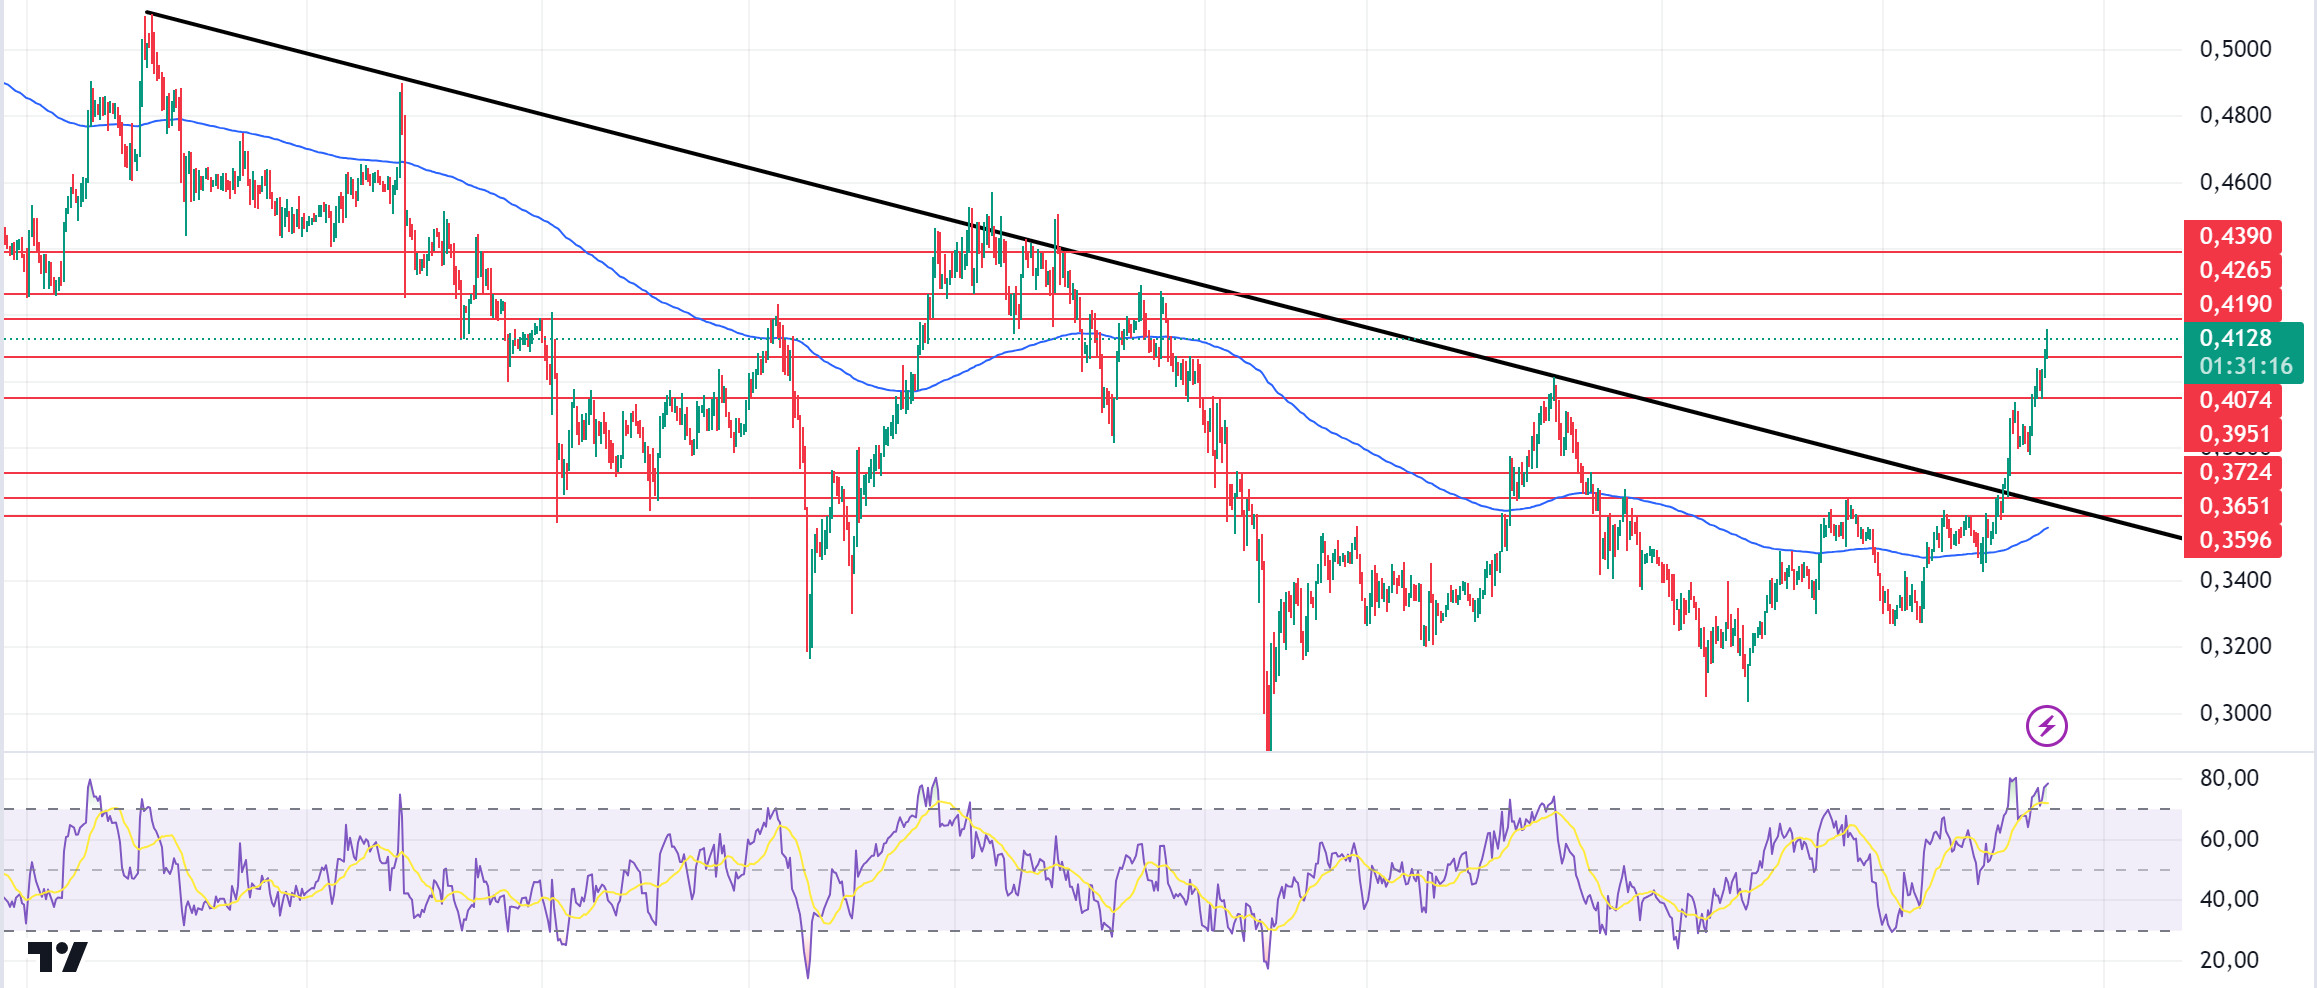
US Core PCE Price Index is among the data to follow today. According to the data from CME, the probability of a 50 basis points rate cut is 50.2%. ADA broke the resistance of the downtrend that has been going on since May 21, signaling a potential uptrend. The last time ADA saw these levels on July 29, the level of 0.3951 appears as a strong support in retracements due to possible profit sales. It should be noted that the Rsi (14) indicator is overbought. In the rises that will take place with the continuation of macro-economic data or the positive atmosphere in the ecosystem, the 0.4074 level can be followed as resistance.
Supports 0.4074 – 0.3951 – 0.3724
Resistances 0.4190 – 0.4265 – 0.4390
AVAX/USDT
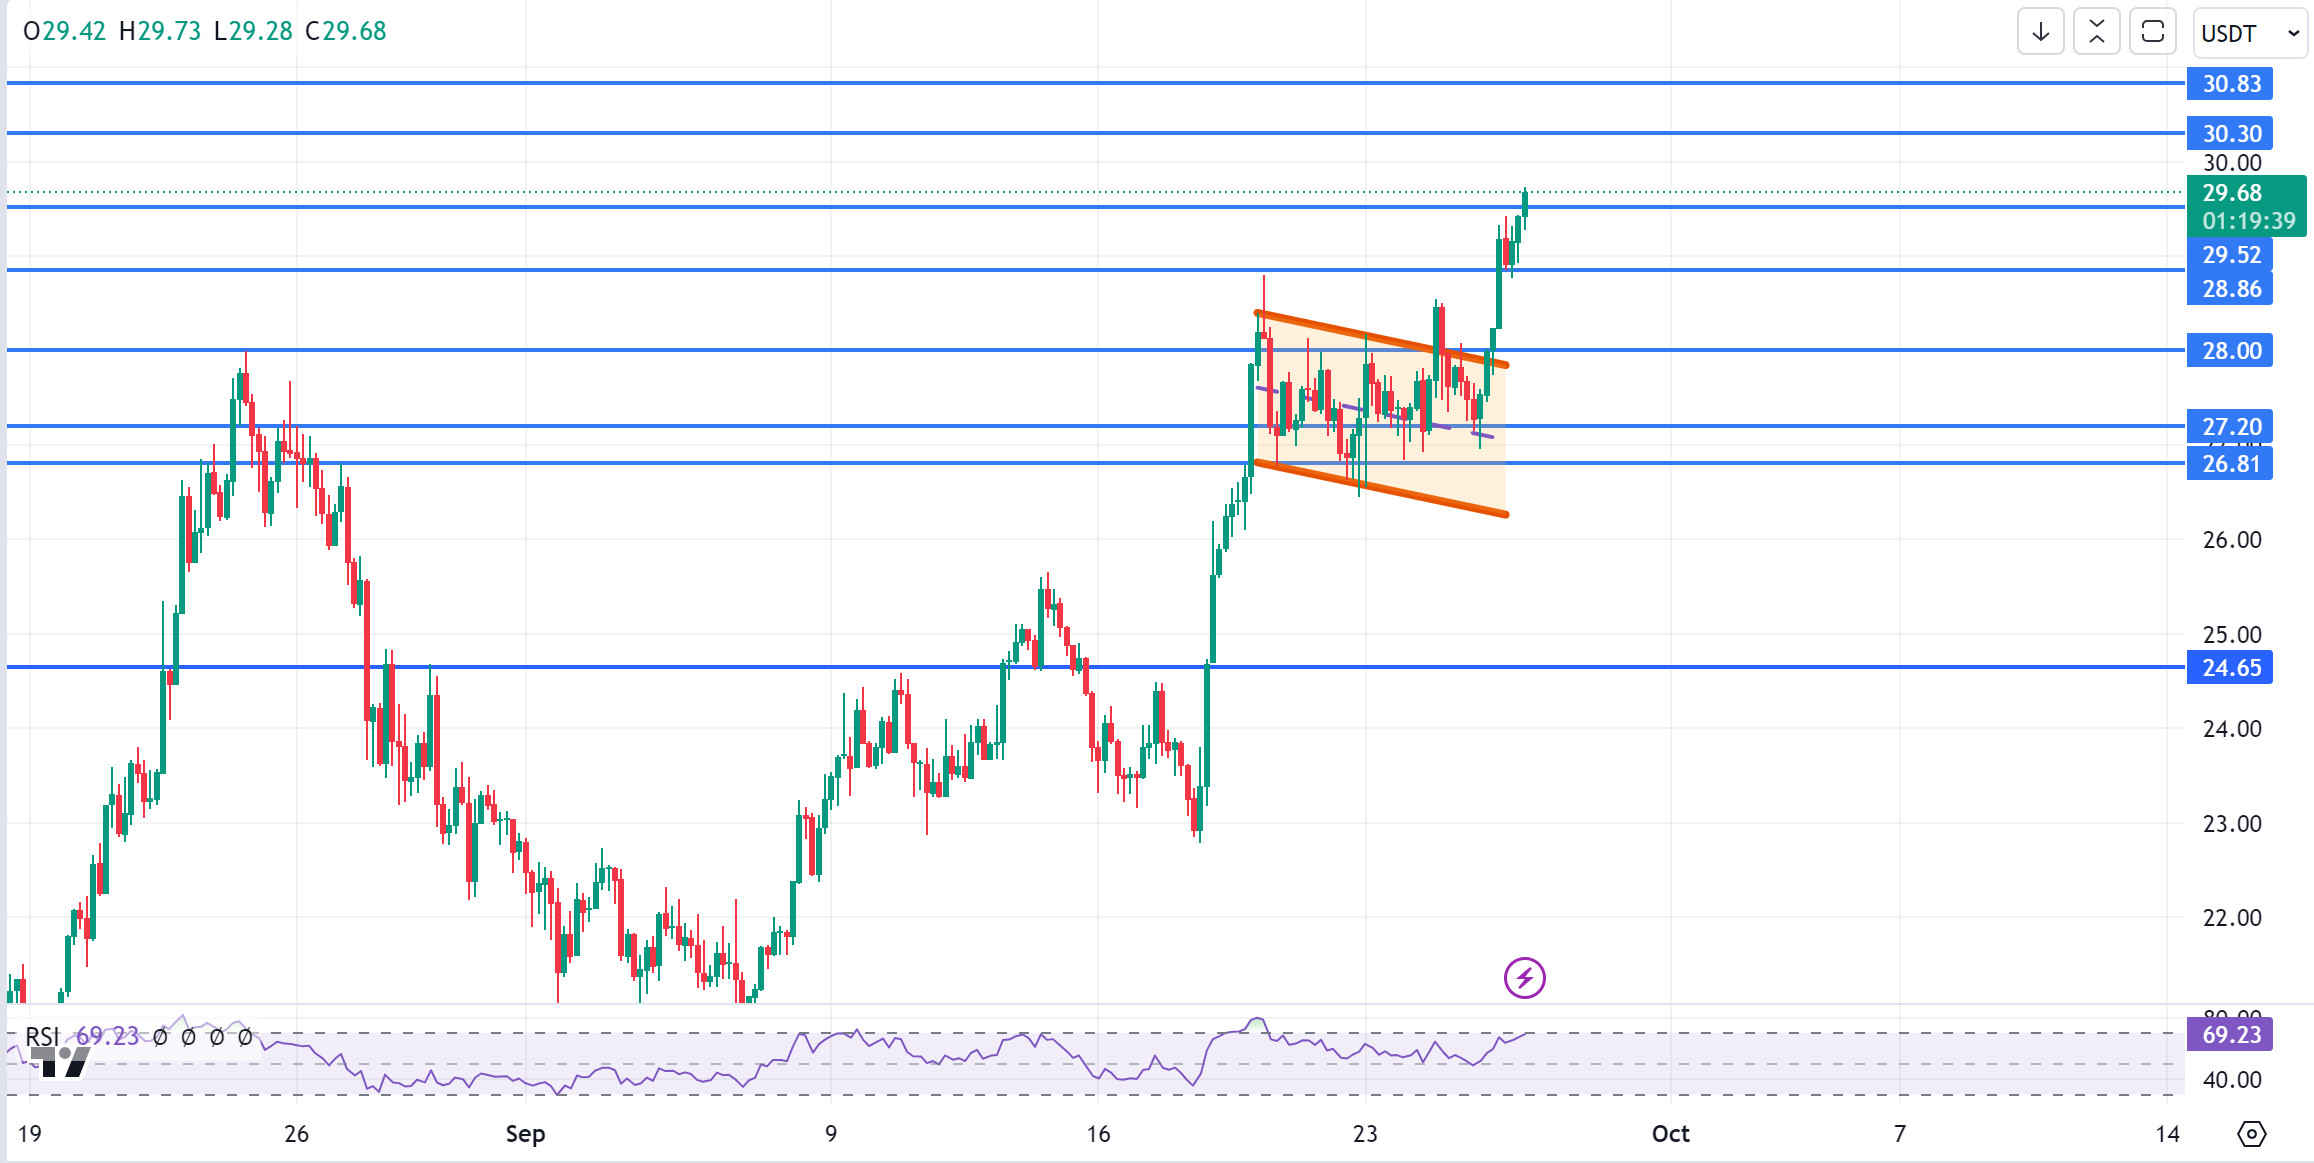
AVAX, which opened yesterday at 27.29, rose by about 7% during the day and closed the day at 29.16. There is no planned data flow that will affect the market today. For this reason, volatility can be expected to be lower than other days.
AVAX, which is currently trading at 29.68, is trying to break the 29.52 resistance, which is the rising flag pattern target on the 4-hour chart. The RSI has reached the overbought zone with a value of 69 and may experience some retracement if it fails to break the 29.52 resistance upwards. In such a case, it can be expected to test the 28.86 resistance. If it closes the candle above 29.52 resistance, buying may increase. In such a case, it may test the 30.30 resistance. As long as it stays above 24.65 support during the day, the desire to rise may continue. With the break of 24.65 support, sales may increase.
Supports 28.86 – 28.00 – 27.20
Resistances 29.52 – 30.30 – 30.83
TRX/USDT
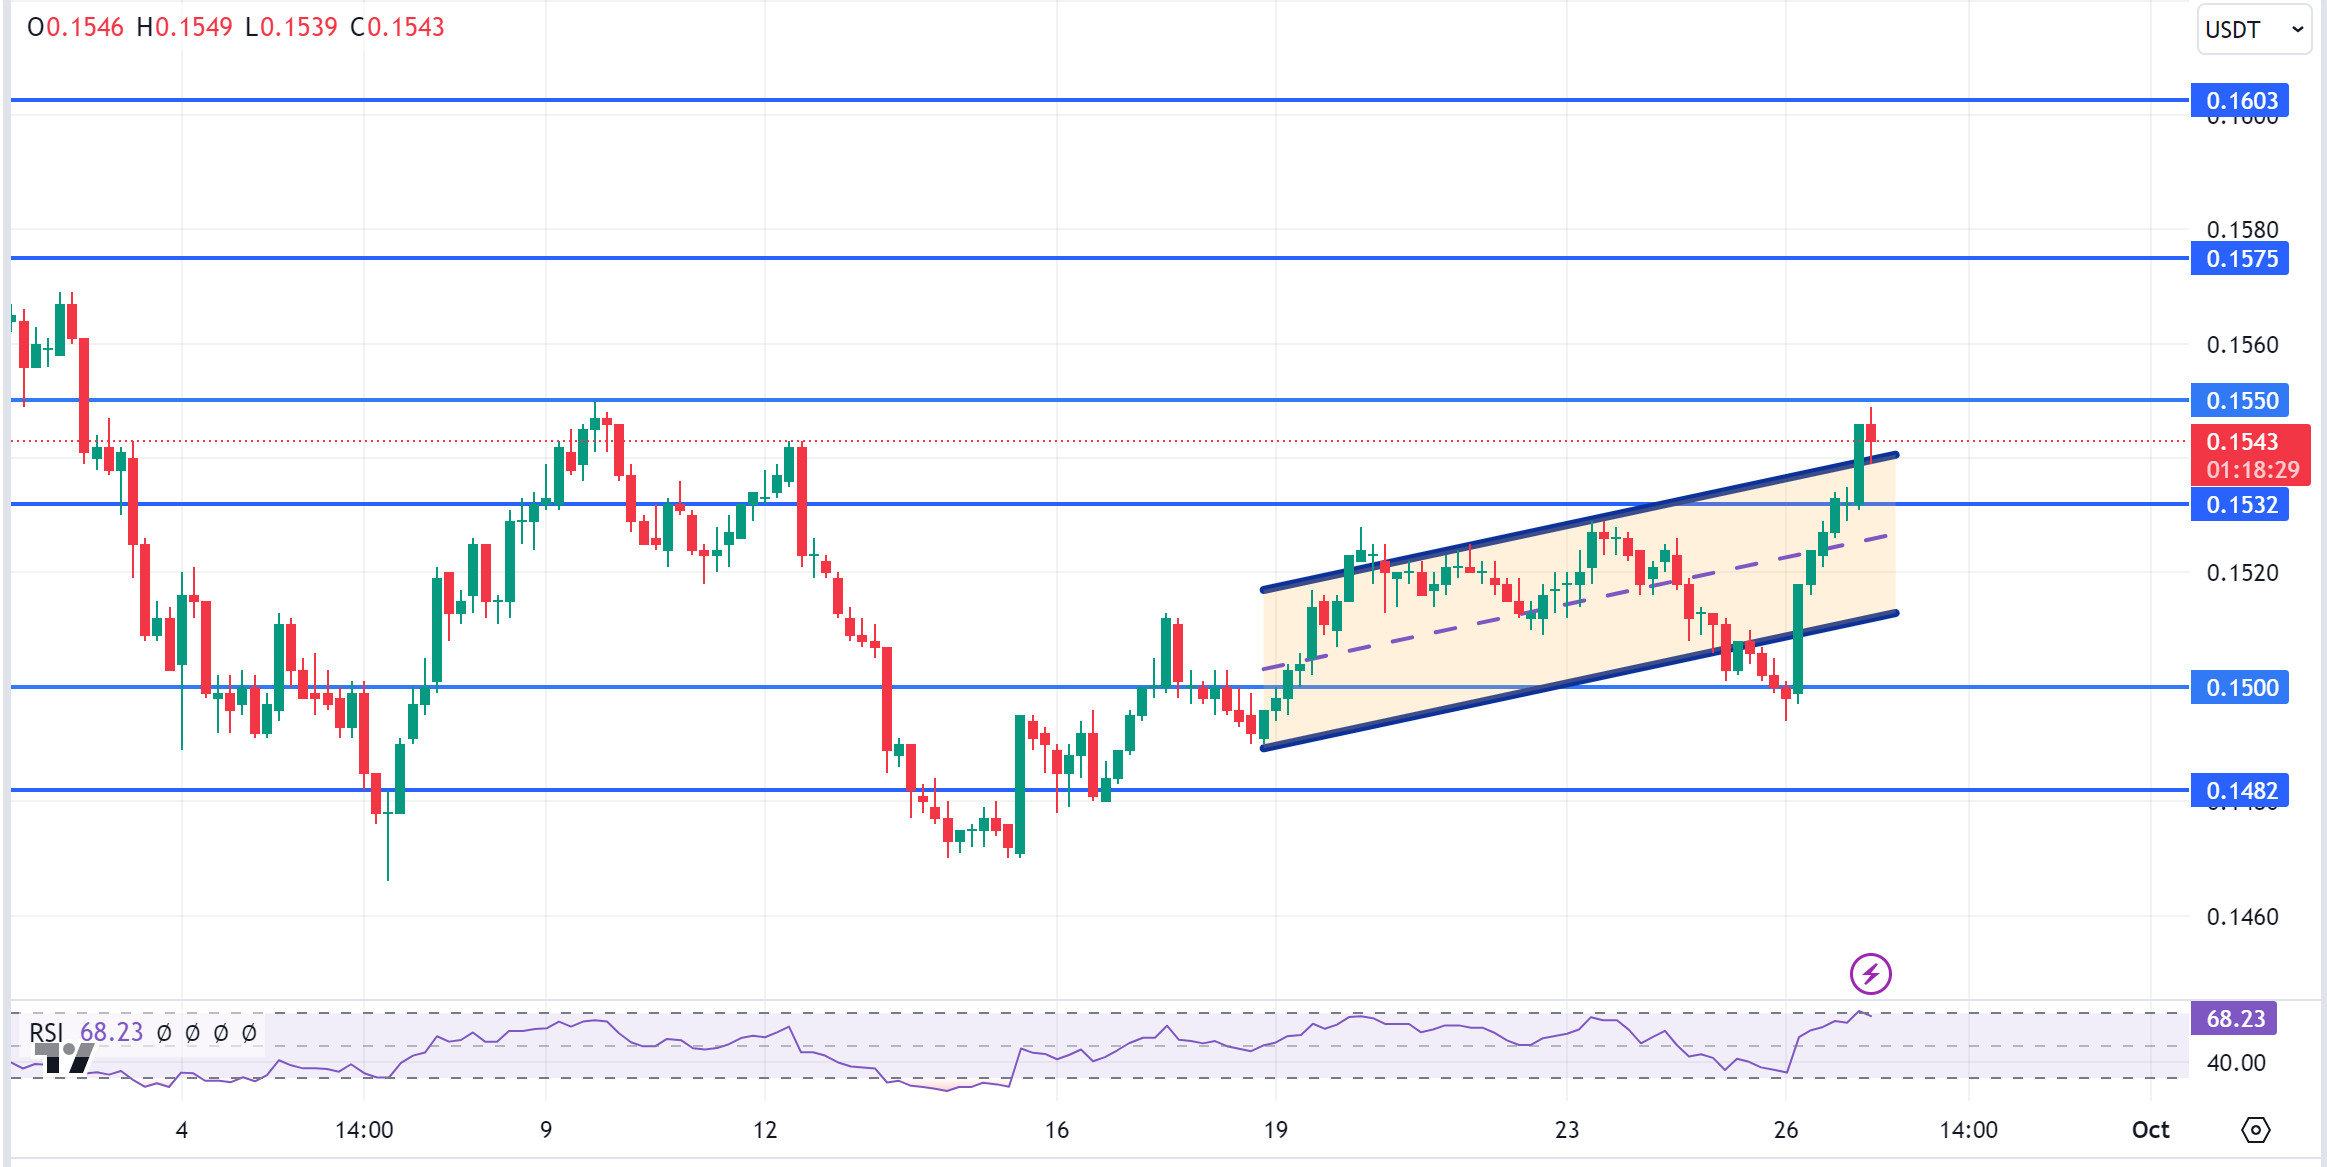
TRX, which started yesterday at 0.1500, rose 2% during the day and closed the day at 0.1532. Today, there is no planned data, especially from the US, that will affect the market. Therefore, we may have a day with low volume and limited movements.
TRX, currently trading at 0.1543, is trying to break the rising channel upwards on the 4-hour chart. The RSI is in the overbought zone with a value of 68 and has closed the candle above the upper band of the rising channel, and we can get confirmation that it breaks the channel upwards by breaking the 0.1550 resistance. Some decline can be expected from the current region. In such a case, it may move to the middle and upper band of the channel and test the 0.1532 support. However, its rise may continue when it breaks the 0.1550 resistance upwards and closes the candle above it. In this case, it may want to test 0.1575 resistance. As long as TRX stays above 0.1482 support, the desire to rise may continue. If this support is broken downwards, sales can be expected to increase.
Supports 0.1532 – 0.1500 – 0.1482
Resistances 0.1550 – 0.1575 – 0.1603
XRP/USDT
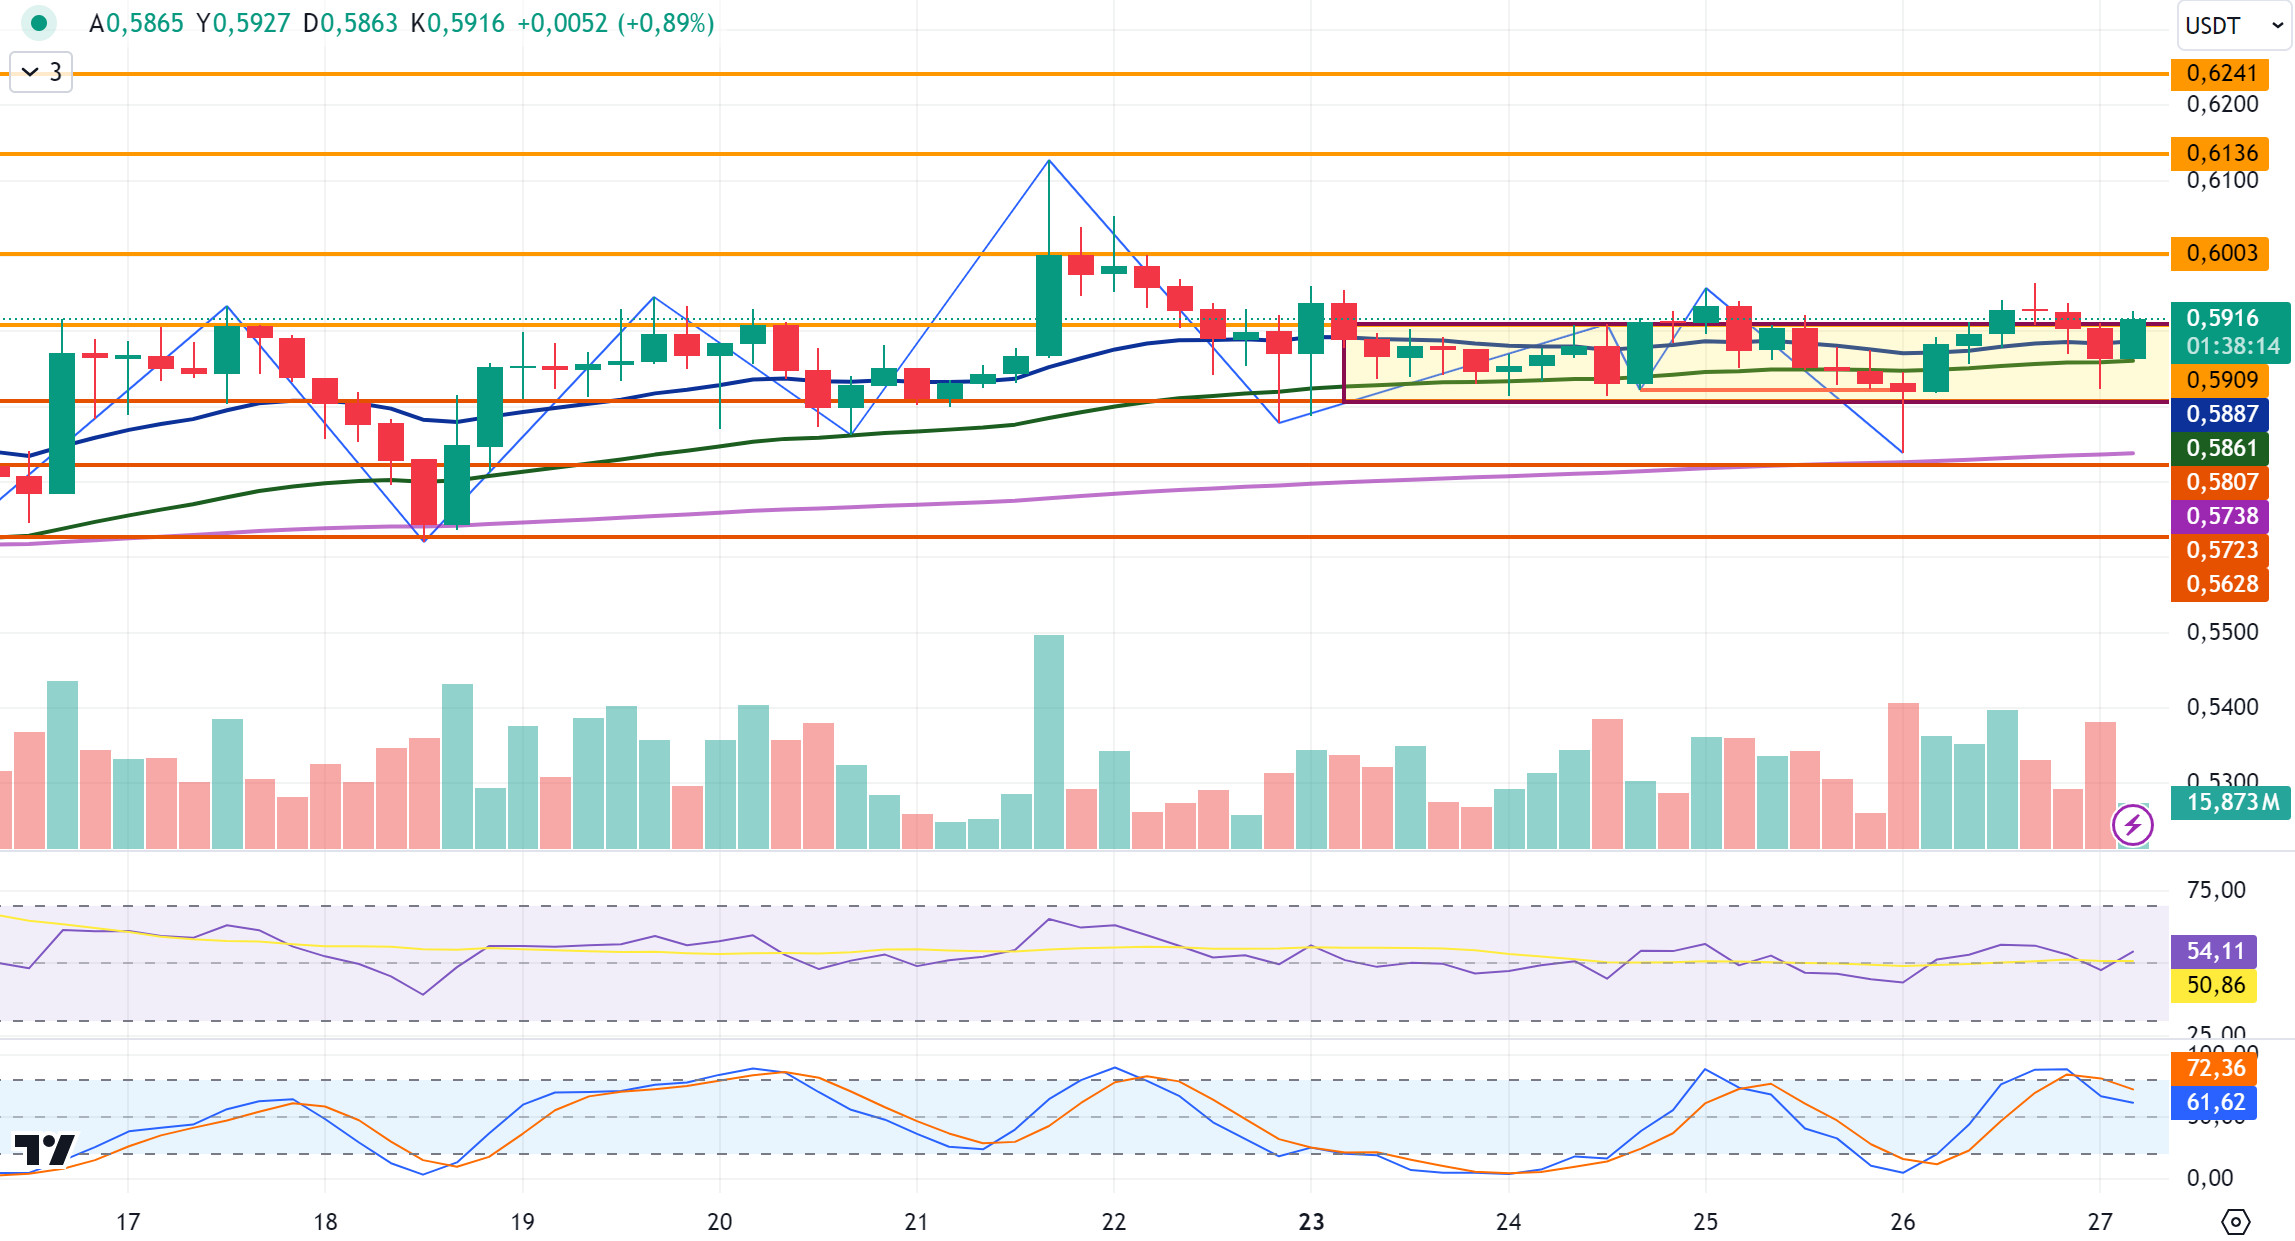
Yesterday, XRP closed the day at 0.5903 with a 1.3% increase in value. XRP, which fell on the opening candle in the 4-hour analysis today, rose with the purchases at the EMA50 level and rose again to the starting level of the day. XRP, currently trading at 0.5916, continues to trade within the 0.58 to 0.59 horizontal band in the week of sharp rises across the crypto market. In XRP, eyes are on the SEC’s decision regarding the court decision in the case with the SEC. The SEC has the right to appeal until October 7. A critical process begins for XRP in the SEC case. The last 10 days for the SEC to announce its decision. And in this process, the SEC can announce its decision at any time or wait until October 7 and use its right to appeal until the end. With the positive developments that may come in this process, XRP may test the resistance levels of 0.5909-0.6003-0.6136 if it rises. In case of negative developments and a decline, it may test the support levels of 0.5807-0.5723-0.5628.
For XRP, the EMA200 and 0.57 support zone stands out in the decline and may rise with the purchases that may come from these levels in the decline and may offer a long trading opportunity. Below the EMA200 and 0.57 support zone, the decline may deepen after the candle closure and may offer a short trading opportunity. If the candle closes above the 0.59 resistance zone, the uptrend may continue and offer a long trading opportunity.
EMA20 (Blue Line) – EMA50 (Green Line) – EMA200 (Purple Line)
Supports 0. 5807 – 0.5 723 – 0.5628
Resistances 0.5909 – 0.6 003 – 0.6136
DOGE/USDT
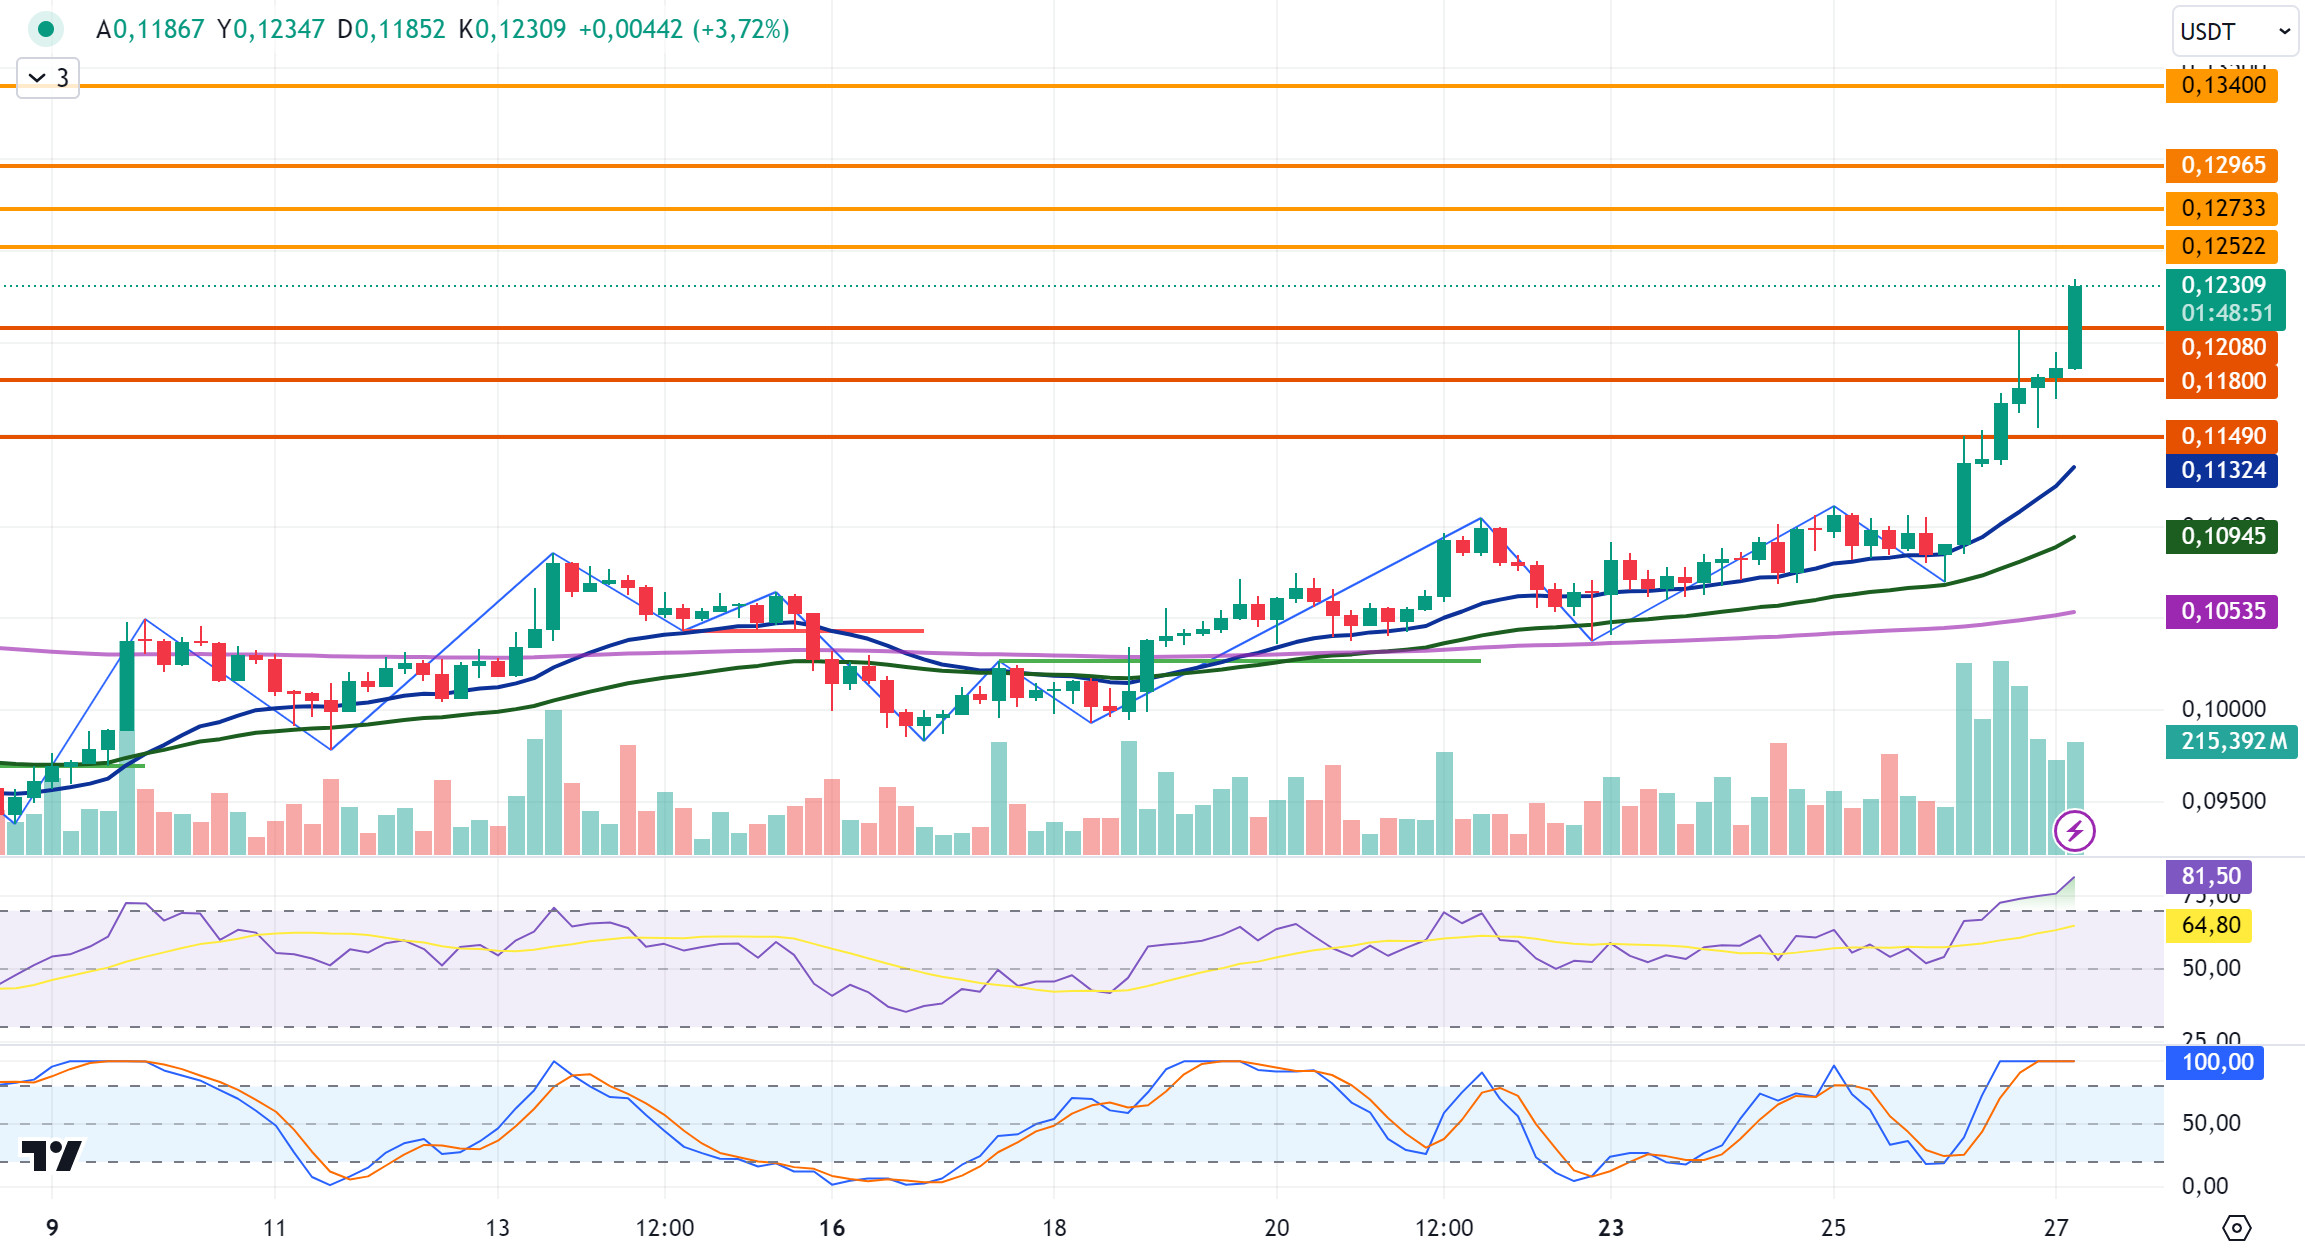
DOGE closed yesterday at 0.1181 with a value increase of approximately 9%. DOGE, which started the day with a rise yesterday, continued to rise with the economic data released by the US and the positive opening of the US stock markets. In the crypto market, where a positive environment prevails, DOGE continued to rise today and is currently trading at 0.1230. After the formation of a positive environment in line with the data coming from across the crypto market, the upward trend continues throughout the market with purchases. DOGE may test the resistance levels of 0.1252-0.1275-0.1296 by continuing its rise in the Y passing crypto market with its rise in this process. When we examine the RSI and Stochastic RSI data, DOGE, which is in the overbought zone, may experience a correction and test the support levels of 0.1208-0.1180-0.1149 in its decline.
DOGE may correct at the overbought level in the 0.1250 resistance zone on the rise and may offer a short trading opportunity. In the process where the positive environment continues, it may continue to rise after the correction and may offer a long trading opportunity.
Supports 0.1208 – 0.1180 – 0.1149
Resistances 0.1 252- 0.1275 – 0.1296
DOT/USDT
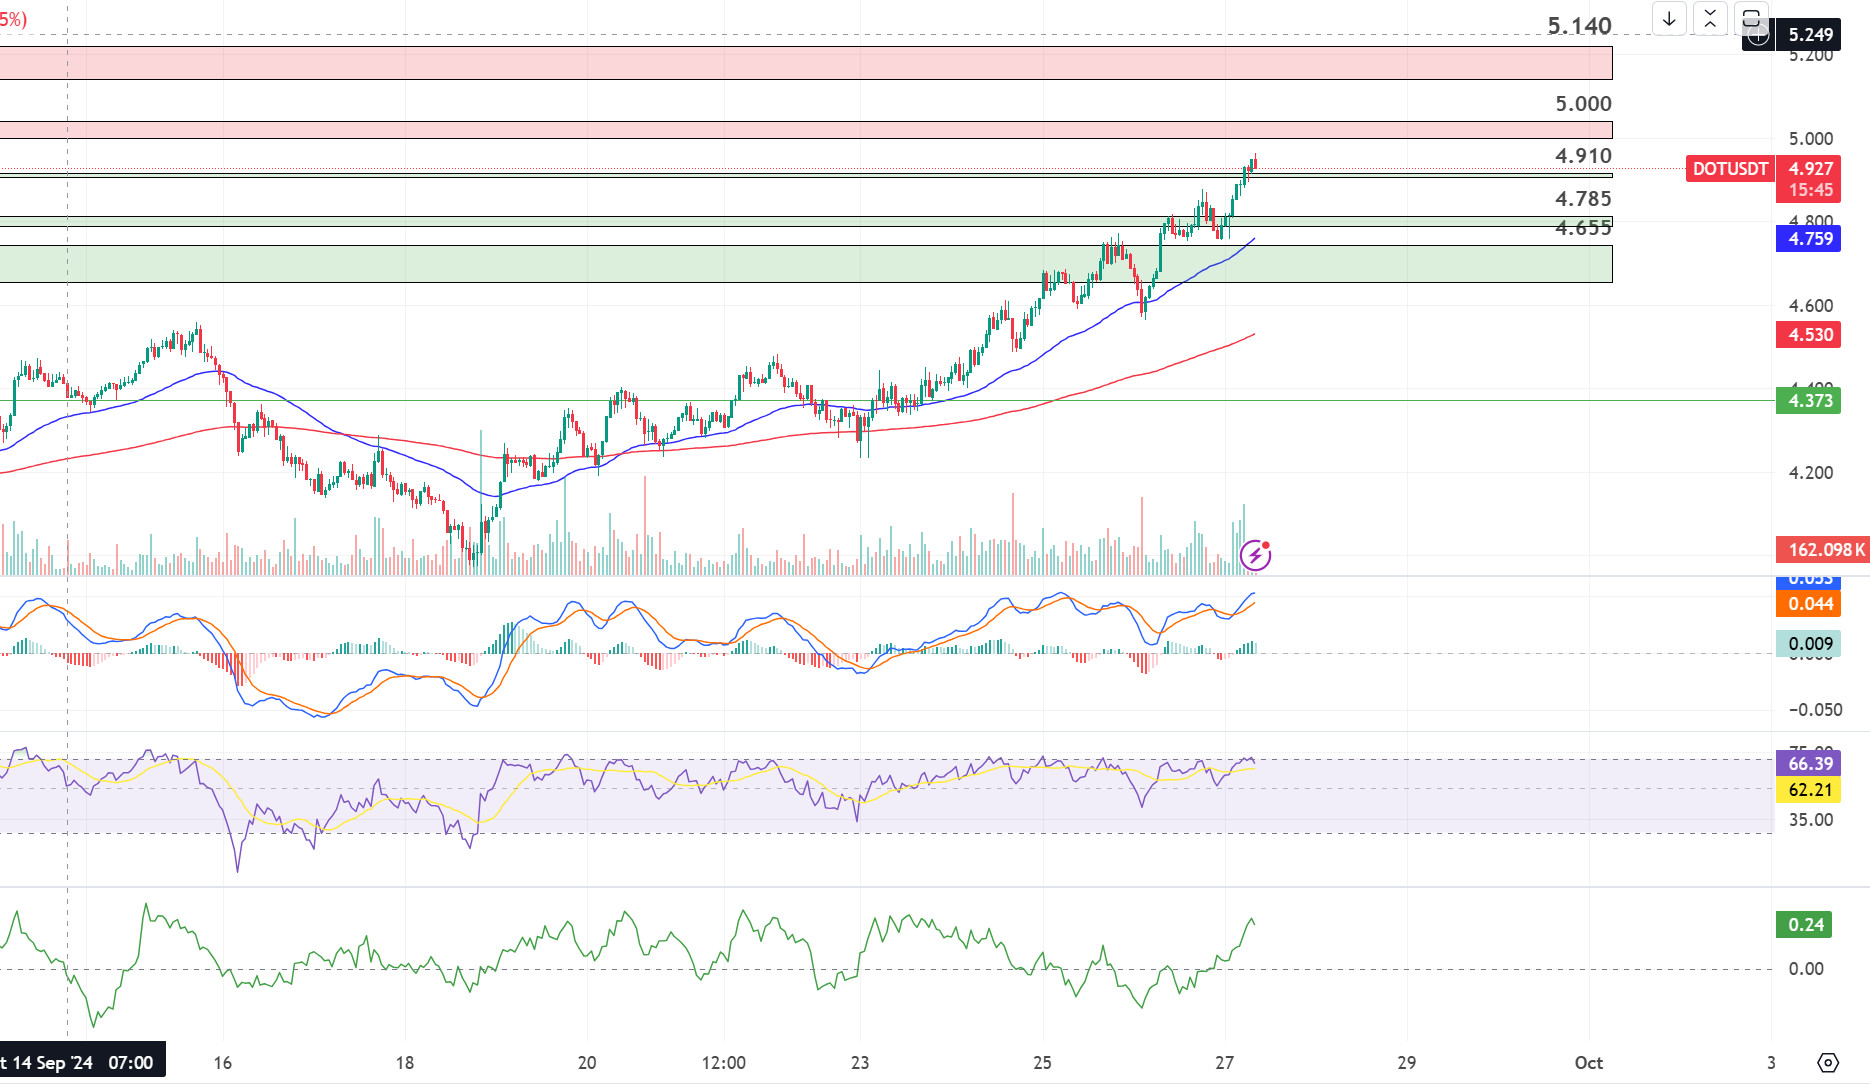
When we examine the Polkadot (DOT) chart, we see that the price rose above the 4.910 level. When we examine the CMF oscillator, we see that the buying pressure is stronger. In this context, if the price holds above the 4,910 level, its next target could be 5,000 levels. On the other hand, when we examine the MACD oscillator, we can say that the selling pressure has decreased compared to the previous hour. In case the price fails to hold above 4,910 levels, we can expect a retracement towards 4,785 levels.
(Blue line: EMA50, Red line: EMA200)
Supports 4.910 – 4.785 – 4.455
Resistances 5.000 – 5.140 – 5.425
SHIB/USDT
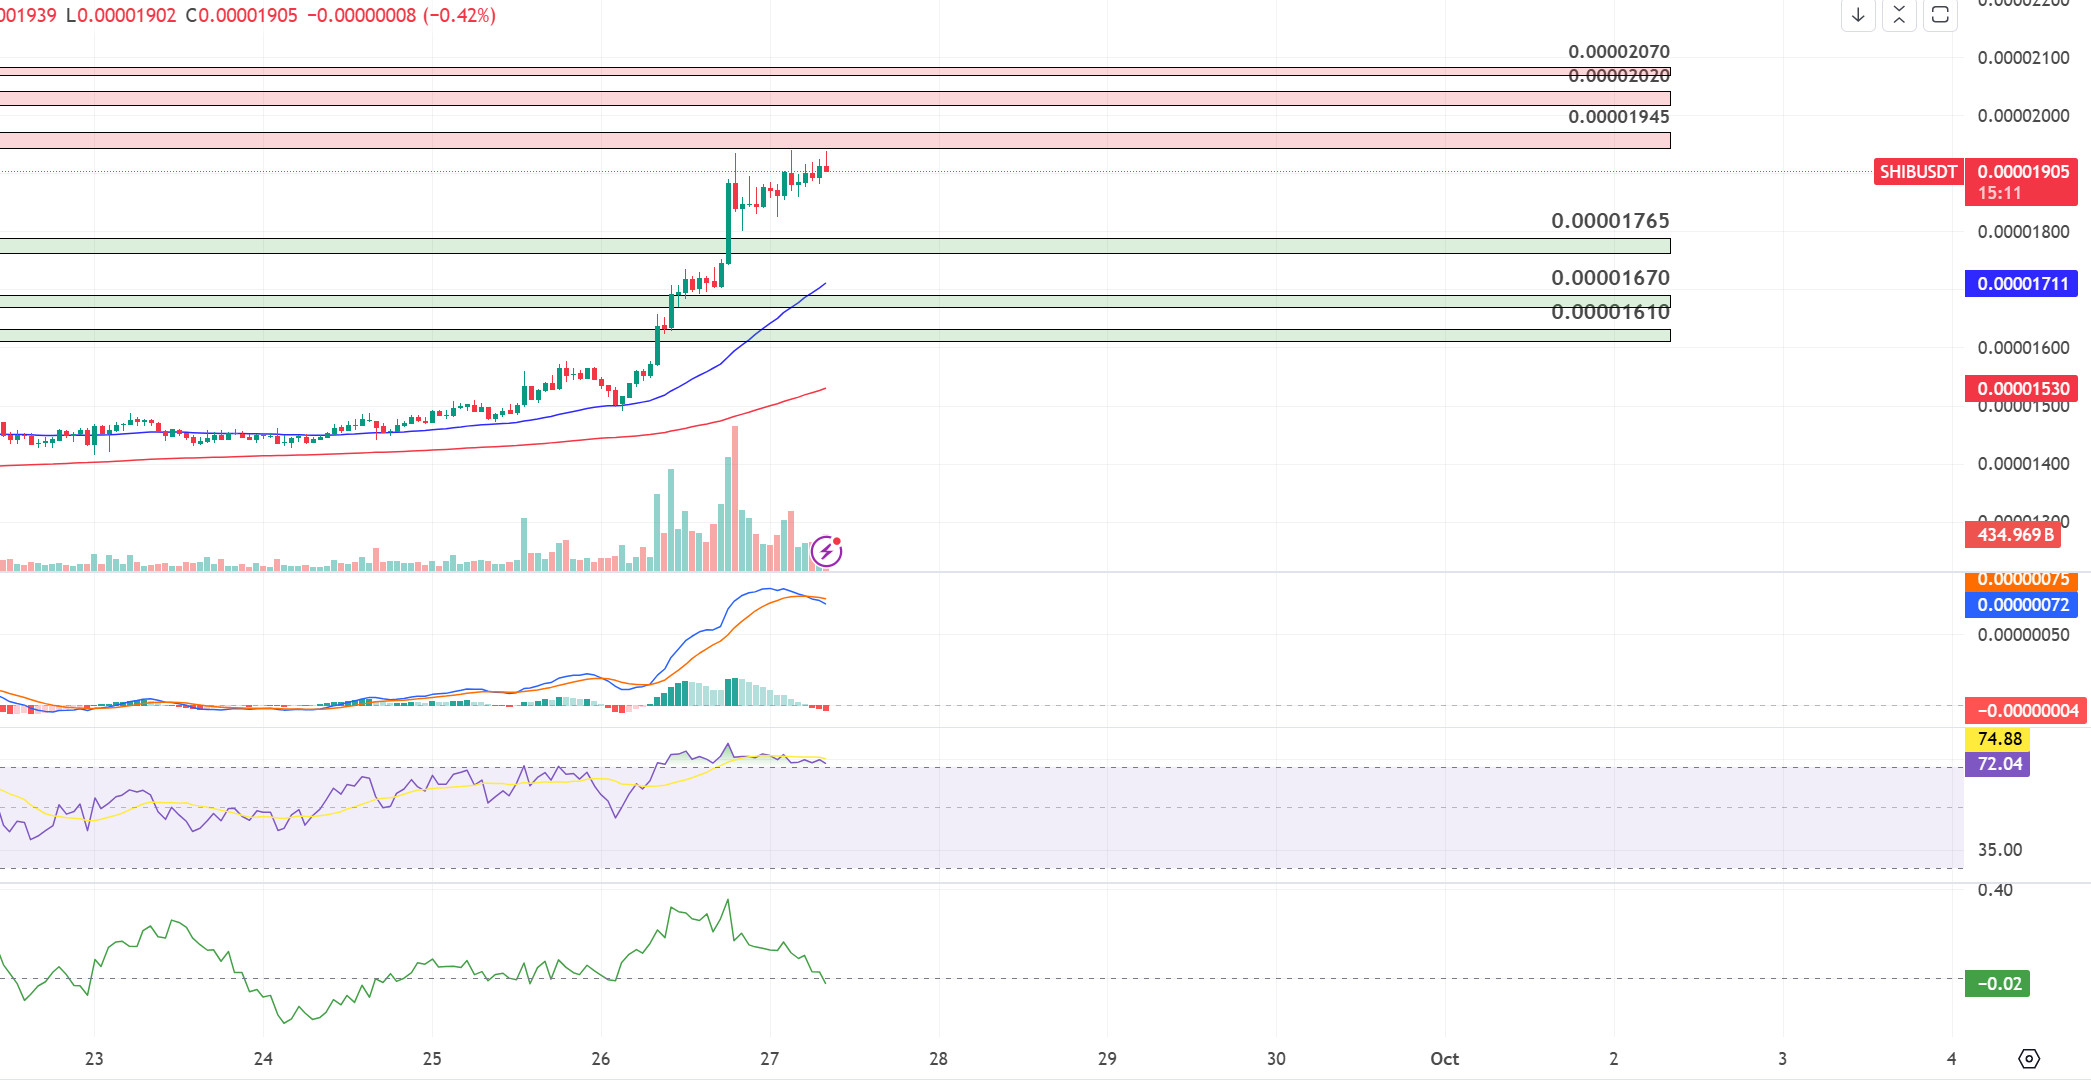
Shiba Inu (SHIB) has seen a 23% price increase in the last 24 hours, reaching $0.00001895. The main reason for this rise was the token burn rate, which increased by 33,800% to 2 billion tokens burned. The success of SHIB’s layer-2 solution, Shibarium, and gains in the overall meme coin sector also supported this rise.
When we examine the Shiba Inu (SHIB) chart, the price seems to have stabilized at 0.00001945 levels after this rise. When we examine the MACD and CMF oscillators, we see that the selling pressure is getting stronger. If the price cannot hold above 0.00001945 levels, the next support level may be 0.00001765. On the other hand, if the price holds above 0.00001945, we may see a rise up to 0.00002020.
(Blue line: EMA50, Red line: EMA200)
Supports 0.00001765 – 0.00001670 – 0.00001610
Resistances 0.00001945 – 0.00002020 – 0.00002070
LEGAL NOTICE
The investment information, comments and recommendations contained herein do not constitute investment advice. Investment advisory services are provided individually by authorized institutions taking into account the risk and return preferences of individuals. The comments and recommendations contained herein are of a general nature. These recommendations may not be suitable for your financial situation and risk and return preferences. Therefore, making an investment decision based solely on the information contained herein may not produce results in line with your expectations.


