
MARKET SUMMARY
Latest Situation in Crypto Assets
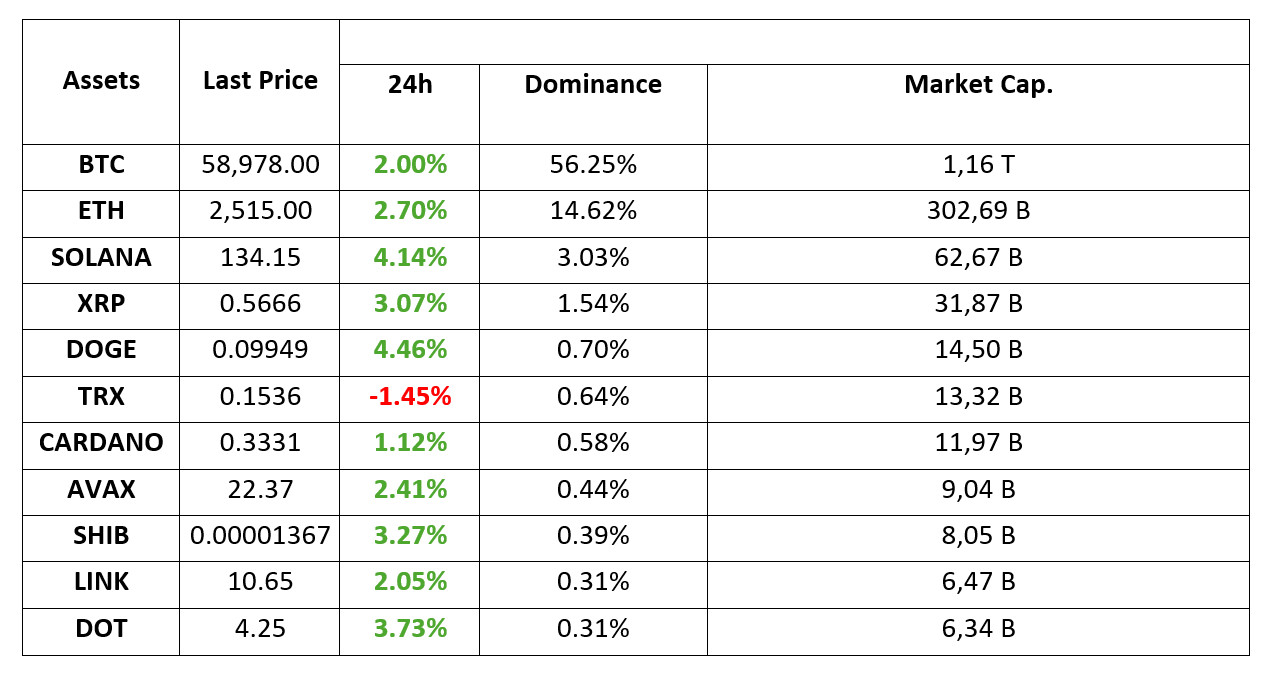
*Prepared on 3.09.2024 at 07:00 (UTC)
WHAT’S LEFT BEHIND
We are in an Important Week for Bitcoin and Dollar Index
Bitcoin (BTC), the leading cryptocurrency by market capitalization, fell more than 10 percent in the seven days to September 1, reversing the previous week’s price jump as the decline in the dollar index stalled. Economic data to be released by the US this week will determine whether the dollar will continue its two-month weakening trend and offer a boost for risk assets, including cryptocurrencies. Weaker data will strengthen the odds that the Federal Reserve will cut interest rates, pushing the dollar lower and therefore increasing demand for risk assets. According to CME’s FedWatch, interest rate markets already see a 70% chance of a 25 basis point cut in September and a 30% chance of a 50 basis point cut.
Crypto funds sentiment turned “broadly” negative: $305 million out
Crypto funds, which saw a serious inflow of 543 million dollars in the previous week, made a sharp U-turn last week. There was an outflow of 305 million dollars in crypto funds. While 319 million dollars of money came out of Bitcoin funds, there are consecutive inflows to “short Bitcoin” funds for the second week in a row.
Years of anticipation coming true for Cardano
The Chang update, which will decentralize Cardano, the layer 1 blockchain network, one of the old and heavyweights of the cryptocurrency world, has been officially launched. At the end of this process, governance will be transferred to the community holding ADA tokens.
HIGHLIGHTS OF THE DAY
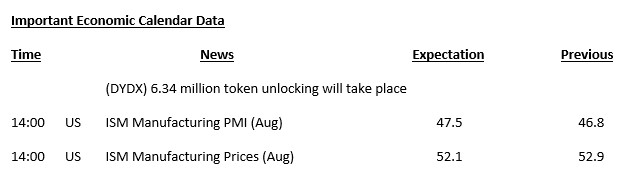
INFORMATION
The calendar is based on UTC (Coordinated Universal Time) time zone. The economic calendar content on the relevant page is obtained from reliable news and data providers. The news in the economic calendar content, the date and time of the announcement of the news, possible changes in the previous, expectations and announced figures are made by the data provider institutions. Darkex cannot be held responsible for possible changes that may arise from similar situations.
MARKET COMPASS
After a relatively weak start to the week, digital assets tried to maintain their momentum during the hours when US investors were active, even though traditional markets were closed. We can say that traditional investors continue to be cautious about assets that are considered relatively risky. While the green colors seen in Asian markets gave way to reds, European futures point to a slightly negative opening.
Critical employment data for the US economy is eagerly awaited later in the week. According to CME FedWatch, the probability of the FED cutting interest rates by 25 basis points at its meeting on September 18 is around 70%. Ahead of Friday’s employment data that could change these expectations, the markets will once again keep an eye on US data today. ISM manufacturing PMI is expected to have risen to 47.5 in August compared to the previous month. The data, which may have an impact on the DXY, may also be decisive in the short-term values of digital assets. While a PMI data above expectations may have a negative impact on crypto assets, a figure below it may support the preservation of the recent upward trend.
TECHNICAL ANALYSIS
BTC/USDT
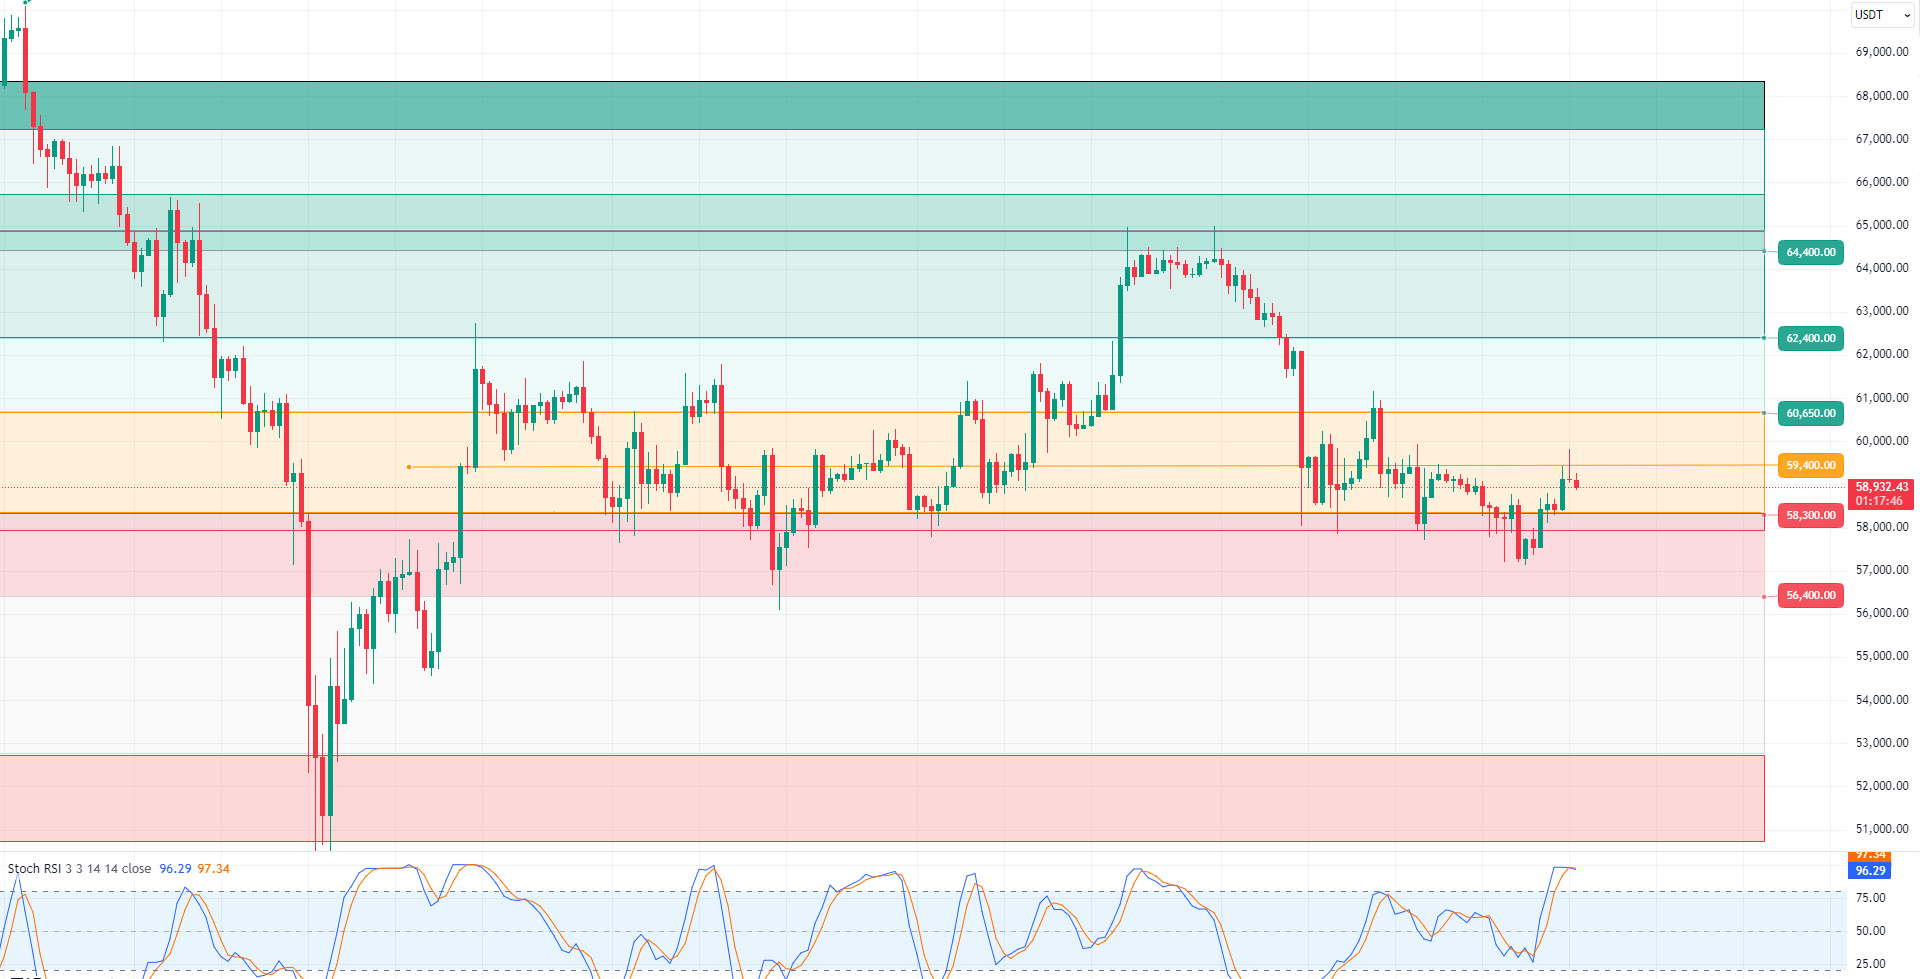
Summer Closing in Bitcoin! We left behind a period of economic, political and political turmoil in the summer months. Mt. Gox, German and US government sales, the assassination attempt against Trump and Biden’s withdrawal from the nomination caused tense and fluctuating market movements on behalf of Bitcoin. Finally, Bitcoin, which closed August with a decline, retreated to 57,100 levels. In September, an intense agenda such as US elections and FED interest rate decisions awaits us. Non-farm employment data and unemployment rates to be announced this week may provide us with a roadmap on the long-term direction of the FED’s interest rate policy. In the 4-hour analysis of BTC, it is seen that the breakout of the 58,300 level caused the price to retreat to 57,100, causing the price to start September with a decline. Bitcoin, which finds buyers at these levels, is currently trading at 59,000. The resistance level of 59,400 is critical, and 4-hour closes above this level can be considered positive for the continuation of the rises in the market. In case of a possible pullback with the RSI coming to the overbought zone, the 58,300 level can work as support; If this level is broken, 57,000 levels can be tested again.
Supports 58,300 – 57,200 -56,400
Resistances 59,400 – 60,650 – 61,700
ETH/USDT
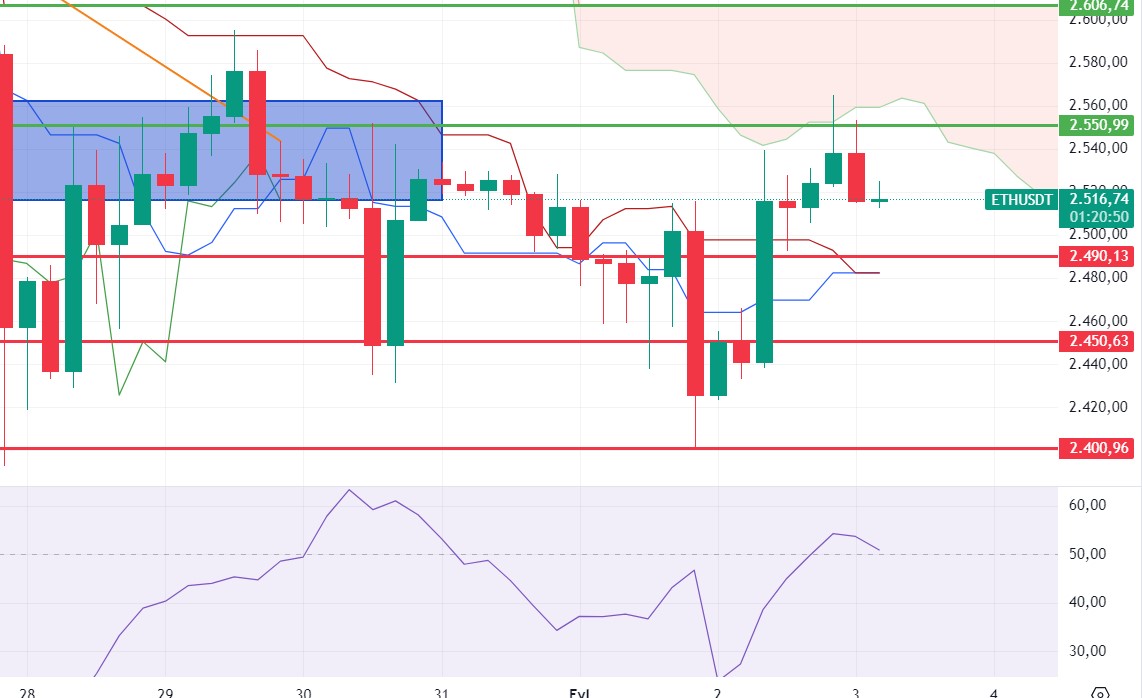
Ethereum tested the 2,550 resistance as Bitcoin surpassed the 59,000 level. It was rejected once again from these levels. Closes above 2,550 may break out of the bearish channel and start a positive trend. However, both the bearish outlook in ETH/BTC and the negative mismatch in MFI suggest that we may see a test to 2,490 levels once again during the day. Below this level, the 2,400 level stands out as the main support level.
Supports 2,490 – 2,450 – 2,366
Resistances 2,550 – 2,606 – 2,669
LINK/USDT
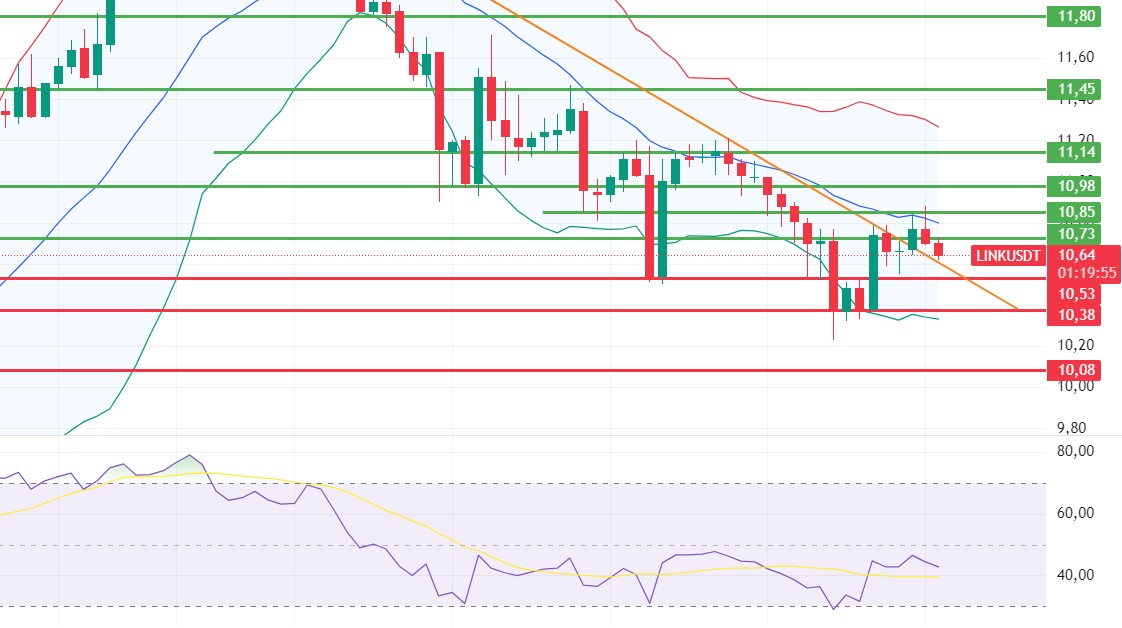
The downtrend in LINK, which rises up to the Bollinger middle band, has broken the downtrend and then the retest has come. The intermediate zone formed by 10.73 tenkan resistance and 10.85 bollinger middle band seems to be quite decisive. Exceeding this zone with volume may strengthen the bullish outlook. However, the weakness in volume and momentum weakens the possibility of this situation during the day. Below, 10.53 stands out as the main support level. The break of the level may cause declines up to 10.08.
Supports 10.53 – 10.38 – 10.08
Resistances 10.73 – 10.85 – 11.14
SOL/USDT
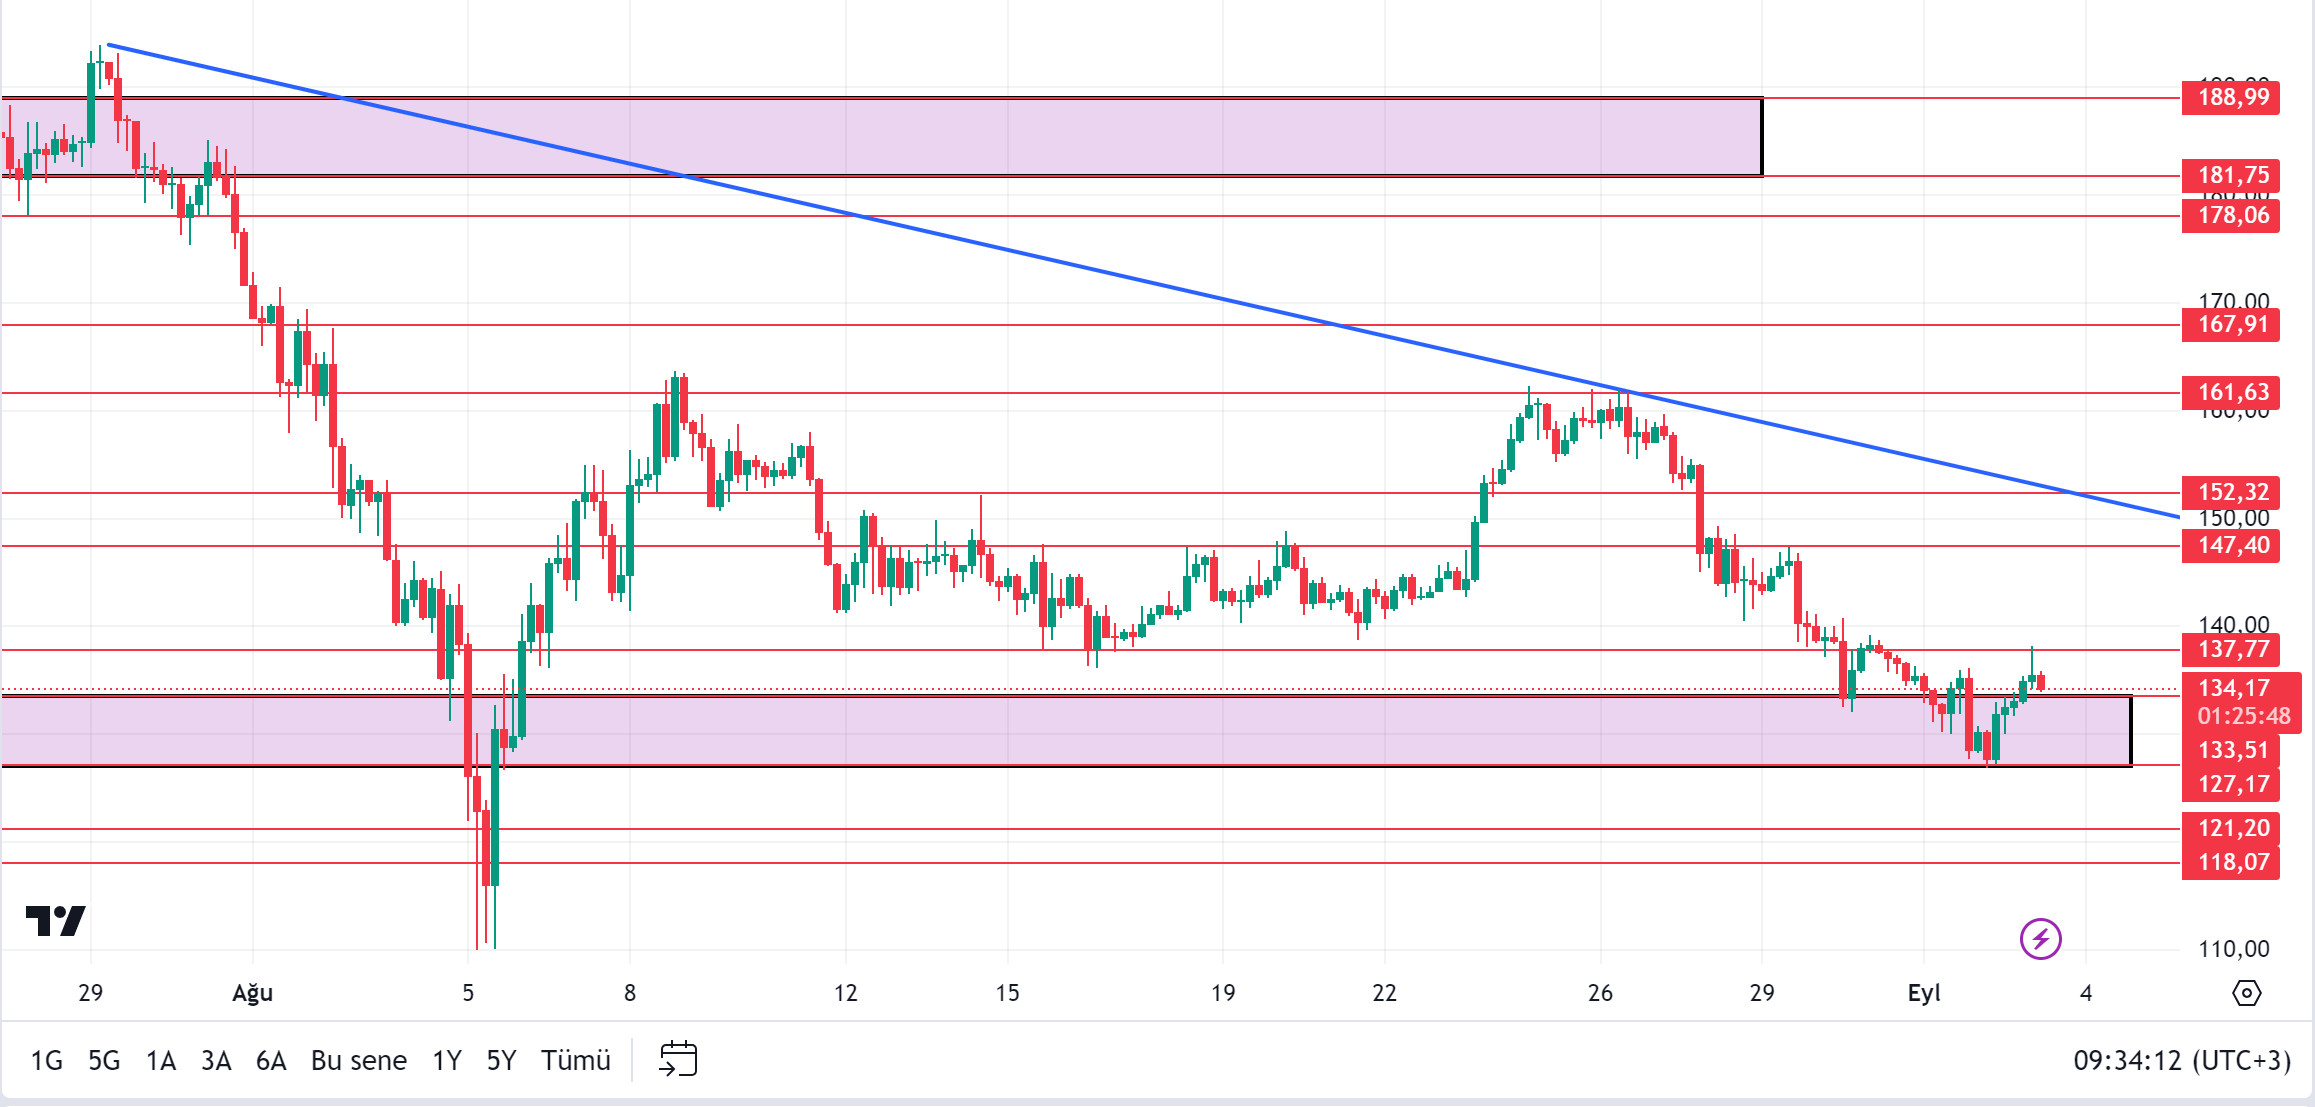
Solana started this week well. The NFT blockchain surpassed all other chains in user demand. According to data from Nftpulse, it ranked first in dominance with 32% with 106k users. SOL’s trading volume, which started this week higher, is showing a recovery trend despite market fears. Will this reverse the bear market? However, some Solana validators said they are worried about Marinade’s Marketplace. It promises 10% APY for every staked SOL, which some validators say is too costly and insurmountable. When we look at the chart, the rise may continue as long as SOL does not fall below the $ 133.51 level. SOL, which has been accumulating in a certain band since April, may test the resistance levels of 137.77 – 147.40 if the rises continue. In case of retracements in the market, 133.51 – 127.17 supports should be followed.
Supports 133.51 – 127.17- 121.20
Resistances 137.17 – 147.40 – 152.32
ADA/USDT
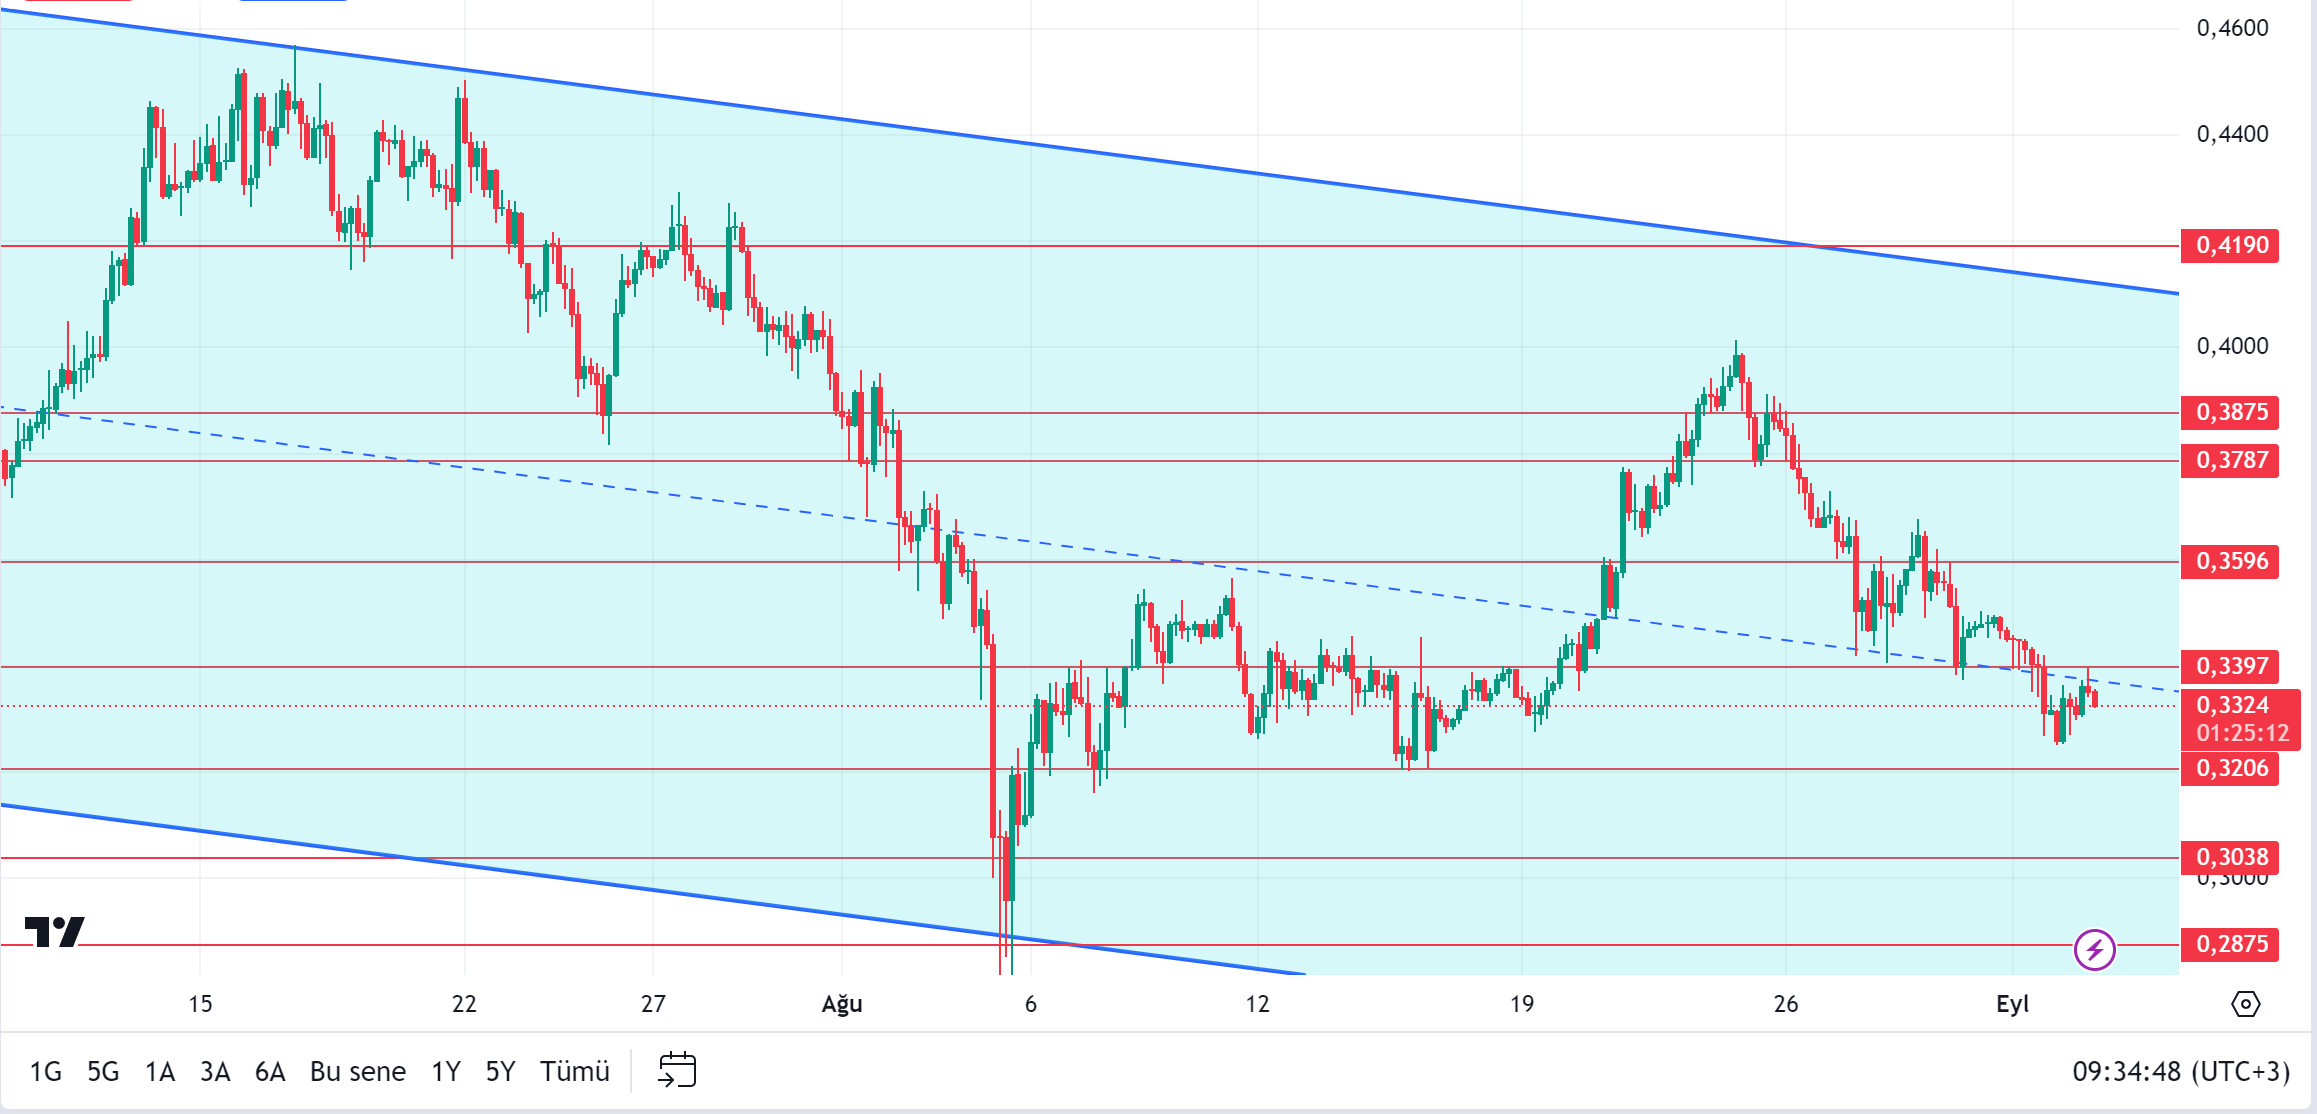
As you know, the Chang hard fork was successfully completed, ushering in the Voltaire era. However, ADA fell by 13% last week amid declining whale trades. Cardano’s Chang hard fork marks a major step forward in blockchain governance, with CEO Charles Hoskinson claiming it has surpassed Bitcoin in decentralization. Tuur Demeester, one of Bitcoin’s most ardent defenders, took aim at Cardano after comments by Cardano founder Charles Hoskinson targeted BTC. Demeester pointed out that Cardano’s dominance has declined dramatically over the past three years. When we look at the chart of ADA, it is priced at 0.3324 in the descending channel. ADA, which started profit sales in anticipation of the incoming update, did not decline much despite the market. For ADA to continue its rise, the 0.3397 level must be exceeded. In the scenario where investors expect BTC’s selling pressure to continue and the pessimism of the actors in the market to continue, if it continues to be priced by declining in the descending channel, the 0.3206 – 0.3038 levels can be followed as support.
Supports 0.3206 – 0.3038 – 0.2875
Resistances 0.3397 – 0.3596 – 0.3787
AVAX/USDT
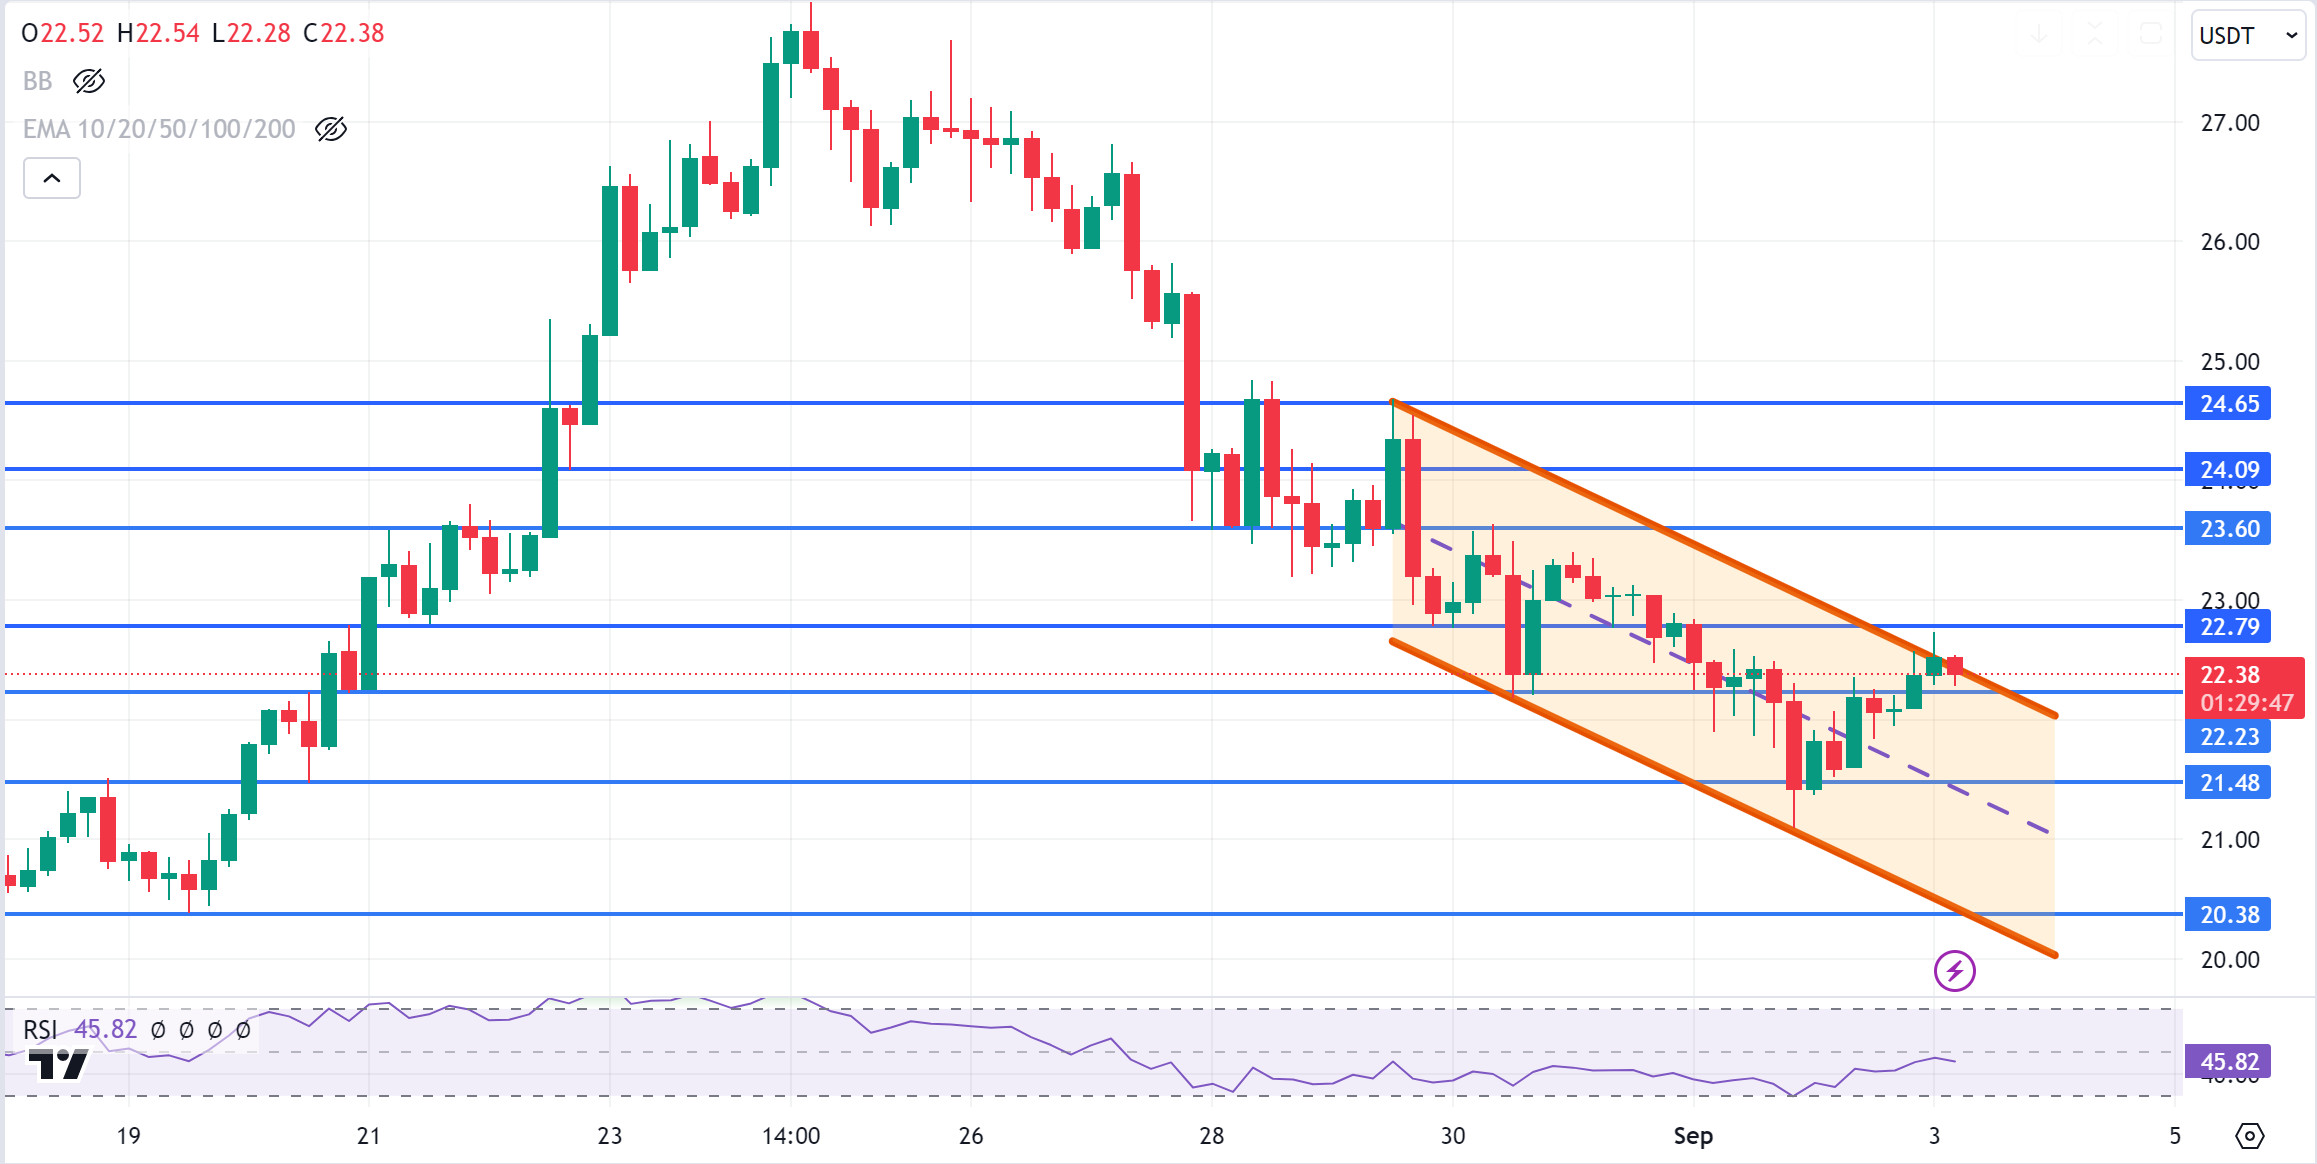
AVAX, which opened yesterday at 21.42, closed the day at 22.37 with an increase of approximately 4.5% during the day.
AVAX, currently priced at 22.38, continues to move in a falling channel. On the 4-hour chart, it is trying to break the upper band of the channel and may continue its rise with the candle closing above 22.79 resistance. In such a case, it may test the 23.60 and 24.09 resistances. In case of sales from the upper band of the channel, it may test 21.48 support. As long as it stays above 20.38 support during the day, the upward appetite may continue. With the break of 20.38 support, sales may deepen.
Supports 22.23 – 21.48 – 20.38
Resistances 22.79 – 23.60 – 24.09
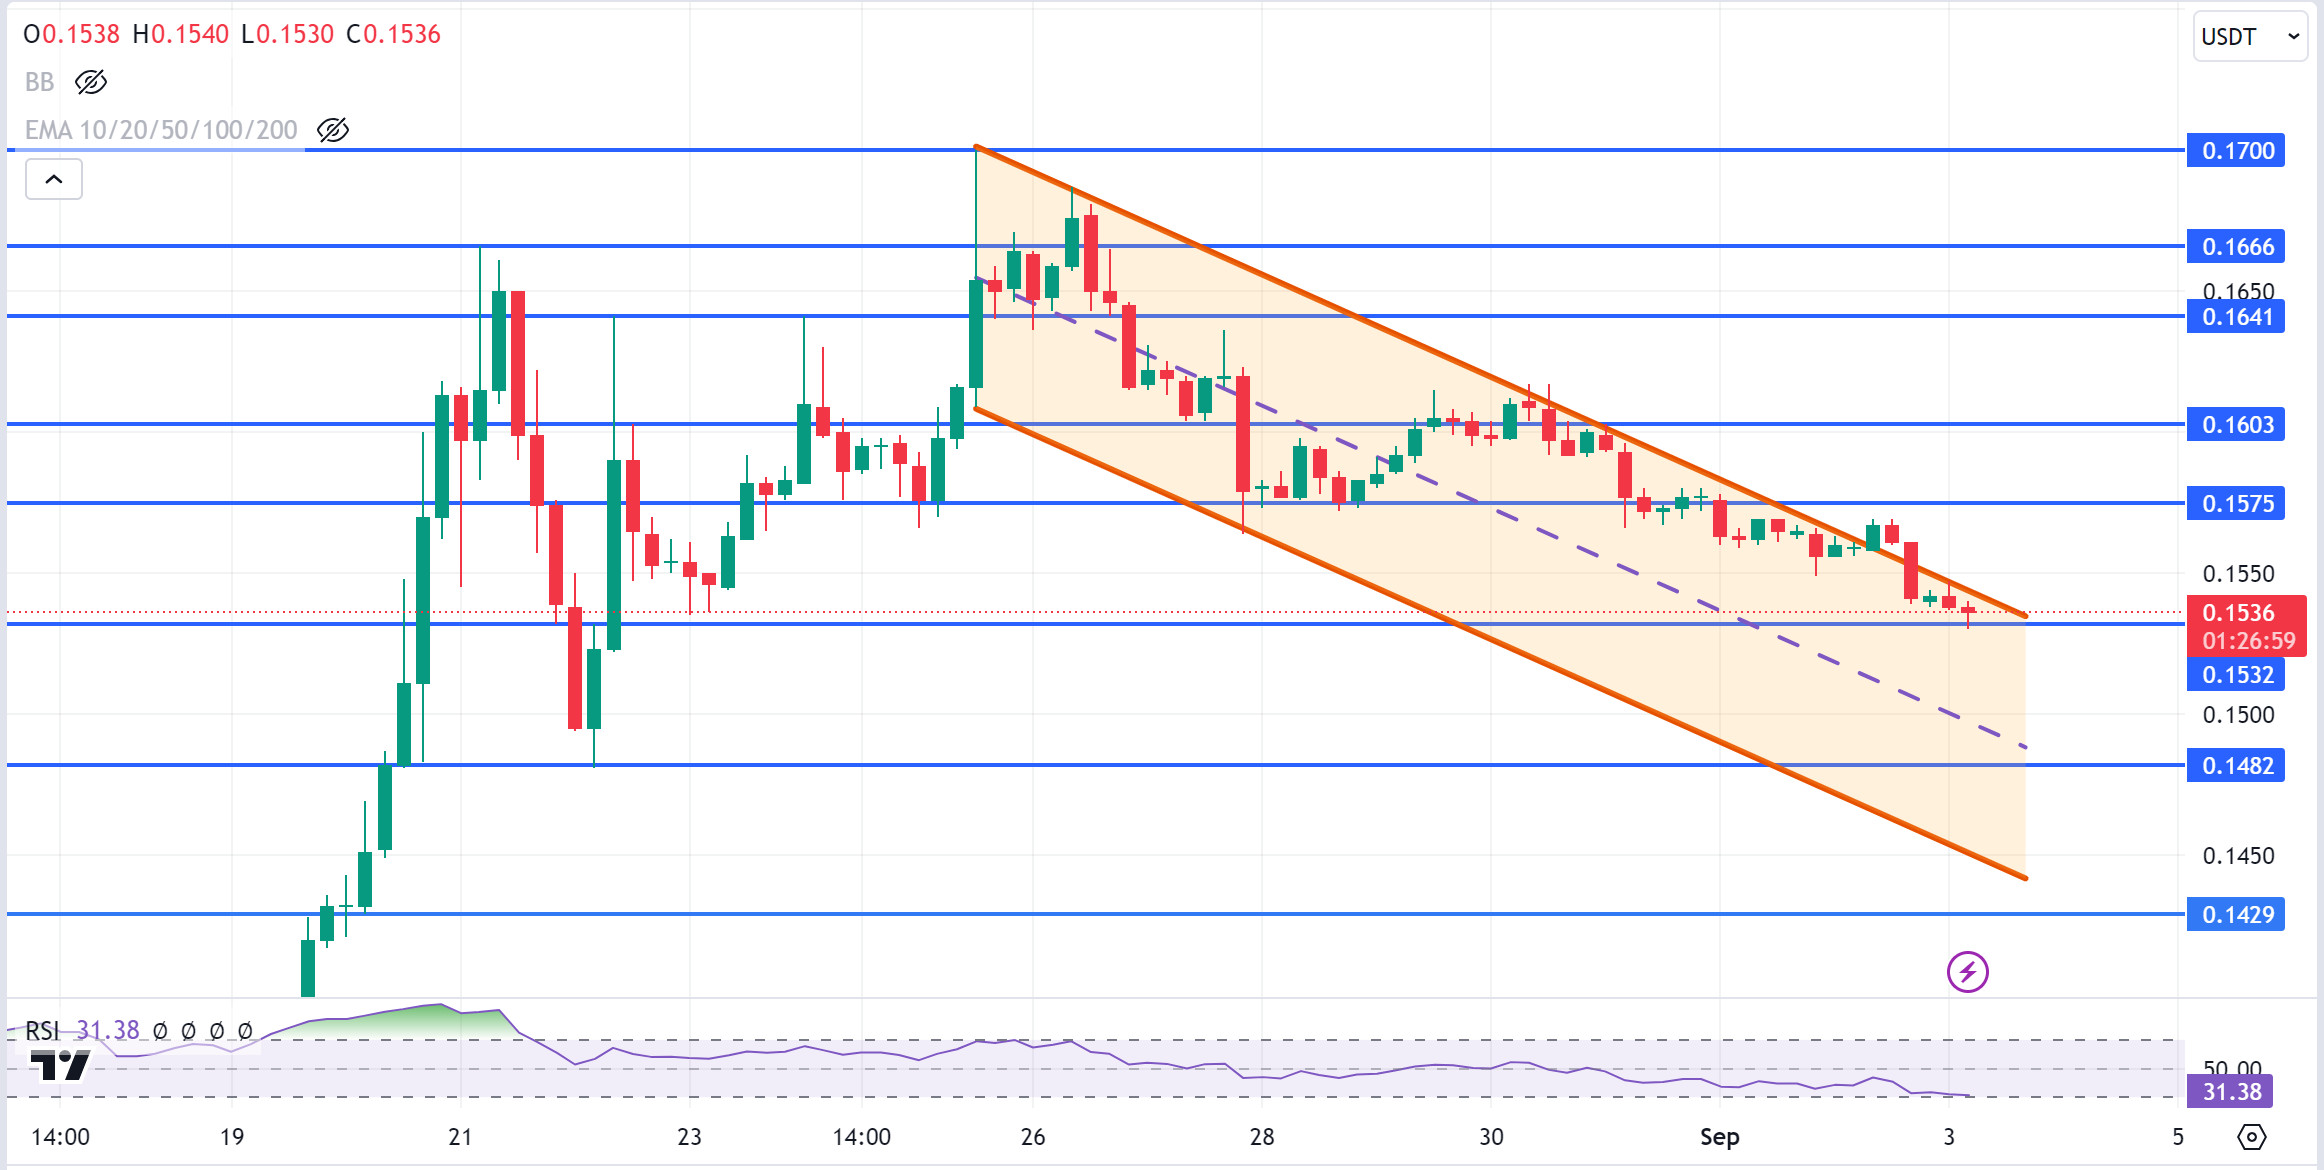
TRX/USDT
TRX, which started yesterday at 0.1556, fell slightly and closed the day at 0.1542. TRX, which is currently at 0.1536, is moving towards the middle band with the sales reaction from the upper band of the falling channel on the 4-hour chart. Breaking the 0.1532 support, it may want to go to the lower band of the channel. In this case, it may test 0.1482 support. If there is no candle closure below O.1532 support, it may rise and break the upper band of the channel upwards. In this case, it may test 0.1575 and 0.1603 resistances. As long as TRX stays above 0.1482 support, it can be expected to continue its upward trend. If it breaks this support downwards, sales may deepen.
Supports 0.1532 – 0.1482 – 0.1429
Resistances 0.1575 – 0.1603 – 0.1641
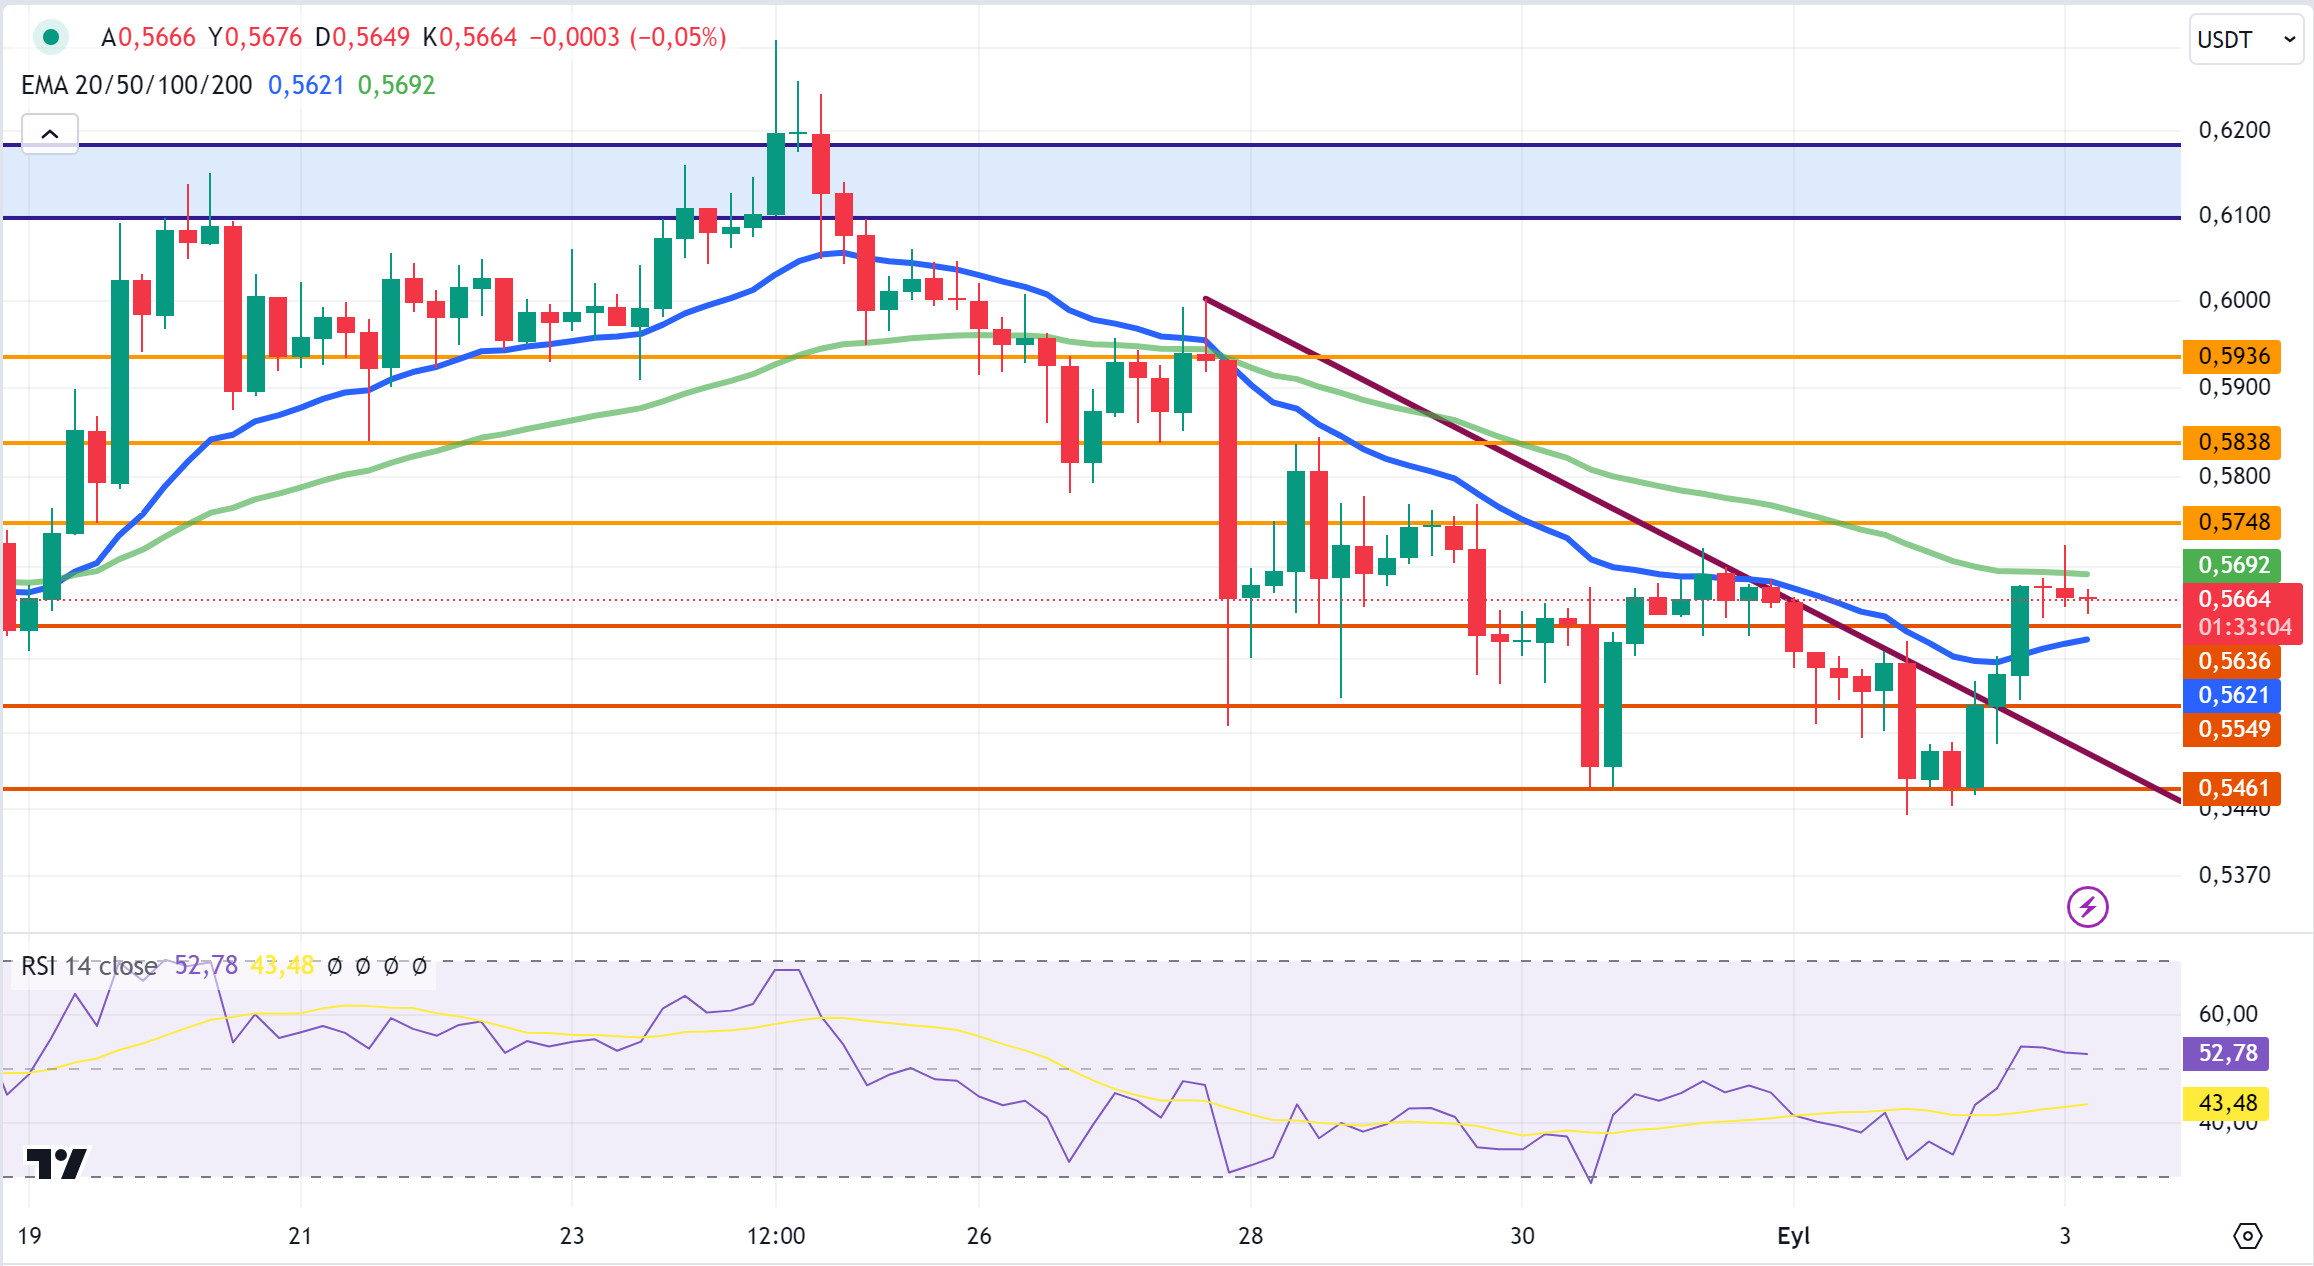
XRP/USDT
After last week’s decline, XRP started the new week on a bullish note and closed the day yesterday at 0.5674, up 3.8%. XRP is currently trading at 0.5664.
As seen in the 4-hour analysis, XRP continued to rise after breaking the downtrend yesterday. After testing and failing to break the 0.5461 support level, it broke the downtrend by rising with the reaction.
In the 4-hour analysis, yesterday’s closing candle and today’s opening candle started with a sideways movement and the sideways movement continues at the moment. If the sideways movement gives way to bullishness and the XRP rise continues as yesterday, it may test the resistance levels of 0.5748-0.5838-0.5936. On the contrary, if the horizontal movement gives way to a downtrend, it may test the support levels of 0.5636-0.5549-0.5461.
While XRP is trading within the 0.55-0.58 horizontal band, it may offer a long trading opportunity if it rises with the reactions from here in the declines to 0.55. In its upward movement, it may offer a short trading opportunity if it declines with the reaction that may come at the level of 0.58.
Supports 0.5636 – 0.5549 – 0.5461
Resistances 0.5748 – 0.5838 – 0.5936
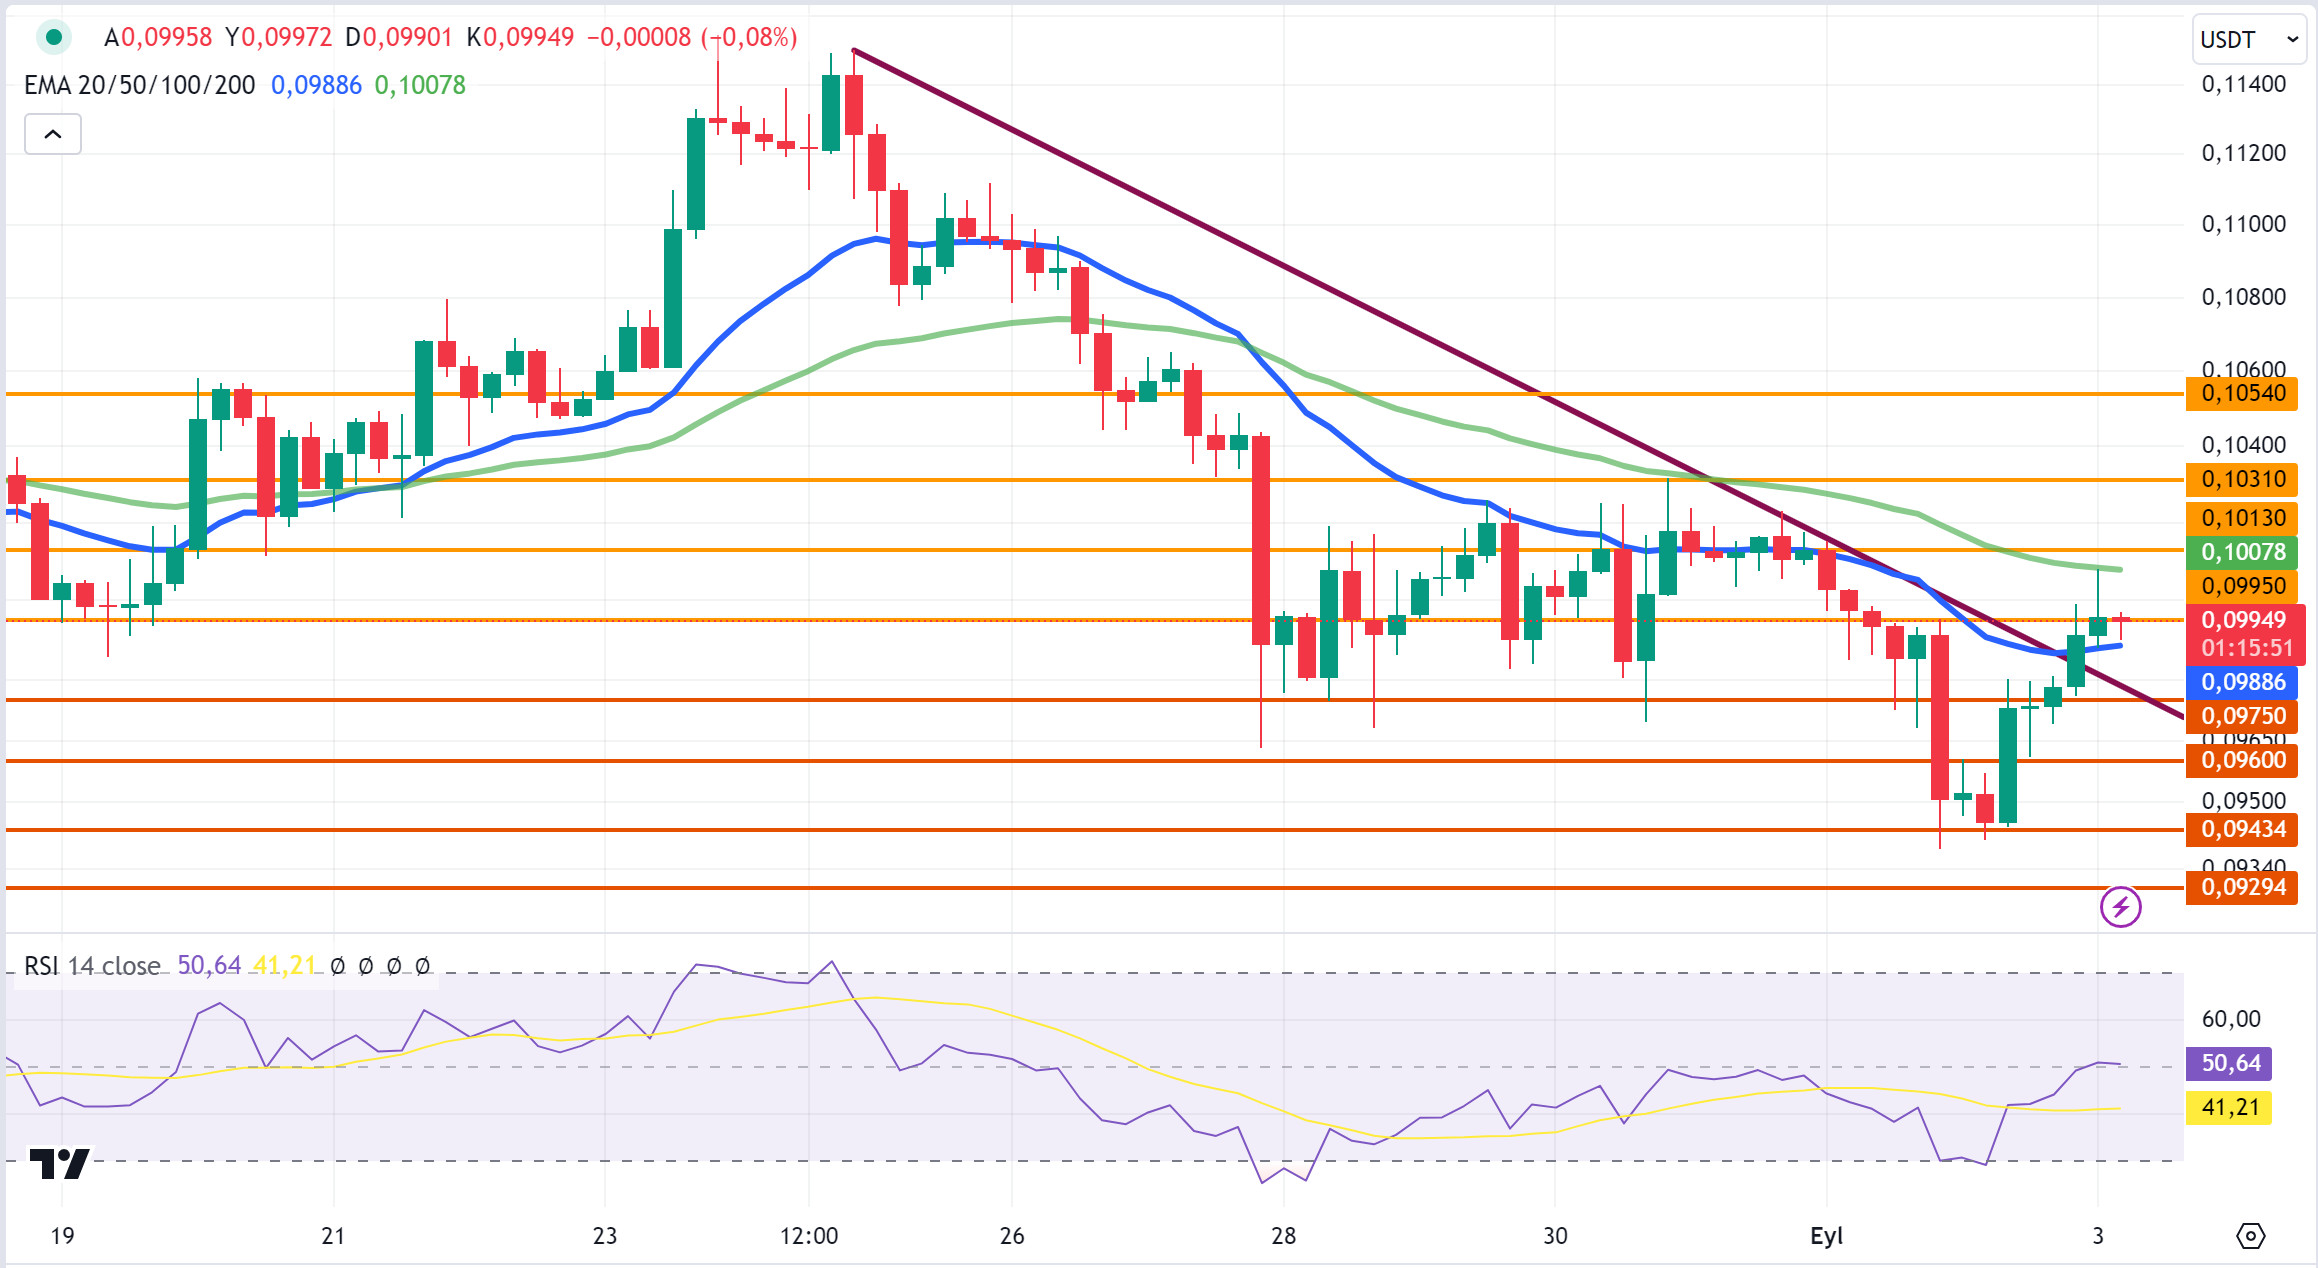
DOGE/USDT
While the crypto market in general moved downward with the downtrend last week, it started to rise with the recovery after the reaction yesterday. DOGE, which moves in parallel with the crypto market, broke the downtrend with the rise after its recovery yesterday and continued to rise. Yesterday, DOGE closed the day at 0.0990 with an increase of 4.25%. DOGE is currently trading at 0.0994.
In today’s 4-hour analysis, DOGE, which continued to rise in the first candle on the first candle on the 0.0995 resistance level, could not break the EMA50 (Green Color) 0.1007 level and fell with the reaction and fell below the 0.0995 support level. While preparing the report, DOGE continues to test the 0.0995 resistance level in the ongoing candle in the 4-hour analysis. If the resistance level in question is broken and the rise continues, DOGE may test the resistance levels of 0.1013-0.1031. On the contrary, in case of a decline, DOGE may test the support levels of 0.0975-0.0960-0.0943.
Supports 0.0975 – 0.0960 – 0.0943
Resistances 0.0995 – 0.1013 – 0.1031
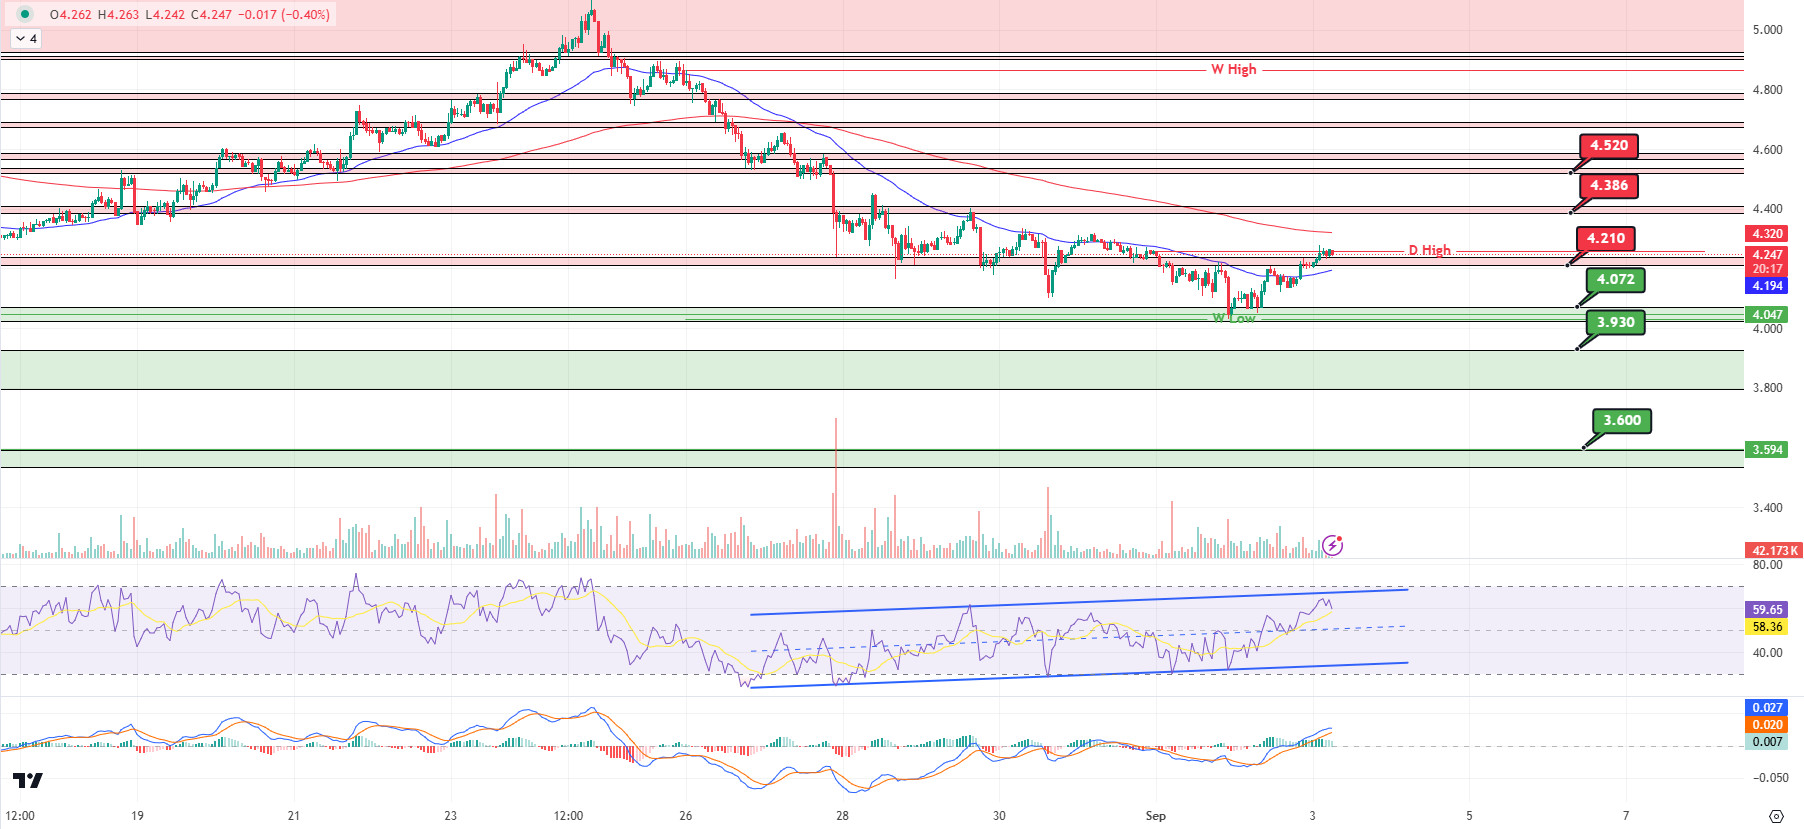
DOT/USDT
Looking at the Polkadot (DOT) chart, the price reacted from 4,072 to break above the first resistance level of 4,240 and the previous day’s high of 4,260. On the MACD, we can say that the buyer pressure has decreased compared to the previous hour. In a positive scenario, if the price holds above 4,260, the next resistance level could be 4,386. On the other hand, if the price loses the 4,210 level, we can expect the EMA 50 level to work as a support. If the price breaks the EMA50 down, it may retreat to the first support level of 4,072.
(Blue line: EMA50, Red line: EMA200)
Supports 4,072 – 3,930 – 3,600
Resistances 4.210 – 4.386 – 4.520
SHIB/USDT
Shiba Inu’s game Agent Shiboshi has been released on the App Store for iOS users. The game, which previously received positive reviews on Android, is now available for iPhone users. However, some members of the SHIB community criticize the game’s focus on other projects instead of token burning or deflation mechanisms.
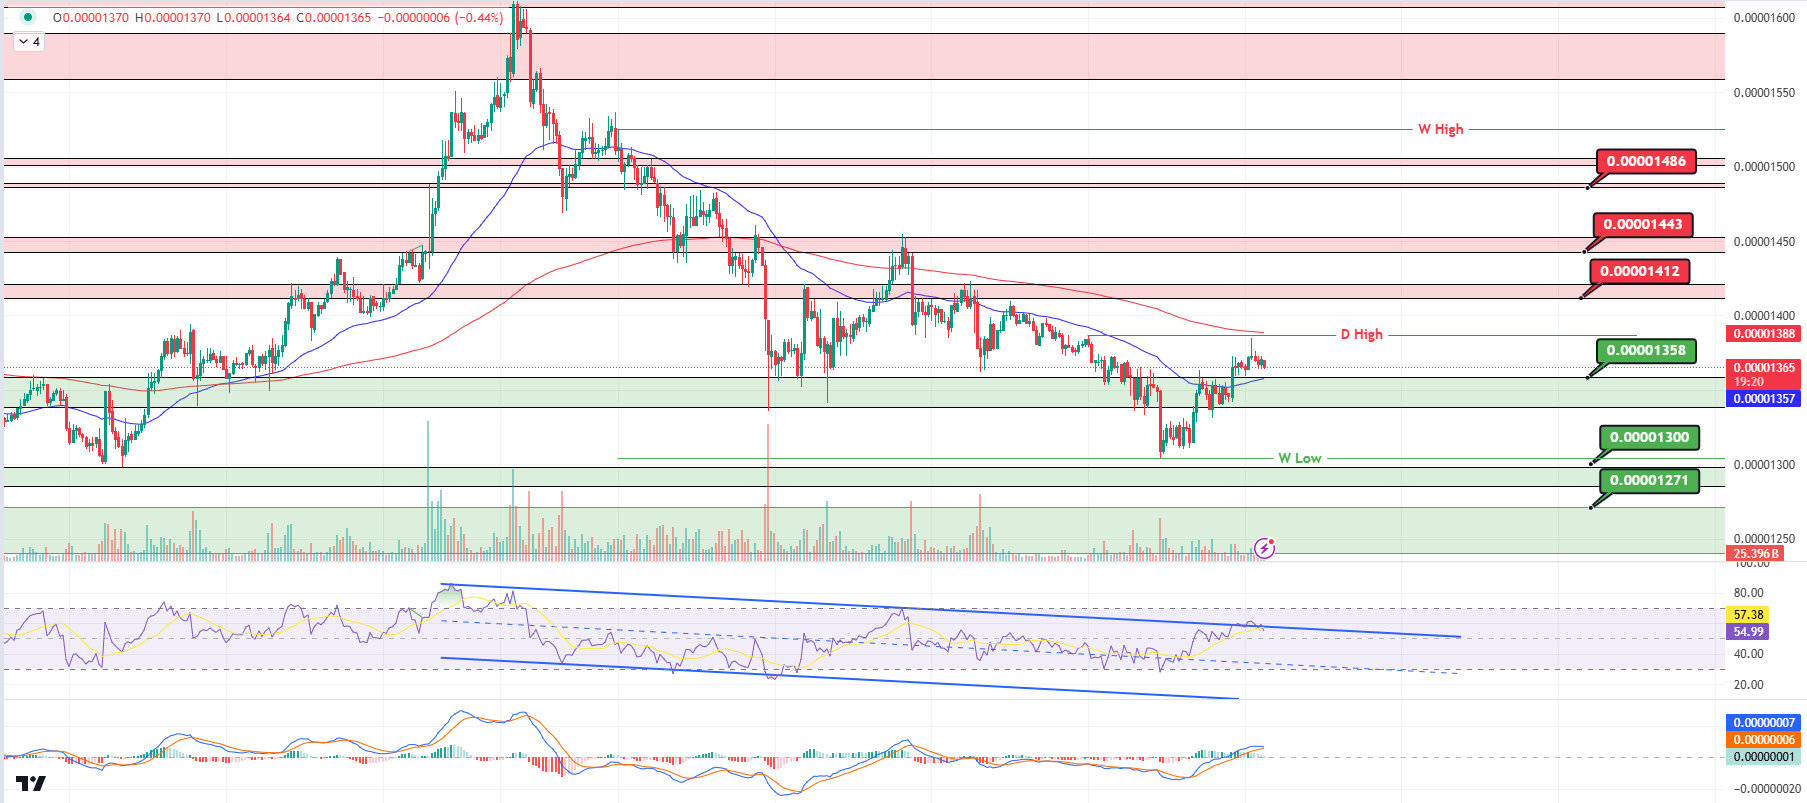
As for the SHIB chart, the price broke 0.00001358 upwards with the reaction from the 0.00001300 band. However, it sold off from the previous day’s high of 0.00001393. SHIB, which is making its correction for the moment, can consider the resistance level of 0.00001358 as support. When we examine the MACD, we can say that the buyer pressure decreased compared to the previous hour. If the price cannot hold at 0.00001358, it may fall to the next support level of 0.00001300. In the positive scenario, if the EMA50 breaks the EMA200 upwards, the price may rise to 0.00001412.
(Blue line: EMA50, Red line: EMA200)
Supports 0.00001358 – 0.00001300 – 0.00001271
Resistances 0.00001412 – 0.00001443 – 0.00001486
LEGAL NOTICE
The investment information, comments and recommendations contained herein do not constitute investment advice. Investment advisory services are provided individually by authorized institutions taking into account the risk and return preferences of individuals. The comments and recommendations contained herein are of a general nature. These recommendations may not be suitable for your financial situation and risk and return preferences. Therefore, making an investment decision based solely on the information contained herein may not produce results in accordance with your expectations.
