MARKET SUMMARY
Latest Situation in Crypto Assets
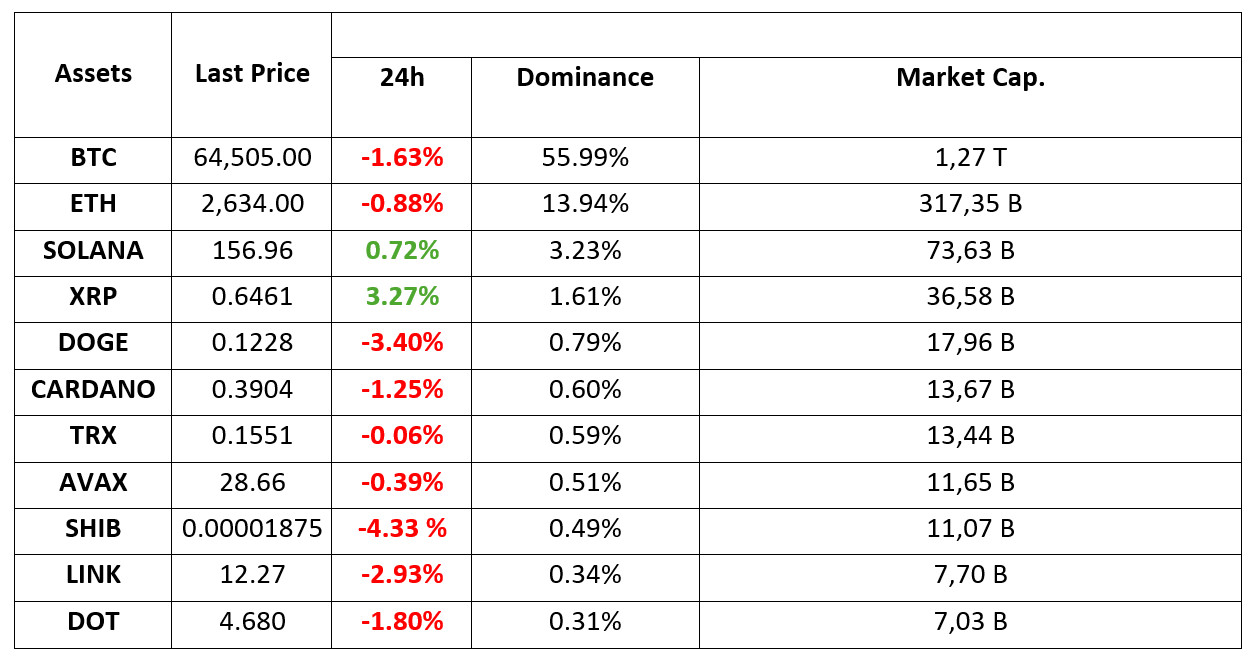
*Prepared on 30.09.2024 at 07:00 (UTC)
WHAT’S LEFT BEHIND
Bitcoin and Altcoins are Falling!
Developments in the Japanese market put selling pressure on the asset. Bitcoin (BTC) prices briefly surpassed the $66,000 level but then fell to $64,504. The drop coincided with the Nikkei 225 falling by around 4.5%. Other geopolitical tensions, such as Israel’s killing of Hezbollah leader Hassan Nasrallah, also added to the uncertainty.
CZ’s Post-Prison Remarks
Binance founder CZ announced that after his release from prison, he will focus on his education startup Giggle Academy instead of Binance. He also stated that he plans to dedicate his time and funds to charity.
HIGHLIGHTS OF THE DAY

INFORMATION
*The calendar is based on UTC (Coordinated Universal Time) time zone. The economic calendar content on the relevant page is obtained from reliable news and data providers. The news in the economic calendar content, the date and time of the announcement of the news, possible changes in the previous, expectations and announced figures are made by the data provider institutions. Darkex cannot be held responsible for possible changes that may arise from similar situations.
MARKET COMPASS
Global markets started the new week on a very active note. After China announced new measures that could alleviate the problems in the real estate market, the country’s stock markets recorded historic rises. In Japan, on the other hand, indices fell sharply. This decline came after Ishiba, known for his hawkish stance, won the Liberal Democratic Party’s leadership election and the country’s currency rallied. On the other hand, rising tensions in the Middle East kept gold prices near record highs, while Bitcoin corrected during the Asian session after its recent rises. European stock markets are expected to start the day on the negative side.
On the last trading day of the month, the mobility in the markets attracts attention. A busy calendar awaits the markets this week, which are preparing to start the last quarter of the year tomorrow, and we see that price changes have hardened beforehand. FED Chairman Powell’s statements will be monitored today ahead of the critical US employment data to be released on Friday. Although we do not expect the Chairman to make a new guiding statement, the statements he will use should be closely monitored. Markets see a 50 basis point rate cut by the FED on November 7th as more likely than a 25 basis point cut. However, this situation has been changing frequently in recent days and the Chairman’s statements today will be scrutinized in this respect.
The rise in digital assets, which strengthened with the increase in risk appetite, was replaced by a flat course in the weekend transactions. In the Asian session, we saw a correction in Bitcoin this morning. We think that the overall ecosystem will continue to be supportive of risky assets, but as we mentioned earlier, interim corrections will continue to occur within the natural functioning of the market. In this regard, we think that the impact of news and data flow on pricing behavior will continue, but we also think that rebounds after declines will continue to attract attention.
TECHNICAL ANALYSIS
BTC/USDT
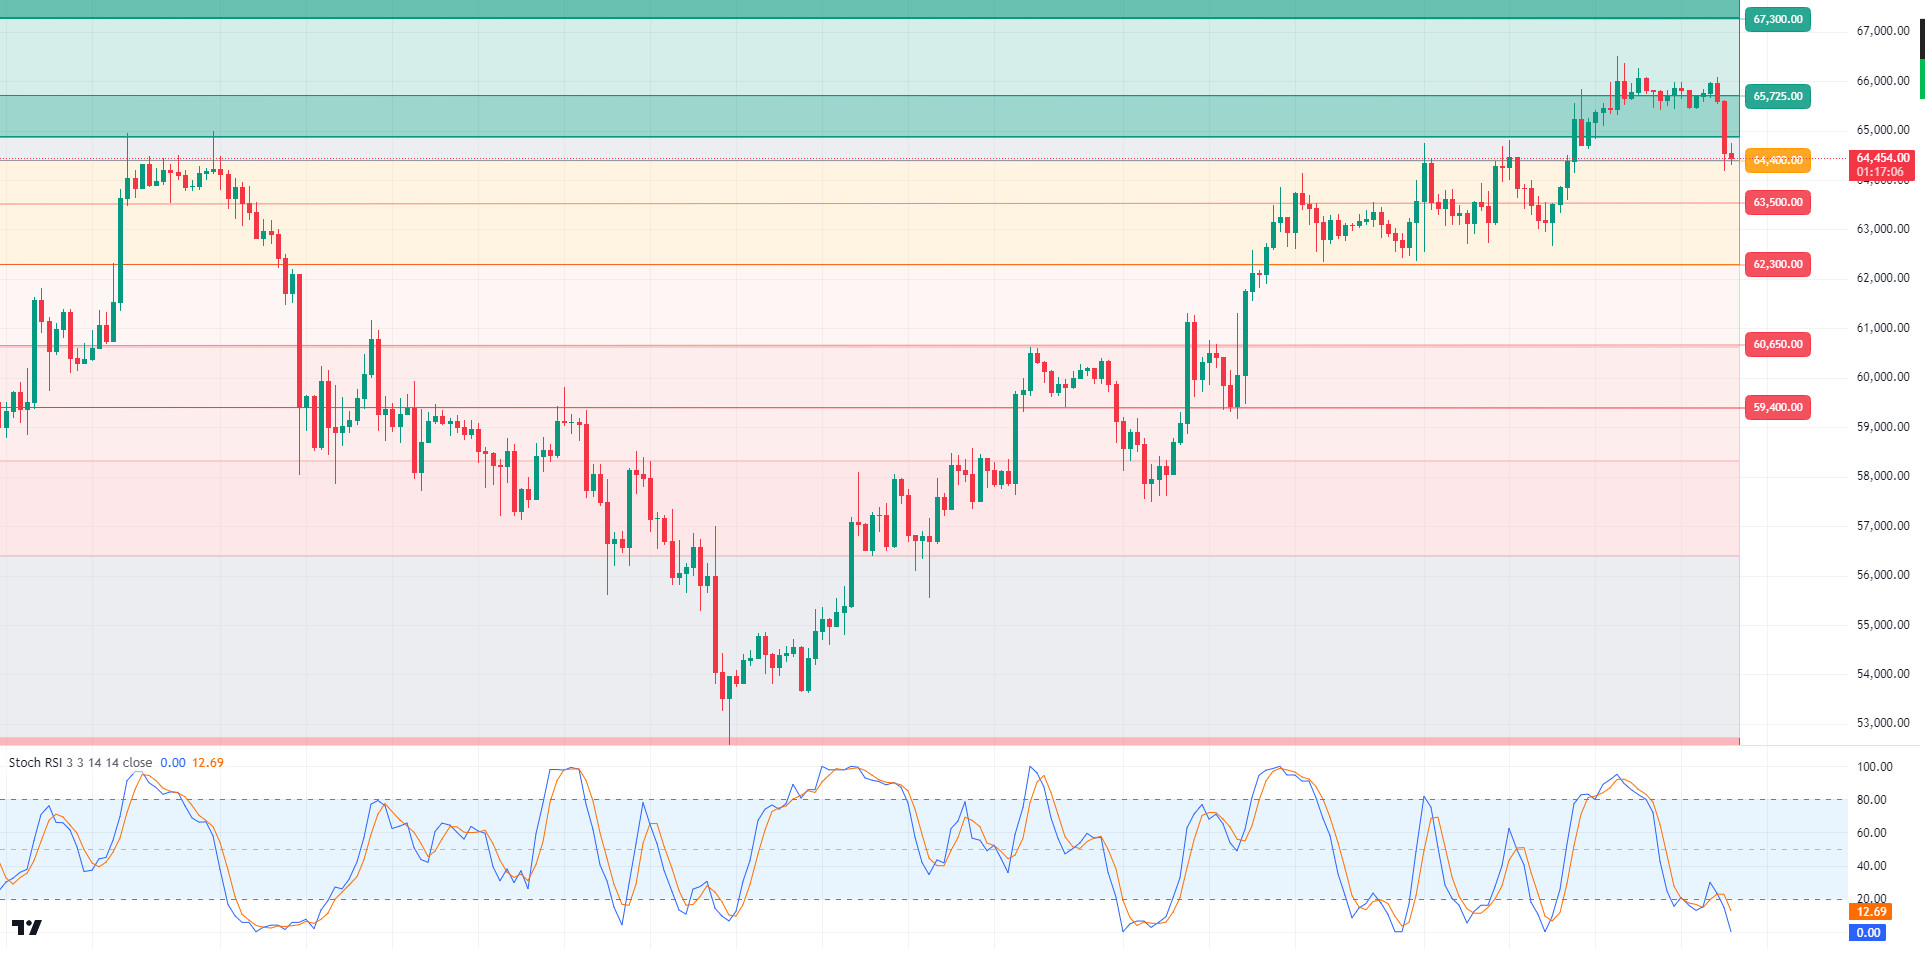
The expected correction movement from Bitcoin came as of this morning. Bitcoin, which pushed the 66,000 level yesterday, retreated this morning and fell towards the 64,300 level. Although the reason for this decline is actually a correction movement that the market needs, the retreat in Asian markets and geopolitical tensions are said to be effective. As a result, it should not be forgotten that even in bullish periods when continuous rises in the market are not possible, sharp pullbacks are experienced. The statements to be made by FED chairman Powell today may give us a message about the expected interest rate cut in November. On the one hand, the ongoing election race on the US side may cause important developments in the crypto market and may affect price movements instantly. In the BTC 4-hour technical analysis, we see that the price, which has been moving at the 65,725 resistance level for a long time, lost momentum by failing to cross it and tested the support level of 64,400. The minor support level that we will encounter if the decline deepens with selling pressure is 63,500 points. When we look at the general trend, we can think that the uptrend continues and there is no obstacle for the moment to prevent upward movements again with the positive atmosphere on the market. In addition, when we look at the BTC price historically, it appears as a period when the rises increased in October. With the RSI coming to the overbought zone, the resistance level that we will encounter in case of recovery and momentum is 65,725 again.
Supports 64,400-62,300 – 60,650
Resistances 65,725 – 67,300 – 68,350
ETH/USDT
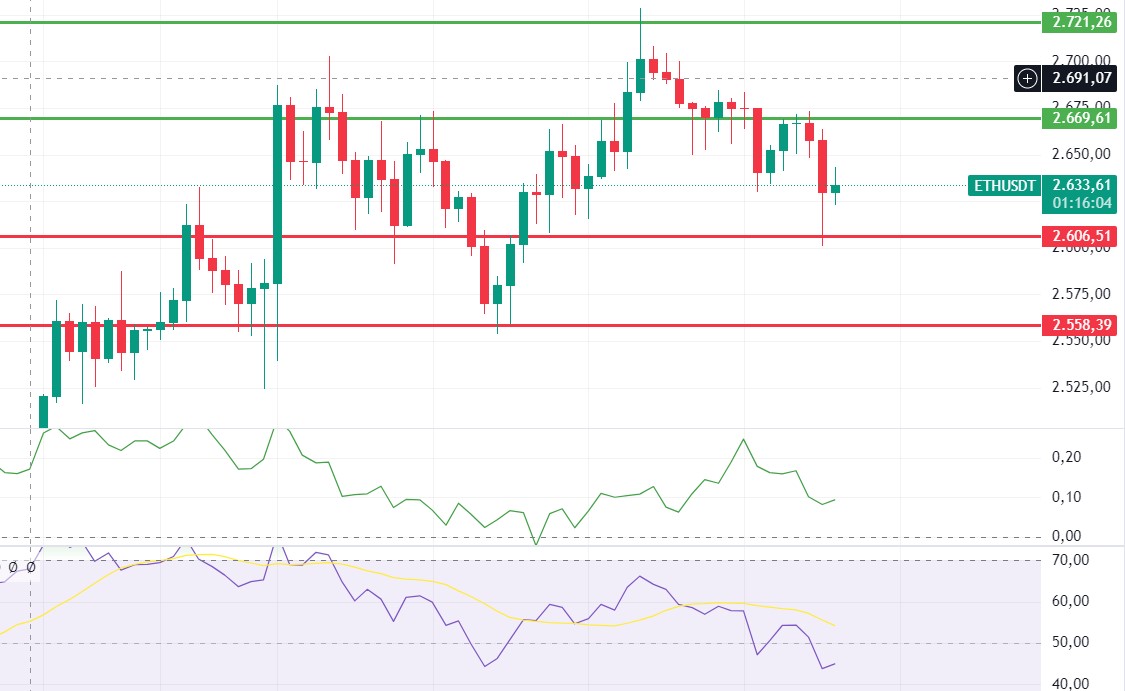
After losing the 2,669 level, Ethereum, which fell after losing the 2,606 level, reacted from the 2,606 support and tried to stay at kijun and tenkan levels. There is a positive mismatch on CMF, but there are negative structures on RSI. Stochastic seems to have not found a bottom yet. A retracement to 2,606 levels can be expected during the day. The break of the level may bring declines down to 2,558 levels. Closures above 2,669 may break the negative structures and start an upward movement towards 2,721 levels.
Supports 2,606 – 2,558 – 2,490
Resistances 2,669 – 2,721 – 2,815
LINK/USDT
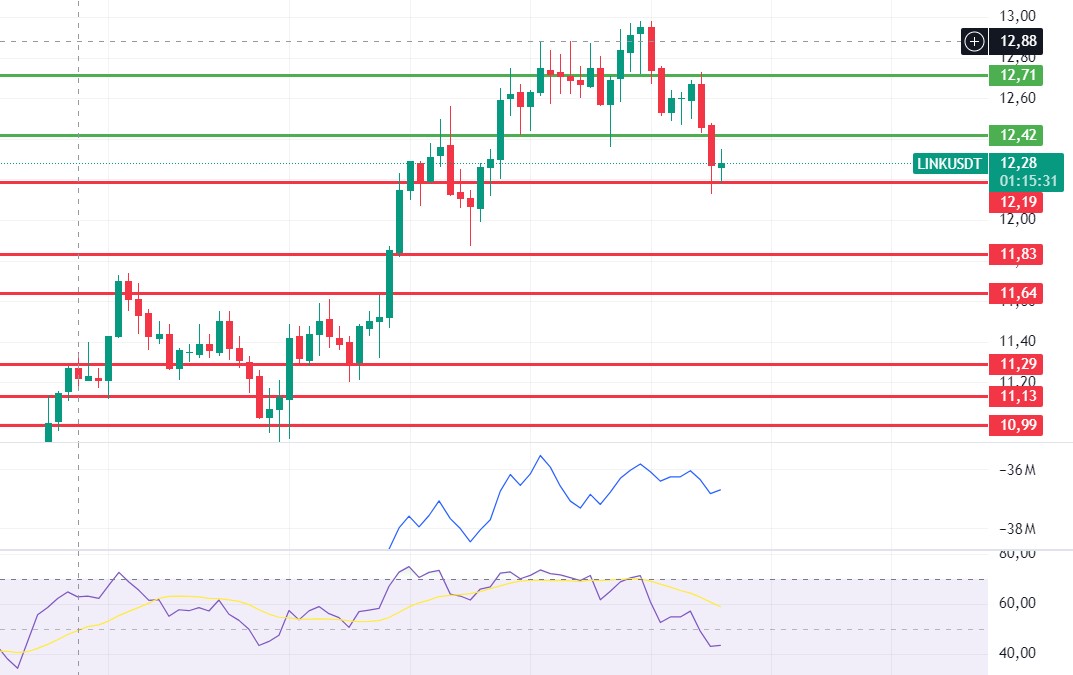
For LINK trying to stay above the 12.19 level, it seems important to act according to the breakouts. Due to the negative mismatch on OBV and negative RSI structure, a breakout of 12.19 can be expected during the day. Declines up to 11.83 levels may come. If 12.42 resistance can be exceeded, we can see rises towards 12.72 levels again.
Supports 12.19 – 11.83 – 11.64
Resistances 12.42 – 12.71 – 13.46
SOL/USDT
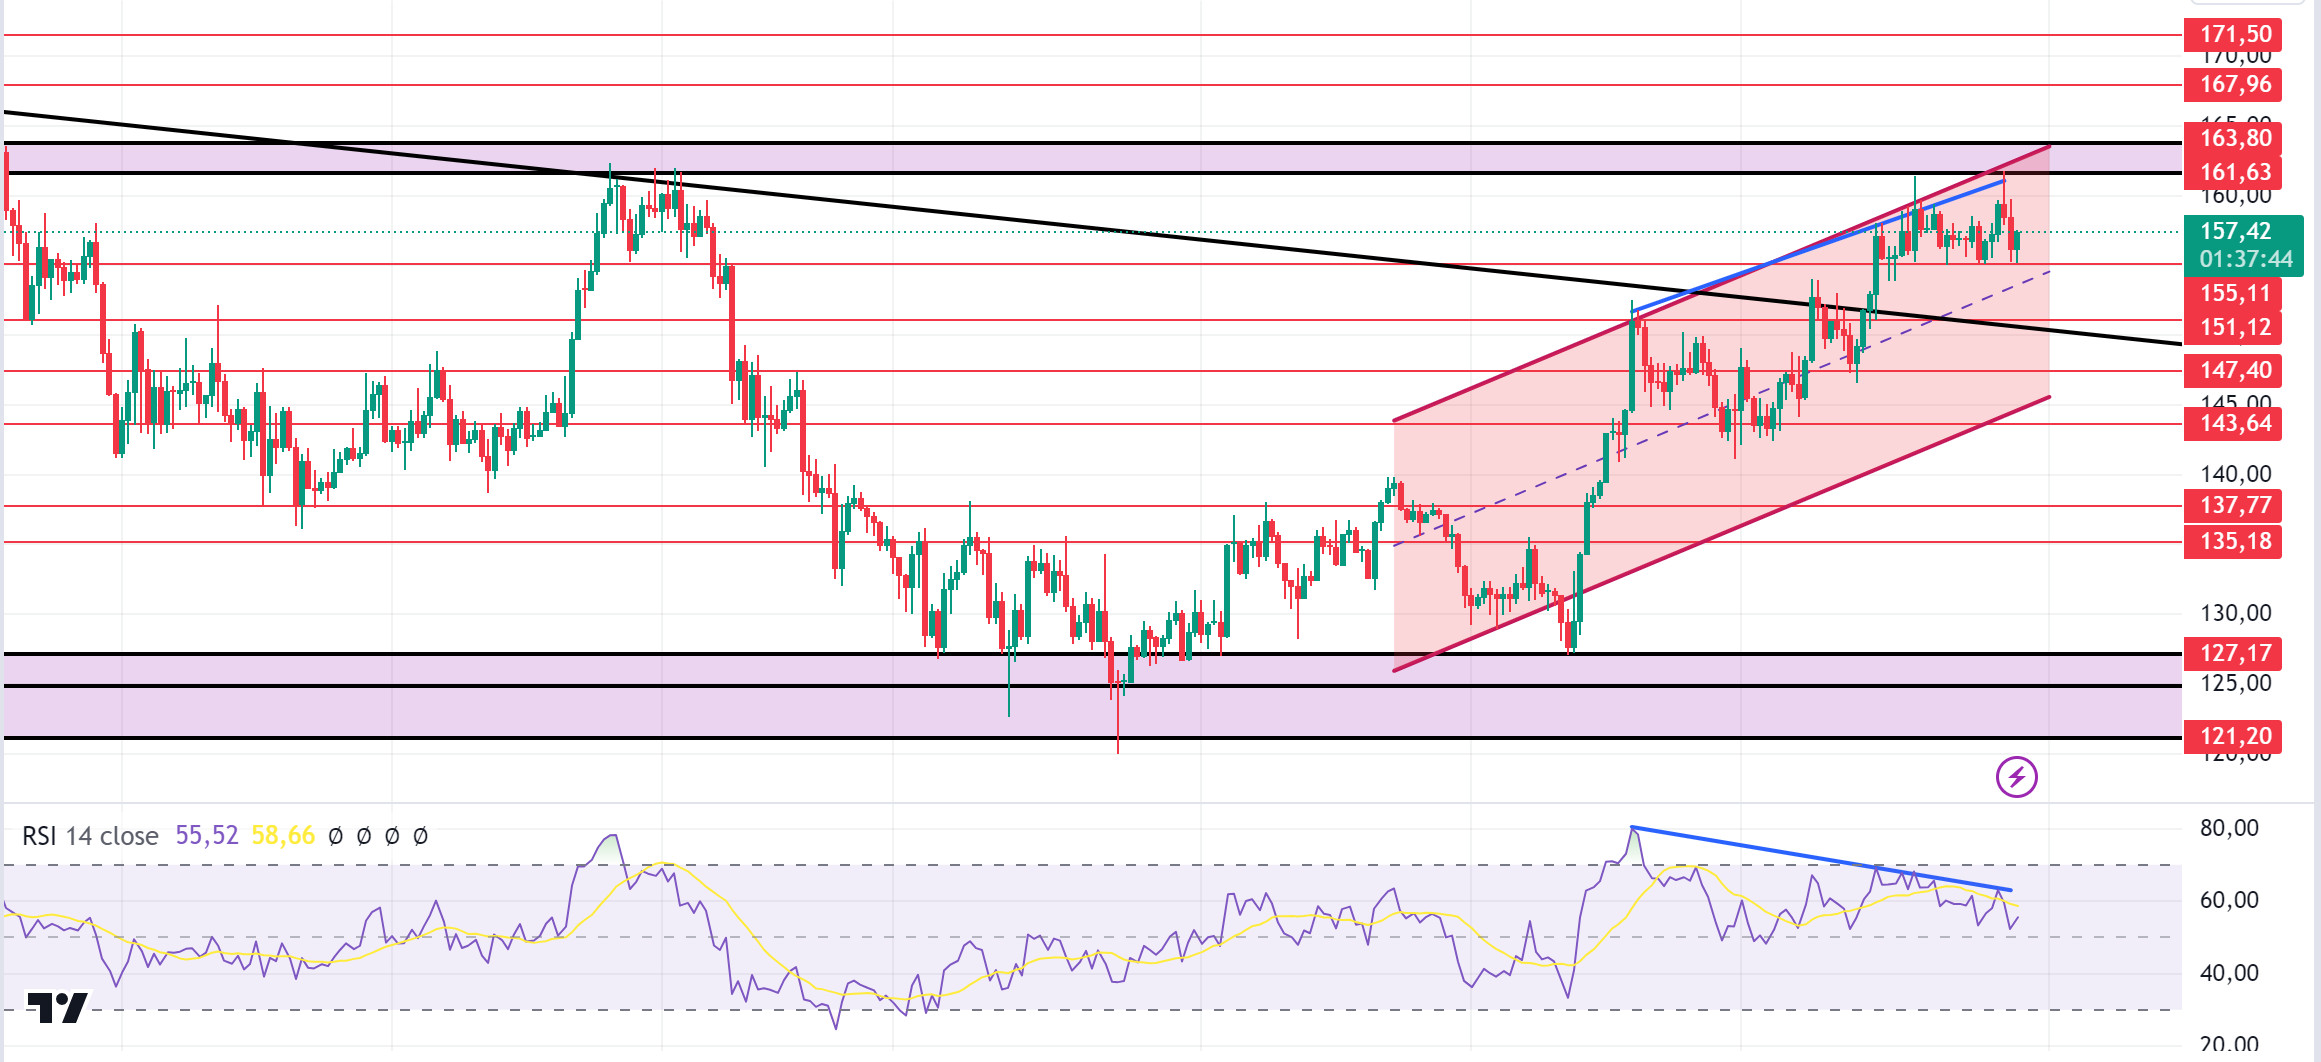
FED Chairman Powell’s meeting should be followed today. He is expected to declare that the interest rate cut may continue. This may also cause volume in cryptocurrencies. In the Solana ecosystem, Pump.fun’s sales continue. Its sale of 122,250 SOL, worth $ 18.9 million, may create short-term selling pressure. When we examine the chart, SOL tested a strong resistance point. The 161.63 – 163.80 band, the highest level of the last two months, could reverse the SOL price from here. When we look at the 4-hour rsi (14) indicator, there is a mismatch. This may cause pullbacks. Both macroeconomic conditions and innovations in the Solana ecosystem, 161.63 – 163.80 levels appear as a resistance place. If it rises above these levels, the rise may continue. If investors continue profit sales, 155.11 – 151.12 levels appear as support in the retracements that will occur. If it comes to these support levels, a potential rise should be followed.
Supports 155.11 – 151.12 – 147.40
Resistances 161.63 – 163.80 – 167.96
ADA/USDT
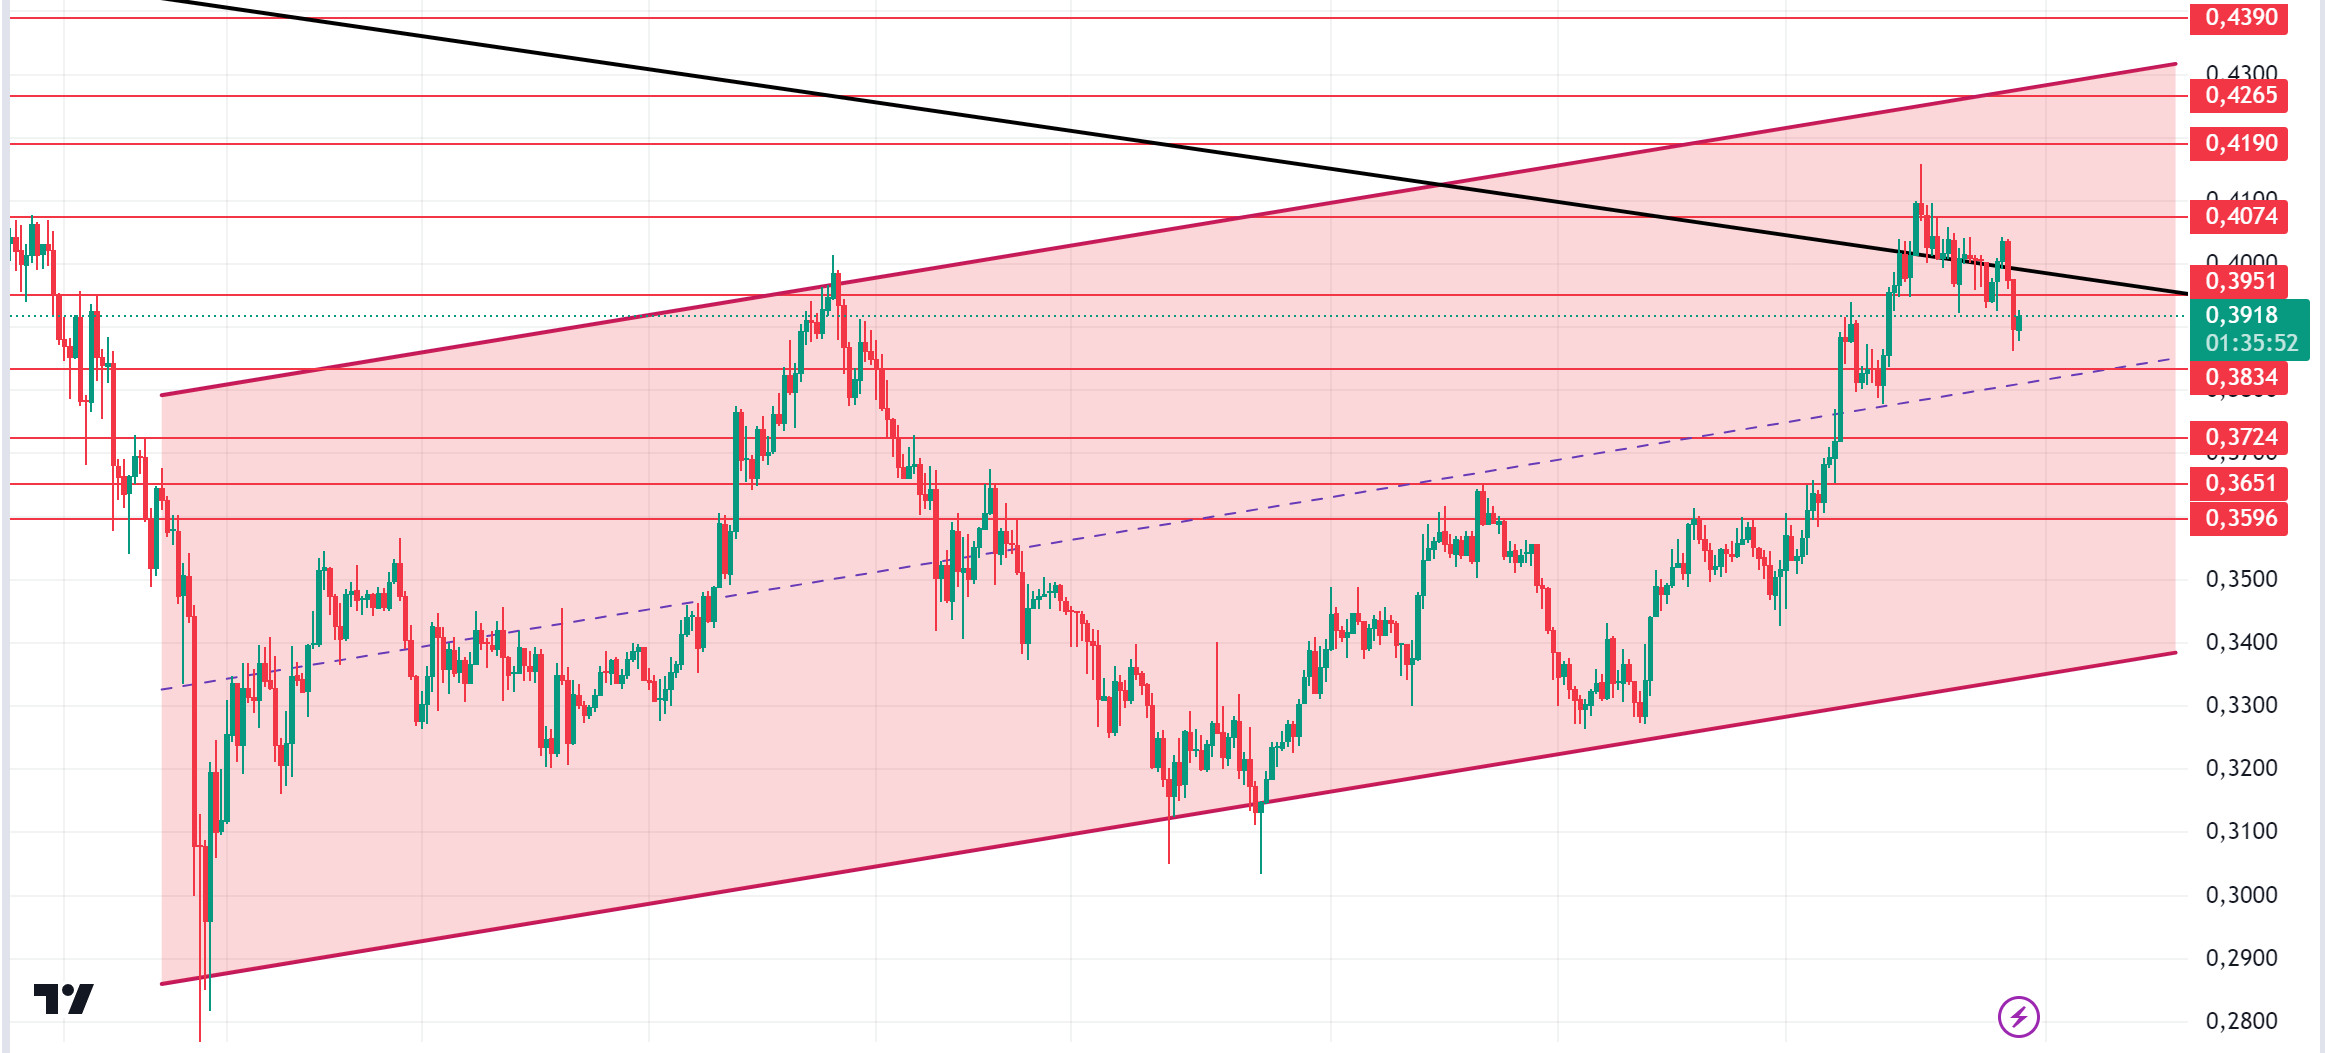
FED Chairman Powell’s meeting should be followed today. He is expected to declare that the interest rate cut may continue. This may also cause volume in cryptocurrencies. In the Cardano ecosystem, daily active addresses are decreasing. For this reason, it has decreased by 2.03% since yesterday. Since April 22, it broke the resistance of the downtrend, signaling a potential uptrend. It tested the resistance of the downtrend as support and fell below the resistance again. This could deepen the decline. ADA, which last saw these levels on July 29, 0.3834 – 0.3724 levels appear as a strong support in retracements due to possible profit sales. In the rises that will take place with the continuation of macro-economic data or the positive atmosphere in the ecosystem, the level of 0.4074 can be followed as resistance.
Supports 0.3834 – 0.3724 – 0.3651
Resistances 0.3951 – 0.4074 – 0.4190
AVAX/USDT
AVAX, which opened yesterday at 29.29, fell by about 1% during the day and closed the day at 29.04. Today, FED chairman Powell will give a speech in the evening. The market will be waiting for this speech. Therefore, we may see low volume transactions until the speech.
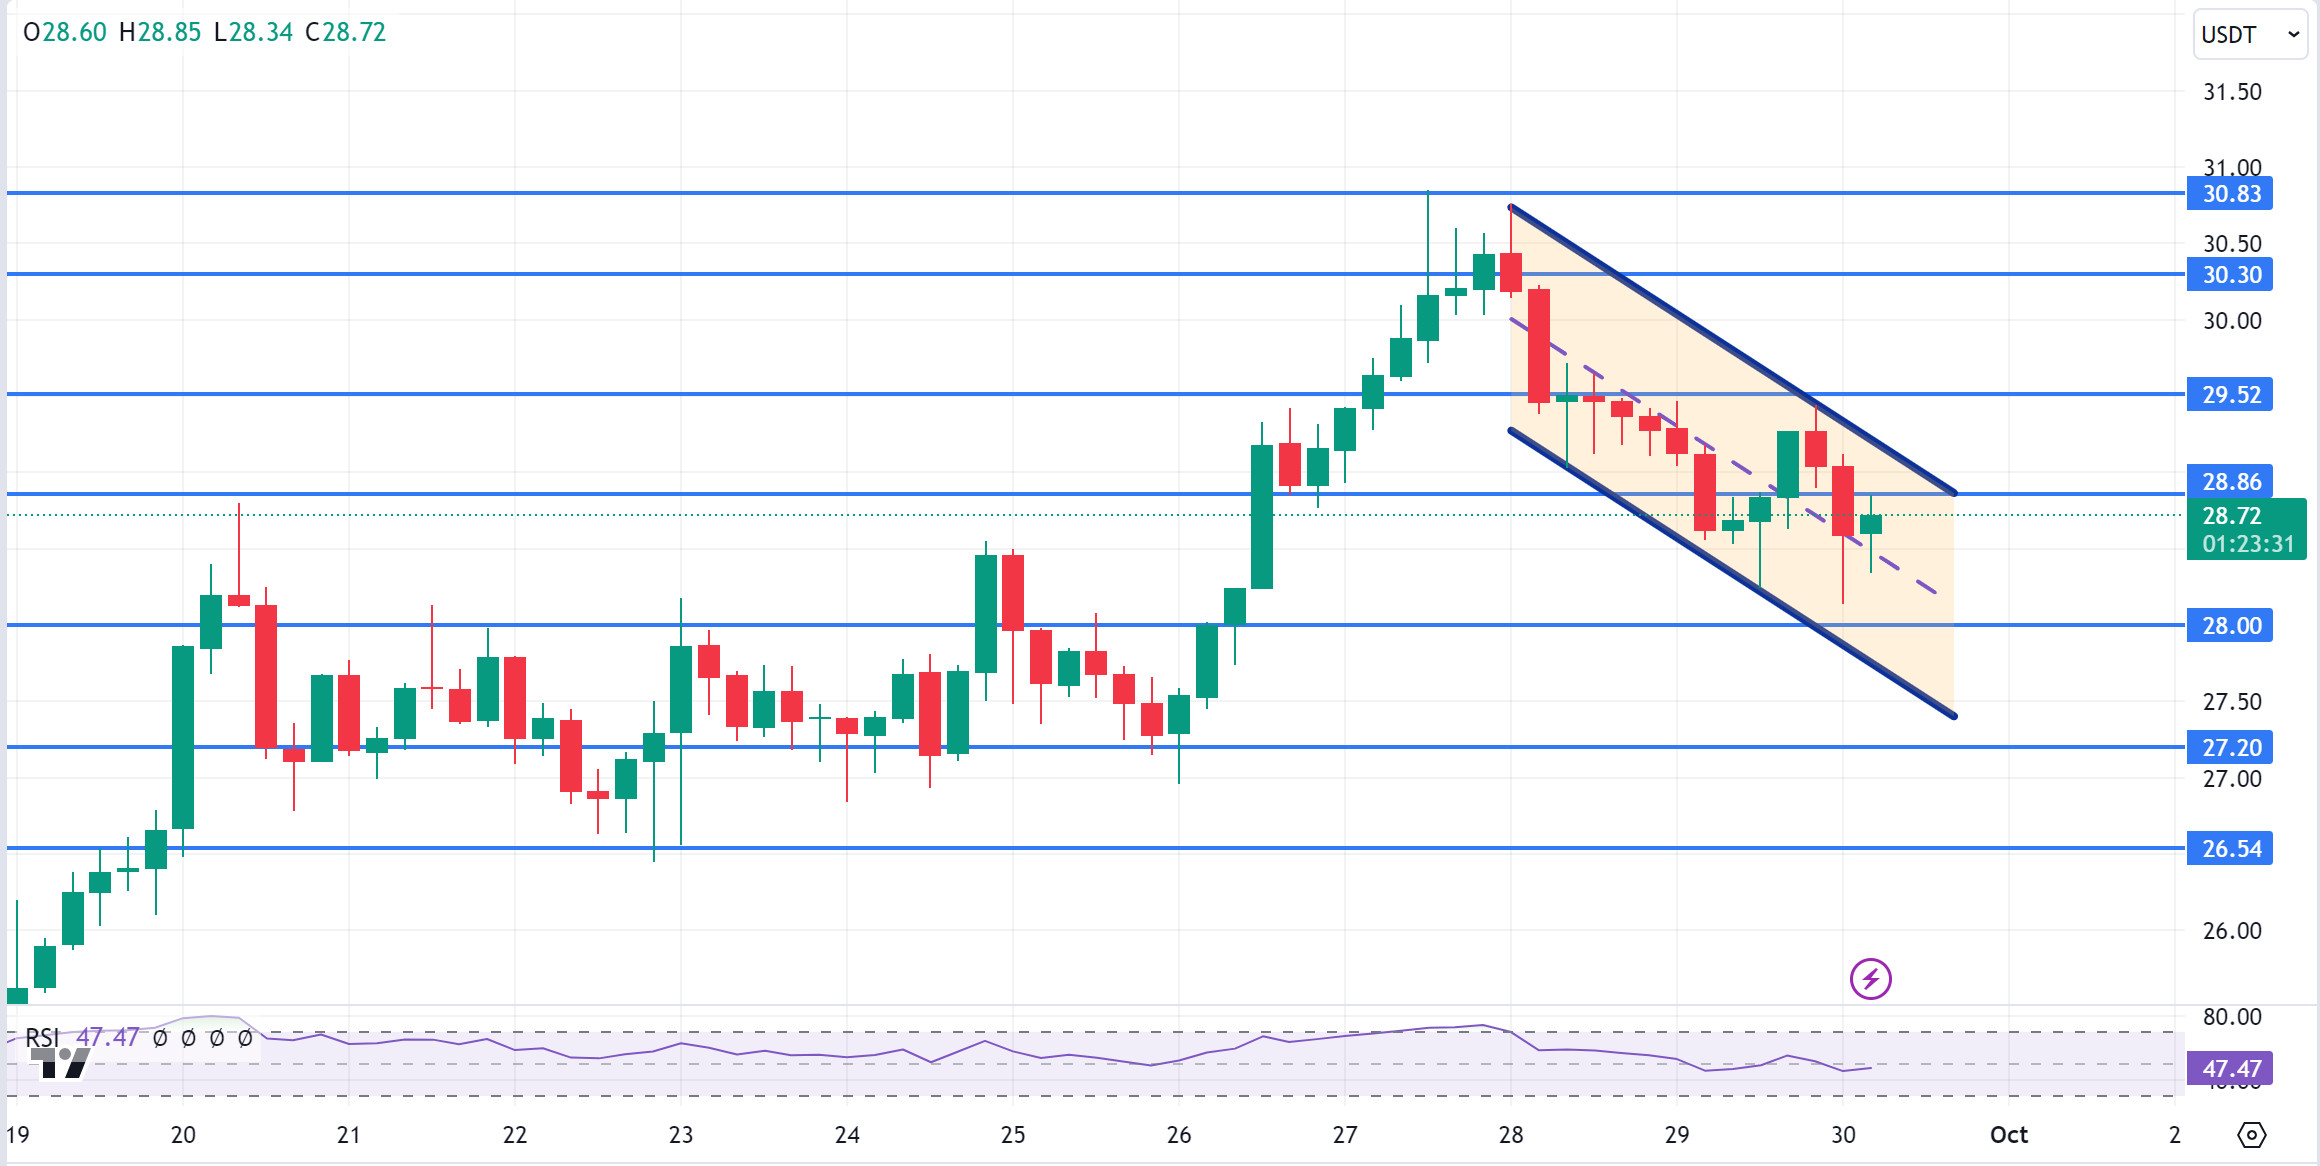
AVAX, currently trading at 28.72, is moving in a falling channel on the 4-hour chart. The RSI is in the middle band of the falling channel with a value of 47 and may want to go to the upper band by making some rise from these levels. In such a case, it can be expected to test the 28.86 resistance. Above 28.86 resistance, it cannot close the candle and if selling pressure comes, it may move to the lower band of the channel. In such a case, it may test 28.00 support. As long as it stays above 24.65 support during the day, the desire to rise may continue. With the break of 24.65 support, sales may increase.
Supports 28.00 – 27.20 – 26.54
Resistances 28.86 – 29.52 – 30.30
TRX/USDT
TRX, which started yesterday at 0.1550, rose 1% during the day and closed the day at 0.1565. We may have a day with low volume and limited movements until FED chair Powell’s speech today.
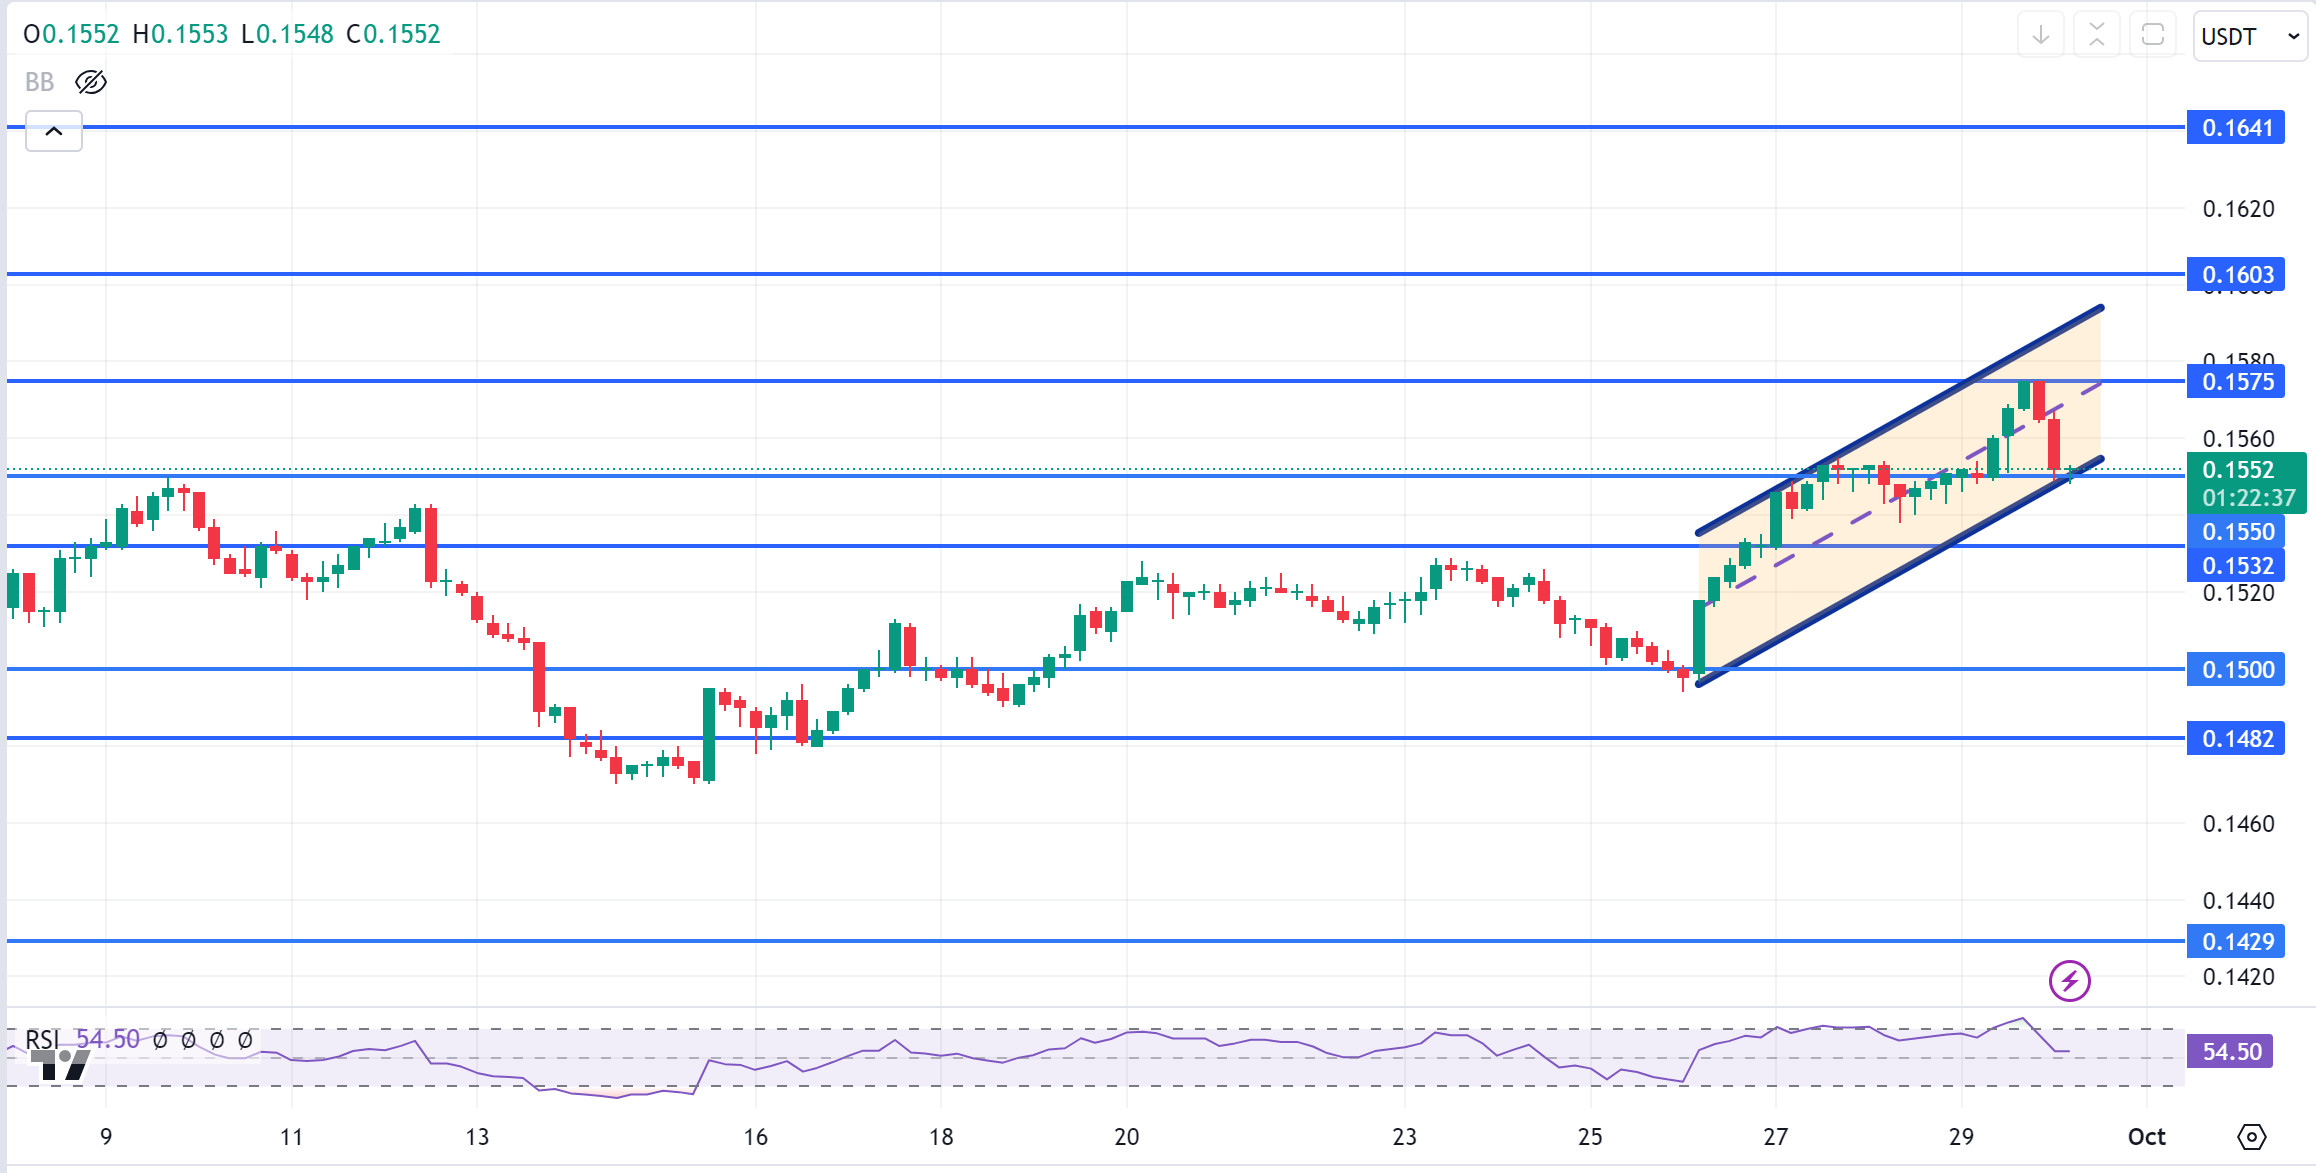
TRX, currently trading at 0.1552, is trying to break the rising channel downwards on the 4-hour chart. With the RSI 54 value, it can be expected to move to the middle band of the channel with the buying reaction from the lower band of the channel. In such a case, it may test 0.1575 resistance. If it breaks the channel lower band downwards and closes the candle under 0.1550 support, it may test 0.1532 support. TRX may continue to be bullish as long as it stays above 0.1482 support. If this support is broken downwards, sales can be expected to increase.
Supports 0.1559 – 0.1532 – 0.1500
Resistances 0.1575 – 0.1603 – 0.1641
XRP/USDT
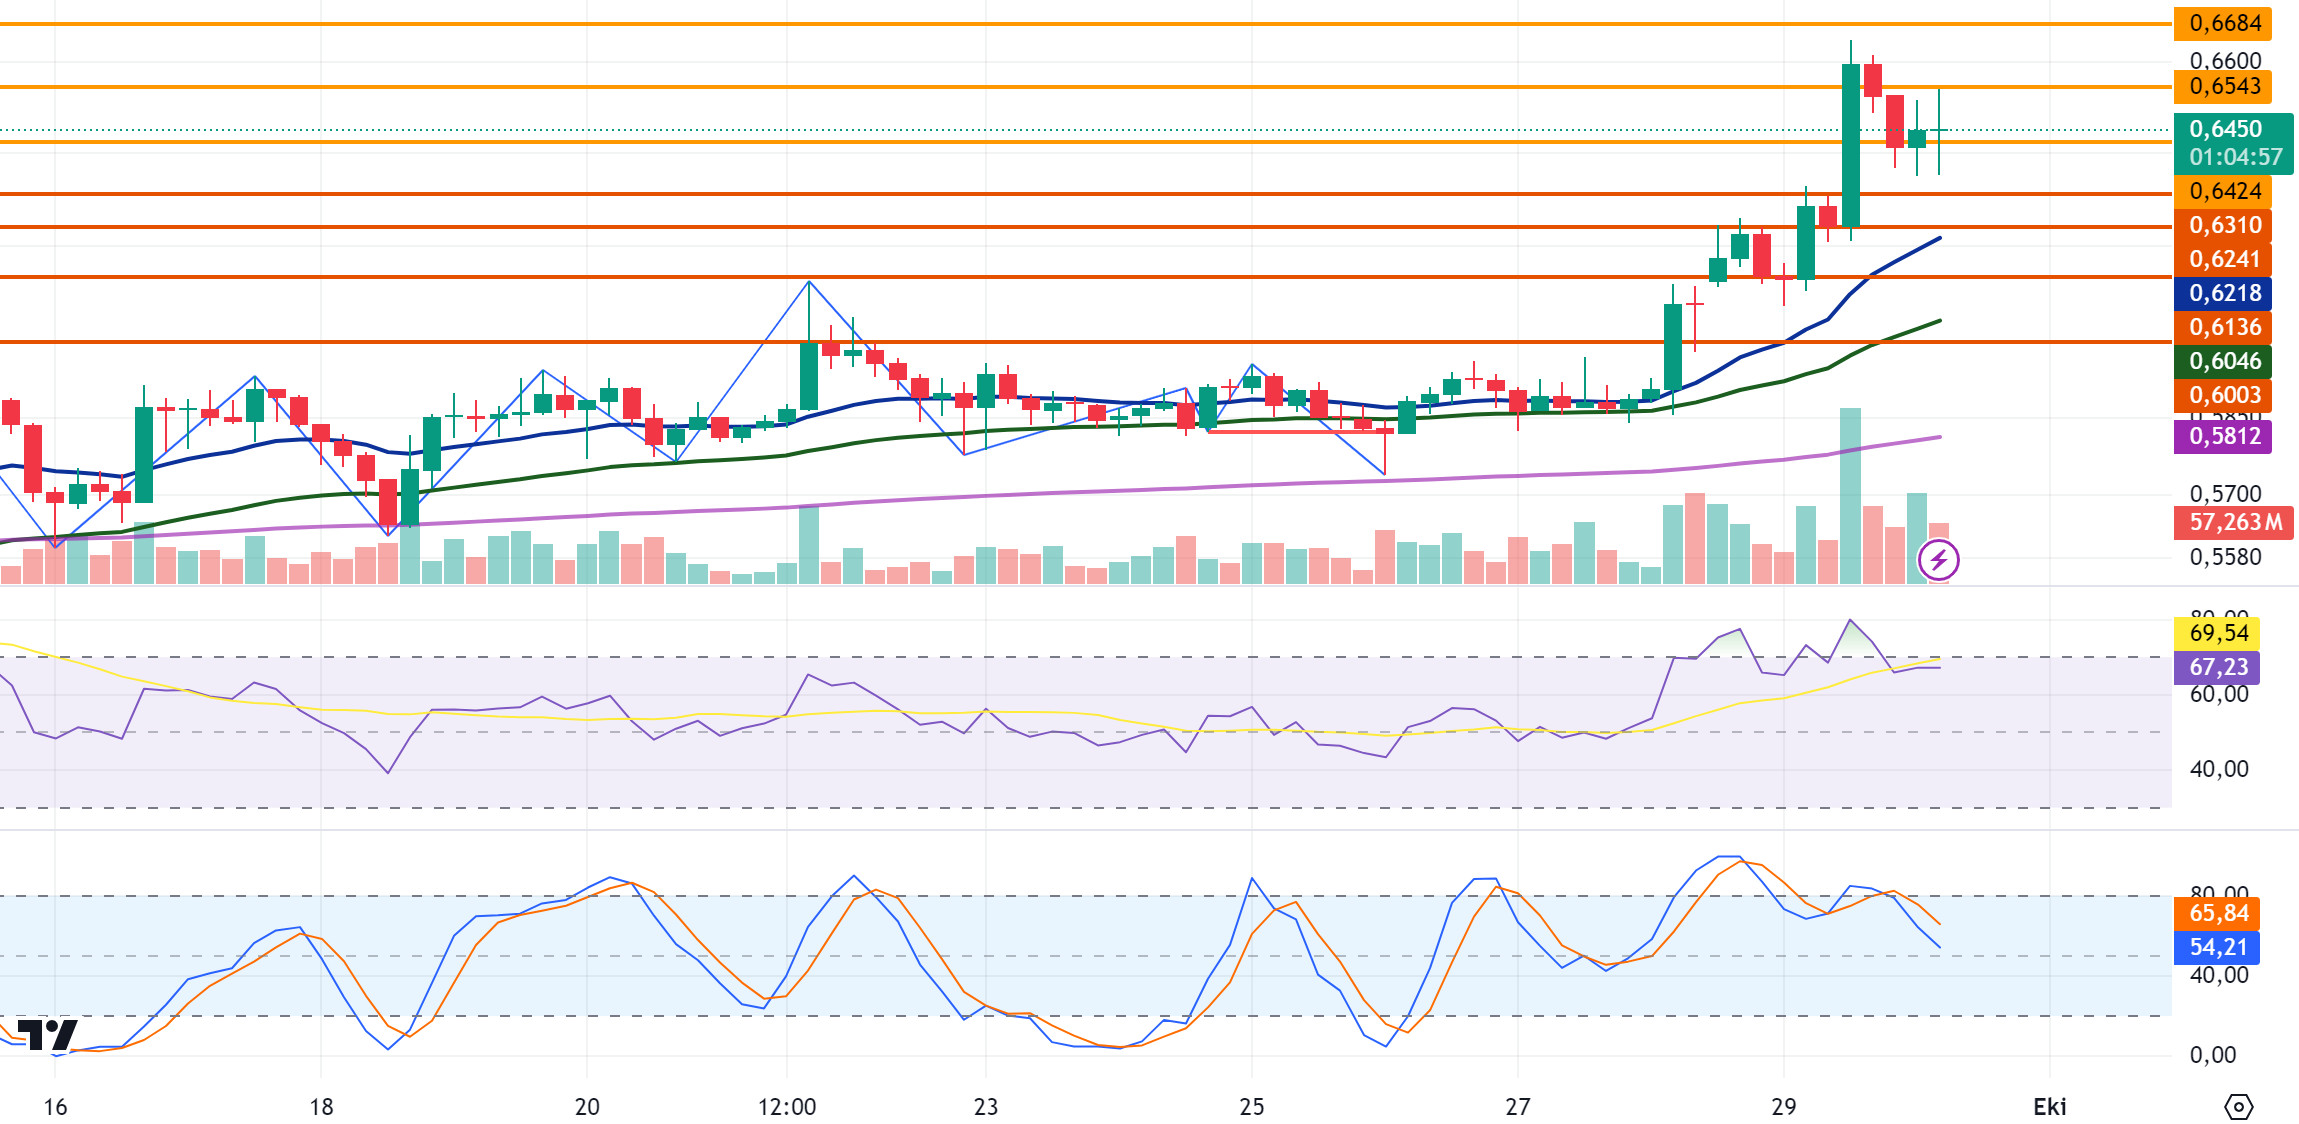
XRP rose as high as 0.6661 with the value increase it experienced over the weekend, and the daily closing yesterday was realized at 0.6412 with the sales. In the 4-hour analysis, XRP, which is on the rise again after the decline in the opening candle today, is currently trading at 0.6460. In XRP, eyes are turned to the news from the SEC about the lawsuit. The SEC has the right to appeal until October 7. In this process, as we approached the deadline of the appeal, a positive atmosphere for XRP emerged and rose to the level of 0.66 before the decision with its rise. If it continues to rise before the SEC decision, it may test the resistance levels of 0.6424-0.6543-0.6684. In case of a decline, it may test the support levels of 0.6310-0.6241-0.6136.
The SEC’s decision is important for XRP until October 7. If the SEC’s decision is positive for XRP, it may cause XRP to trade at levels of 0.75 and above, and this process may offer a long trading opportunity. The SEC’s appeal of the court decision may also cause a negative atmosphere and as a result, it may cause it to trade at levels of 0.54 and below and may offer a short trading opportunity.
EMA20 (Blue Line) – EMA50 (Green Line) – EMA200 (Purple Line)
Supports 0. 6310 – 0. 6241 – 0.6136
Resistances 0.6424 – 0.6 543 – 0.6684
DOGE/USDT
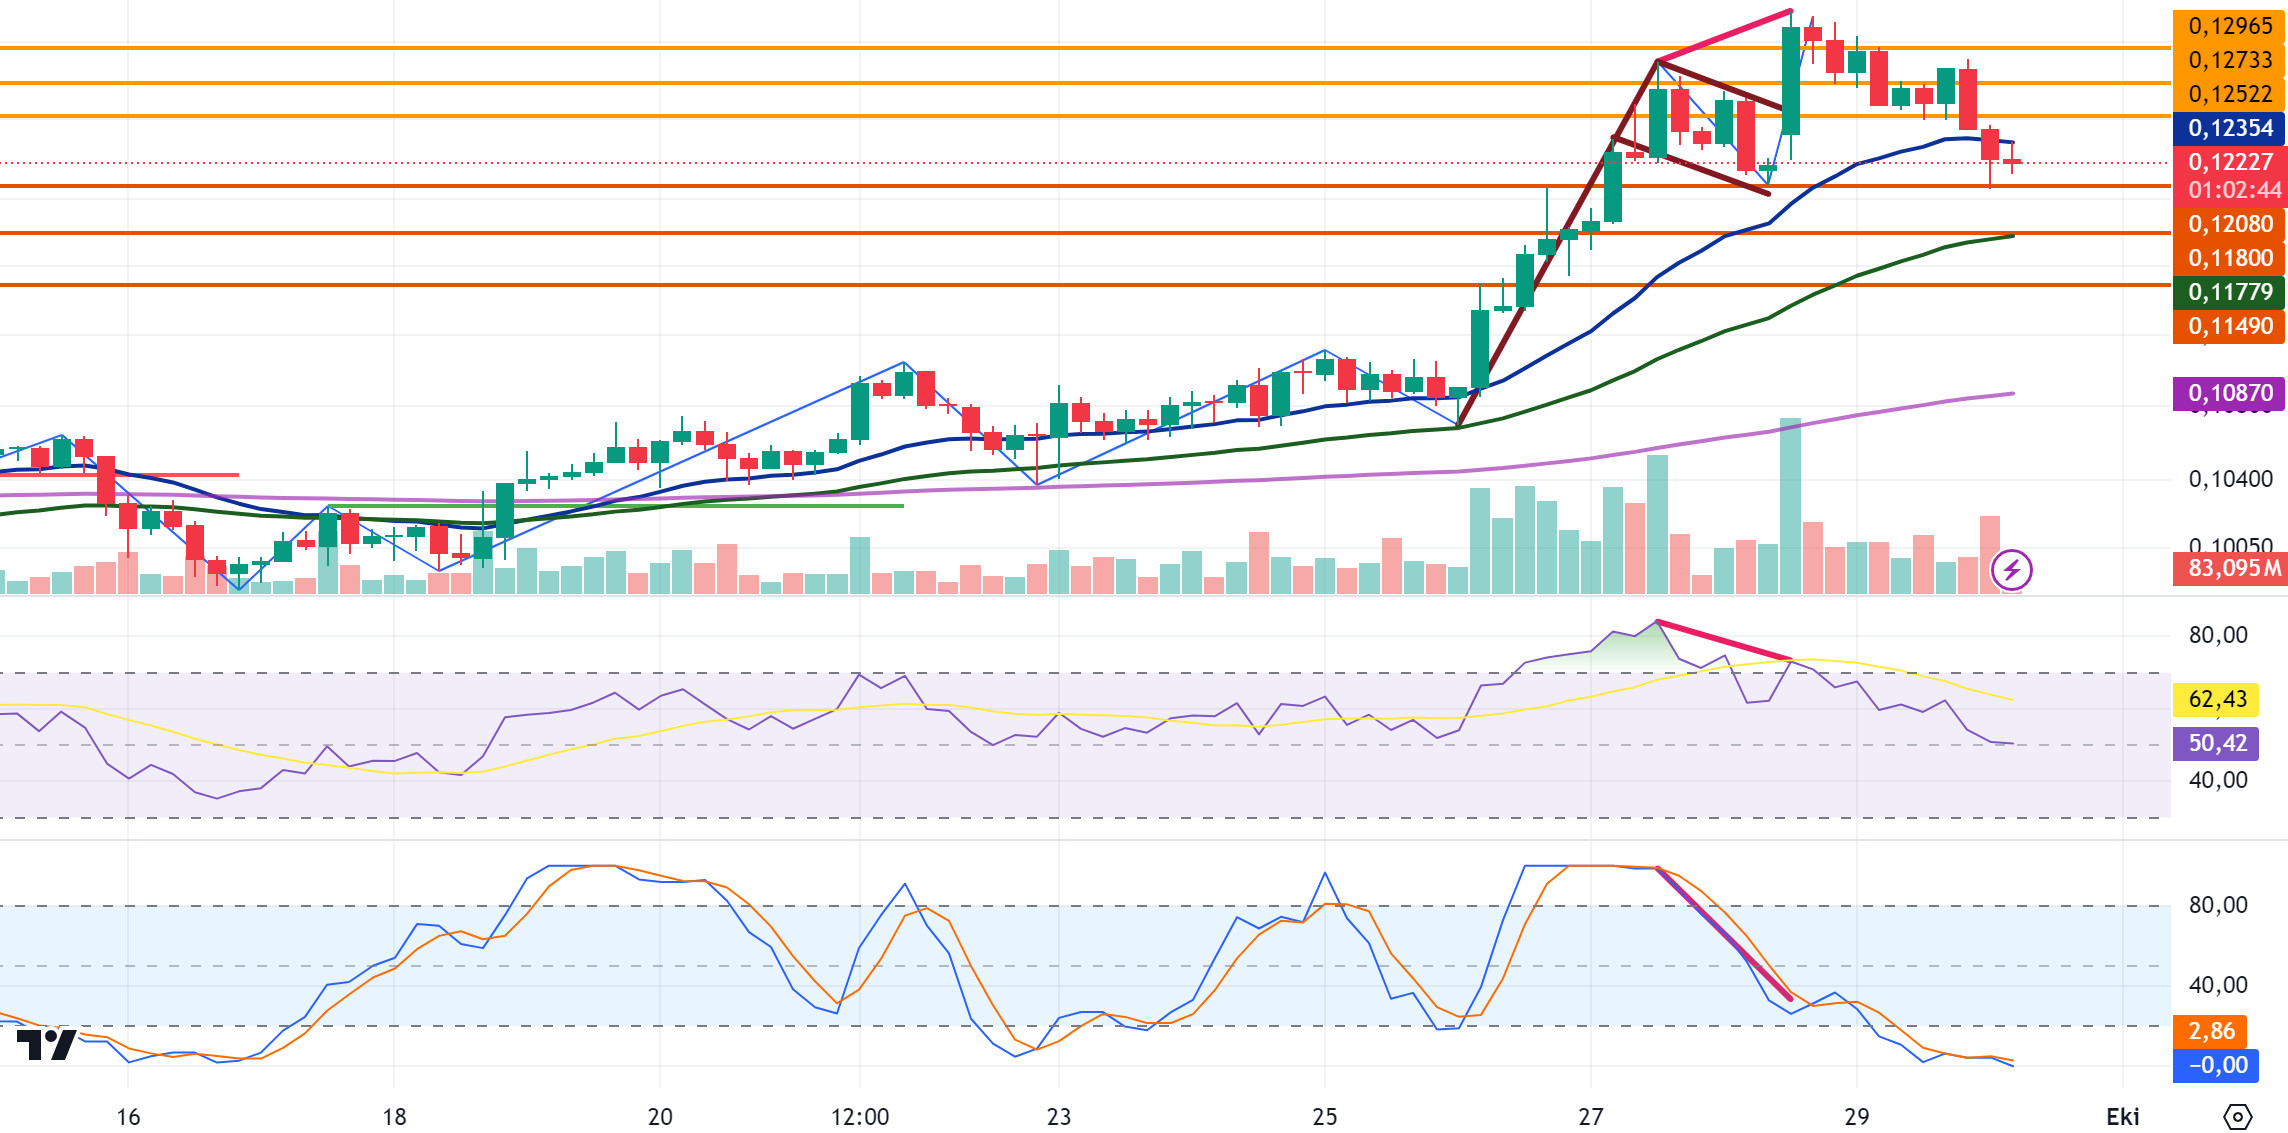
After rising as high as 0.1322 on September 28, DOGE declined with the sales and closed at 0.1243 yesterday as the decline continued. The decline in DOGE continued today and is currently trading at 0.1222. If the decline deepens, it may test the support levels of 0.1208-0.1180-0.1149. If the decline gives way to an uptrend, it may test the resistance levels of 0.1252-0.1275-0.1296.
If the 0.1208 support level is broken in the DOGE decline and the decline continues, the 0.1180 and EMA50 support zone comes to the fore and may offer a long trading opportunity with the purchases that may come in this region. If it rises, it may decline with the sales that may come in the resistance zones of 0.1252 and 0.1273 and may offer a short trading opportunity.
EMA20 (Blue Line) – EMA50 (Green Line) – EMA200 (Purple Line)
Supports 0.1208 – 0.1180 – 0.1149
Resistances 0.1 252- 0.1275 – 0.1296
DOT/USDT
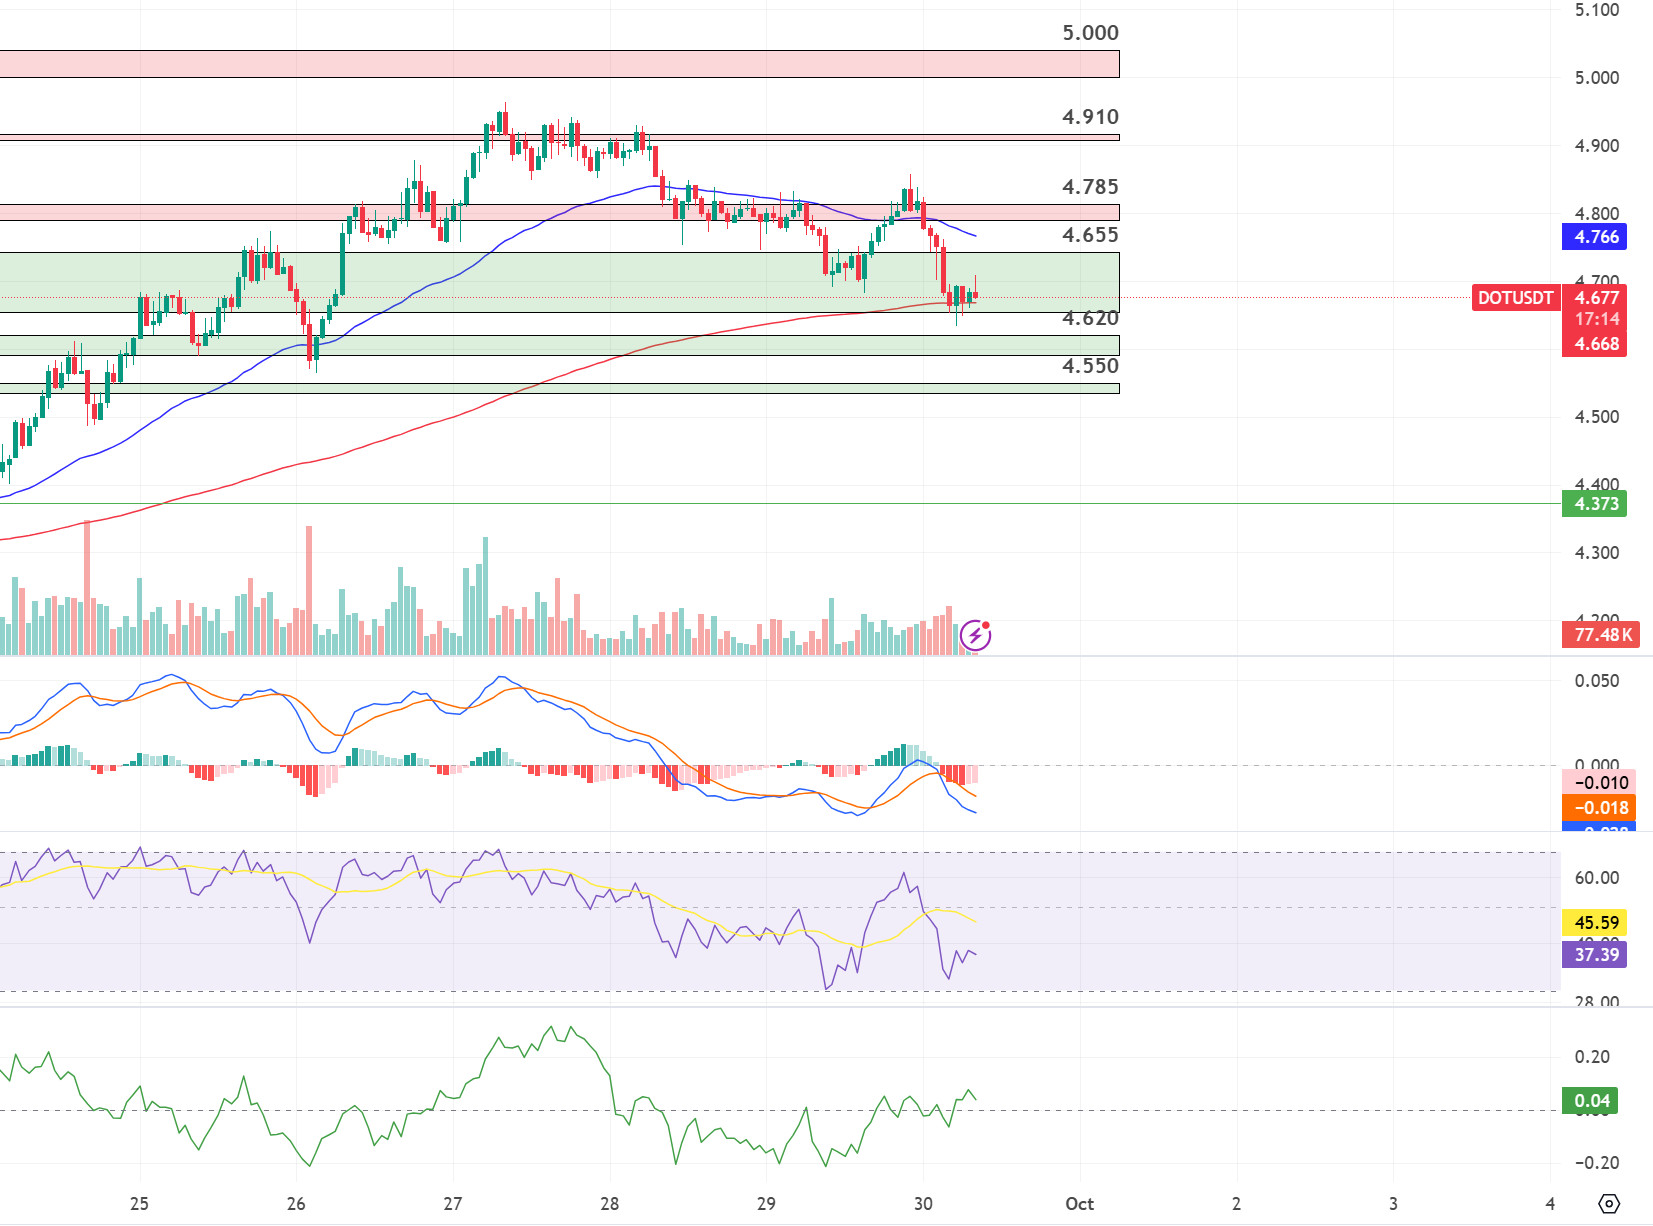
we examine the Polkadot (DOT) chart, the price fell to 4,655 levels with increasing selling pressure at 4,910 levels. The price, which reacted from the EMA200 level, is currently flat. When we examine the MACD oscillator, we can say that the selling pressure has decreased. According to the CMF oscillator, buying pressure seems stronger. If the price stays above the EMA200, it may see a rise towards 4.785 levels. On the other hand, if the price loses the EMA200 level, we can expect it to decline to 4.620 levels.
(Blue line: EMA50, Red line: EMA200)
Supports 4,655 – 4,620 – 4,550
Resistances 4.785 – 4.910 – 5.000
SHIB/USDT
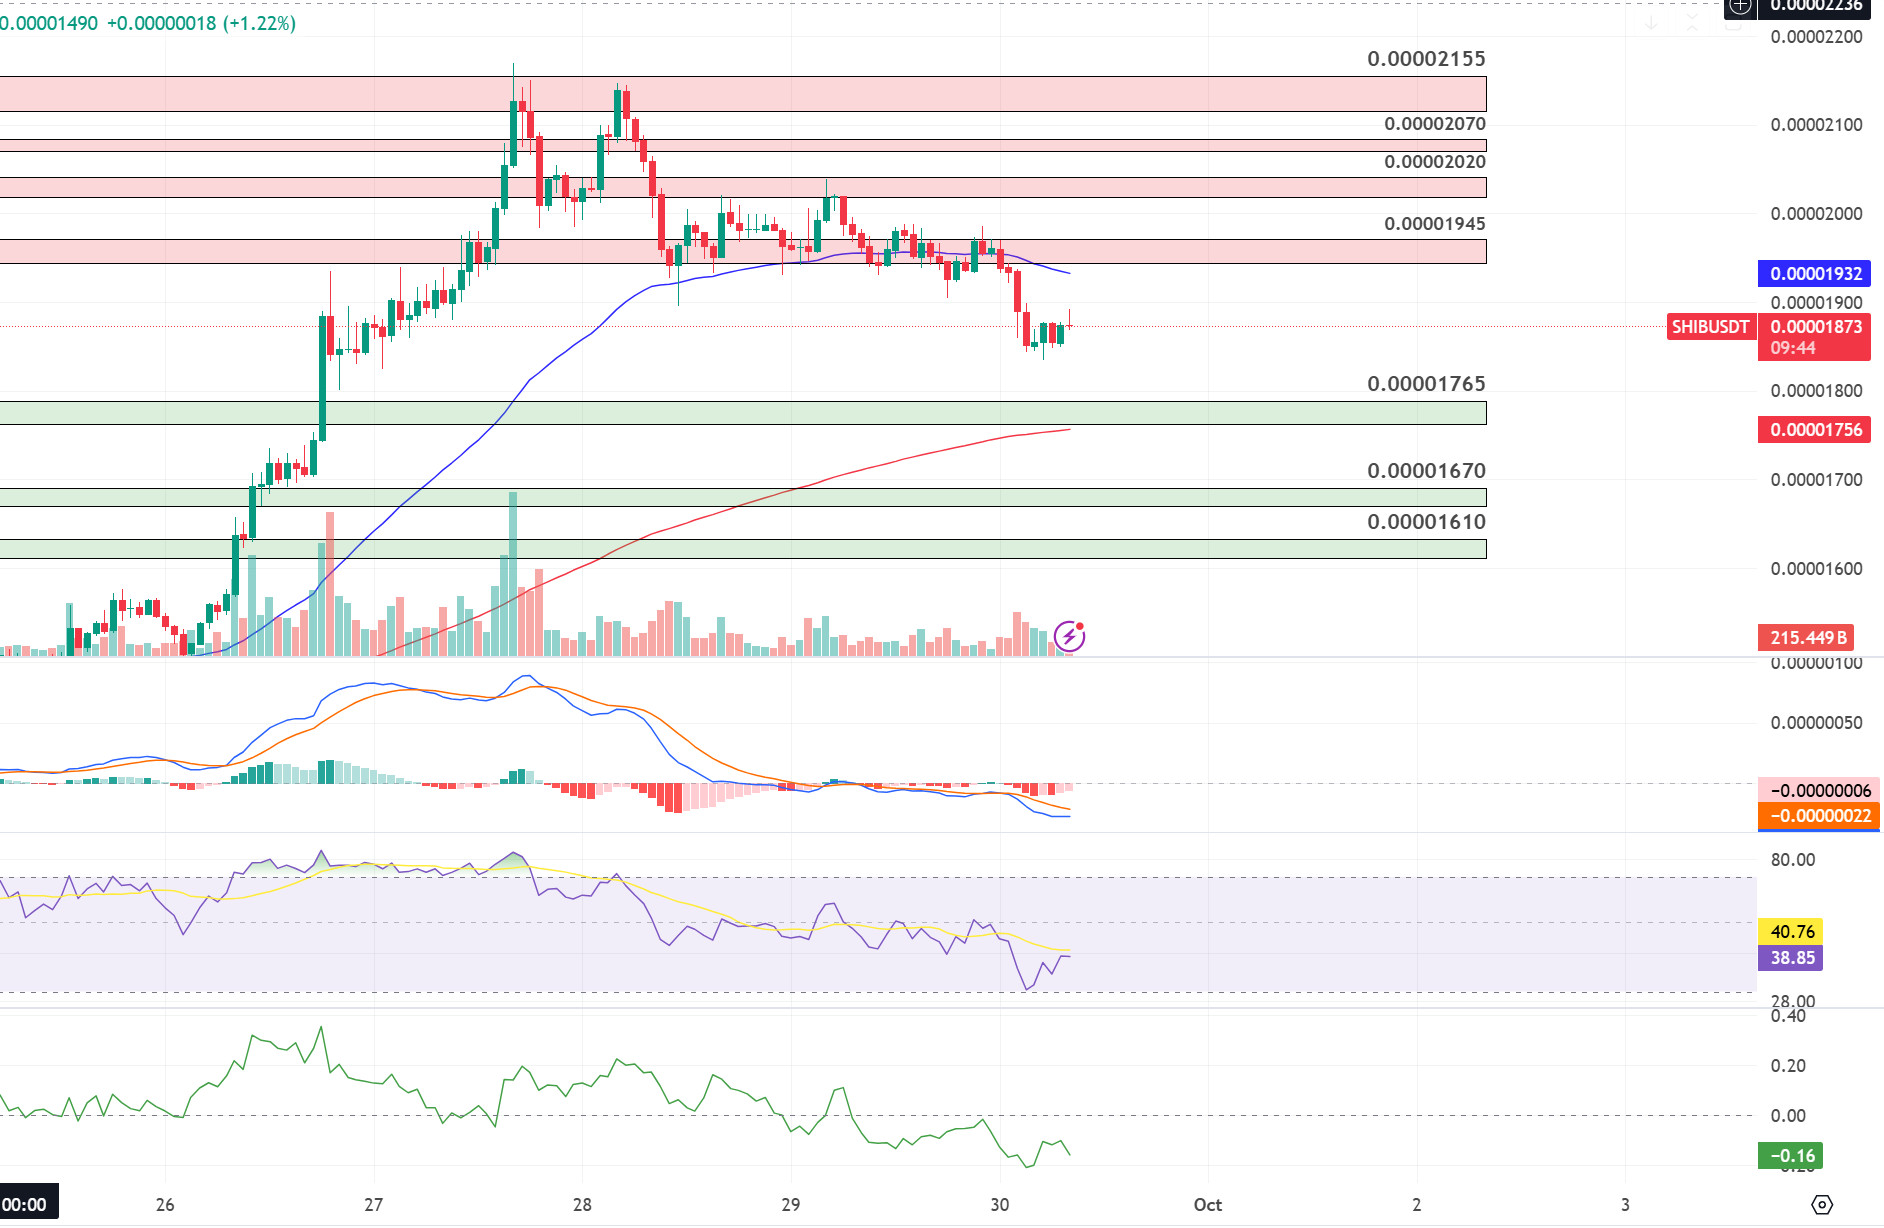
When we examine the chart of Shiba Inu (SHIB), the price fell to 0.00001875 levels with the reaction from the resistance level of 0.00002155. According to the CMF oscillator, selling pressure continues. In a negative scenario, the price may fall to 0.00001765 levels. On the other hand, if the price can maintain above the EMA50 level, it may want to retest the 0.00002020 resistance level.
(Blue line: EMA50, Red line: EMA200)
Supports 0.00001765 – 0.00001670 – 0.00001610
Resistances 0.00001945 – 0.00002020 – 0.00002070
LEGAL NOTICE
The investment information, comments and recommendations contained herein do not constitute investment advice. Investment advisory services are provided individually by authorized institutions taking into account the risk and return preferences of individuals. The comments and recommendations contained herein are of a general nature. These recommendations may not be suitable for your financial situation and risk and return preferences. Therefore, making an investment decision based solely on the information contained herein may not produce results in line with your expectations.


