BTC/USDT
Bitcoin left behind another week of consolidation. In this week of intense developments regarding Bitcoin, Semler Scientific and China-based SOS Limited, along with the mining company Mara Holding, took important steps towards Bitcoin. Regarding crypto regulations, Russia decided to approve, while the United Kingdom announced that it has started its work in this area. South Korea, on the other hand, gave a negative response to the Bitcoin reserve. In the US, while President Donald Trump’s cabinet work continues rapidly, Elon Musk was given responsibility for artificial intelligence. In addition, the name of pro-crypto Paul Atkins came up for the SEC chairmanship. With Microsoft’s future vote, companies joining the Bitcoin reserve are expected to grow. However, Apple CEO Tim Cook made a statement that showed a hesitant approach on this issue.
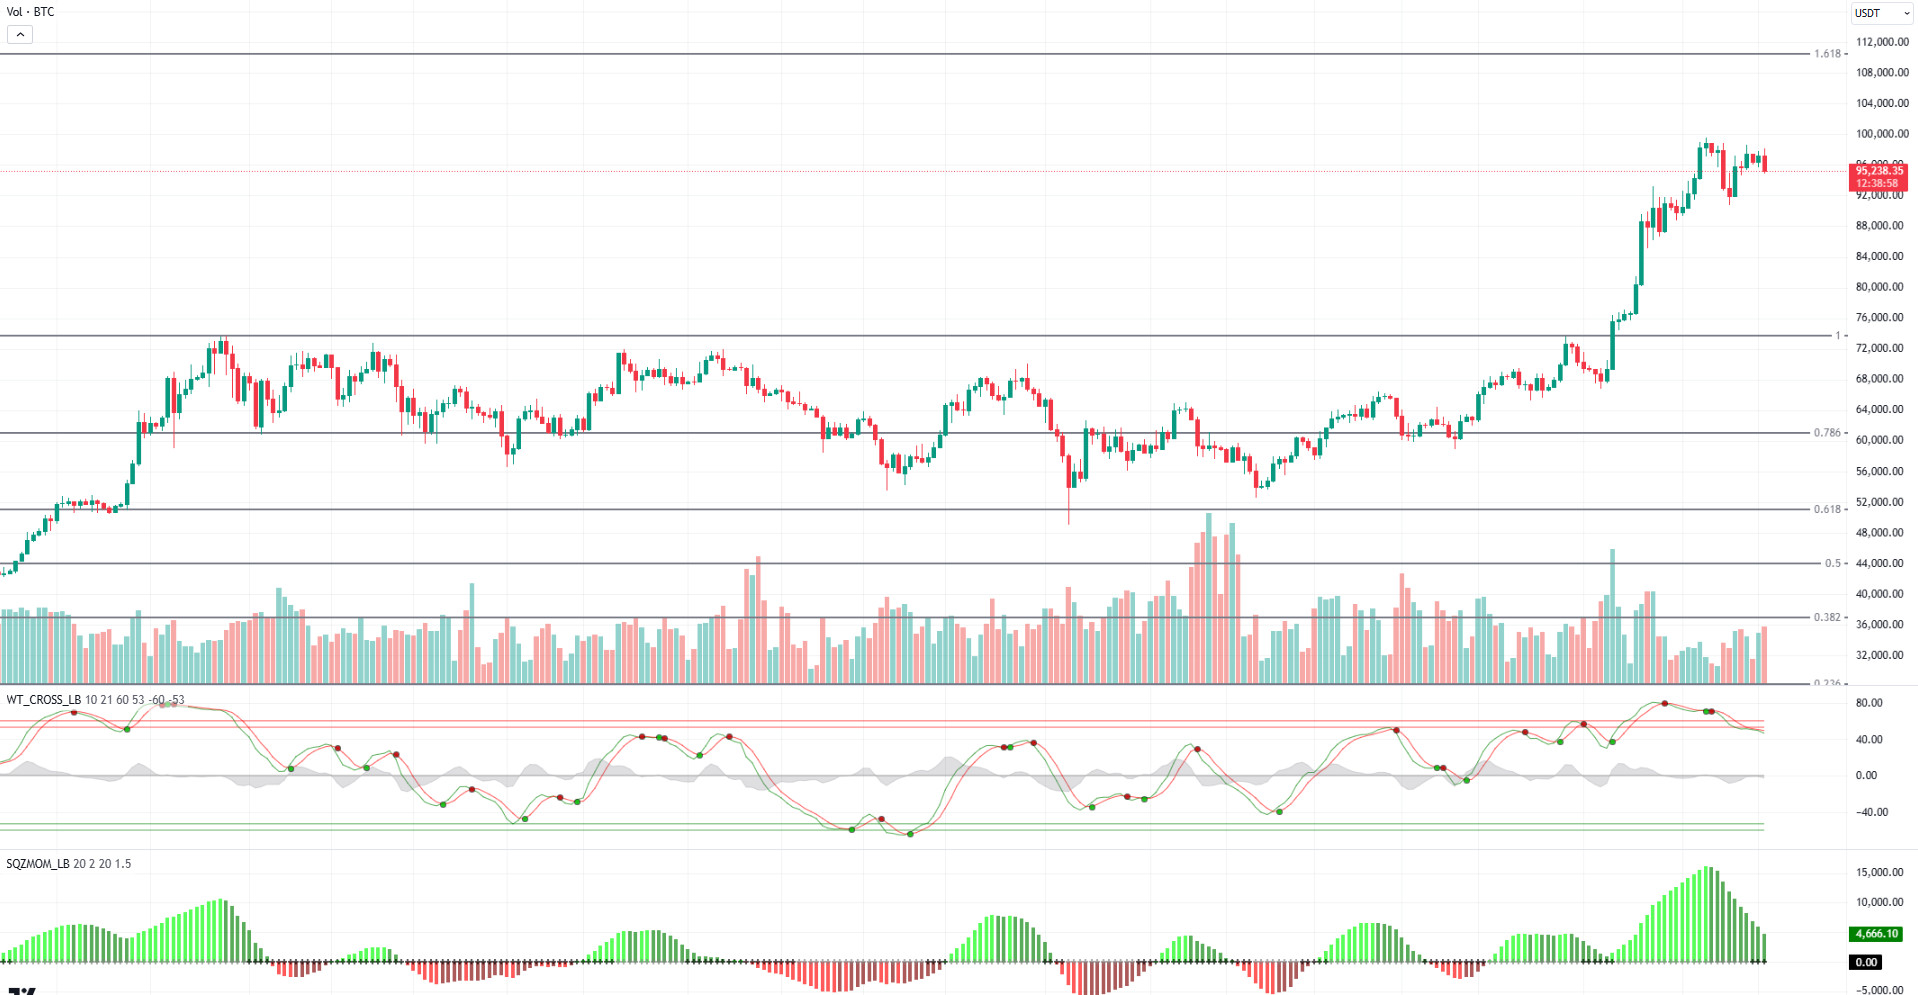
With all these developments, when we look at the BTC technical outlook, it entered December by closing the November bullish rally by 37.29%. It is observed that BTC, which had an average return of 4.98% in December in previous years, has experienced deep declines from time to time. BTC, which draws an image that holds at the peak of its rise, is trading in the consolidated phase between 95,000 and 100,000. Technical oscillators continue to signal a sell signal on the daily chart, while momentum continues to lose strength. In the correction of the rise, we may first encounter the 95,000 support level and then the 90,000 level. In the coming process, Microsoft’s vote will be carefully monitored, and in case of approval, we can expect it to settle above six-digit levels, starting a new uptrend in its price.
Supports 95,000 – 90,000 – 83,000
Resistances 99,955 – 100,000 – 110,000
ETH/USDT
The Ethereum derivatives market reached $20 billion in trading volume for the first time in its history. Institutional investor interest is further fueled by the growing popularity of crypto ETFs. After the recent Shanghai update, Ethereum staking rates continue to increase. With the Ethereum network offering high security and the number of validators increasing every week, institutional interest can be expected to continue to grow.
Non-Fungible Token (NFT) and Decentralized Exchange (DEX) volumes on the Ethereum network have also increased significantly. When Blur and Uniswap data are analyzed, the volumes in certain NFTs and tokens with price increases of up to 200% in some places signal that the interest in the Ethereum network has started again. On the other hand, the volume increase in the Base network also has a positive effect on the price with high ETH demand.
Eigenlayer has seen higher-than-expected demand and has reached a significant TVL volume. Investors’ moves to generate revenue from high APY rates and AVS on Eigenlayer also continue to have a positive impact on the ETH price.
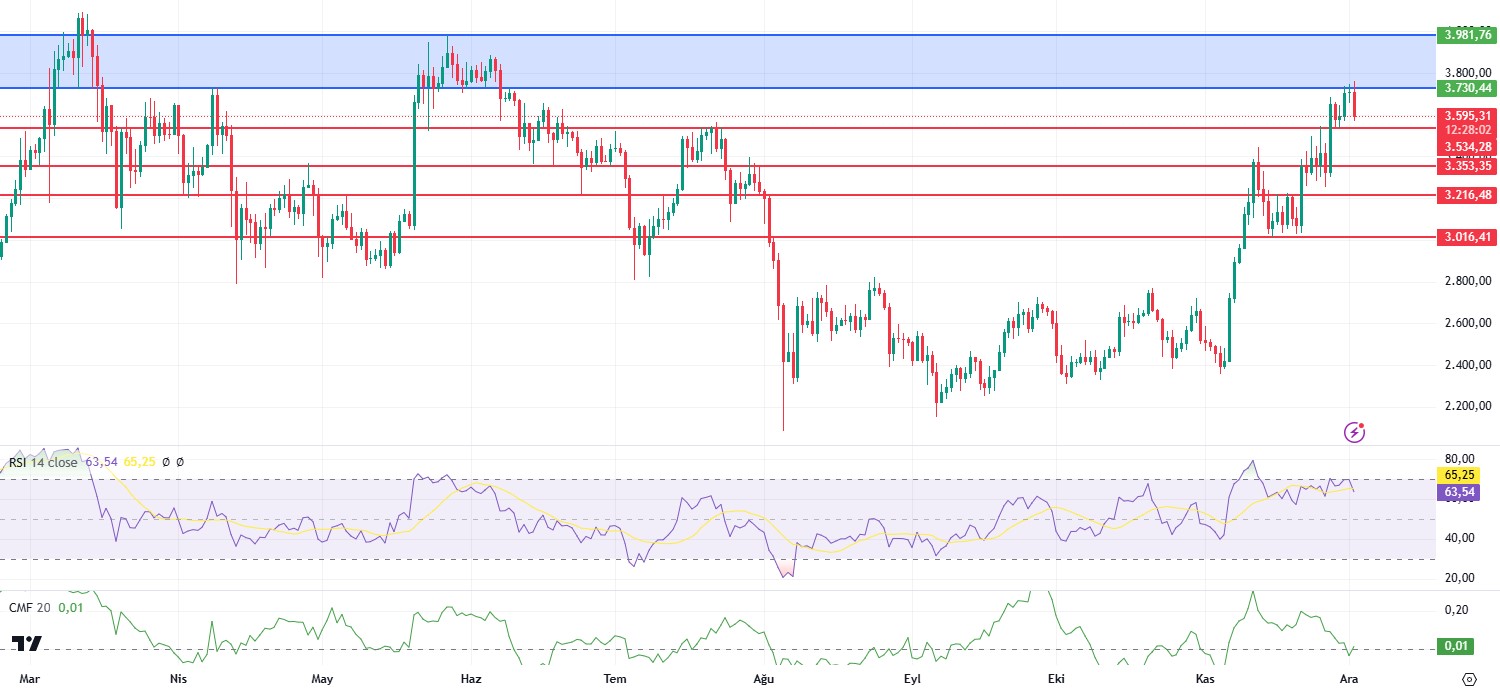
If we analyze ETH technically, we see that it managed to rise up to 3,760, the resistance zone marked by the blue box on the chart, and that the correction movement started with a reaction from this level. We see that the Relative Strength Index (RSI) is in a healthy correction structure with the reaction from the overbought zone and Chaikin Money Flow (CMF) has started to accelerate upwards by rising above the zero zone again. Looking at the Ichimoku, the absence of any violations at the tenkan, kijun and kumo cloud levels allows the bearish move to be interpreted as a correction. This movement can last up to 3,534 – 3,353 levels. With the reaction from here, new highs may come at 3,839 and beyond. However, if the daily closes remain below 3,353, a downtrend may start and pullbacks may occur between 2,923 – 2,788 levels.
Supports 3,534 – 3,353 – 3,016
Resistances 3,730 – 3,981 – 4,374
XRP/USDT
Ripple has formed strategic partnerships with organizations such as UK-based Archax and Mercy Corps Ventures to expand the use of XRP Ledger in innovative areas such as tokenized finance and financial inclusion. These partnerships have accelerated the integration of blockchain technology into different sectors, increasing the use cases for XRP.
At the same time, Donald Trump’s victory in the US presidential election created a positive mood in the cryptocurrency market. Trump’s promise to make the regulatory framework for cryptocurrencies friendlier and the prospect
of SEC Chairman Gary Gensler’s impeachment have fueled optimism among investors and increased interest in XRP.
Market dynamics also supported XRP’s appreciation. Strong technical patterns, such as bull flags, strengthened the upside potential of the price. Open interest rates on XRP futures hit record highs, reflecting investor confidence and encouraging further capital inflows into the market. Taken together, XRP’s recent rapid rise has been a foregone conclusion.
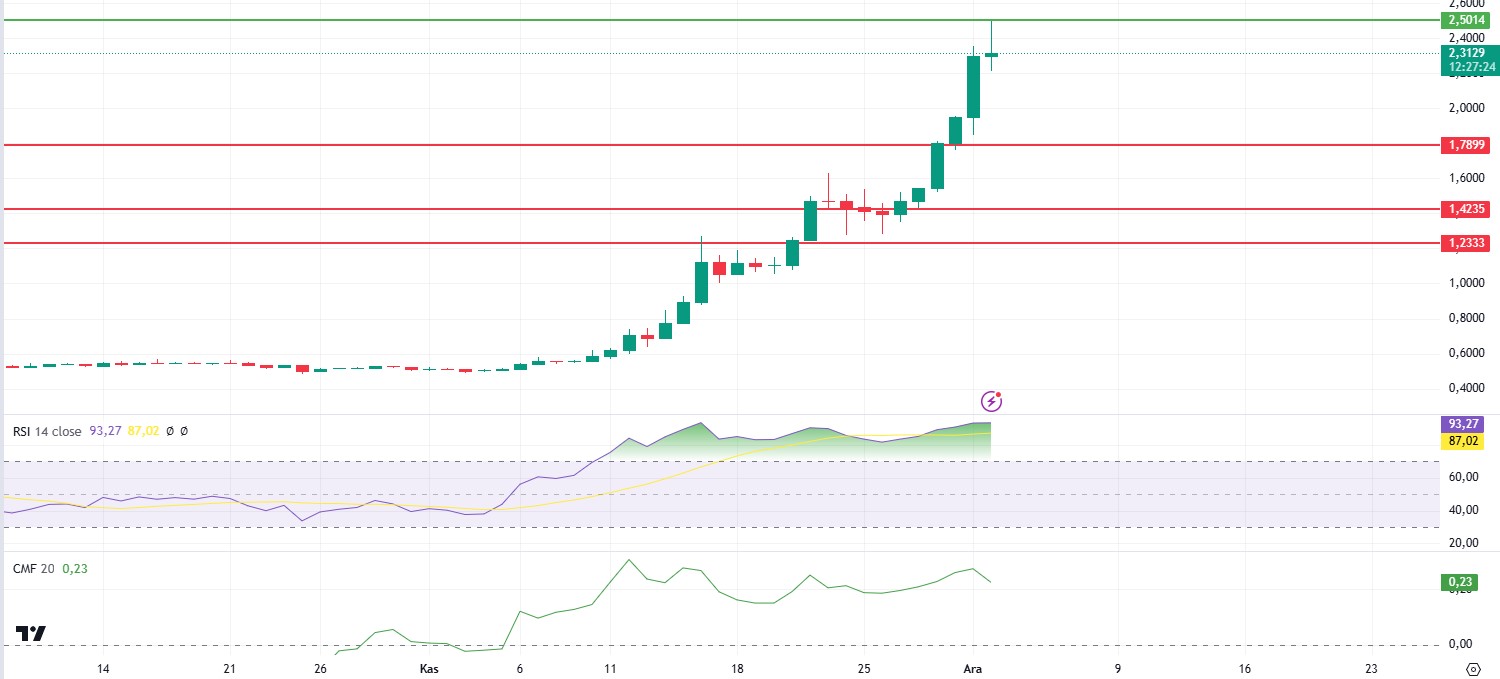
Technically speaking, the fact that the Relative Strength Index (RSI) has been in the overbought zone for a long time with this rise and the downward correction in Chaikin Money Flow (CMF) suggests that investors should consider taking profits against pullbacks in the price. However, the positive momentum may indicate that once the 2.5 psychological resistance is breached, the price may seek new highs without losing its bullish momentum.
Supports 1.7899 – 1.4235 – 1.2333
Resistances 2.5014 – 3.0399
SOL/USDT
Last week, Solana (SOL) hit an all-time high of $264.63 on November 24. Since the beginning of the week, Solana’s price has fallen 9.39% to $228.53. While previous applications for Solana ETFs were withdrawn earlier this year, industry observers are much more hopeful about the success of new applications, given the changing regulatory mood following Donald Trump’s victory in the recently concluded US presidential election. At the same time, the increase in applications for spot Solana ETFs following the resignation of SEC Chairman Gary Gensler has led to optimism in the cryptocurrency sector. Open Interest data reached a historic high of $6 billion. In addition, Pump.fun, a decentralized platform for creating memecoins, announced that the live-streaming feature has been disabled after users allegedly broadcast harmful and violent acts through the live-streaming feature. This is expected to lead to a decrease in meme token fury in the Solana ecosystem. Another metric, DEX volume, surpassed $100 billion for the first time.
Manufacturing data, hourly earnings, unemployment rate and non-farm payrolls data are among the important data to follow next week. On the other hand, Powell’s speech is among the data to be monitored and is expected to give clues about the upcoming FED interest rate. Data from CME shows that at the time of writing, the probability of a 25 basis point rate cut is 67.1%.
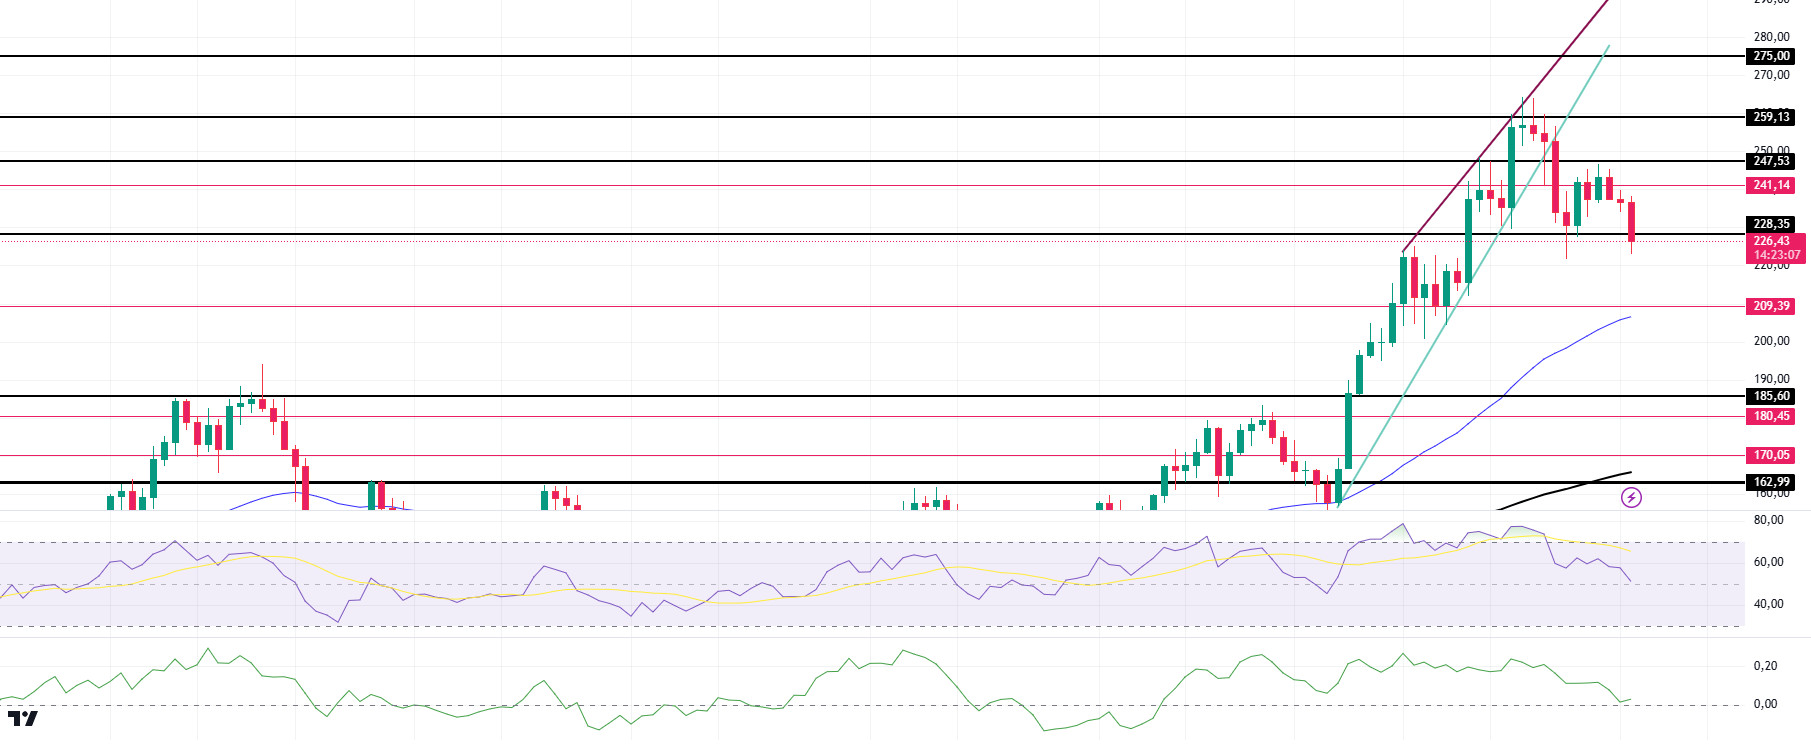
When we look technically, it has broken the 247.53 support, which is a strong resistance place, and made this level a resistance place. This is an important support level for the continuation of the rise. On our daily chart, the 50 EMA (Blue Line) continues to accelerate upwards from the 200 EMA (Black Line). This shows us that the trend is bullish. Relative Strength Index (RSI) is accelerating towards the 14 neutral level. On the other hand, the falling wedge pattern seems to have worked. As a matter of fact, if this pattern continues to work, the 185.60 target can be followed. All this points to a pullback in the price. However, when we analyze the Chaikin Money Flow (CMF)20 indicator, money inflows seem to be balanced. If the positive results in macroeconomic data and positive developments in the ecosystem continue, it may test the first major resistance level of 247.53. In case of declines due to political developments or negative news in the Solana ecosystem, the 185.60 level can be followed as a buying point.
Supports 228.35 – 209.39 – 185.60
Resistances 241.14 – 247.53 – 259.13
DOGE/USDT
The recent announcement of the partnership between Elon Musk and Donald Trump has sent the price of Dogecoin on a meteoric rise. Following Donald Trump’s endorsement of Elon Musk to lead a new executive department, the valuation of the meme coin has continued to rise. The most important reason for DOGE’s price increase was Elon Musk’s major victory against the SEC. A federal judge denied Musk’s request for sanctions for failing to attend court-ordered testimony. After the big rise, Dogecoin delighted its investors last week with the price rising 3.21%. However, the memecoin still seems to be on track to test its all-time high. Will DOGE set a new record, or will it leave investors waiting for more? The Dogecoin Foundation plans to focus on open source in 2025. The foundation wants to make DOGE a commercial currency. To achieve this goal, it is doubling down on infrastructure development, scalability and decentralization. It is working to make Dogecoin a seamless part of everyday commerce. At the same time, the Dogecoin Foundation is intensifying its efforts to increase mass adoption with its new Dogebox initiative. In another important development, Valour launched its first DOGE ETP. The ETP will be traded on Sweden’s Spotlight Exchange, giving investors access to the world’s largest memecoin. Crypto fund issuer Valour has launched the first exchange-traded product (ETP) for the famous memecoin Dogecoin DOGE $0.3924, Valour’s parent company DeFi Technologies announced on November 26. Valour said the ETP will be traded on Sweden’s Spotlight Exchange and will enable retail and institutional investors to access the world’s largest memecoin by market capitalization in a regulated fund package.
Manufacturing data, hourly earnings, unemployment rate and non-farm payrolls data are among the important data to follow next week. On the other hand, Powell’s speech is among the data to be monitored and is expected to give clues about the upcoming FED interest rate. Data from CME shows that at the time of writing, the probability of a 25 basis point rate cut is 67.1%.
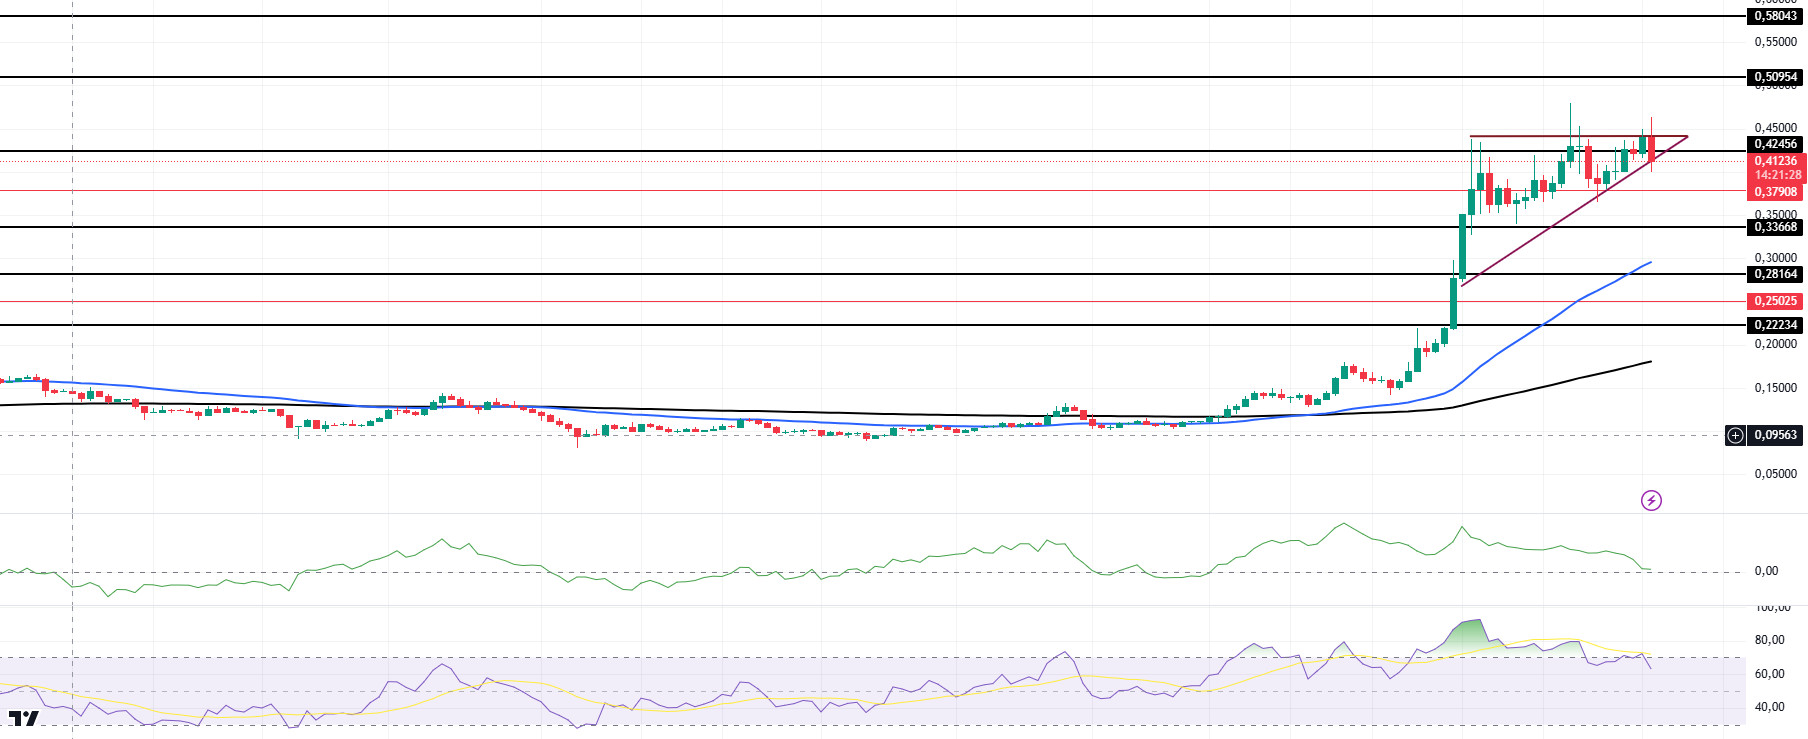
When we look at the daily chart, although the 50 EMA (Blue Line) continues to stay above the 200 EMA (Black Line), the difference between the two averages is 39.13%, increasing the possibility of a pullback. This also shows us that the DOGE coin is bullish. If we look at the liquidity zone of DOGE, there is a liquidation place of approximately 345 million dollars at 0.4103 in the short position. When we look at the Chaikin Money Flow (CMF)20 indicator, money inflows approached the neutral zone. Relative Strength Index (RSI)14 continues to remain in the overbought zone. This may bring profit sales. On the other hand, the ascending triangle pattern should be taken into consideration. If this pattern works, the $1 target may be realized. In case of possible macroeconomic conditions and negative developments in the ecosystem and retracements, 0.33668 can be followed as a strong support. In case of continued rises, 0.50954 should be followed as a strong resistance.
Supports: 0.37908 – 0.33668 – 0.28164
Resistances: 0.42456 – 0.50954 – 0.58043
TRX/USDT
TRX, which started last week at 0.2086, fell about 0.5% during the week and closed the week at 0.2074. This week in the US, manufacturing purchasing managers’ index, ISM manufacturing purchasing managers’ index, job openings and staff turnover rate, ADP non-farm payrolls, services purchasing managers’ index, ISM non-manufacturing purchasing managers’ index, applications for unemployment benefits, unemployment rate and non-farm payrolls data will be announced. These data are important to affect the market and the data to be announced in line with expectations may have a positive impact. In addition, FED chair Powell will give a speech on Wednesday. High volatility can be expected in the market during the speech.
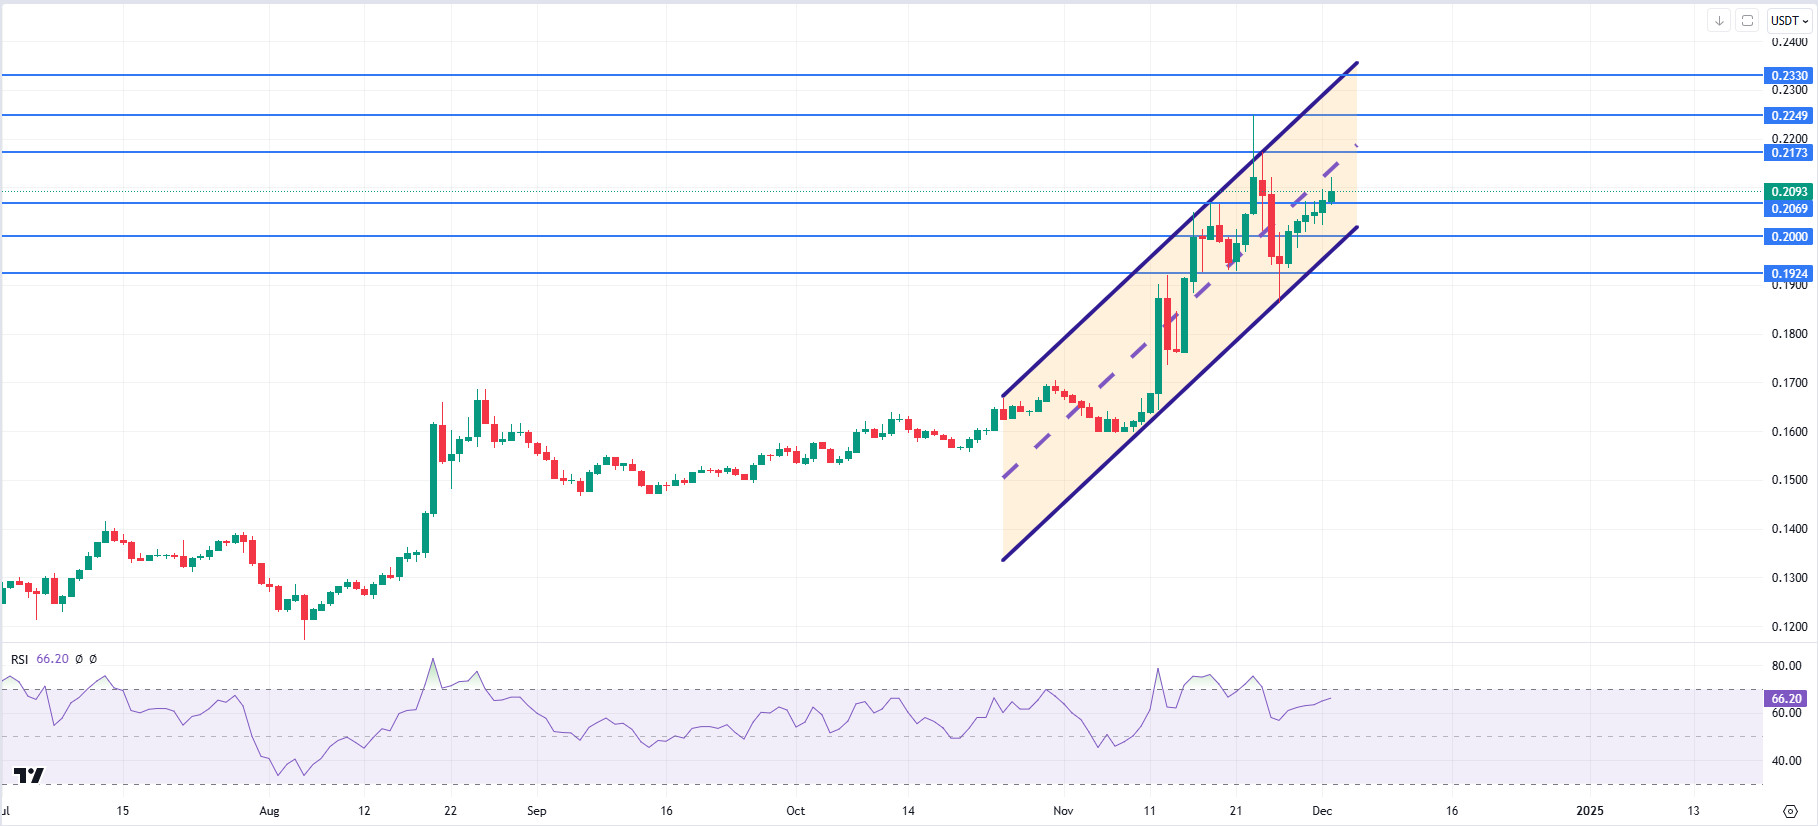
TRX, which is currently trading at 0.2093 and moving within the bullish channel on the daily chart, is in the middle band of the channel. The Relative Strength Index has approached the overbought zone with a value of 66 and can be expected to decline slightly from its current level and move to the lower band of the channel. In such a case, it may test 0.2069 and 0.2000 supports. If it cannot close daily under 0.2069 support, it may rise with the buying reaction that may occur. In such a case, it may want to test 0.2173 resistance. As long as it stays above 0.1924 support on the daily chart, the bullish demand may continue. If this support is broken, selling pressure may increase.
Supports 0.2069 – 0.2000 – 0.1924
Resistances: 0.2173 – 0.2249 – 0.2330
AVAX/USDT
AVAX fell as low as 38.50 last week with the decline seen across the crypto market and then started to rise again with the purchases. With a 7.28% increase in value on a weekly basis, AVAX closed at 45.14 last week. Starting the new week with an increase, AVAX rose to 49.20. The increase in daily trading volume and the number of active addresses in the AVAX network shows that the liquidity and investor interest in the market is increasing.
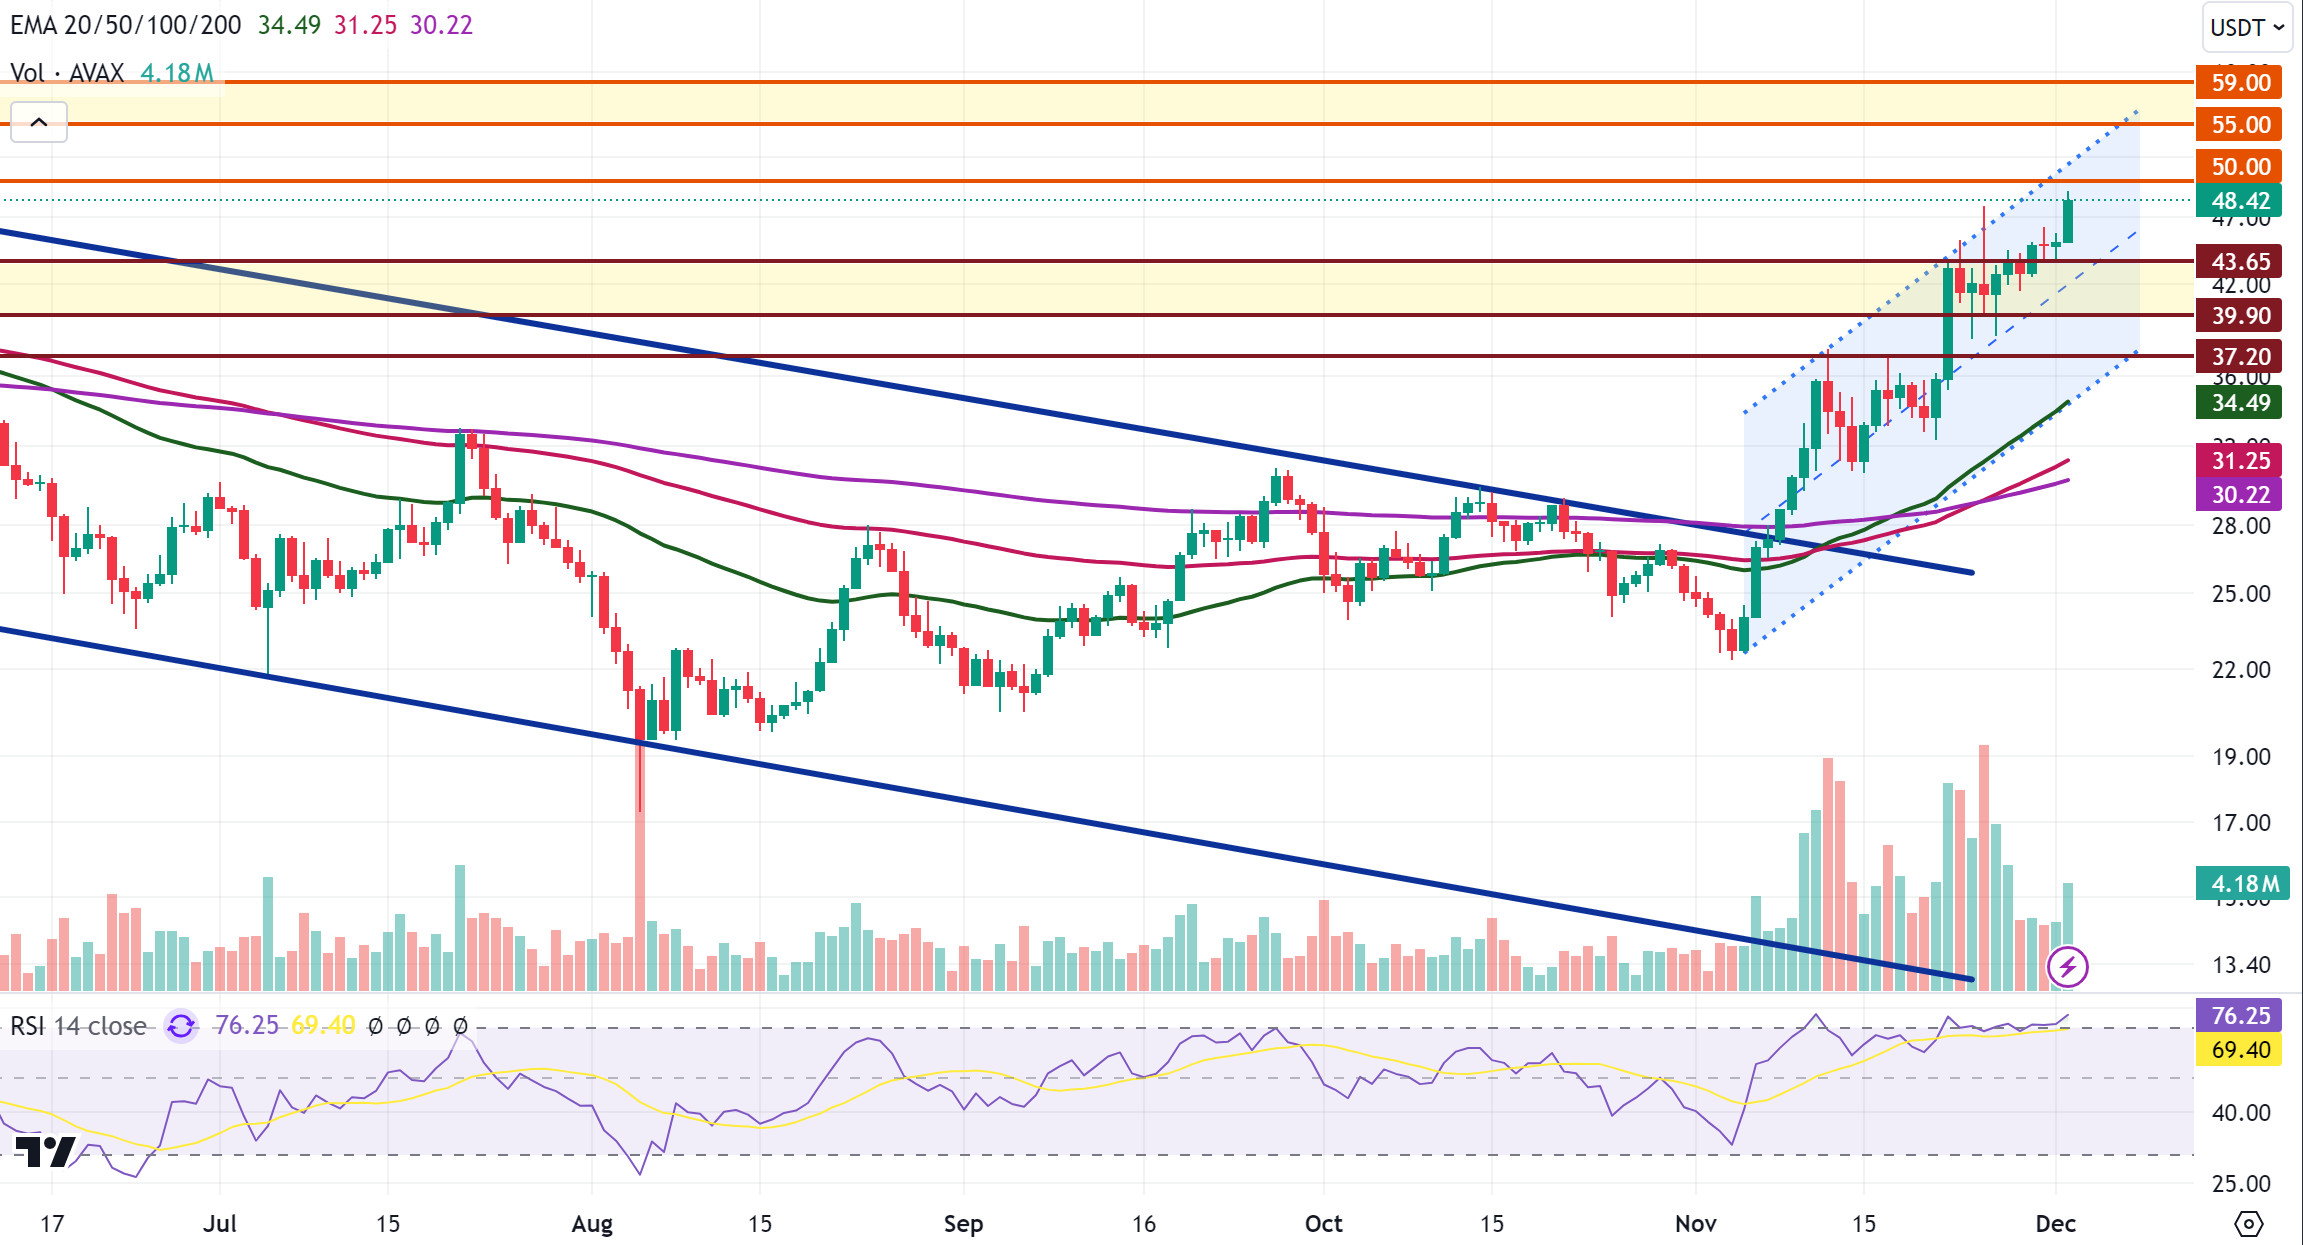
When we examine the daily analysis chart for AVAX, it continues to trade in the bullish channel. Buying pressure continues in AVAX, which continues to trade above the exponential moving average (EMA) levels. It may test the 50.00 resistance level on its rise. If it breaks the resistance level in question, the 55.00 level stands out as the main resistance level in the weekly analysis in the continuation of the rise, and if it is broken, a rapid rise can be seen as the psychological resistance level will be exceeded. The Relative Strength Index (RSI) value is at 76 and is currently in the overbought zone, which means that it may correct and may test the support level of 43.65 in case of a decline. If this support level is broken and the decline continues, the 39.90 support level stands out in the weekly analysis. If this support level is broken, the decline may deepen with the increase in selling pressure.
Supports 43.65 – 39.90 – 37.20
Resistances 50.00 – 55.00 – 59.00
SHIB/USDT
Shiba Inu removed more than 2 billion tokens from circulation last week with a burn rate of 7.418%, reducing supply and strengthening expectations for a price increase. Furthermore, Shibarium’s hard fork next week aims to boost network performance and transaction speed. These developments could support SHIB’s value and contribute to the long-term growth of the ecosystem.
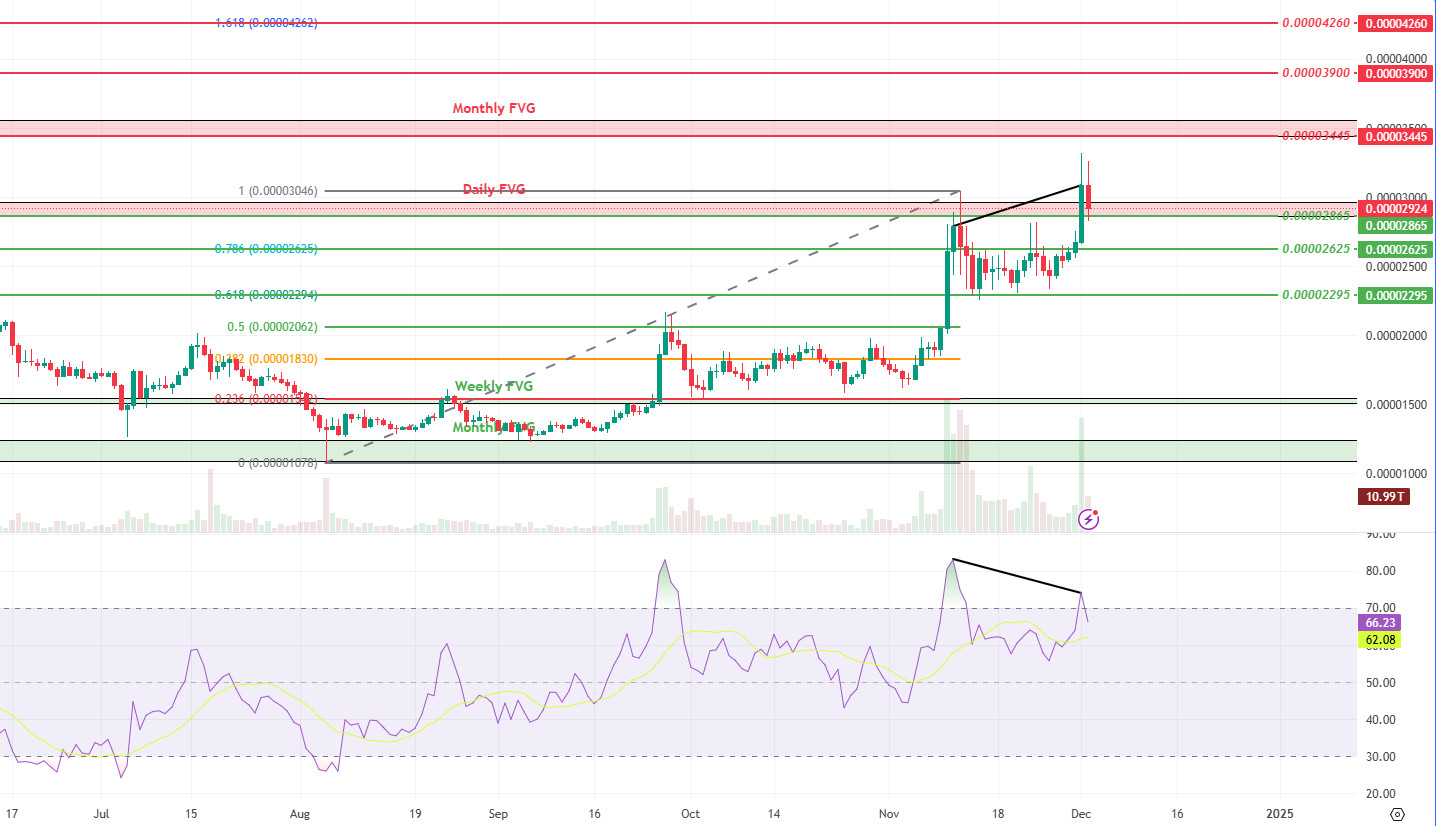
Technically, Shiba Inu price closed above the Daily Fair Value Gap (FVG) level, but negative divergence (Black Line) is noticeable on the RSI oscillator. If the price closes below the 0.00002865 support, there may be a retracement to 0.00002625 levels. On the other hand, if the price holds above 0.00002865, the uptrend may continue towards 0.00003445, the Monthly FVG level, and then towards 0.00004260, the Fibonacci 1.618 level.
Supports 0.00002865 – 0.00002625 – 0.00002295
Resistances 0.00003445 – 0.00003900 – 0.00004260
LINK/USDT
Last week’s collaboration between Chainlink and Optimism to make blockchain technology faster, more secure and cost-effective has created excitement in the LINK community. Chainlink and Optimism aim to contribute to the growth of the blockchain ecosystem with this cooperation. In particular, we can say that closing the gap between Web2 and Web3 and providing developers with more powerful tools are among the main goals of this cooperation.
The current state of the market is “Greed”, meaning investors’ appetite is quite high. The decline in Bitcoin’s dominance and the activity in altcoins is increasing the appetite day by day, which strengthens the expectations that prices will gain upward momentum.
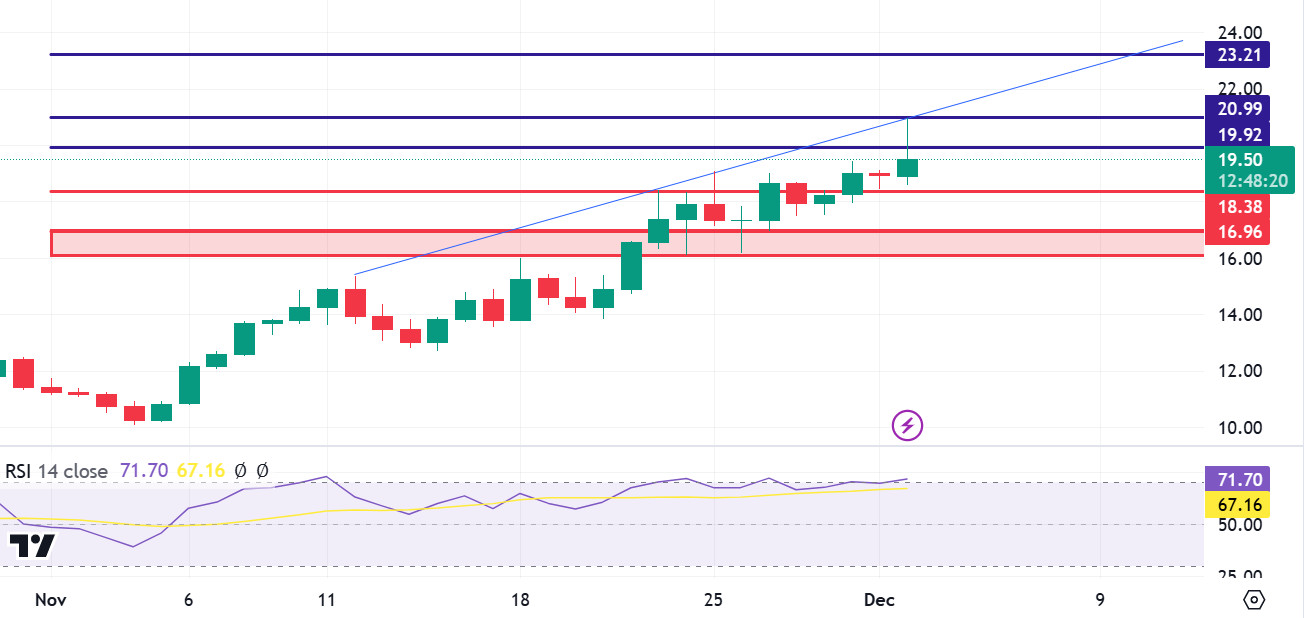
Technically, the fact that we have seen a positive close at 16.15 for 2 consecutive days shows us that this region has become a strong support level. In the short-term rising trend formation, the price’s rejection at the 20.99 level and increased selling pressure may cause the price to fall back to the 16.96 region. The fact that the Relative Strength Index (RSI) indicator is in the overbought zone strengthens the possibility of price retracement. In the upward movement, a voluminous breakout of the resistance at 20.99 will trigger a new movement up to the $ 23.21 level.
Supports 18.38-16.36-16.00
Resistances 19.92-20.99-23.21
LTC/USDT
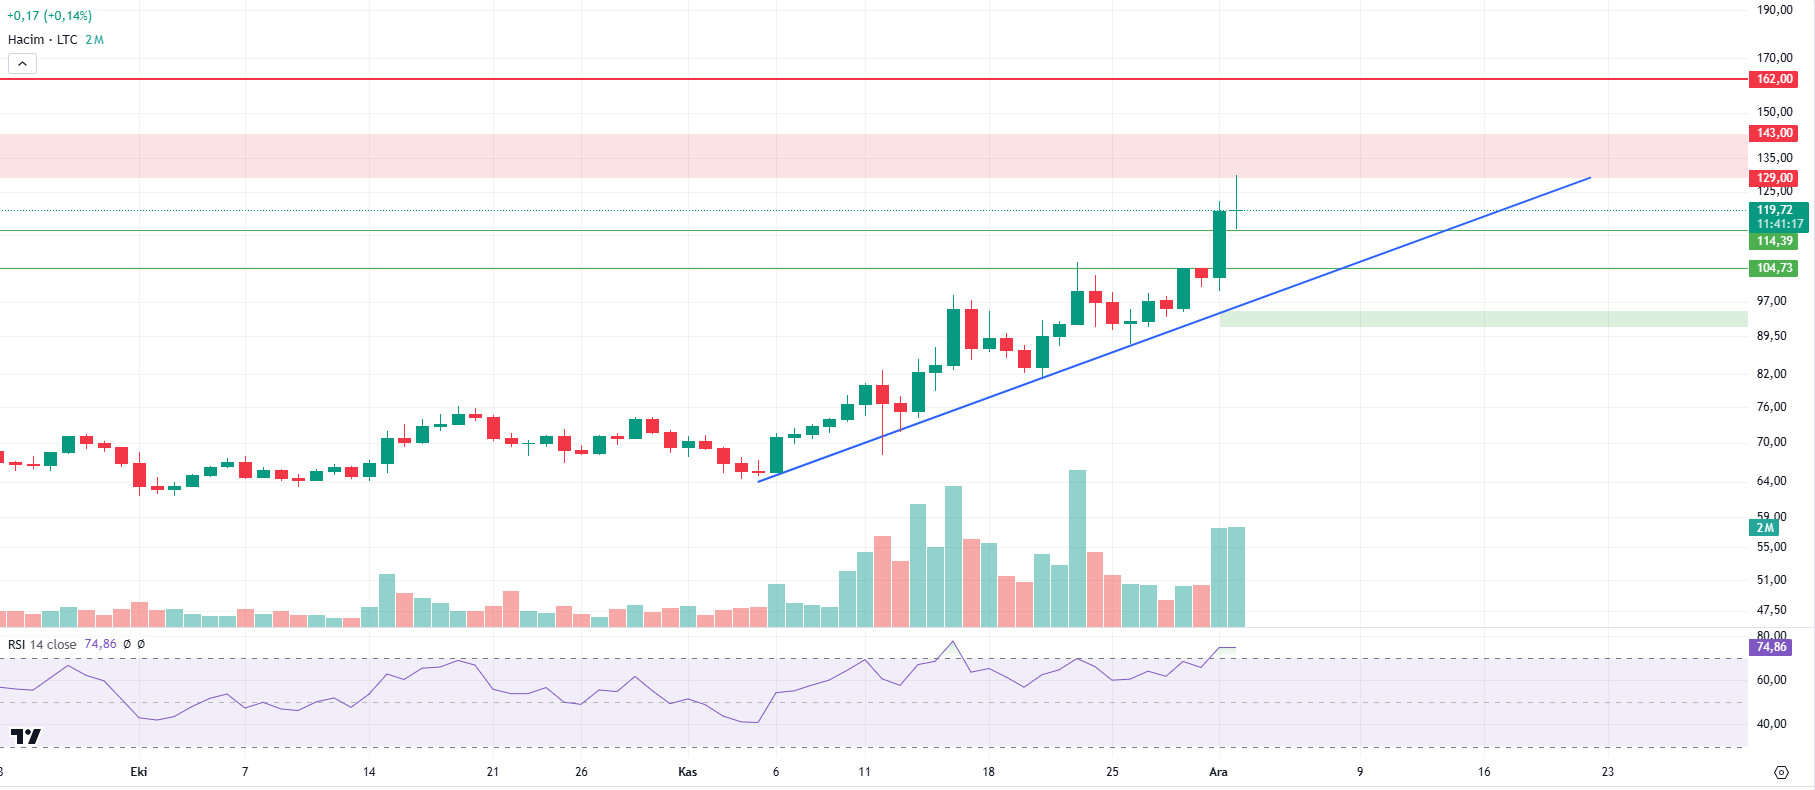
In line with the general uptrend in the crypto market, Litecoin is showing a positive outlook. It ended its 4th week on a positive streak with a 23.35% rise, and the prospects of increased net inflows and potential positive news, such as the approval of Canary Capital’s Litecoin ETF, strengthen the bullish outlook for LTC. According to the technical analysis on the daily chart, Litecoin is seen trying to hold on to the intermediate support at 114.39. In case this support is broken, the next intermediate support to follow is at 104.73. The uptrend (blue line) can be considered as major support. However, in case of unfavorable market conditions, there is a possibility that LTC may retest the monthly pivot zone (green area). The RSI (Relative Strength Index) is in overbought territory, which supports the possibility of a possible correction. On the other hand, if there is a continuation of the previous weeks, the first selling pressure on the rise may occur between 129.00 and 143.00 levels. If the pressure is overcome, the 162.00 level may constitute an important resistance.
Resistances 129.00 – 143.00 -162.00
Supports 114.39 – 104.73 – 95.00
LEGAL NOTICE
The investment information, comments and recommendations contained in this document do not constitute investment advisory services. Investment advisory services are provided by authorized institutions on a personal basis, taking into account the risk and return preferences of individuals. The comments and recommendations contained in this document are of a general type. These recommendations may not be suitable for your financial situation and risk and return preferences. Therefore, making an investment decision based solely on the information contained in this document may not result in results that are in line with your expectations.


