
BTC/USDT
We left behind a week of high volatility in the crypto market. As US President D. Trump’s cabinet preparations continued, the use of the $ 200 billion Foreign Exchange Stabilization Fund within the scope of strategic reserve plans for Bitcoin came to the agenda. In the middle of the week, the FED cut interest rates by 25 basis points in line with expectations. However, Powell’s hawkish messages after the meeting caused a decline in the Bitcoin price. During this pullback, institutional companies, especially MicroStrategy, continued to buy Bitcoin. On the other hand, El Salvador, which uses Bitcoin as its official currency, amended its Bitcoin plan as a result of an agreement with the IMF and removed the mandatory use requirement.
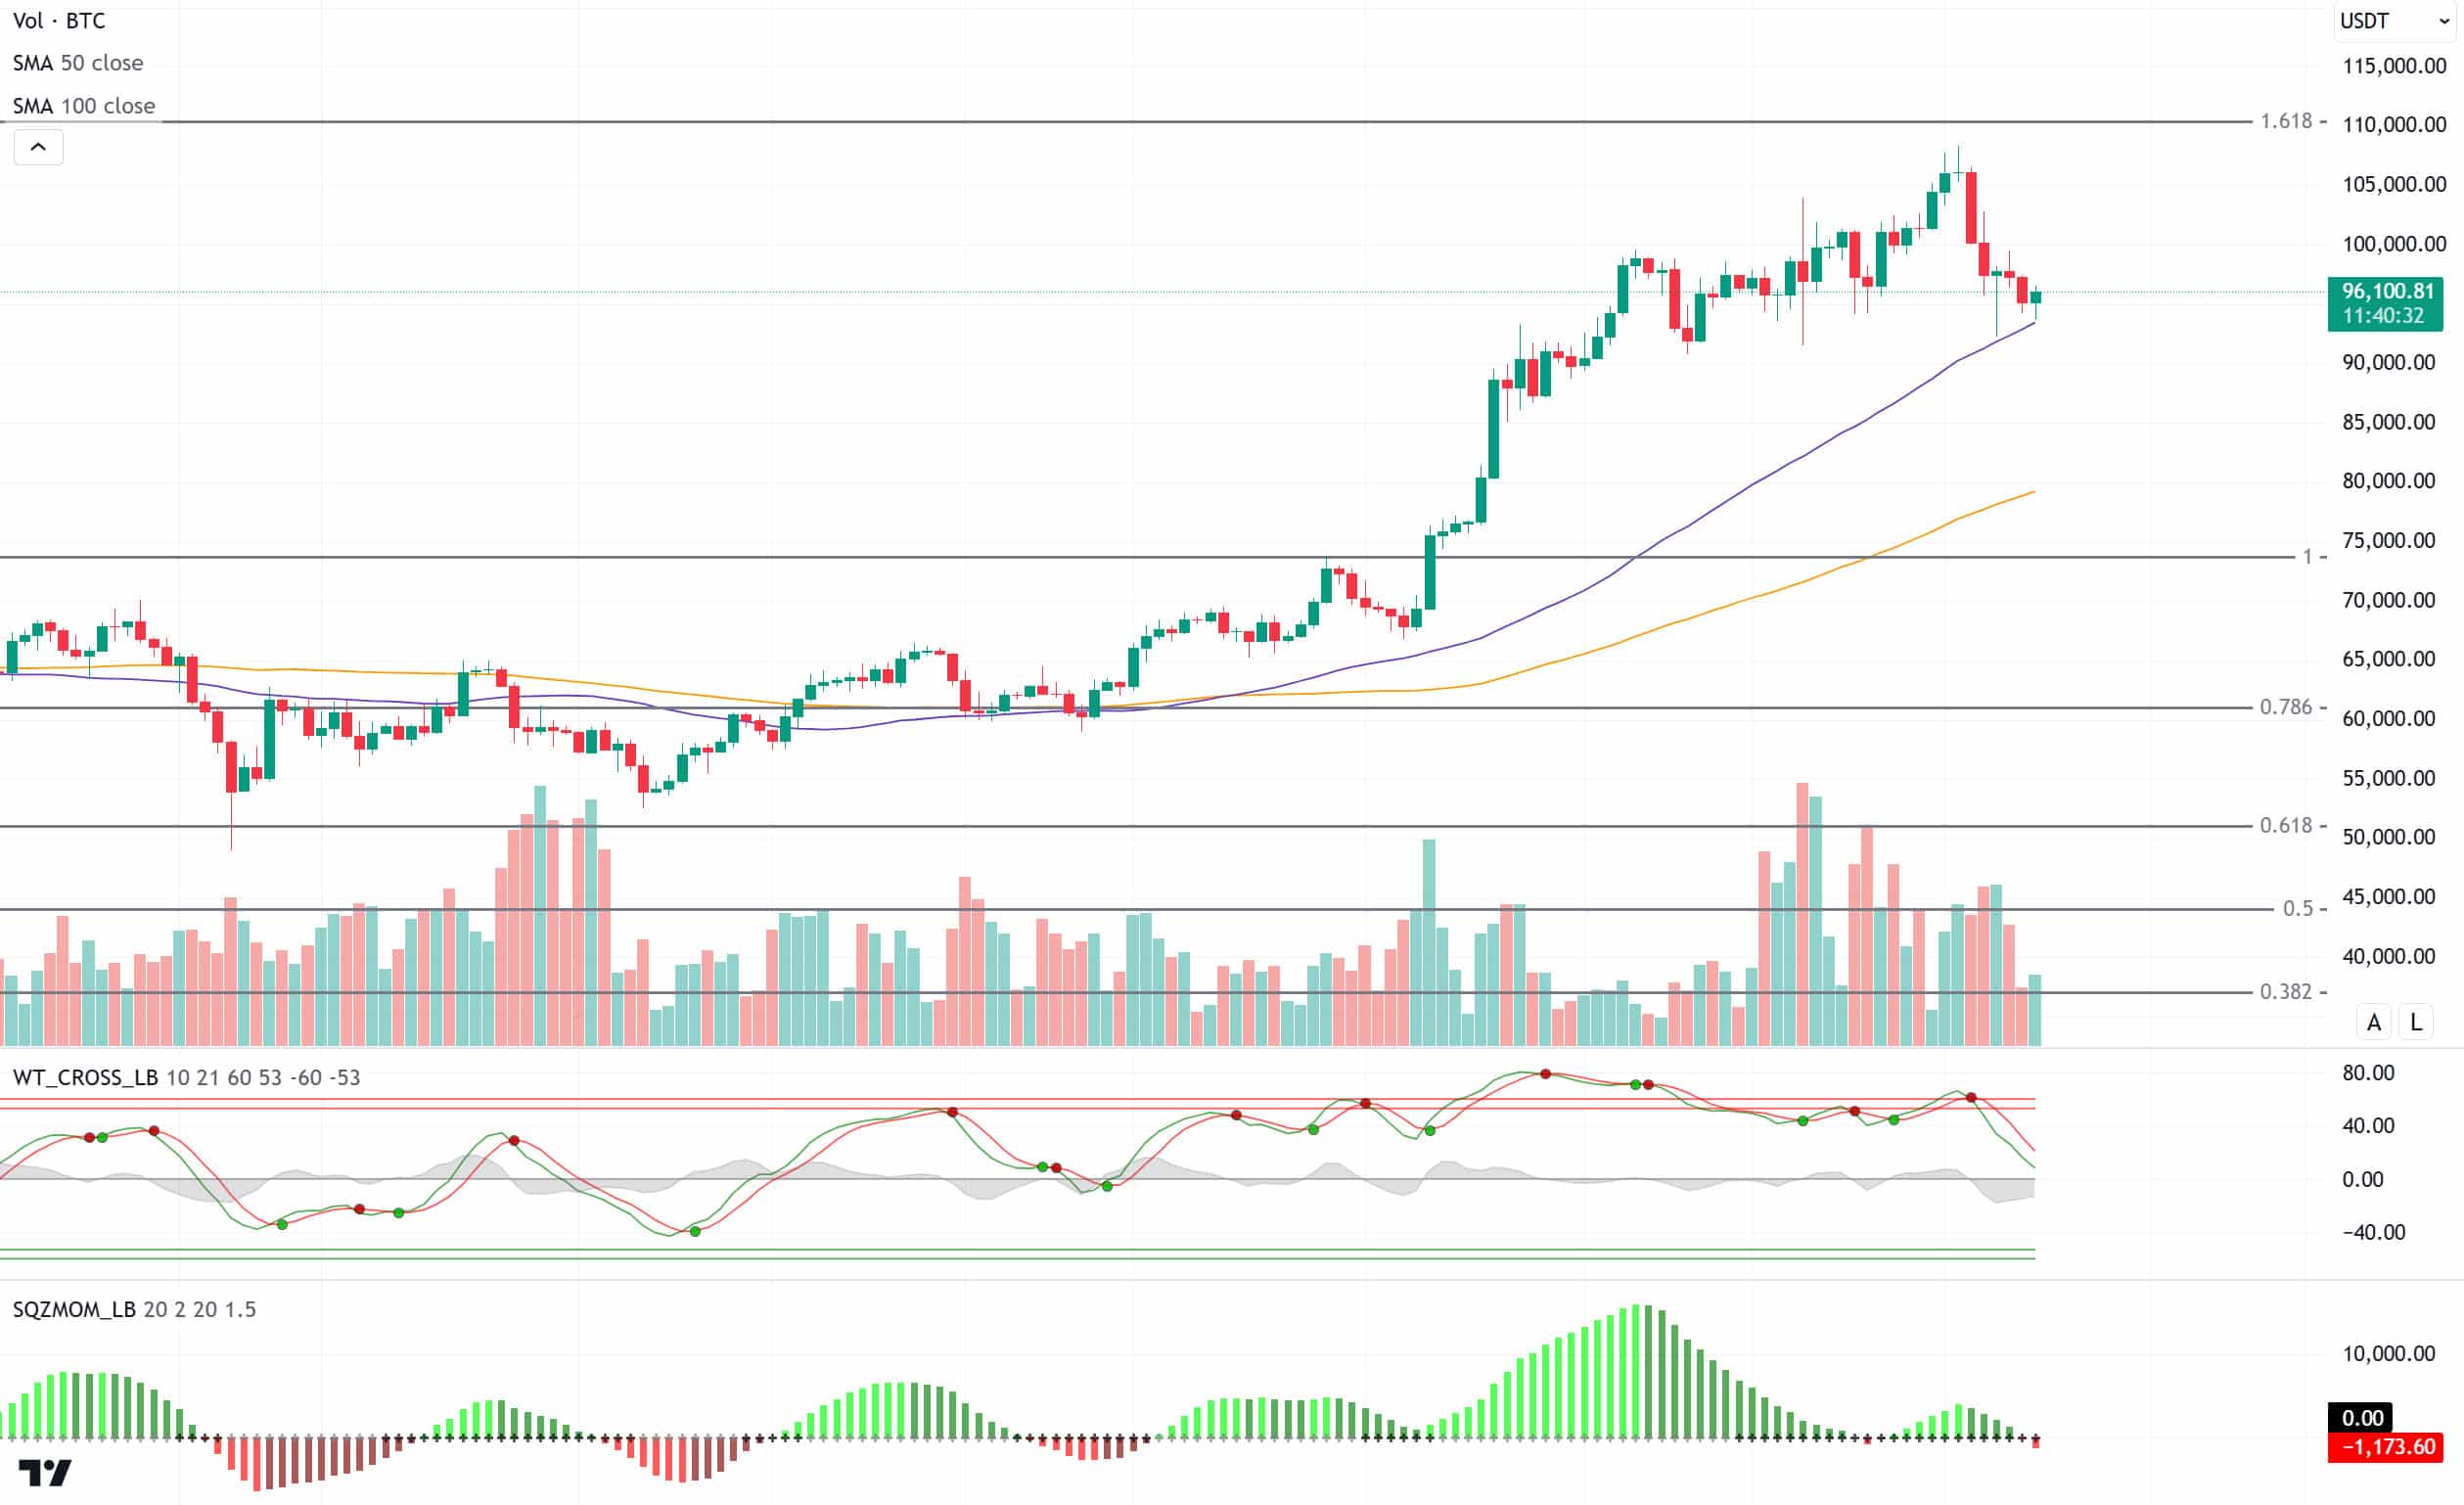
When we look at the long-term technical outlook with all these developments, BTC, which increased its ATH level to 108,000, lost 8.23% on a weekly basis. BTC, which consolidated between the 95,000 and 100,000 band for a long time, could not stay in the uptrend it started and fell back to this band range. BTC, which is currently trading at 96,000, turned its direction down in line with the sell signal given by the technical oscillators on the daily chart after a long break. When we look at the momentum indicator, the positive series that started at the 60,000 level has turned negative. Contrary to technical indicators, the price touching the SMA 50-day line turned its direction upwards, once again revealing the impact of fundamental dynamics on the price. While the ATH level is targeted in the medium term in the continuation of the rise, we will follow the SMA 50 line at 93,000 in a possible new wave of sales.
Supports 95,000 – 93,000 – 90,000
Resistances 99,100 – 101,000 – 105,000
ETH/USDT
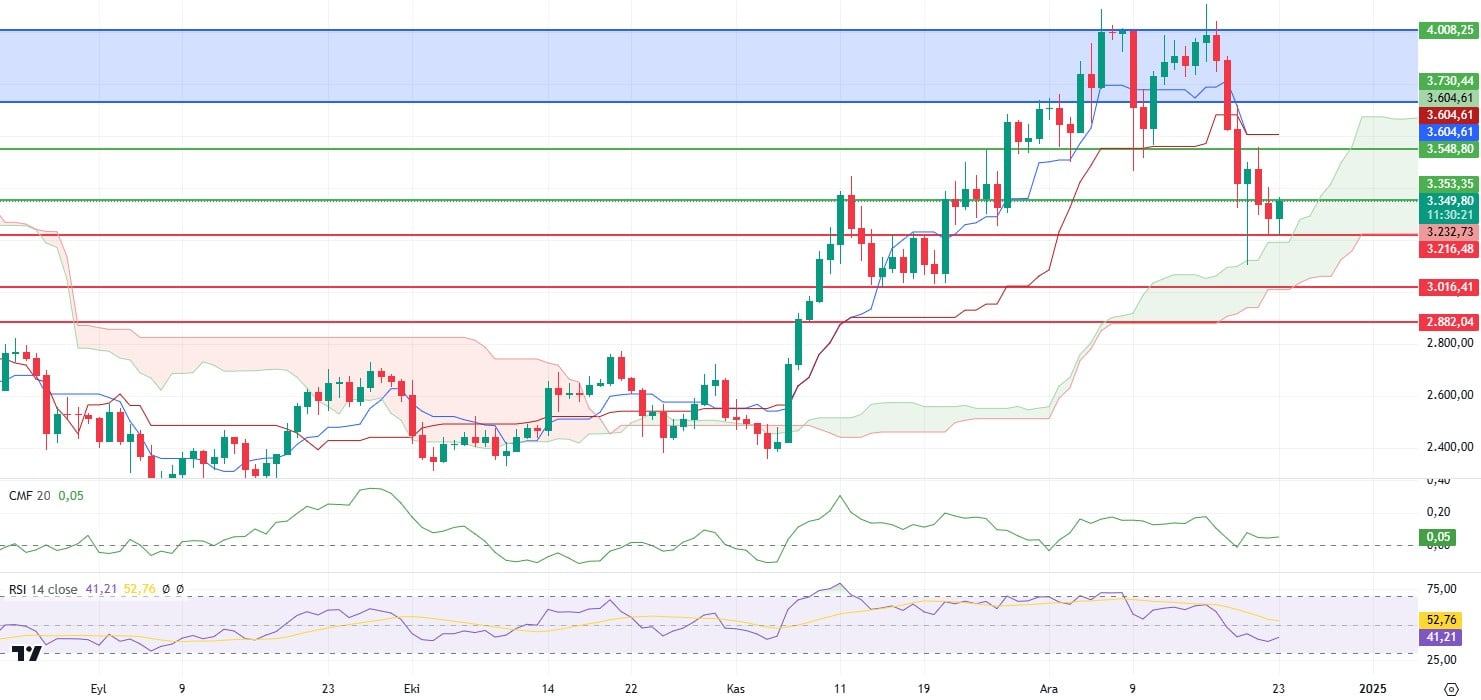
Ethereum plummeted from the $4,000 level after last week’s FED meeting, following remarks by Chairman Jerome Powell. The loss of this level, highlighted by the blue region on the chart, caused the price to fall to the Kumo cloud level on the daily timeframe. ETH sales by the Ethereum Foundation before this decline were also an important catalyst that triggered this movement.
However, the lack of any decline in protocols and the amount of ETH staked on Beacon Chain continues to support bullish potential for the Ethereum price in the medium to long term. Although ETH trading volume decreased significantly during the downturn, the increase in on-chain activity is noteworthy. In particular, following the tokenization of the Pudgy Penguins NFT collection, there was a significant increase in demand for other OG collections on the network. In addition, the increasing amount of ETH staked on Eigen Layer shows that there is continued confidence in the network’s security and usability.
When we analyze Ethereum’s price movements from a technical perspective, it is seen that it received support from the Kumo cloud during the decline. In addition, the equalization of Tenkan and Kijun levels indicates that the market has entered a period of indecision. The Relative Strength Index (RSI) indicator is trending slightly upwards with positive divergences. This supports the possibility of a price rebound. Chaikin Money Flow (CMF) is trending sideways in the positive territory. At the same time, the double bottom formation on CMF is also contributing positively to the market outlook.
For the Ethereum price, holding above 3,353 in the short term could increase the potential for the price to rise as high as 3,548. Exceeding this level will ensure that the bearish movement is defined as a correction and will show that buyers have regained control in the market. On the other hand, the 3.216 level stands out as an important support area in terms of downside risks. In case this level is broken, the bearish movement can be expected to deepen and the price can be expected to test lower levels.
Supports 3,216 – 3,016 – 2,882
Resistances 3,353 – 3,548 – 3,730
XRP/USDT
Ripple (XRP) has recently enjoyed a remarkable upward momentum thanks to the expansion of innovative use cases supported by strategic partnerships. Collaborations with organizations such as UK-based Archax and Mercy Corps Ventures to increase the potential of XRP Ledger in areas such as tokenized finance and financial inclusion were among the key factors that triggered this rise. However, XRP’s bullish momentum waned and turned into a sideways price movement due to the pullback in Bitcoin.
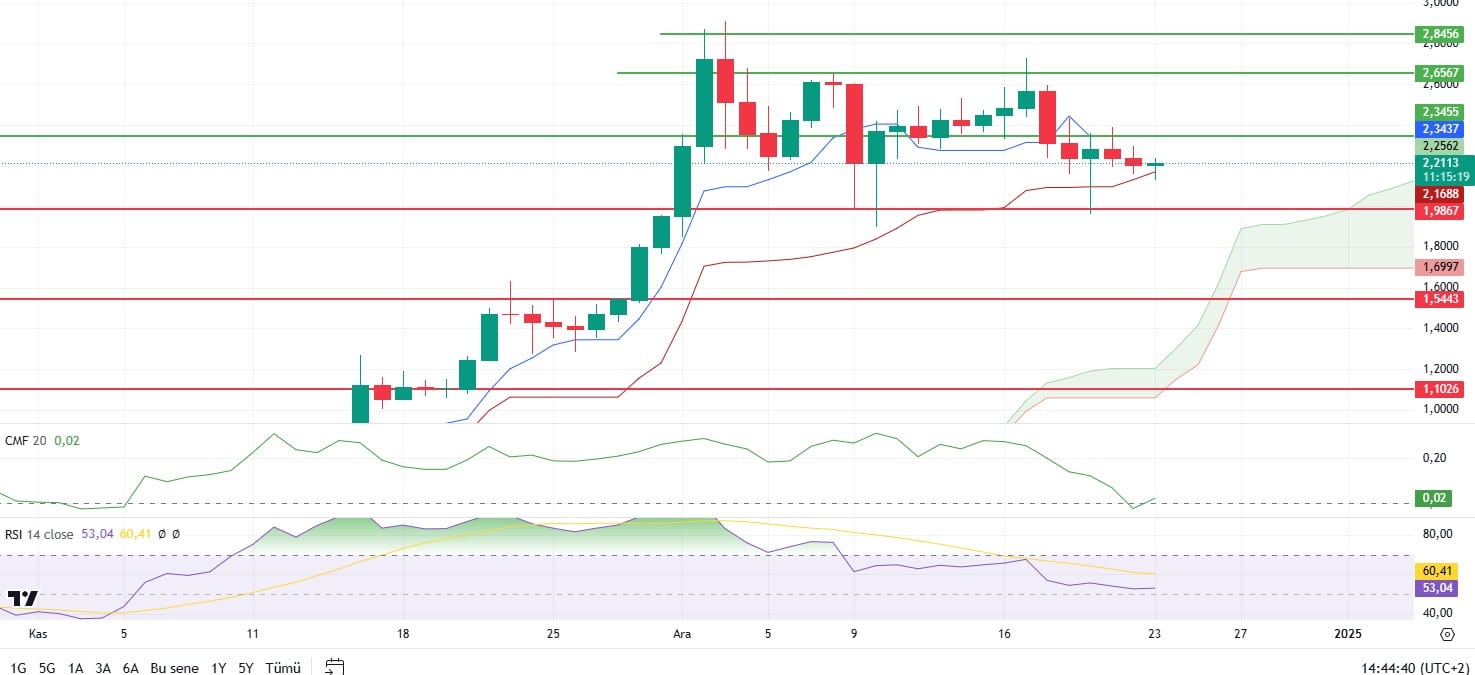
Technically, the price has pinned the 1.98 level twice and tested this level as a strong support and resistance area. The Chaikin Money Flow (CMF) indicator shifted from negative to positive territory, signaling a resurgence of buyer appetite across the market and supporting a positive outlook. It is also observed that the price often takes support from the Kijun level on pullbacks and this level has not yet been lost. This suggests that XRP’s technical structure remains strong.
According to the available data, if the price maintains the 1.98 level, it may allow a new upward movement to begin in the coming days. In this scenario, especially exceeding the 2.34 level may strengthen the upside momentum. However, in case of a persistence below the 1.98 level, the decline could be expected to deepen and the price could test lower support areas. For traders following XRP price action, the dynamics between 1.98 and 2.34 are of critical importance.
Supports 1.9867 – 1.5443 – 1.1026
Resistances 2.3455 – 2.6567 – 2.8456
SOL/USDT
Cryptocurrency markets plunged after Powell’s hawkish statements. After the Fed’s announcement yesterday, the interest rate was cut by 25 basis points. According to data from CME, the probability of a 25 basis point rate cut is 8.6% as of the time of writing.
In the Solana ecosystem last week, the UK FCA flagged Retardio Solana for unlicensed operation. Pump Fun was also followed by the regulator in the same way as the related call. The regulator said Retardio Solana was promoting and providing financial services or products without authorization. Bitwise launched a Solana Staking ETP (BSOL) in Europe. This new product is designed to address the previous lack of staking rewards of Bitwise’s Solana ETP, ESOL.
On Oncahin, BNSOL, the SOL liquid staking token of a centralized exchange, reached $1 billion TVL in three months. 4.8 million SOL staked. BNSOL accounted for more than 10% of Solana’s $9 billion liquid staking market. On the other hand, research platform Syndica reported that Solana-based DApps generated $365 million in revenue in November. According to the data, Pump.fun became the first Solana DApp to exceed $100 million in monthly revenue. The daily transaction volume on the Solana network is over 66.9 million, the highest among all blockchain ecosystems. At the same time, transaction volume has increased recently. The coin’s trading volume increased by 160% in the past week, while the coin’s supply in general circulation increased by 0.19% to over 479.26 million.
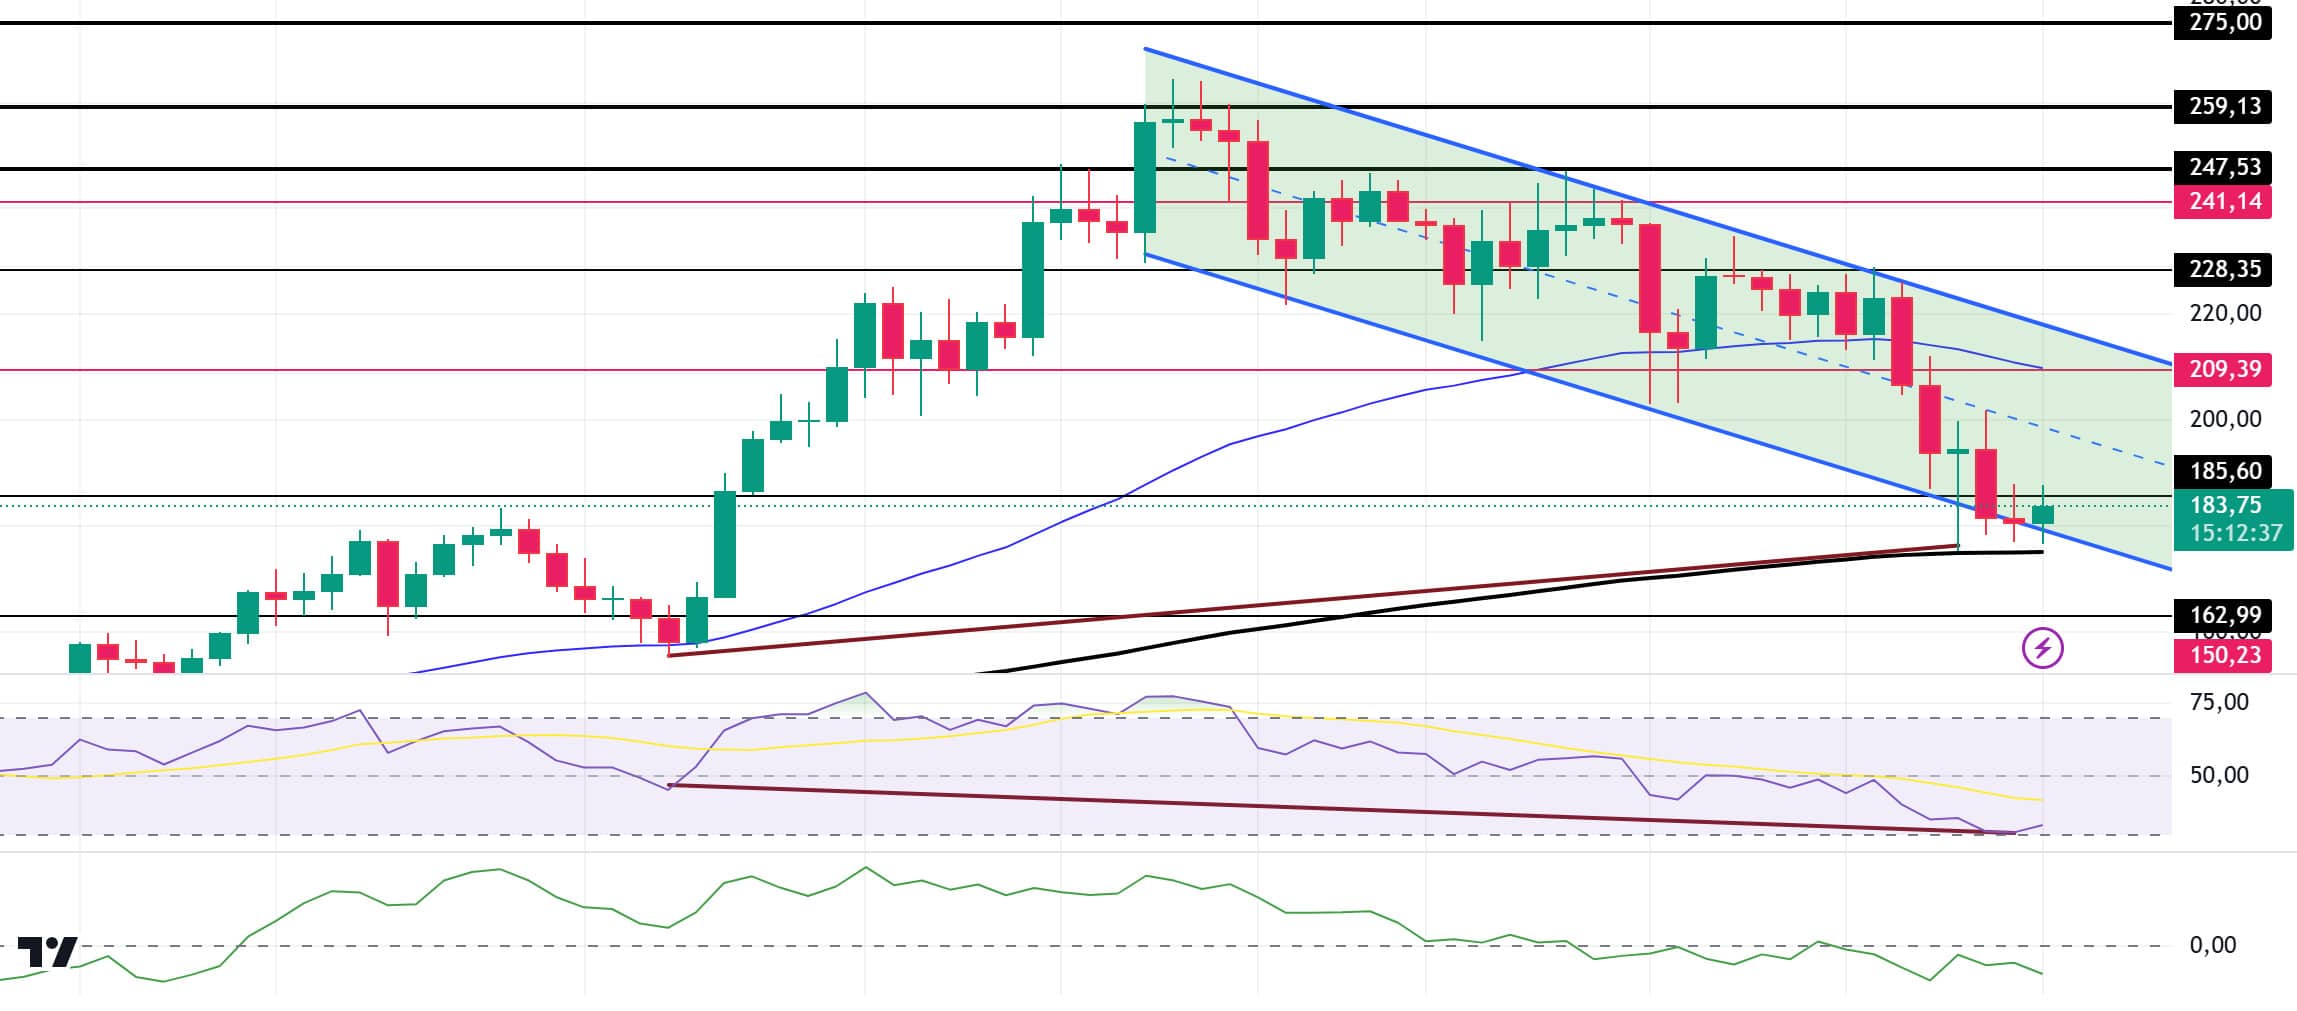
When we look technically, although it tested the strong resistance 228.35 resistance 3 times, it could not break it and the decline deepened. Thus, the asset, which has been in a downtrend since November 22, received support from the 200 EMA moving average and started pricing at the support point of the downtrend. These two supports identify this as a very strong support. On our daily chart, the 50 EMA (Blue Line) continues to be above the 200 EMA (Black Line). This shows us that the trend is bullish. The Relative Strength Index (RSI) is hovering at 14 overbought. At the same time, there is a bullish mismatch on the RSI and the chart. This could push the price higher. However, when we examine the Chaikin Money Flow (CMF)20 indicator, we see that there is money outflow. If the positive results in macroeconomic data and positive developments in the ecosystem continue, it may test first major resistance level 228.35. In case of negative macroeconomic data or negative news in the Solana ecosystem, the 162.99 level can be followed and a buy point can be determined
Supports 162.99 – 150.23 – 141.80
Resistances 185.60 – 209.39 – 228.35
DOGE/USDT
Cryptocurrency markets plunged after Powell’s hawkish statements. After the Fed’s announcement yesterday, the interest rate was cut by 25 basis points. According to data from CME, the probability of a 25 basis point rate cut is 8.6% as of the time of writing.
In the ecosystem, data from IntoTheBlock reflected a gradual increase in DOGE’s massive trading volume, rising from $6.1 billion to $23.3 billion. 4.9 billion DOGE was withdrawn from a centralized exchange to an unknown wallet. This shows that demand from whales is increasing. This could increase the DOGE price. On the other hand, as Dogecoin consolidates, bullish catalysts continue to form in the background. However, DOGE futures funding rates are currently at fairly low levels, suggesting that the speculative excess that has accumulated in recent weeks has largely disappeared, reducing short-term sell-off risks. Recent metrics reveal increased on-chain activity, with increased trading volumes as well as the re-emergence of dormant tokens.
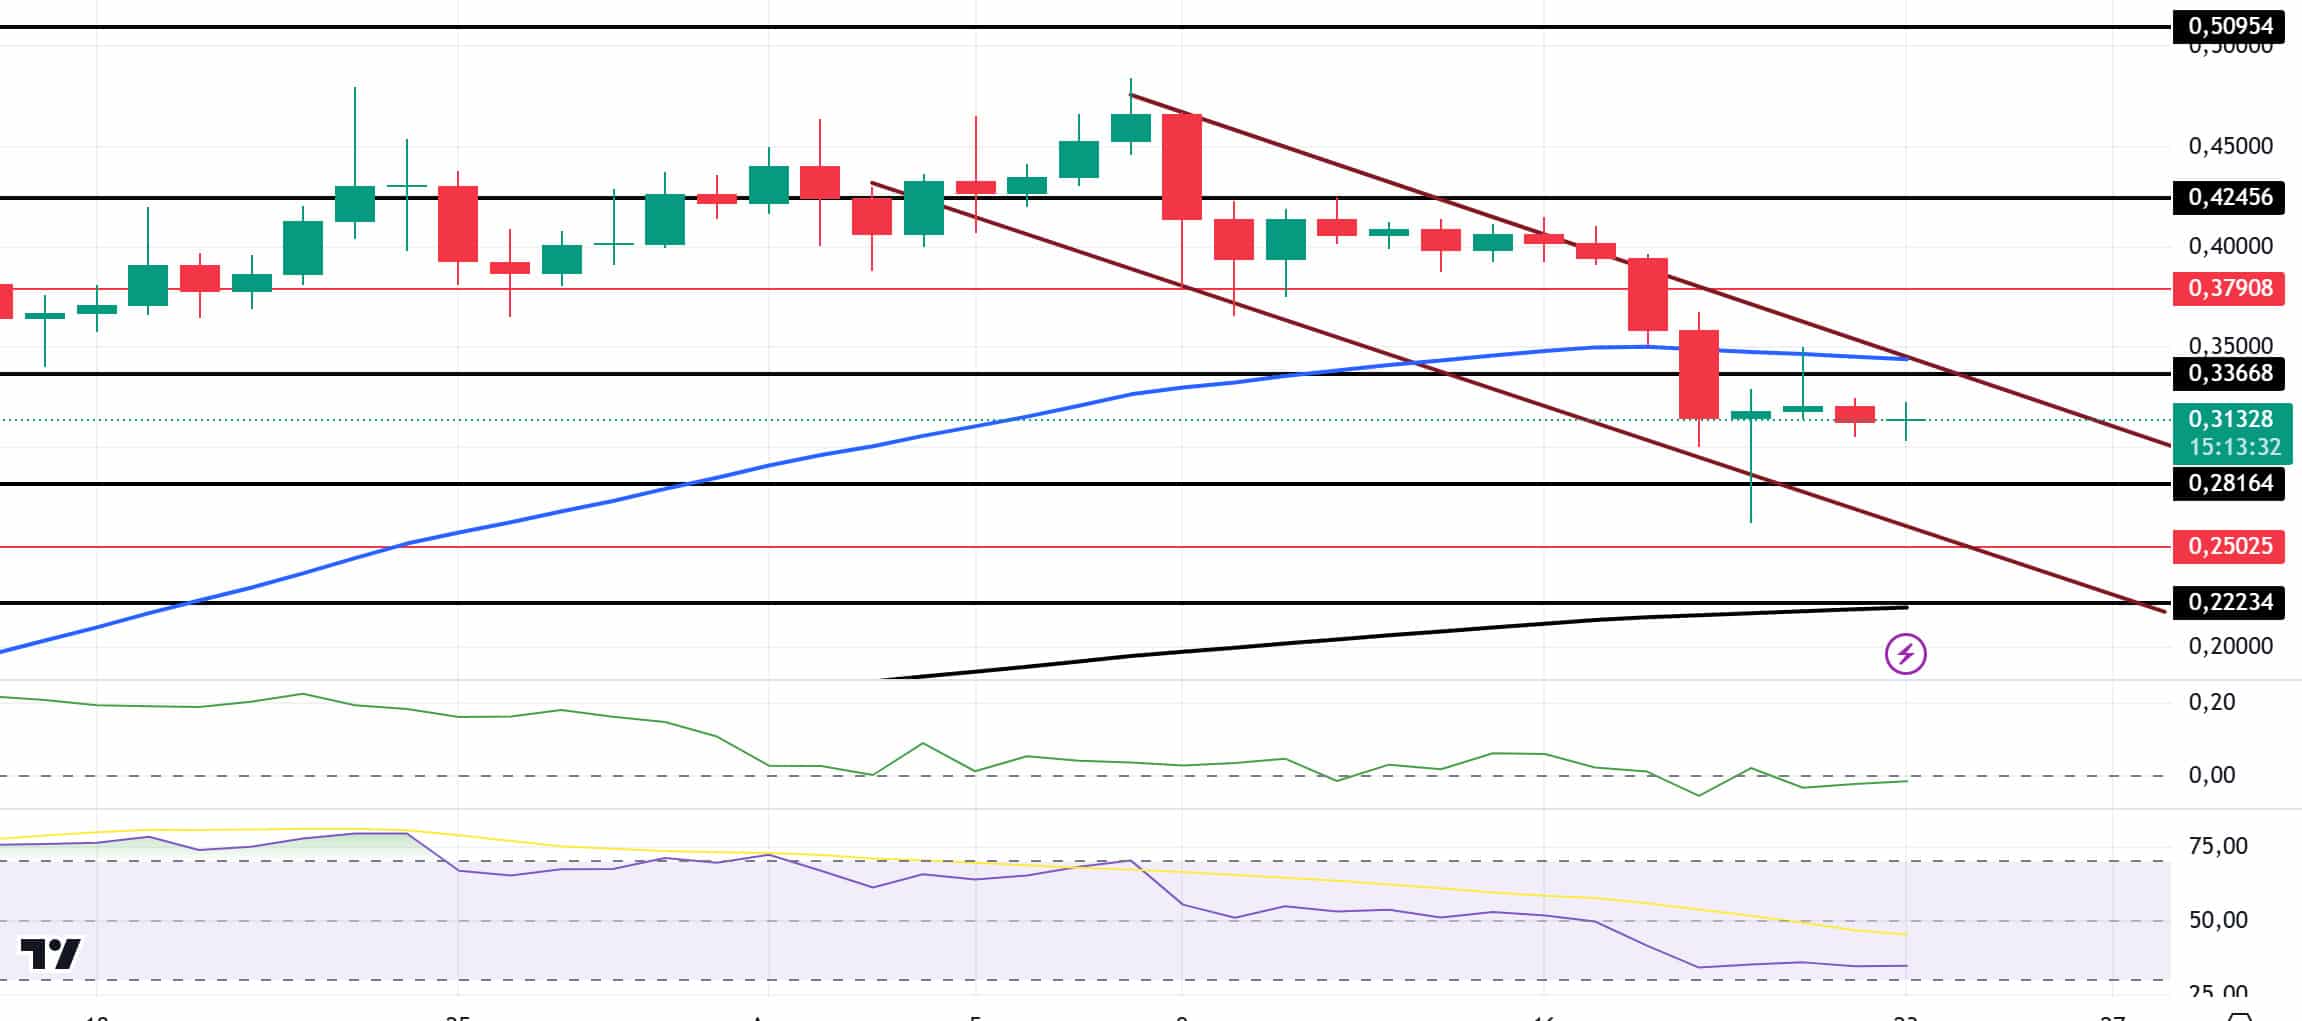
Looking at the daily chart, the 50 EMA (Blue Line) remains above the 200 EMA (Black Line), indicating that the bull continues for the asset, but the difference between the two averages is 58.36%, increasing the possibility that the decline may continue. Also on our daily chart, the asset has been pricing at the mid-level of the downtrend since December 22. When we look at the Chaikin Money Flow (CMF)20 indicator, money inflows have moved from negative to near neutral territory. Relative Strength Index (RSI)14, on the other hand, was in oversold territory. Although this indicates that the price may go up, it seems to have reduced the inflation by creating an accumulation here. In case of possible negative developments in macroeconomic conditions and ecosystem and pullbacks, 0.28164 can be followed as a strong support. In case of a continuation of the rises, 0.42456 should be followed as a strong resistance.
Supports: 0.28164 – 0.25025 – 0.22234
Resistances: 0.33668 – 0.37908 – 0.42456
TRX/USDT
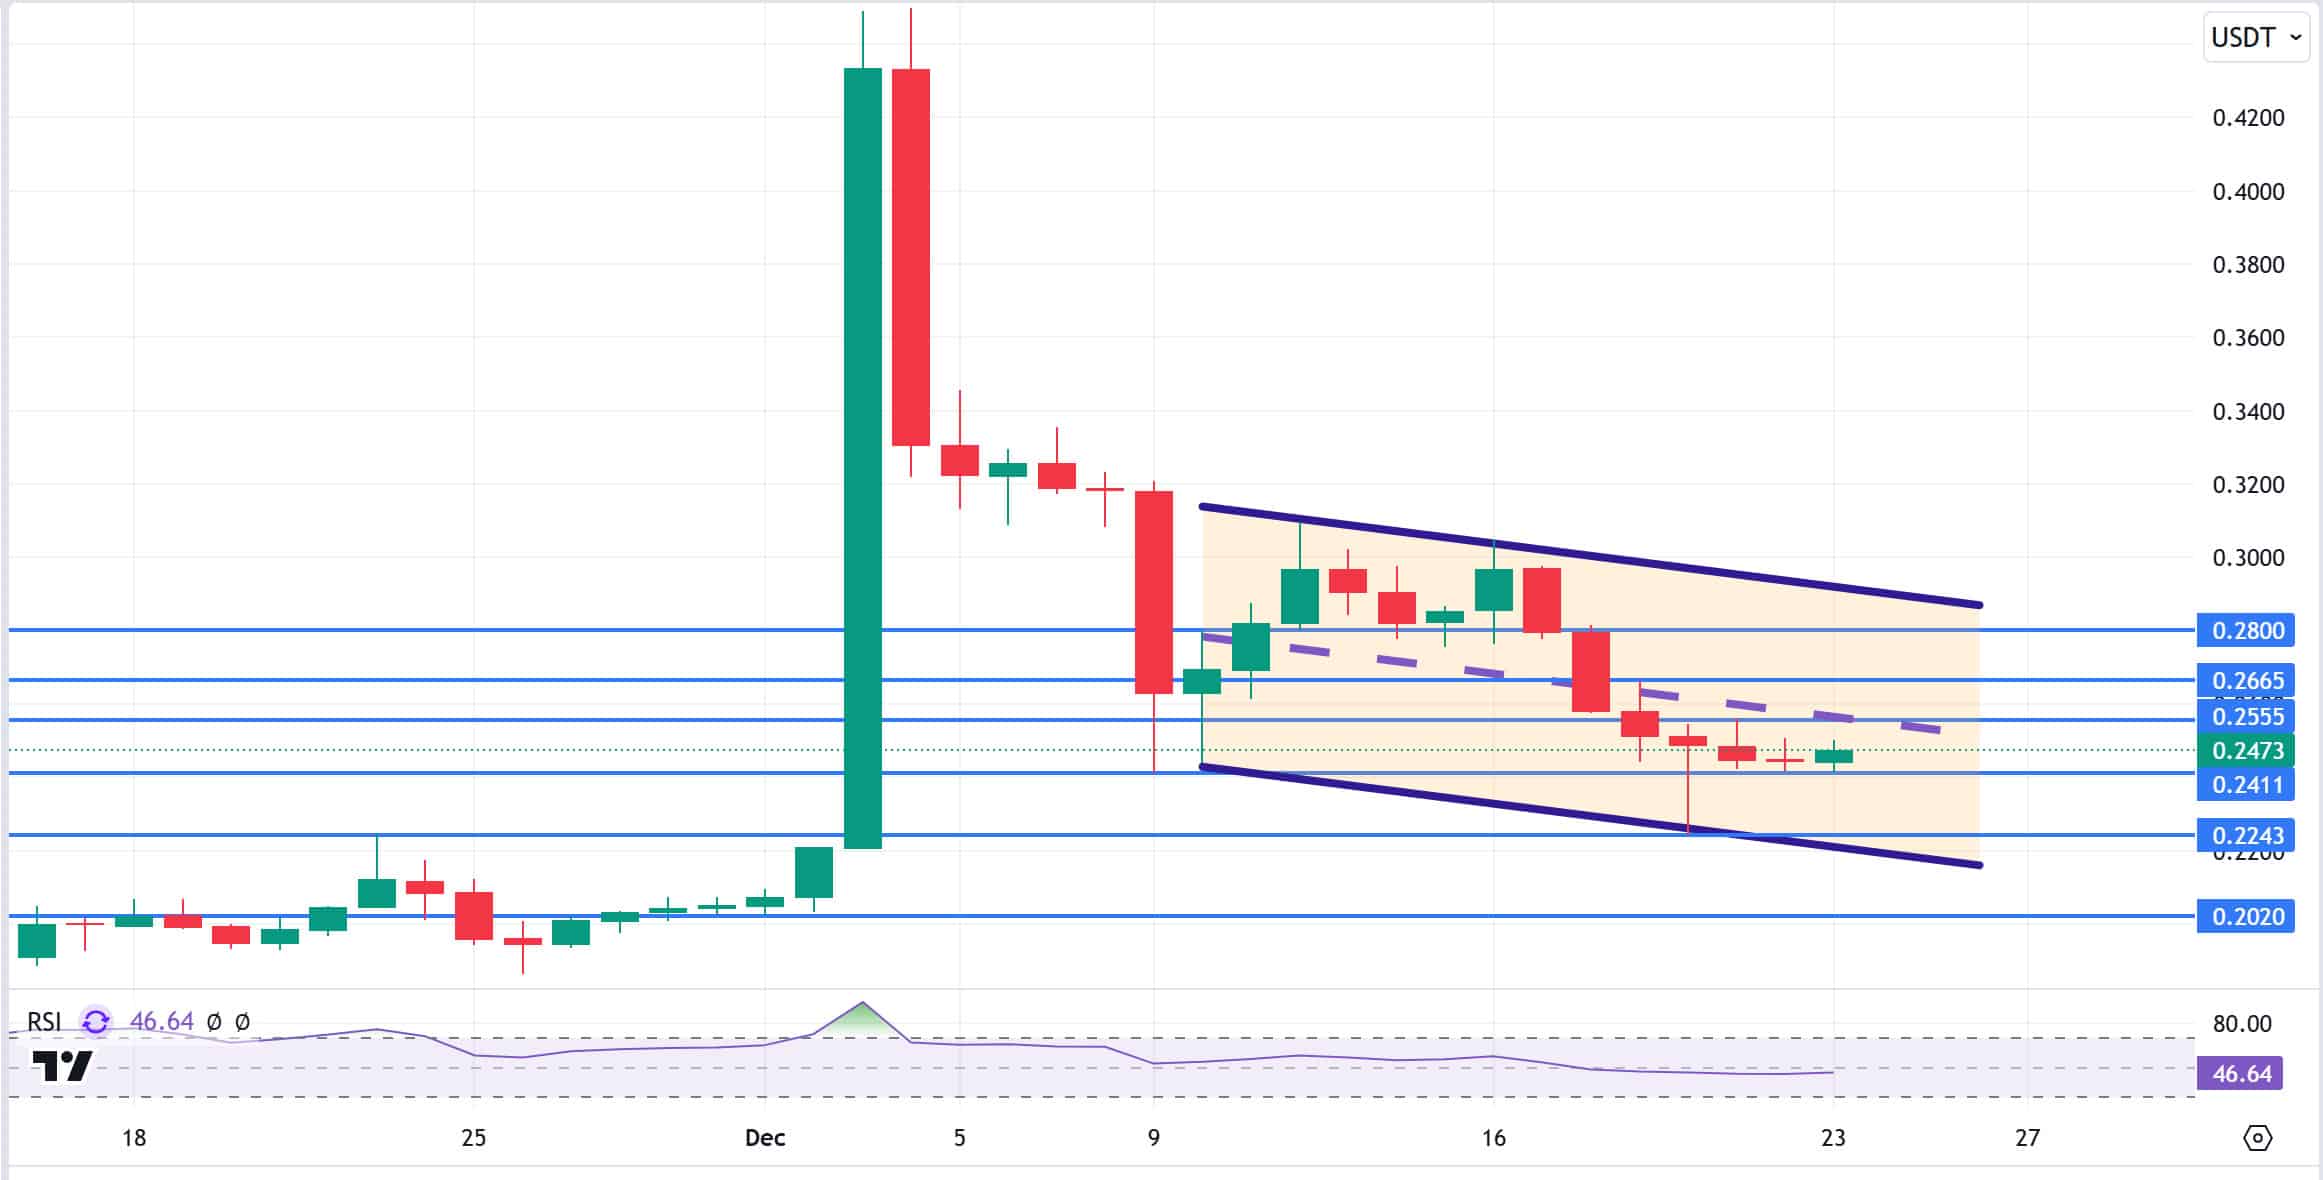
TRX, which started last week at 0.2856, fell about 14.5% during the week and closed the week at 0.2443. In this week, when there is little data that will affect the market, Conference Board (CB) Consumer Confidence and unemployment benefit applications data will be announced on the US side. Especially if the unemployment benefits data is much lower than expected, it may be evaluated negatively by the market and create selling pressure.
TRX, currently trading at 0.2473, is located in the bearish channel middle band on the daily chart. With a Relative Strength Index value of 46, it can be expected to rise slightly from its current level and move towards the upper band of the bearish channel. In such a case, it may test the 0.2555 and 0.2665 resistances. If it cannot close above the 0.2555 resistance on a daily basis, it may decline with the selling pressure that may occur and may want to move towards the lower band of the channel. In such a case, it may test 0.2411 and 0.2243 supports. As long as it stays above 0.2020 support on the daily chart, the bullish demand may continue. If this support is broken, selling pressure may increase.
Supports 0.2411 – 0.2243 – 0.2020
Resistances: 0.2555 – 0.2665 – 0.2800
AVAX/USDT
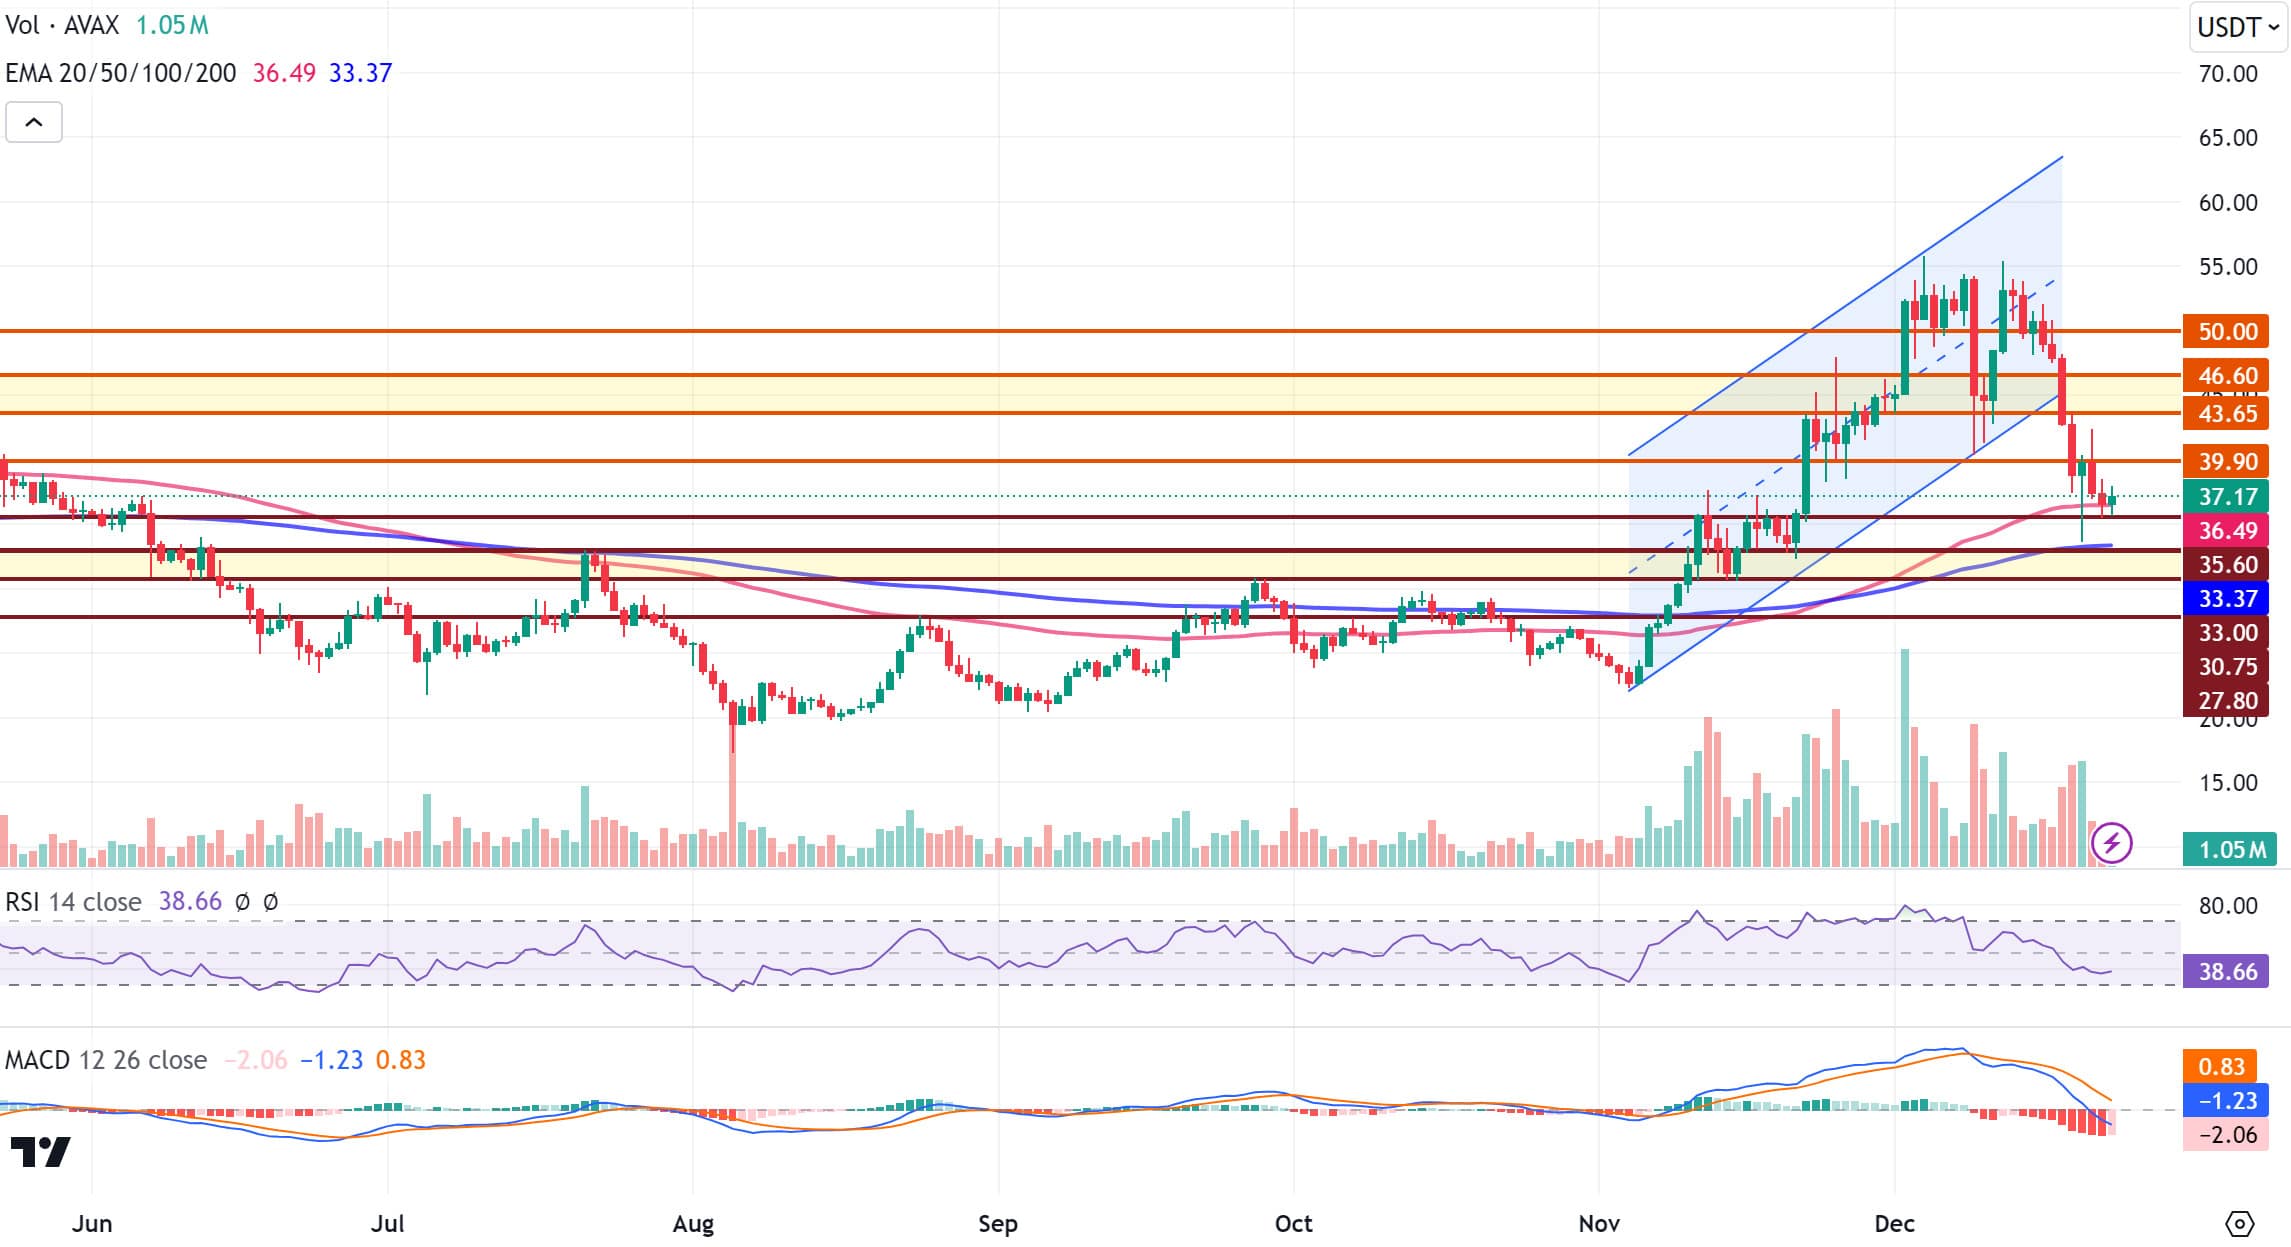
On December 18, 2024, the release of the FED’s “Summary of Economic Program” report and the subsequent speech of FED Chairman Powell caused a sharp decline in the cryptocurrency market. AVAX, which started the week at 50.76, lost about 28% and closed the week at 36.55. During the same period, on December 16, 2024, the Avalanche network successfully launched the “Avalanche9000” update. However, due to the overall bearish sentiment in the crypto market, this update did not have a positive impact on AVAX.
AVAX, which was trading in a bullish channel last week, broke this channel downwards with the sharp decline on December 18. AVAX fell to the 200-period exponential moving average (EMA200) level and recovered with the purchases in this region and started to rise. Afterwards, AVAX continued to trade above the EMA100 and EMA200 levels. However, during the rise, it failed to break the 39.90 resistance level on a daily basis and declined. It tested the support level of 35.60 during the decline. Relative Strength Index (RSI) value is at 38.66, indicating that selling pressure dominates the markets and momentum is weak. The Moving Average Convergence/Divergence (MACD) indicator is at -1.23 and moving in the negative territory. MACD data supports that selling pressure continues and the downtrend may continue in the short term. AVAX may test the 35.60 support level again in the current downward movement. If this support level is broken, the 33.00 level may come to the fore and the decline may deepen below this level. On the other hand, as long as AVAX trades above the EMA100 and EMA200 levels, the possibility of a rebound remains. If the MACD histogram starts to narrow and the RSI moves to the upside, it may indicate that buying is starting to come in and AVAX may rebound and move higher. In such a scenario, AVAX may first test the 39.90 resistance level. If it breaks this level and closes above this level, it may continue its rise towards the 43.65-46.60 resistance zone and test this resistance zone. (EMA100: Pink Line, EMA200: Blue Line)
Supports 35.60 – 33.00 – 30.75
Resistances 39.90 – 43.65 – 46.60
SHIB/USDT
Shiba Inu (SHIB) has burned 8.1 million SHIBs with a 630% increase in the last 24 hours, bringing the total burn amount to over 410 trillion. In addition, the partnership with Chainlink (LINK) provides CCIP integration to the Shibarium network, allowing SHIB, BONE and LEASH tokens to work seamlessly across 12 different blockchains. This partnership could accelerate the adoption of the Shiba Inu ecosystem by improving DeFi applications and cross-chain functionality.
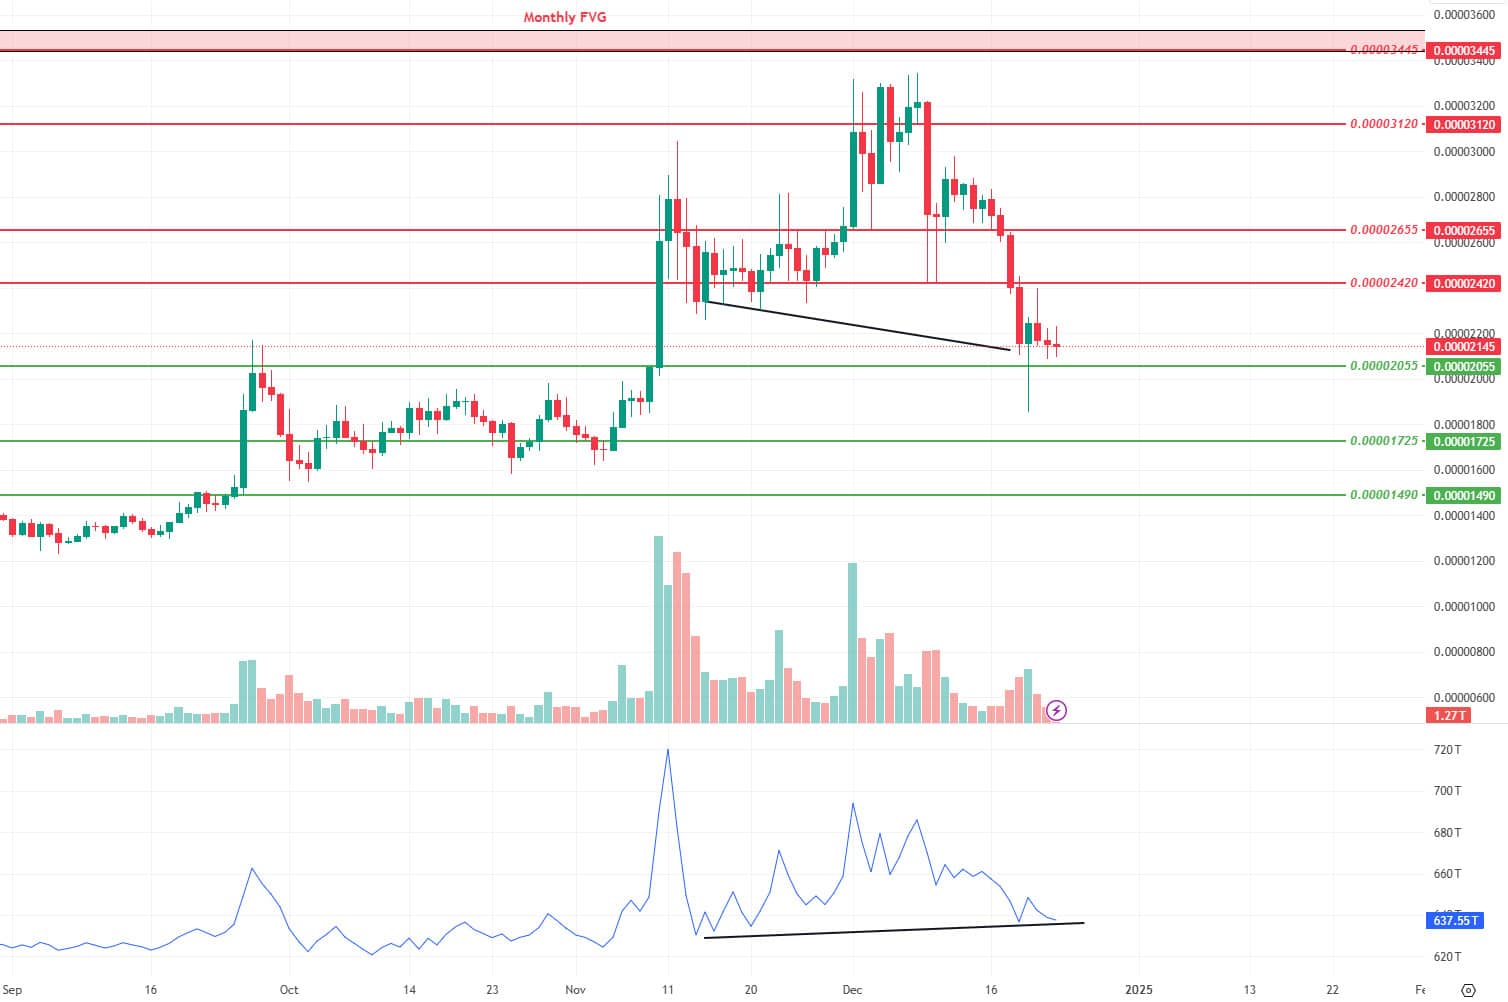
Technically, Shiba Inu (SHIB) price seems to have retreated to the support level of 0.00002055 after losing the 0.00002625 level. After the positive divergence on the On Balance Volume (OBV) oscillator (Black Line), the price, which reacted from the 0.00002055 level, may move towards the 0.00002420 level if it holds above this level. On the other hand, if the selling pressure continues, if the price loses the 0.00002055 level, a retracement towards the support level of 0.00001725 can be expected.
Supports 0.00002055 – 0.00001725 – 0.00001490
Resistances 0.00002420 – 0.00002655 – 0.00003120
LINK/USDT
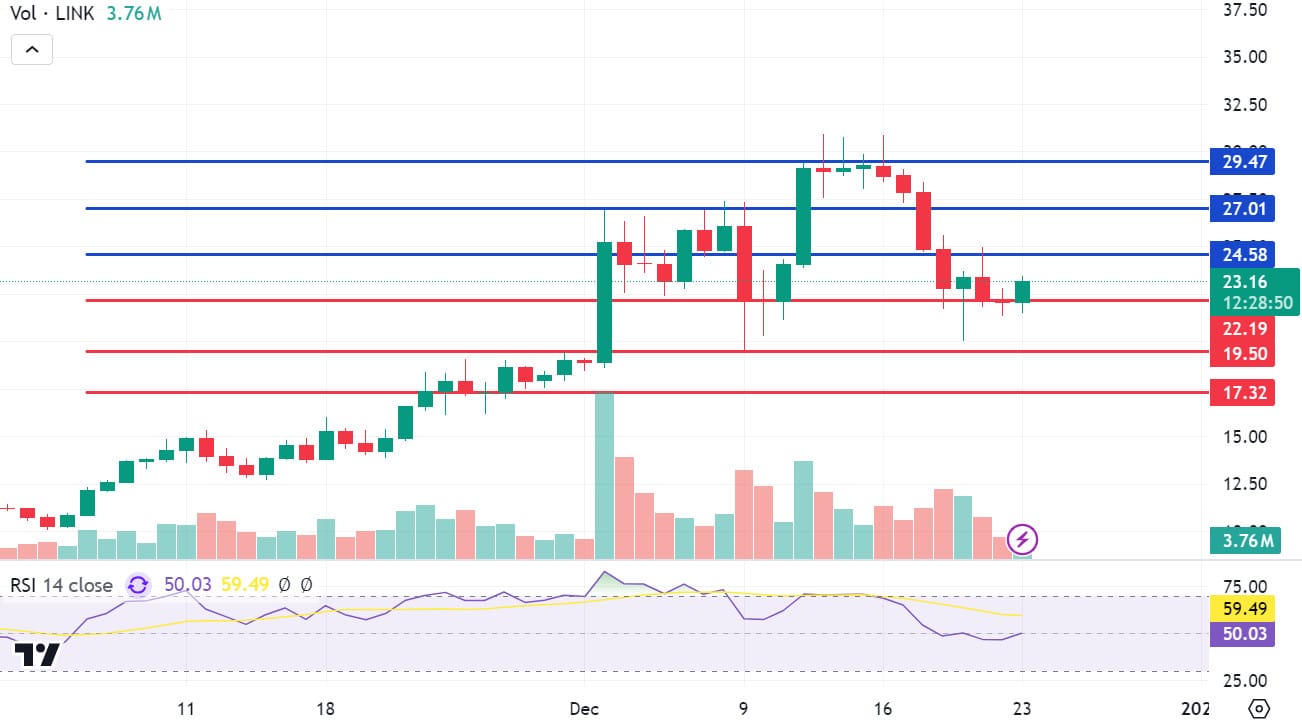
Recent on-chain data reveals that whales have accumulated a significant amount of Chainlink (LINK) tokens. According to transaction records, nine newly created wallets withdrew a total of 362,380 LINK tokens. The total value of these withdrawals reached approximately $8.19 million over the past two days. We can say that this movement shows that large-scale transfers indicate a significant accumulation process.
One of the identified wallets received 51,500 LINK tokens in a single transaction, while other wallets transferred different amounts, including 35,802 and 27,147 LINK tokens. This activity suggests that high net worth investors tend to secure their LINK tokens in preparation for future market volatility.
Although a pullback was observed towards the 19.50 support zone that we highlighted last week, this movement was limited to a pin drop and the price regained strength by rising above the 22.19 level. The 24.58 level, a critical resistance point for the continuation of the rise, comes to the fore. A daily close above this level could support the bullish movement and pave the way for the price to test the $30 levels again. However, if this resistance cannot be broken, the possibility of retesting the $19.50 level will increase. The Relative Strength Index (RSI) indicator does not show any discrepancy regarding this scenario. In this context, it would be a more appropriate strategy in terms of risk management to expect a positive movement in case of persistence above the 24.58 level.
Supports 22.19-19.50-17.32
Resistances 24.58-27.01-29.47
LTC/USDT
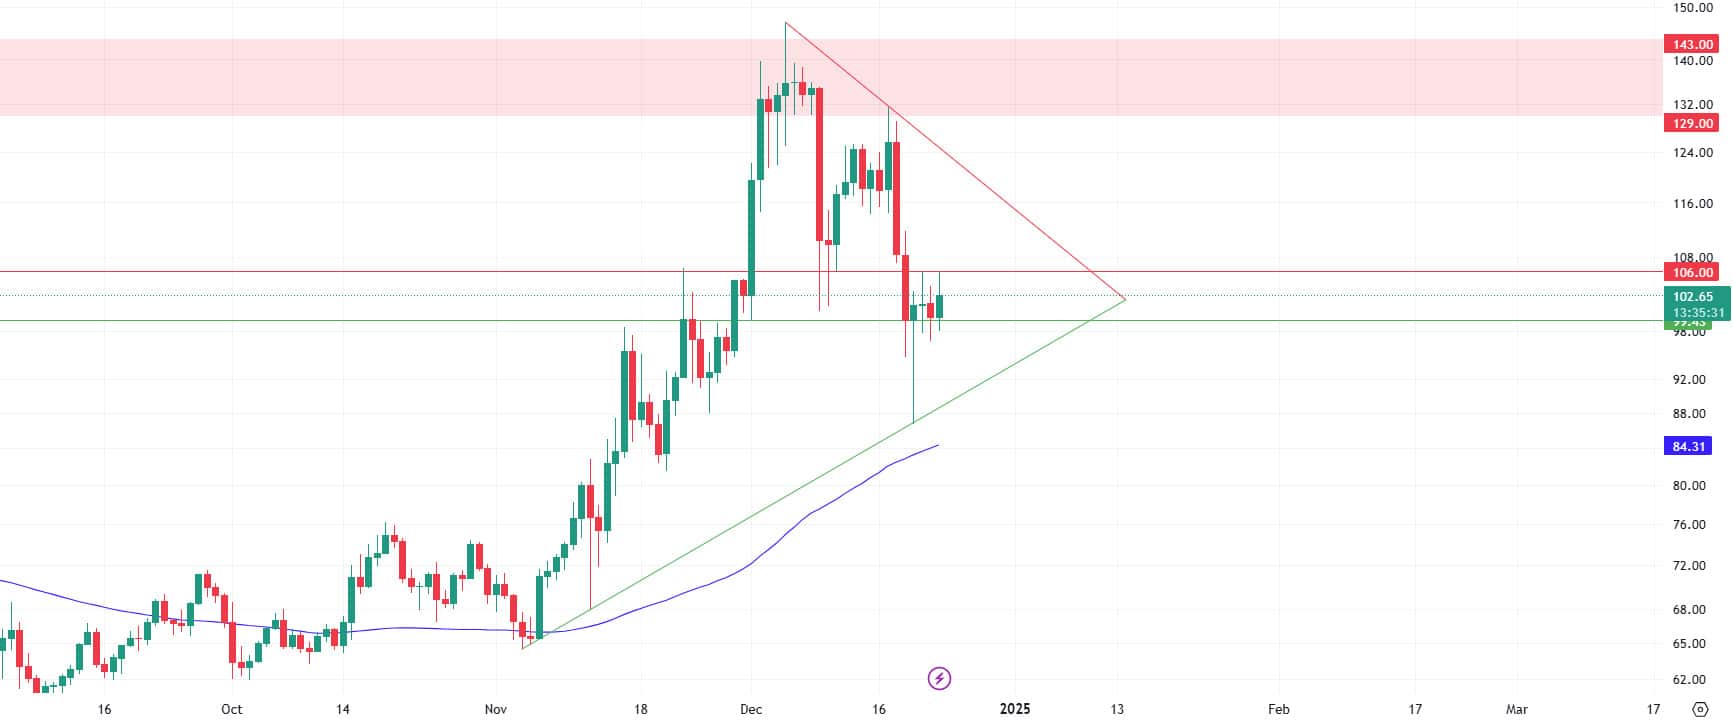
LTC, which had a very active week starting with Bloomberg analysts sharing that they were waiting for confirmation in the LTC spot etfs during the week, closed last week with a negative week. LTC, which declined by 17.63% compared to the beginning of the week, thus completed its second negative week series. In the process, LTC, where we often see pins on candlestick charts, created a 51.67% difference between the previous week’s lows and highs. According to Arkham data, the amount of open positions on LTC decreased to $121.95 million from $147.69 million in the previous week, while funding rates are still positive
When the daily chart of LTC is analyzed, it is seen that it is stuck between its intermediate support at 99.43 and its intermediate resistance at 106.00. If the current intermediate support is broken, a reaction can be expected at 88.51, the first major support point on the rising trend line with the decline. If the trend support is broken, the 84.31 level, where the 50-period moving price average crosses, may work as an important support. On the upside, an uptrend that may start with a break of the intermediate resistance at 106.00 may continue until the falling trend line. With a break of this level, which is momentarily crossed at 125.20, the major resistance at 143.00 may be tried again.
Resistances:106.00 – 125.20 – 143.00
Supports 99.43 -88.51- 84.31
BNB/USDT
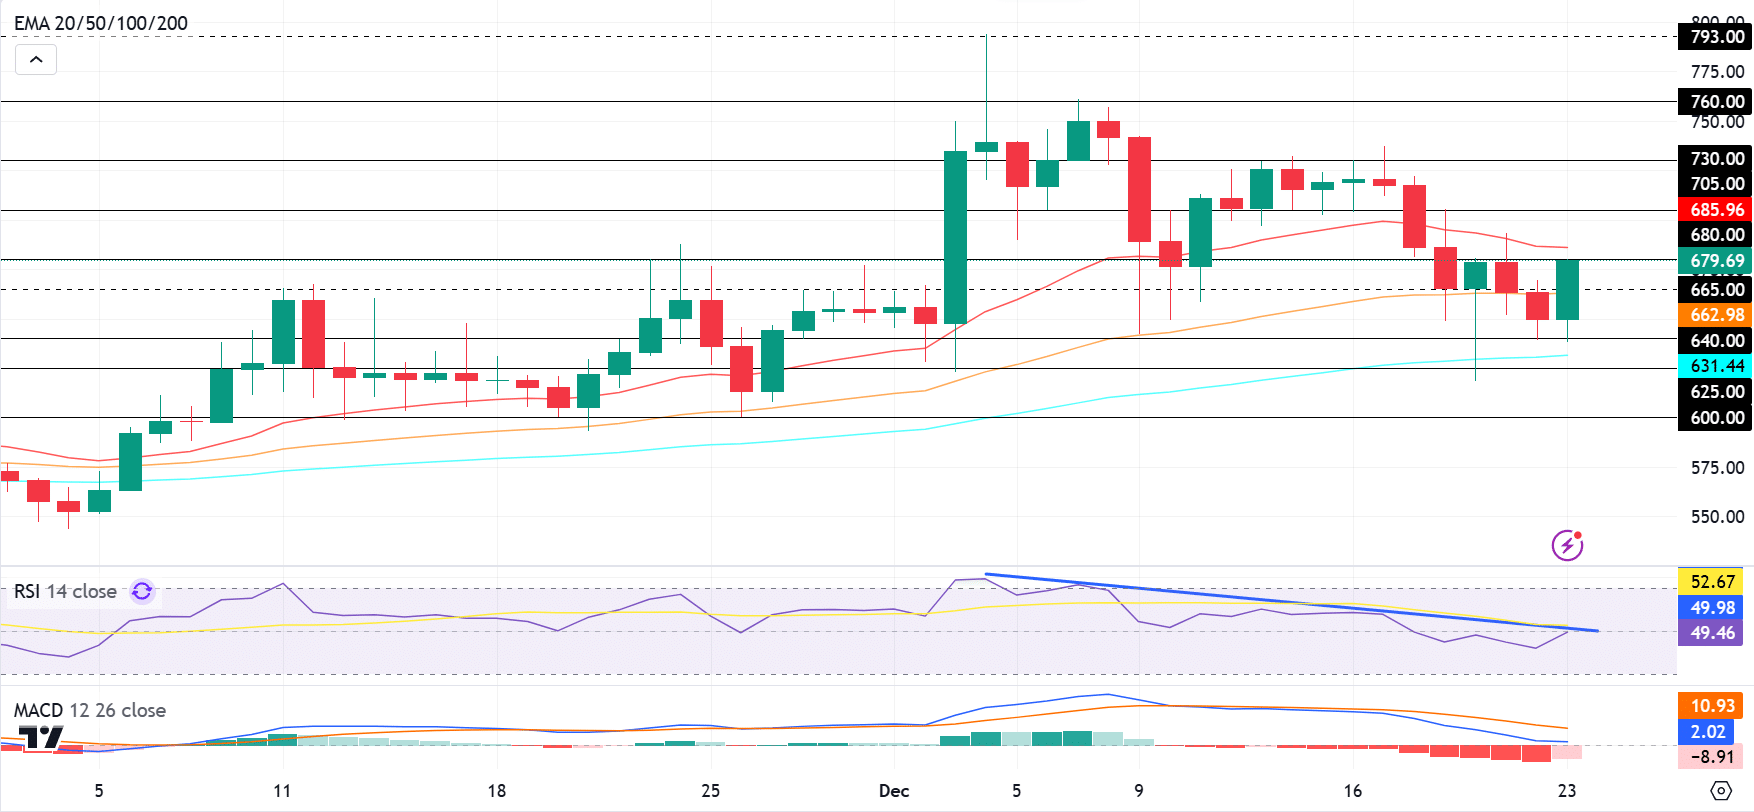
BNB/USDT, which has been moving horizontally between 705-730 levels since December 13, showed a downward trend after the Fed’s 25 basis point rate cut decision and Powell’s hawkish statements on December 18. In this process, the asset fell as low as 618 after breaking the 705 support level. Although negative accelerations were observed, there was a recovery with purchases coming from the EMA 100 level. In addition, in line with the positive developments in the BNB ecosystem, the asset started the new week with a positive momentum.
The MACD indicator shows that although negative candles indicate selling pressure, this outlook is weakening and may end if buying continues. The RSI indicator, on the other hand, has approached the descending trend line that has been in place since the ATH level. An upside break of this trend may contribute to the continuation of the positive outlook.
If the positive momentum continues, a rise towards the 680 level is expected first. If the 680 level is broken upwards, there may be a rise up to 705 and 730 levels, respectively. However, as a result of the pressure from the 730-780 levels, the price is likely to retreat back towards the 665 level. If the 665 level is broken downwards, 640 and 625 levels should be followed.
Supports 665- 640- 625
Resistances 680- 705- 730
ADA/USDT
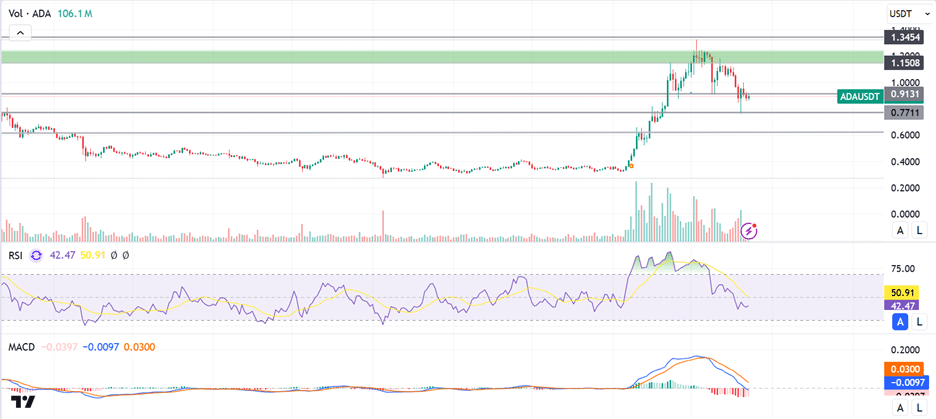
Last week, FED Chairman Powell’s speech caused a sharp decline in the cryptocurrency market, causing Cardano to fall below the $1 level. ADA, which started the week at 0.9050, lost about 45% in value and closed the week at 0.9180. In the same period, Cardano made a statement that the highly anticipated Alonzo update will take place in the coming period. While this update was expected to provide Cardano with an alternative to Ethereum for developing smart contracts and decentralized applications, it did not have a positive impact on ADA due to the overall bearish sentiment in the crypto market. Going forward, it could have a major impact on the future of Cardano and the value of the Ada coin.
Technically, ADA, which was traded in a rising channel last week, broke this channel downwards with the sharp decline on December 9. After losing the 0.9686 level, ADA seems to have retreated to the support level of 0.8856. Relative Strength Index (RSI) is at 41.70, indicating that selling pressure is dominating the markets and momentum is weak. The Moving Average Convergence/Divergence (MACD) indicator is at -0.096 and moving in the negative territory. MACD data supports that selling pressure continues and the downtrend may continue in the short term. ADA may test the 0.8856 support level again in the current downward movement. If this support level is broken, the 0.7849 level may come to the fore and the decline may deepen below this level. On the other hand, if the MACD histogram starts to narrow and the RSI starts to move up, it may indicate that buying is starting to come and ADA may recover and start to rise. In such a scenario, ADA may first test the 1.1583 resistance level (Green Line). If this level is broken and the close is realized above this level, it may continue its rise towards the 1.2412 – 1.3454 resistance zone and test this resistance zone.
Supports 0.8856 – 0.7849 – 0.7711
Resistances 1.1583 – 1.2412 – 1.3454
LEGAL NOTICE
The investment information, comments and recommendations contained in this document do not constitute investment advisory services. Investment advisory services are provided by authorized institutions on a personal basis, taking into account the risk and return preferences of individuals. The comments and recommendations contained in this document are of a general type. These recommendations may not be suitable for your financial situation and risk and return preferences. Therefore, making an investment decision based solely on the information contained in this document may not result in results that are in line with your expectations.

