BTC/USDT
Bitcoin left behind another week of high volatility. In a week of intense Bitcoin-related developments, Bitcoin surpassed $100,000, becoming the world’s 10th largest currency and 12th largest economy, thanks to US President Trump’s crypto-friendly policies. Trump’s selection of Paul Atkins as SEC Chairman, David O. Sacks as “Artificial Intelligence and Crypto Director” and Powell’s comparison of Bitcoin to digital gold were the most important factors affecting the rise.
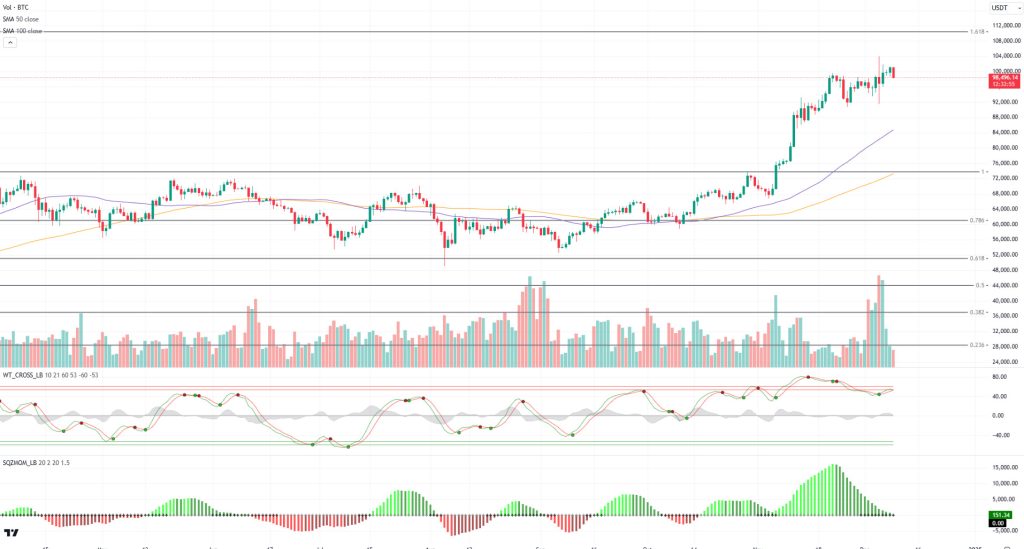
When we look at the technical outlook with fundamental developments, it enabled the price to make a new ATH at the level of 104,000 as the price crossed the 100,000 level. In BTC, which started the last month of the year by recording a new record, we saw that it exhibited volatile movements similar to previous years. When we look at the weekly fund flow data, it is observed that BTC funds are negative and there is a decline in dominance in parallel. While technical oscillators continue to give trading signals in the overbought zone on the daily chart, it is noteworthy that the momentum indicator is getting weaker. Although it gives correction signals on the technical side, we can say that the price focuses on fundamental developments. As a matter of fact, if Microsoft, the third largest company in the US, votes yes to purchase BTC tomorrow, the upward movements of the price may continue. Later in the week, while US inflation data is expected, it is quite remarkable that the expectation for a 25 basis point interest rate cut is currently at 87%.
Supports 95,000 – 90,000 – 83,000
Resistances:100,000 – 104,000 – 110,000
ETH/USDT
The volume of Ethereum-based decentralized applications (dApps) has increased by 38% recently, showing that Ethereum’s use cases are expanding. The increase in stablecoin transaction volumes, especially on the DeFi side, indicates that the ecosystem continues to grow. These developments can be considered as positive signals for Ethereum’s future price movements.
The NFT market seems to have revitalized on the Ethereum network. This is boosting demand on the network by increasing both user interest and transaction volumes.
In November, there were record investments in Bitcoin and Ethereum spot ETFs. This clearly demonstrates the growing interest of institutional investors in cryptocurrencies and paves the way for wider adoption of Ethereum.
The total value locked (TVL) growth on the Linea and Base networks, as well as the Symbiosis platform, has reached remarkable levels. These networks and platforms point to the expanding use cases of the Ethereum ecosystem. In addition, the increase in the amount of ETH staked on EigenLayer also shows the continued trust in Ethereum.
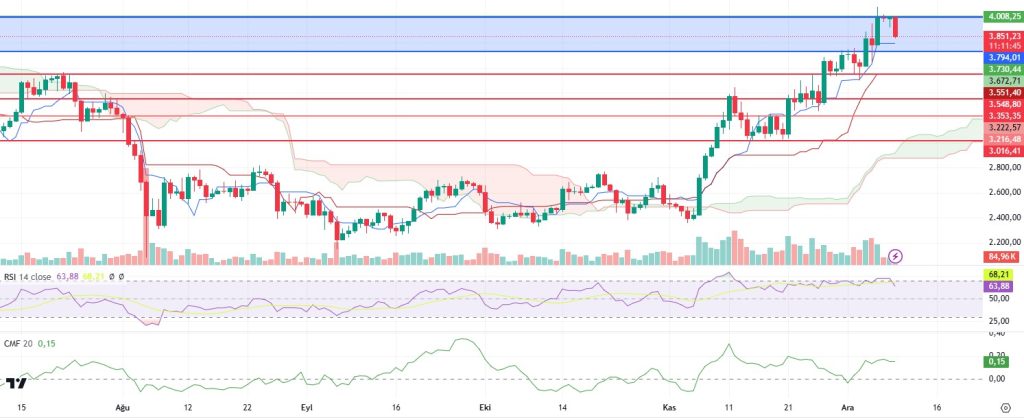
Ethereum tested the $4,000 level in recent days, but faced a sharp selling pressure from this region. The sell-off in Coinbase’s spot market suggests that this decline could be a correction. The Relative Strength Index (RSI) fell from the overbought zone to 64. While trading volume declined over the weekend, the price decline is also observed to have occurred on low volume. The weakness in momentum indicates that horizontal movements or correction may continue in the short term. CMF and Tenkan Level: The positive outlook on the Chaikin Money Flow (CMF) indicator and the rise in the Tenkan level to $3,800 indicate that the price may exceed the $4,000 level again after the correction. As the main support, $3,551 (Kijun level) is critical. A break below this level could bring a deeper decline.
Ethereum offers a positive long-term outlook thanks to strong fundamentals and growing institutional interest. However, technical indicators suggest that correctional movements may continue in the short term. A sustained move above $4,000 would mean that Ethereum could continue its uptrend. Maintaining support levels and continued growth in ecosystem components such as DeFi and NFT are among the factors that support this positive outlook.
Supports 3,730 – 3,551 – 3,353
Resistances 4,008 – 4,374 – 4,610
XRP/USDT
Ripple continues to grow its ecosystem by establishing strategic partnerships with key organizations such as UK-based Archax and Mercy Corps Ventures to expand XRP Ledger technology in innovative use cases such as tokenized finance and financial inclusion. In the same period, developments that SEC Chairman Garry Gensler would step down triggered a significant rise in the price of XRP by strengthening the perception that Ripple could get rid of regulatory pressures.
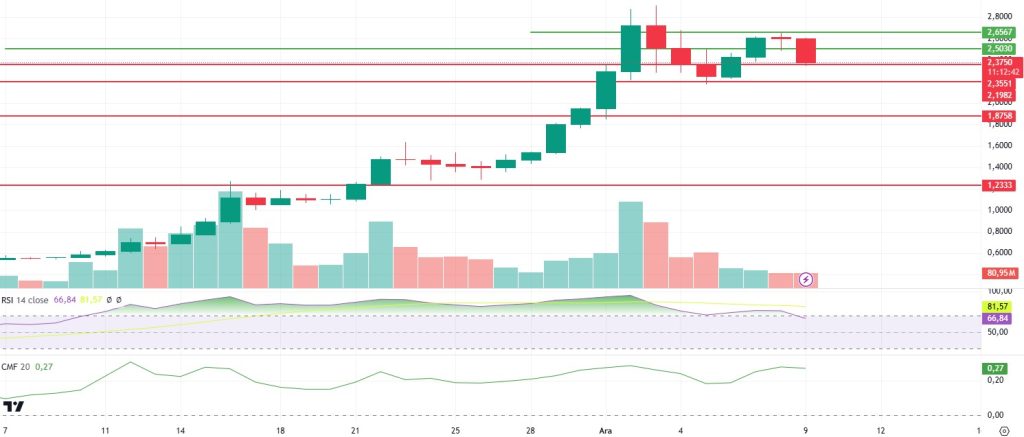
XRP entered a period of accumulation in the $2.65 – $2.19 band after the recent rise. The consolidation of the price within this wide range ensures that medium and long-term positive expectations are maintained. The Relative Strength Index (RSI) fell from its previous overbought zone to 67. This decline can be considered as a positive correction signal for XRP. In addition, the Tenkan line continues to rise, supporting the positivity in the technical outlook. In recent days, the decrease in trading volume with the accumulation period and the weakness in momentum are among the negative factors to be considered. This indicates that fluctuations in short-term price movements may continue.
The $2.19 level, the lower limit of XRP’s accumulation band, stands out as a critical support for the direction of the price. Closures below this level may bring the risk of a deeper correction. On the upside, a break of the $2.65 level would be an important signal for the uptrend to regain strength.
Ripple’s expanding partnerships and reduced regulatory uncertainty paint a positive long-term picture for XRP. While technical indicators also support this outlook, it seems likely that XRP will continue its uptrend as long as the support at the $2.19 level remains intact. However, low volume and weakness in momentum suggest caution for short-term moves. It is important to maintain the accumulation band for medium and long-term positions.
Supports 2.1982 – 1.8758 – 1.2333
Resistances 2.5014 – 2.6567
SOL/USDT
The past week has seen fluctuations in the cryptocurrency market. South Korea’s recent declaration of martial law upended global cryptocurrency markets, creating shockwaves in trading activity and causing significant price fluctuations. In the data from the US, non-farm payrolls increased above expectations. This was a positive result for the dollar. The unemployment rate was announced in line with expectations at 4.2%. Average hourly earnings increased by 0.4% on a monthly basis. All these data reflected positively on cryptocurrencies.
In addition, Trump chose pro-crypto Paul Atkins as SEC chairman. On the other hand, Powell said in a statement, “I am very pleased with where we are on monetary policy. The US economy is in remarkably good shape. We have moved very quickly on interest rates, unemployment is still very low and we are making progress on inflation. After these statements, according to the data from CME, the probability of a 25 basis point rate cut is 83.4%.
Grayscale Investments has applied to list its Spot Solana ETF product on the New York Stock Exchange (NYSE). This application makes Grayscale the fifth asset company to apply for a Solana ETF product. Previously, Canary Capital, VanEck, 21Shares and Bitwise had applied. Indeed, Solana (SOL) has experienced renewed bullish interest with a number of large whales buying SOL. This came on the heels of Grayscale’s interest in spot Solana ETFs and the institutions’ stated rationale for Solana’s sustainability. However, two of the five Solana ETF applicants were notified by the US SEC that their 19b-4 applications would be rejected. The financial regulator’s consensus announced that President Joe Biden has decided that no more ETF applications will be approved under their administration. On the other hand, Solana foundation strategy leader Austin Federa announced his departure to establish a new permissionless network protocol. Austin Federa said: “After four years on the Solana project, I have taken a step forward and will head a new protocol that sets out to solve a problem at the heart of the internet and high-performance blockchain by building the doublezero protocol. Next week, CPI data from the US is among the data to be followed.
In the Sol ecosystem, a significant decline in SOL’s price momentum caused pessimism among investors. The Solana Long/Short ratio highlights the pessimism; the ratio of short traders to long traders is 0.8389. This suggests that many traders expect a drop in SOL’s price. On the other hand, an important reason for Solana’s surge in activity is the growing meme coin ecosystem. Solana meme coins have risen to a market capitalization of over $19 billion as users mine new assets. Solana’s daily volume rose to $13 billion for the first time since November 22, indicating increased engagement with the cryptocurrency.
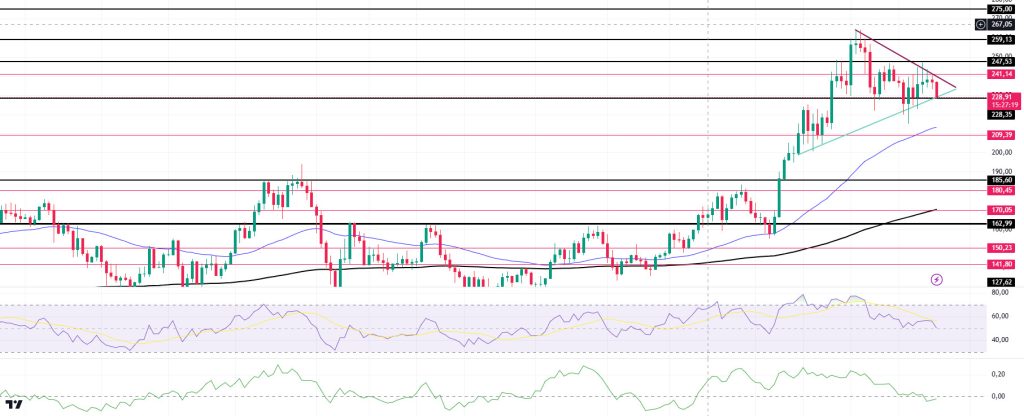
When we look technically, it has broken the 247.53 support, which is a strong resistance place, and made this level a resistance place. This is an important resistance level for the continuation of the rise. On our daily chart, the 50 EMA (Blue Line) continues to accelerate upwards from the 200 EMA (Black Line). This shows us that the trend is bullish. Relative Strength Index (RSI) accelerated from 14 overbought levels to neutral. On the other hand, the symmetrical triangle pattern stands out. As a matter of fact, if this pattern continues to work, the 275.00 target can be followed. However, when we analyze the Chaikin Money Flow (CMF)20 indicator, money inflows are moving horizontally. If the positive results in macroeconomic data and positive developments in the ecosystem continue, it may test the first major resistance level of 247.53. In case of declines due to political developments or negative news in the Solana ecosystem, the 185.60 level can be followed and a buying point can be determined.
Supports 228.35 – 209.39 – 185.60
Resistances 241.14 – 247.53 – 259.13
DOGE/USDT
When we look at Onchain data, Open Interest data, which has increased in recent days, has increased from $ 3 billion to approximately $ 4.45 billion. This increased open interest shows the strong faith and trust of traders in the token and has led to an increase in new open positions. Robinhood sparked controversy in the market by transferring 70 million Dogecoins to a centralized exchange. This transfer lowered the Dogecoin price by 3% after Robinhood’s transfer.
In the Doge ecosystem, whales continue to accumulate the meme coin, which could lead to further gains in the near future. While DOGE prices have remained flat over the past two weeks, whale transactions above $100,000 and $1 million have steadily increased over the past few days. Data from Santiment highlighted that addresses with over $100,000 and $1 million in transactions collectively purchased more than 240 million DOGE tokens in December.
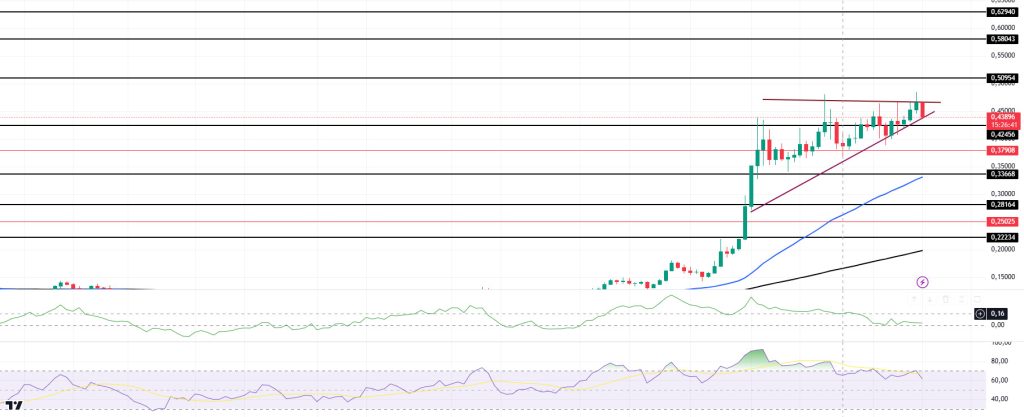
When we look at the daily chart, although the 50 EMA (Blue Line) continues to stay above the 200 EMA (Black Line), the difference between the two averages is 66.72%, increasing the possibility of a pullback. This also shows us that the DOGE coin is bullish. If we look at the liquidity zone of DOGE, there is a liquidation place of approximately 154 million dollars at 0.4764 in short position. When we look at the Chaikin Money Flow (CMF)20 indicator, money inflows approached the neutral zone. Relative Strength Index (RSI)14 continues to remain in the overbought zone. This may bring profit sales. On the other hand, the ascending triangle pattern should be taken into consideration. If this pattern works, the $1 target may be realized. In case of possible macroeconomic conditions and negative developments in the ecosystem and retracements, 0.33668 can be followed as a strong support. In case of continued rises, 0.50954 should be followed as a strong resistance.
Supports: 0.42456 – 0.37908 – 0.33668
Resistances: 0.50954 – 0.58043 – 0.62940
TRX/USDT
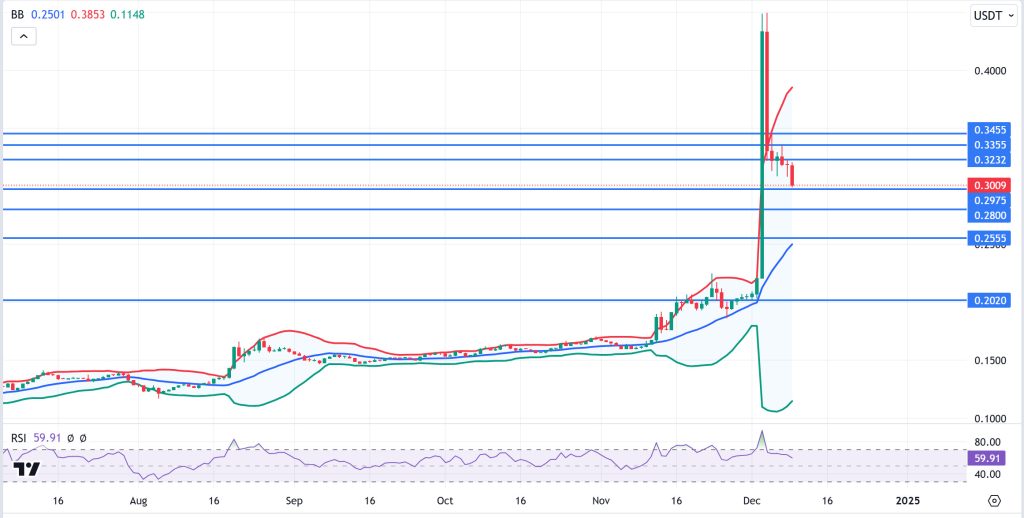
TRX, which started last week at 0.2072, closed the week at 0.3183, rising by about 53% during the week with the announcement that the sun.pump platform will launch the livestream feature. This week, consumer price index, applications for unemployment benefits and producer price index data will be announced. These data are important to affect the market and data to be announced in line with expectations may have a positive impact. There may be high volatility in the market during the release of the consumer price index data, which plays an important role in the FED’s interest rate decision.
TRX, currently trading at 0.3009, is in the upper Bollinger band on the daily chart. The Relative Strength Index has approached the overbought zone with a value of 59 and can be expected to decline slightly from its current level and move to the bloodBollinger middle band. In such a case, it may test 0.2975 and 0.2800 supports. If it cannot close daily under 0.2975 support, it may rise with the buying reaction that may occur. In such a case, it may want to test 0.3232 resistance. As long as it stays above 0.2020 support on the daily chart, the bullish demand may continue. If this support is broken, selling pressure may increase.
Supports: 0.2975 – 0.2800 – 0.2555
Resistances 0.3232 – 0.3355 – 0.3455
AVAX/USDT
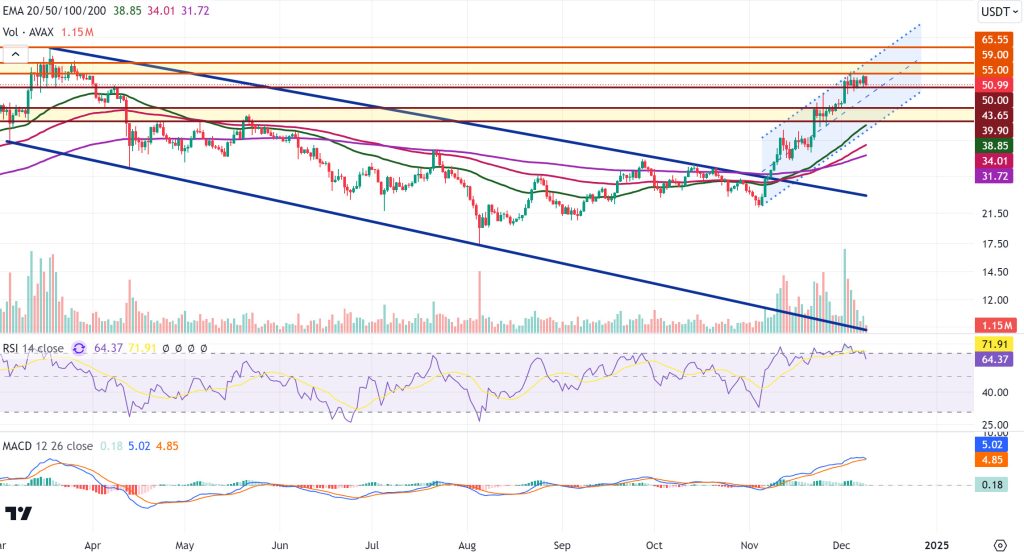
AVAX started last week with an increase, rising to 55.86, and then declined with the sales. On December 5, 2024, in the cryptocurrency market, which was affected by the decline in BTC on December 5, 2024, AVAX continued to be traded again above the 50.00 level with its rise after falling as low as 48.35. Last week, AVAX closed the week at 54.02 with a 19.7% increase in value. The cryptocurrency market started the new week with a general decline and AVAX lost about 5.3% in the first half of the opening day of the week.
When we examine the daily analysis chart for AVAX, it continues to trade in the bullish channel. The rise in AVAX over the past week suggests increased investor interest. Exponential moving average (EMA) levels are well below the AVAX value, supporting buying pressure for AVAX and thus bullishness. Moving Average Convergence/Divergence (MACD) data continues to rise in the positive territory, technically supporting AVAX’s bullishness. Relative Strength Index (RSI) value is close to the overbought zone, supporting the uptrend. Last week, after breaking the 50.00 resistance level, AVAX continued to be traded below the 55.00 main resistance level with its rise after breaking the 50.00 resistance level. If it tests and breaks the 55.00 resistance level again with its rise this week, the rise may gain momentum. It may test the resistance levels of 59.00 and 65.55 on its rise. In case of a decline due to market volatility and profit sales, selling pressure may occur with the break of the 50.00 support level and the decline may deepen and the main support level of 43.65, which stands out on a weekly basis, may be tested.
Supports : 50.00 – 43.65 – 39.90
Resistances : 55.00 – 59.00 – 65.55
SHIB/USDT
This week, the Shibarium network passed an important milestone, reaching more than 2 million wallet registrations and over 620 million transactions. The network’s block generation has surpassed 8.2 million, with a block being generated every 5 seconds. With nearly 3 billion SHIB tokens burned, the reduced supply has strengthened market confidence. On the other hand, the controversy surrounding the Hawk Tuah token launch is gaining attention in the community, while its potential impact is creating uncertainty in the Shiba Inu ecosystem. Shibarium’s growth momentum and supply reduction strategy continue to support Shiba Inu’s market prospects.
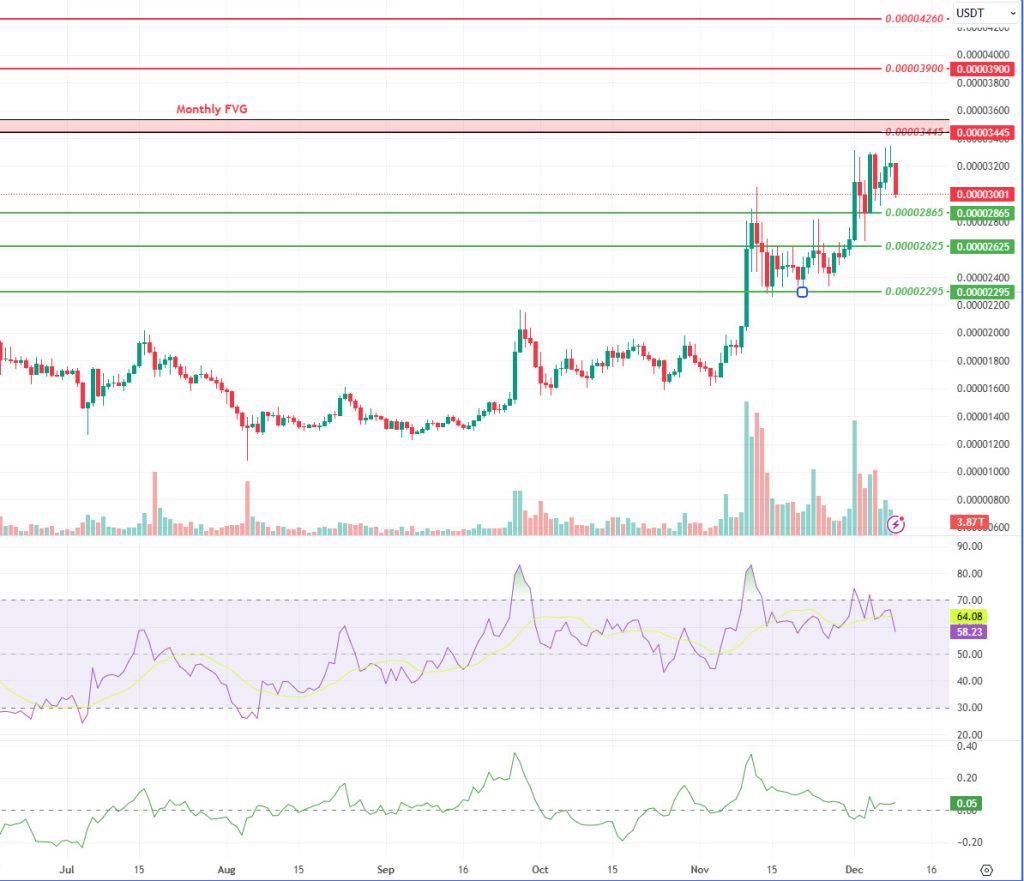
Technically, Shiba Inu (SHIB) price continues to retreat after the negative divergence on the Relative Strength Index (RSI) last week. SHIB, which continues to retreat after increasing selling pressure as it approaches the Monthly FVG (Fair Value Gap) level, may retreat to 0.00002865 levels. On the other hand, when we examine the Chaikin Money Flow (CMF) oscillator, we see that the buyer pressure has increased compared to last week. If the price maintains above the 0.00002865 level, a rise towards the Monthly FVG level can be observed.
Supports 0.00002865 – 0.00002625 – 0.00002295
Resistances 0.00003445 – 0.00003900 – 0.00004260
LINK/USDT
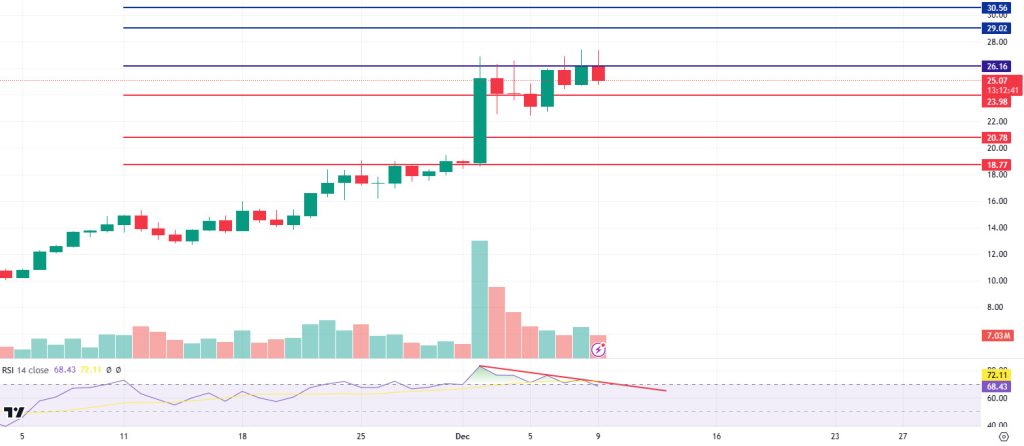
On December 2, LINK managed to break the resistance at $19.00 on strong volume, and after this move, it rose to $27, gaining nearly 50%. However, over the past week, we see that the price has been moving in a horizontal band due to the selling pressure it has faced despite repeatedly testing this level.
If this pressure continues, daily closes below the $24 support level could trigger a price decline to $20.78. In addition, the negative mismatch seen in the Relative Strength Index (RSI) indicator strengthens the likelihood of this scenario. In order for the upward movement to continue, the $ 26 level stands out as a critical resistance. If this resistance is overcome, the price is likely to target the $30.56 level and gain a new bullish momentum.
LINK last encountered this resistance zone during the last “bear” season, when it was rejected from this level and suffered a sharp decline of 45%. However, given the current market conditions and positive expectations, the likelihood of a pullback on a similar scale is considered quite low, although this area is still a challenging resistance point.
Supports 23.98-20.78-18.77
Resistances 26.16-29.02-30.56
LTC/USDT
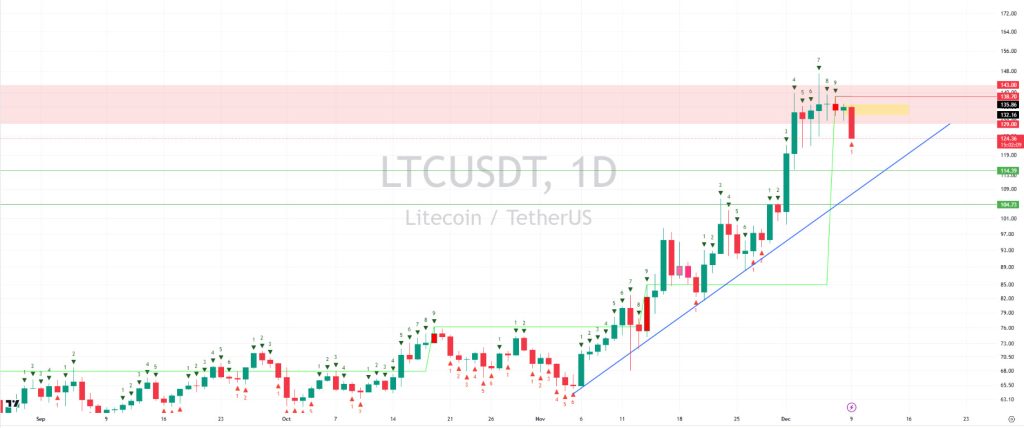
LTC has risen from 67.00 to 146.90 in its 5-week rising streak, an increase of more than 100%. In the meantime, according to CoinShares data, there were $5.3 million inflows into LTC funds last month. This shows that the expectations of large investors for LTC have increased and may be one of the important factors of the rise. LTC, which started trading at 134.91 at the opening today, has lost about 6% of its value during the day. With the daily close on 07.12.2024, the TomDemark (T.D) indicator had a bearish signal if the 138.70 level was not passed. This signal may be a harbinger of a short-term pullback.
On the daily chart, the first support level stands out as the horizontal support at 114.39. If this support level is broken, the second important support stands out as the rising trend support (blue line) at 107.50. If the decline deepens, the horizontal support at 104.73 should be monitored.
In upward movements, it will be critical how the price breaks within the red area between 129.00 and 143.00. Breaks in this area can determine the direction of the price. Closures below 129.00 create bearish expectations, while closures above 143.00 may strengthen the bullish signal. If these levels are broken, closes of at least three candles can be a strong indication that this breakout will continue.
The yellow area on the chart marks the weekly resistance zone. Daily closes above 135.86 may lead the price to move towards the resistance at 138.70. If 138.70 is breached, a significant resistance at 143.00 is likely to be encountered.
Resistances 135.86 – 138.70 – 143.00
Supports: 114.39 – 107.50 – 104.73
LEGAL NOTICE
The investment information, comments and recommendations contained in this document do not constitute investment advisory services. Investment advisory services are provided by authorized institutions on a personal basis, taking into account the risk and return preferences of individuals. The comments and recommendations contained in this document are of a general type. These recommendations may not be suitable for your financial situation and risk and return preferences. Therefore, making an investment decision based solely on the information contained in this document may not result in results that are in line with your expectations.


