
BTC/USDT
In a week that saw sharp price movements in crypto markets, Trump’s tariffs on Canada, Mexico and China brought a 13% drop in Bitcoin. Trump’s executive order to establish a sovereign wealth fund and the Truth.Fi Bitcoin Plus ETF application stood out as strategic moves in the market. On the regulatory front, the SEC’s review of BlackRock’s proposal to allow physical redemptions in its spot Bitcoin ETF and the Czech President’s approval of a law granting tax exemption to Bitcoin attracted attention. In addition, the transfer of 751.31 BTC by the Government of Bhutan gave important signals about liquidity and volatility in the market.
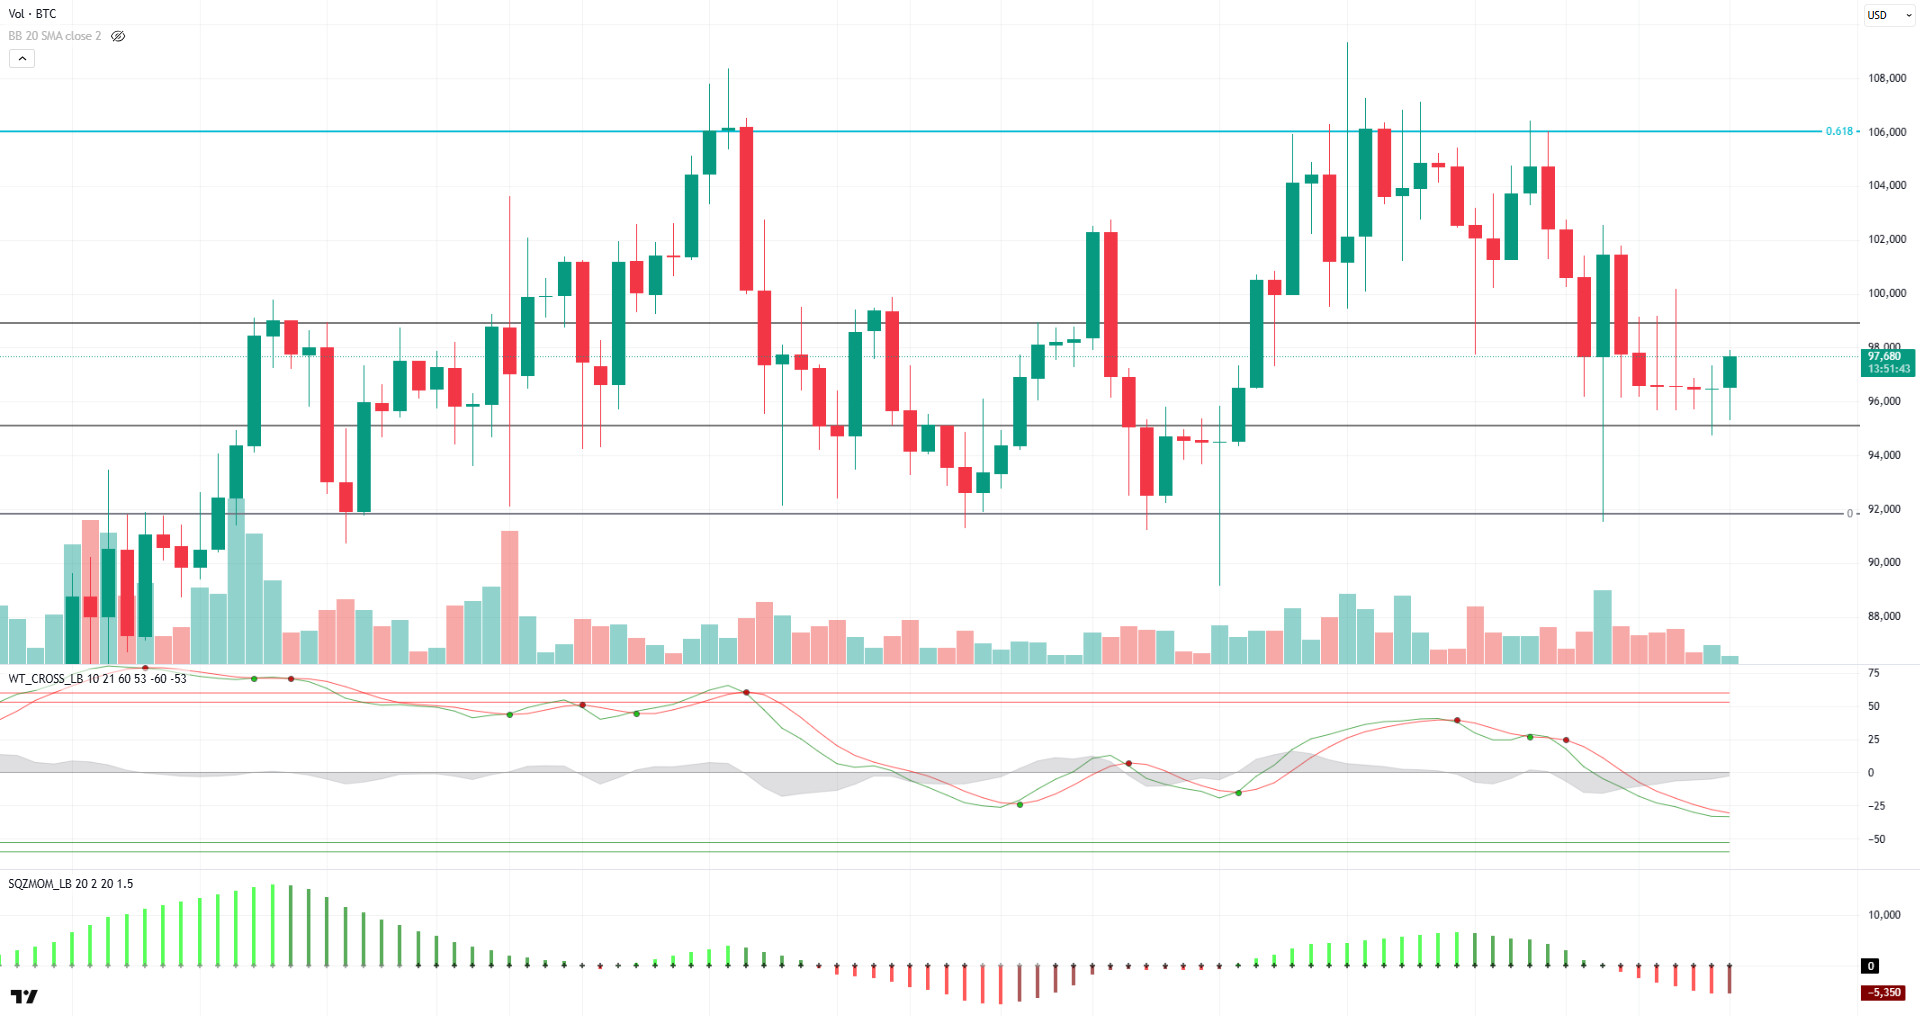
When we look at the technical outlook of BTC from a daily perspective, it is seen that after a 10.62% weekly depreciation, it recovered and largely recovered its losses and completed the week with a total decrease of 0.21%. BTC, which started last week around 102,800, is currently trading at 97,500 after falling as low as 95,000.When technical oscillators are analyzed, it is noticeable that the sell signal is maintained on the daily chart and weakness continues in the momentum indicator. On the moving averages side, the fact that MA10, MA20 and MA50 give a sell signal indicates that short-term selling pressure may continue. Accordingly, while the 95,000 level remains important as support in a possible pullback, it is noteworthy that the pivot point is 96,170. If the upward movement continues under the influence of fundamental factors, the 99,100 level stands out as a critical reference point for BTC to test six-digit prices again.
Supports 95,000 – 92,800 – 90,000
Resistances 98,800 – 99,100 – 101,400
ETH/USDT
On February 3, 2025, US President Donald Trump’s announcement that he would impose additional tariffs on Canada, Mexico and China created serious uncertainty in global markets. With this development, investors quickly exited risky assets and started to turn to dollars and government bonds, which are seen as safe havens. This risk-aversion movement in global markets also caused a strong wave of sales in the cryptocurrency market. ETH fell sharply in this process, losing 27% of its value and falling as low as $2,114. In particular, the break of 0.02991, a critical support level in the ETH/BTC pair, caused Ethereum to weaken against Bitcoin and the pair fell as low as 0.02339. The fall below this level created a negative perception for Ethereum in the market, causing further selling pressure. Liquidity outflows also reached remarkable levels in the Ethereum ecosystem. In particular, there was a large outflow of funds from L2 networks and the NFT market. Investors exiting L2 networks directed their capital either to stablecoins or directly to Bitcoin. In the NFT market, as selling accelerated, floor prices fell and trading volume declined significantly. In this process, large wallets were observed to reduce their Ethereum positions, further increasing the selling pressure in the market. Bitcoin Dominance (BTC.D) has persisted above the 61% level. This shows that investors have largely shifted to Bitcoin and a negative picture has emerged in the altcoin market. Ethereum and other altcoins have lost significant value due to the liquidity shift to Bitcoin. Ethereum in particular has fallen more than Bitcoin, leading to a loss of confidence among investors and creating uncertainty about the overall direction of the market.
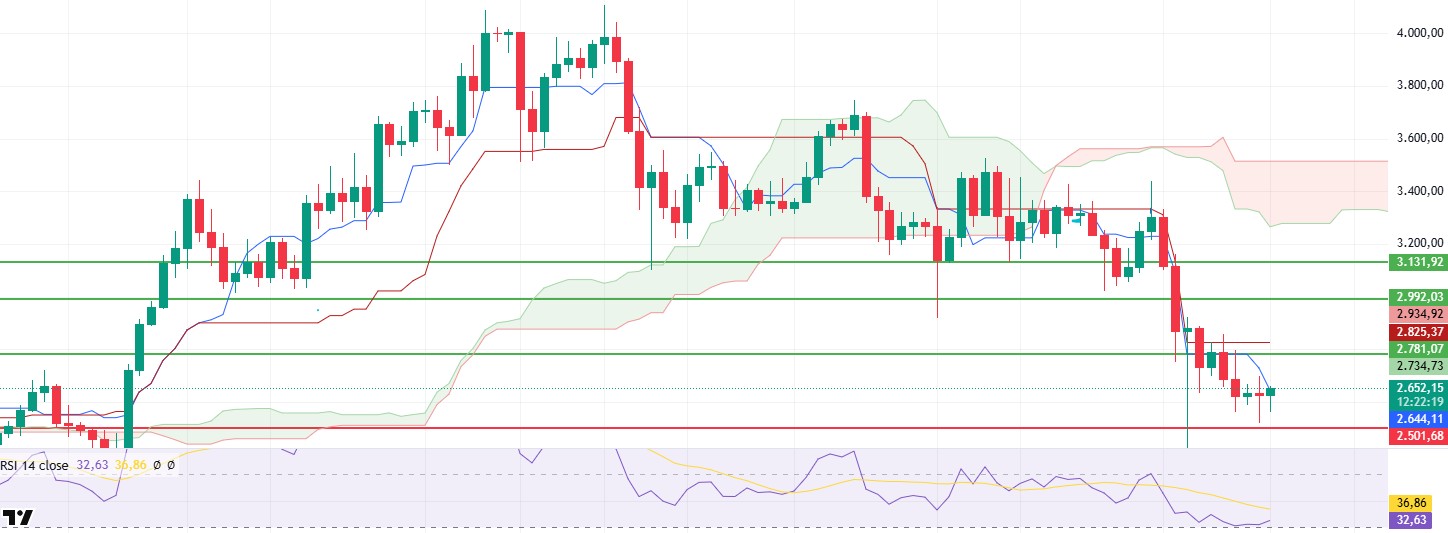
Analysing the technical indicators, the Relative Strength Index (RSI) showed a slight reaction after falling into oversold territory. However, this recovery is quite weak and does not yet signal a strong turnaround. Momentum indicators are also showing signs of recovery, but the overall structure of the market is still negative. Open Interest data has fallen to the lows seen in November 2024, indicating that leveraged positions in the market have been largely liquidated or closed. Cumulative Volume Delta (CVD) data reveals continued selling pressure in both spot and futures trading. In short, investor interest in Ethereum is currently at very low levels.
To determine Ethereum’s short and medium-term movements, some critical levels need to be considered. An upside break of the $2,781 level could trigger a strong rebound in Ethereum and take the price to $2,992 and then to $3,131. However, if the current selling pressure persists and the price breaks below the $2,502 level, Ethereum could enter a deeper downtrend and test new lows. Global macroeconomic uncertainties, liquidity outflows and increased interest in Bitcoin suggest that pressure on Ethereum could continue.
Supports 2,501 – 2,368 – 2,114
Resistances 2,781 – 2,992 – 3,131
XRP/USDT
On February 3, XRP was one of the assets most affected by the sharp sell-off in the cryptocurrency market. Uncertainty in global markets and investors’ risk aversion caused high volatility in XRP. XRP, which lost 36.19% of its value during the day and fell to the level of $ 1.77, recovered rapidly by receiving a strong reaction from this point and continues to be priced here, rising above the $ 2.25 level again.
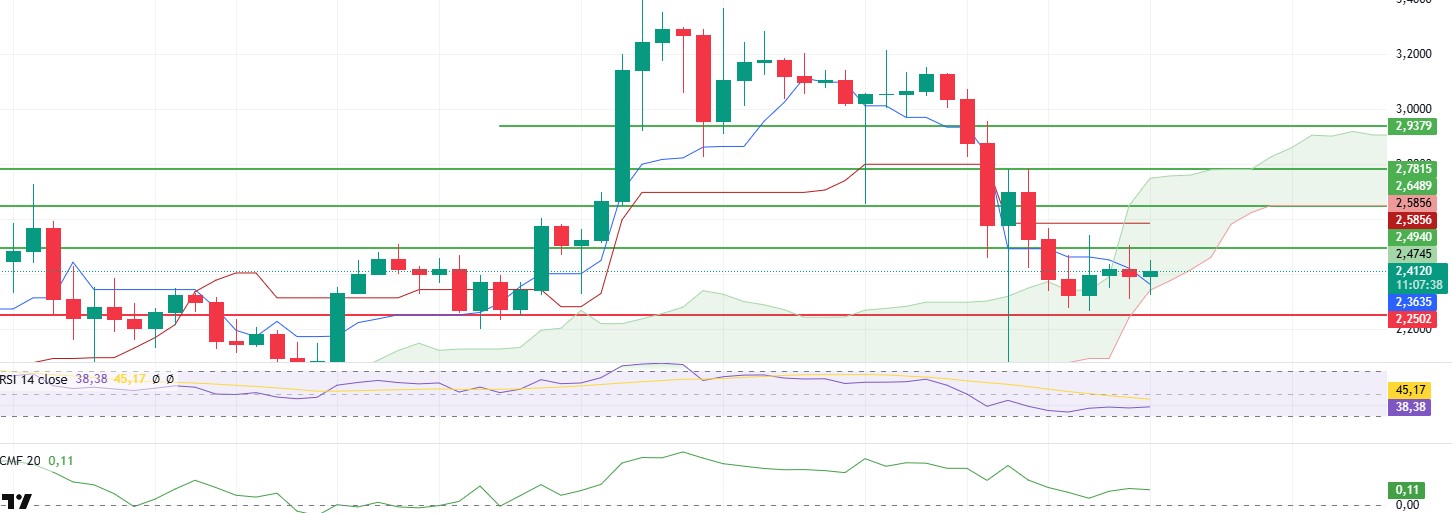
When the price action is analyzed from a technical analysis perspective, it is seen that XRP managed to stay within the cloud by reacting from the Ichimoku Kumo Cloud support on the daily timeframe. This shows that the positive outlook is maintained in the short term and the price has not fully entered the downtrend. The Chaikin Money Flow (CMF) indicator has moved upwards in recent days, indicating that liquidity inflows to the market have increased. However, the flat Relative Strength Index (RSI) indicator suggests that the price is still struggling to gain a strong momentum and there is no clear signal about the direction.
In the light of technical data, XRP’s current price movement exhibits a relatively positive structure, but the decisive levels are critical. Maintaining above the $2.49 level may start a positive trend in XRP and target higher levels. Especially if daily closures are seen above this level, it may be possible for the upward movement to gain momentum and move towards the $2.72 and $3.05 levels. On the other hand, a downside loss of the $2.25 level could cause weakness in XRP and lead the price to retreat back to the $2.10 and $1.95 support levels with increased selling pressure. In the current market conditions, it is important for traders to closely monitor volume and momentum indicators and strategize according to these critical levels.
Supports 2.2502 – 2.0201 – 1.6309
Resistances 2.4940 – 2.5391 – 2.6561
SOL/USDT
Last week, the Solana market rallied over 3.59% amid talk of alleged manipulation by a centralized exchange. The SEC accepted Grayscale’s Solana 19b-4 application, overturning previous denials. Asset manager VanEck says Solana could rise to $520 per token by the end of 2025, according to its latest market report released today. Meanwhile, Solana-based meme coin creation platform Pump.fun has been served with a cease and desist letter by two US law firms, Burwick Law and Wolf Popper, over allegations that it hosts tokens that illegally use the platform’s names and logos. Everstake announced its partnership with Fragmetric to offer staking services on SOL. The partnership will provide stakers with more flexibility and restaking rewards to reacquire their assets while maintaining liquidity. Onchain, the network has a total value locked (TVL) of more than $9.29 billion and a stablecoin market capitalization of more than $12.35 billion. On the other hand, more than 388 million SOLs have already been deposited to secure the network and generate passive income in return. On the other hand, Solana has seen a drop in the number of new addresses over the past few days. According to a report by crypto research firm Messari, application revenues on the Solana network increased by 213% in the fourth quarter of 2024. Messari said cumulative app revenues increased from $268 million in Q3 2024 to $840 million in Q4.
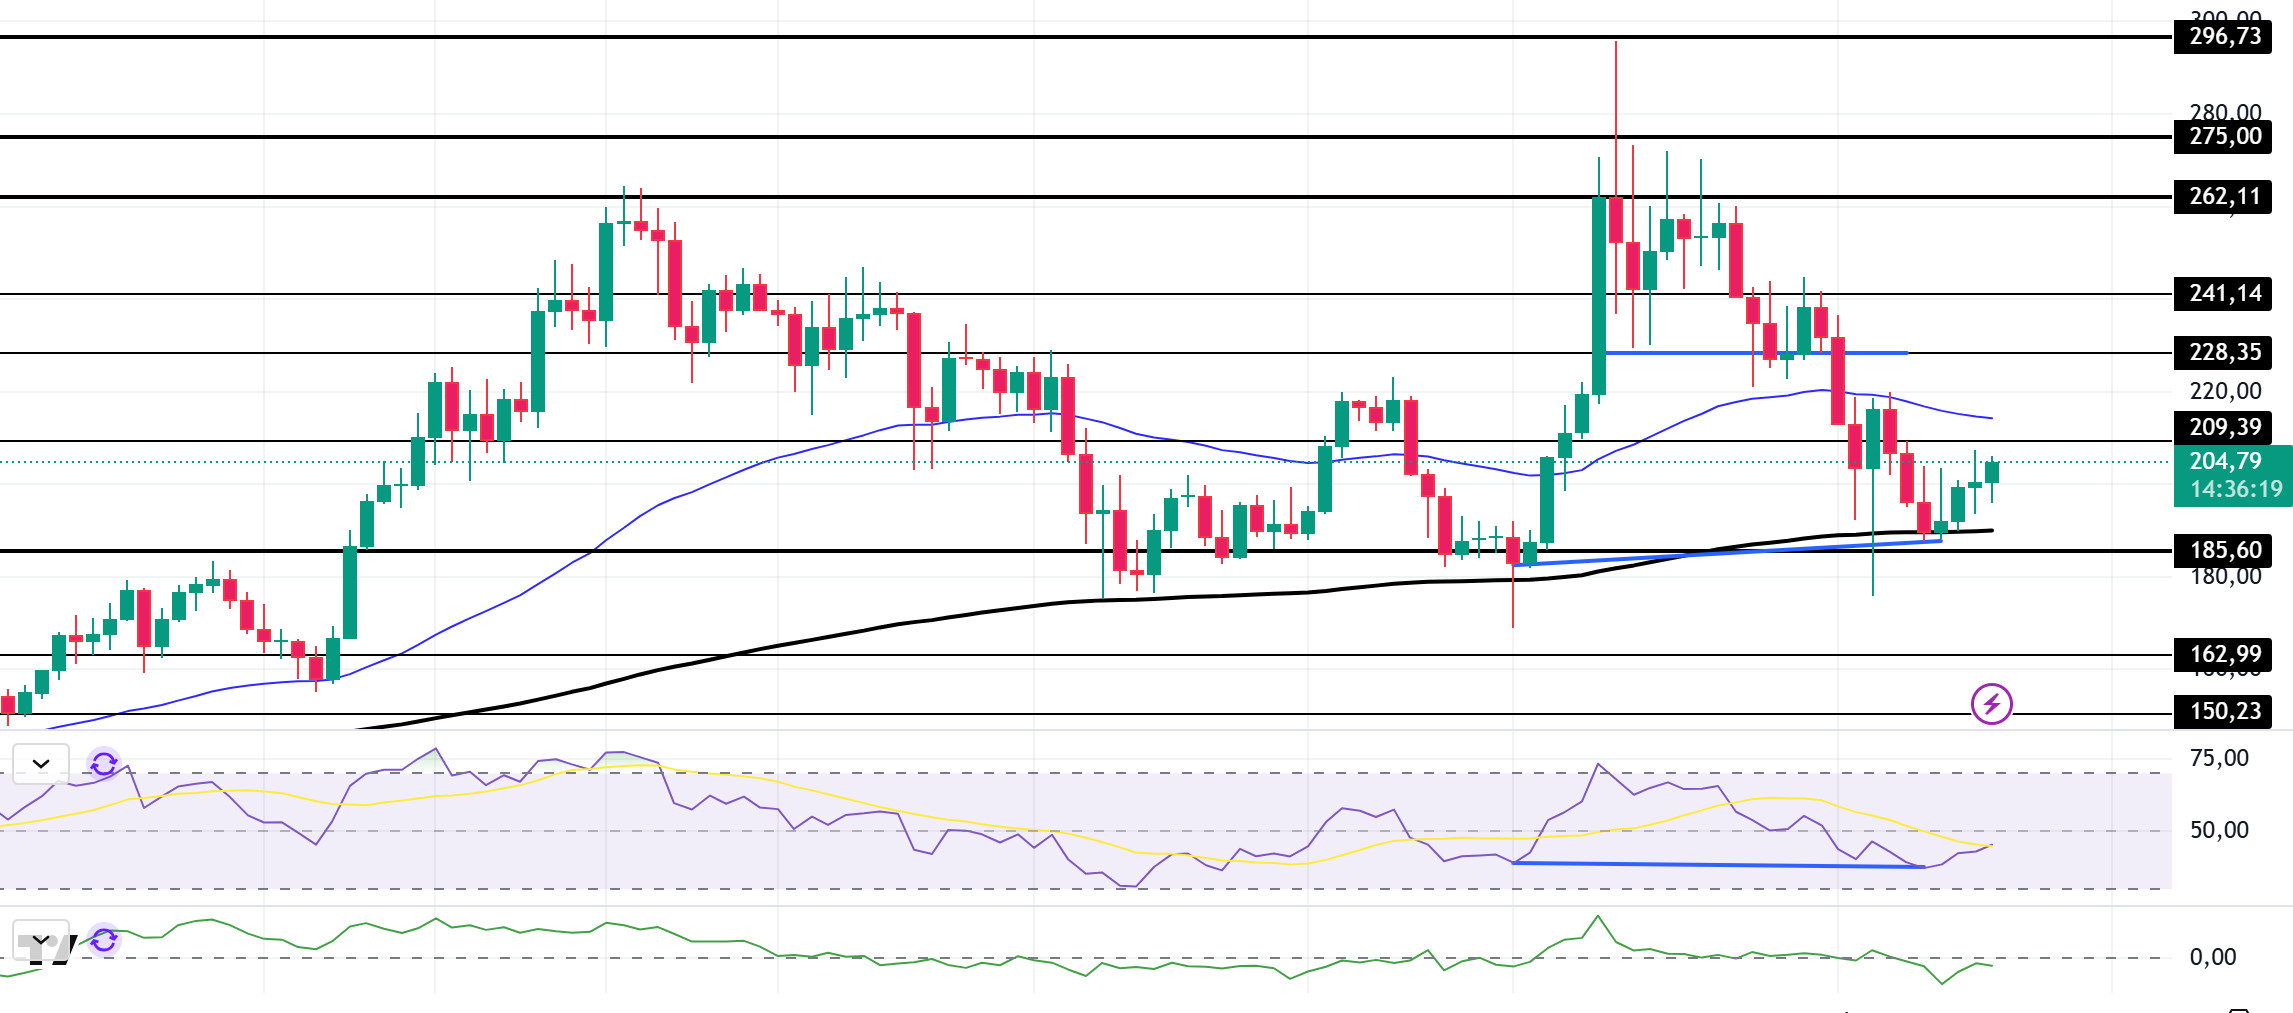
In the past week, SOL has exhibited declines in line with the broader market. The price is located between the 50 EMA (Blue Line) and the 200 EMA. As a matter of fact, the asset tested the 200 EMA (Black Line) level 2 times and started to move up with support. On our daily chart, the 50 EMA (Blue Line) continues to be above the 200 EMA (Black Line). This suggests that the trend is bullish in the medium term, but the gap between the two averages is about 13%, which could continue the pullback. The Relative Strength Index (RSI) is at the mid-level of the 14 negative zone. At the same time, there is an upside divergence in the RSI (14). However, when we examine the Chaikin Money Flow (CMF)20 indicator, it is in the neutral zone and money inflows and outflows are balanced. If the positive results in macroeconomic data and positive developments in the ecosystem continue, it may test the first major resistance level of $ 241.14. In case of negative news from macroeconomic data or the Solana ecosystem, the $ 162.99 level can be followed and a buying point can be determined.
Supports 185.60 – 162.99 – 150.23
Resistances 209.39 – 228.35 – 241.14
DOGE/USDT
Last week, asset manager Grayscale launched the Dogecoin Trust for institutional investors, a move that could signal the next Dogecoin ETF application. The US Treasury was sued for giving Elon Musk’s DOGE department access to sensitive information. The US Treasury has been accused of unlawfully allowing Elon Musk and his government efficiency organization access to the personal and financial data of millions of Americans. Publicly traded Canadian blockchain company Neptune Digital Assets Corp. purchased 1 million DOGE tokens. Neptune CEO Cale Moodie said the firm is committed to acquiring more assets while managing leverage risk.
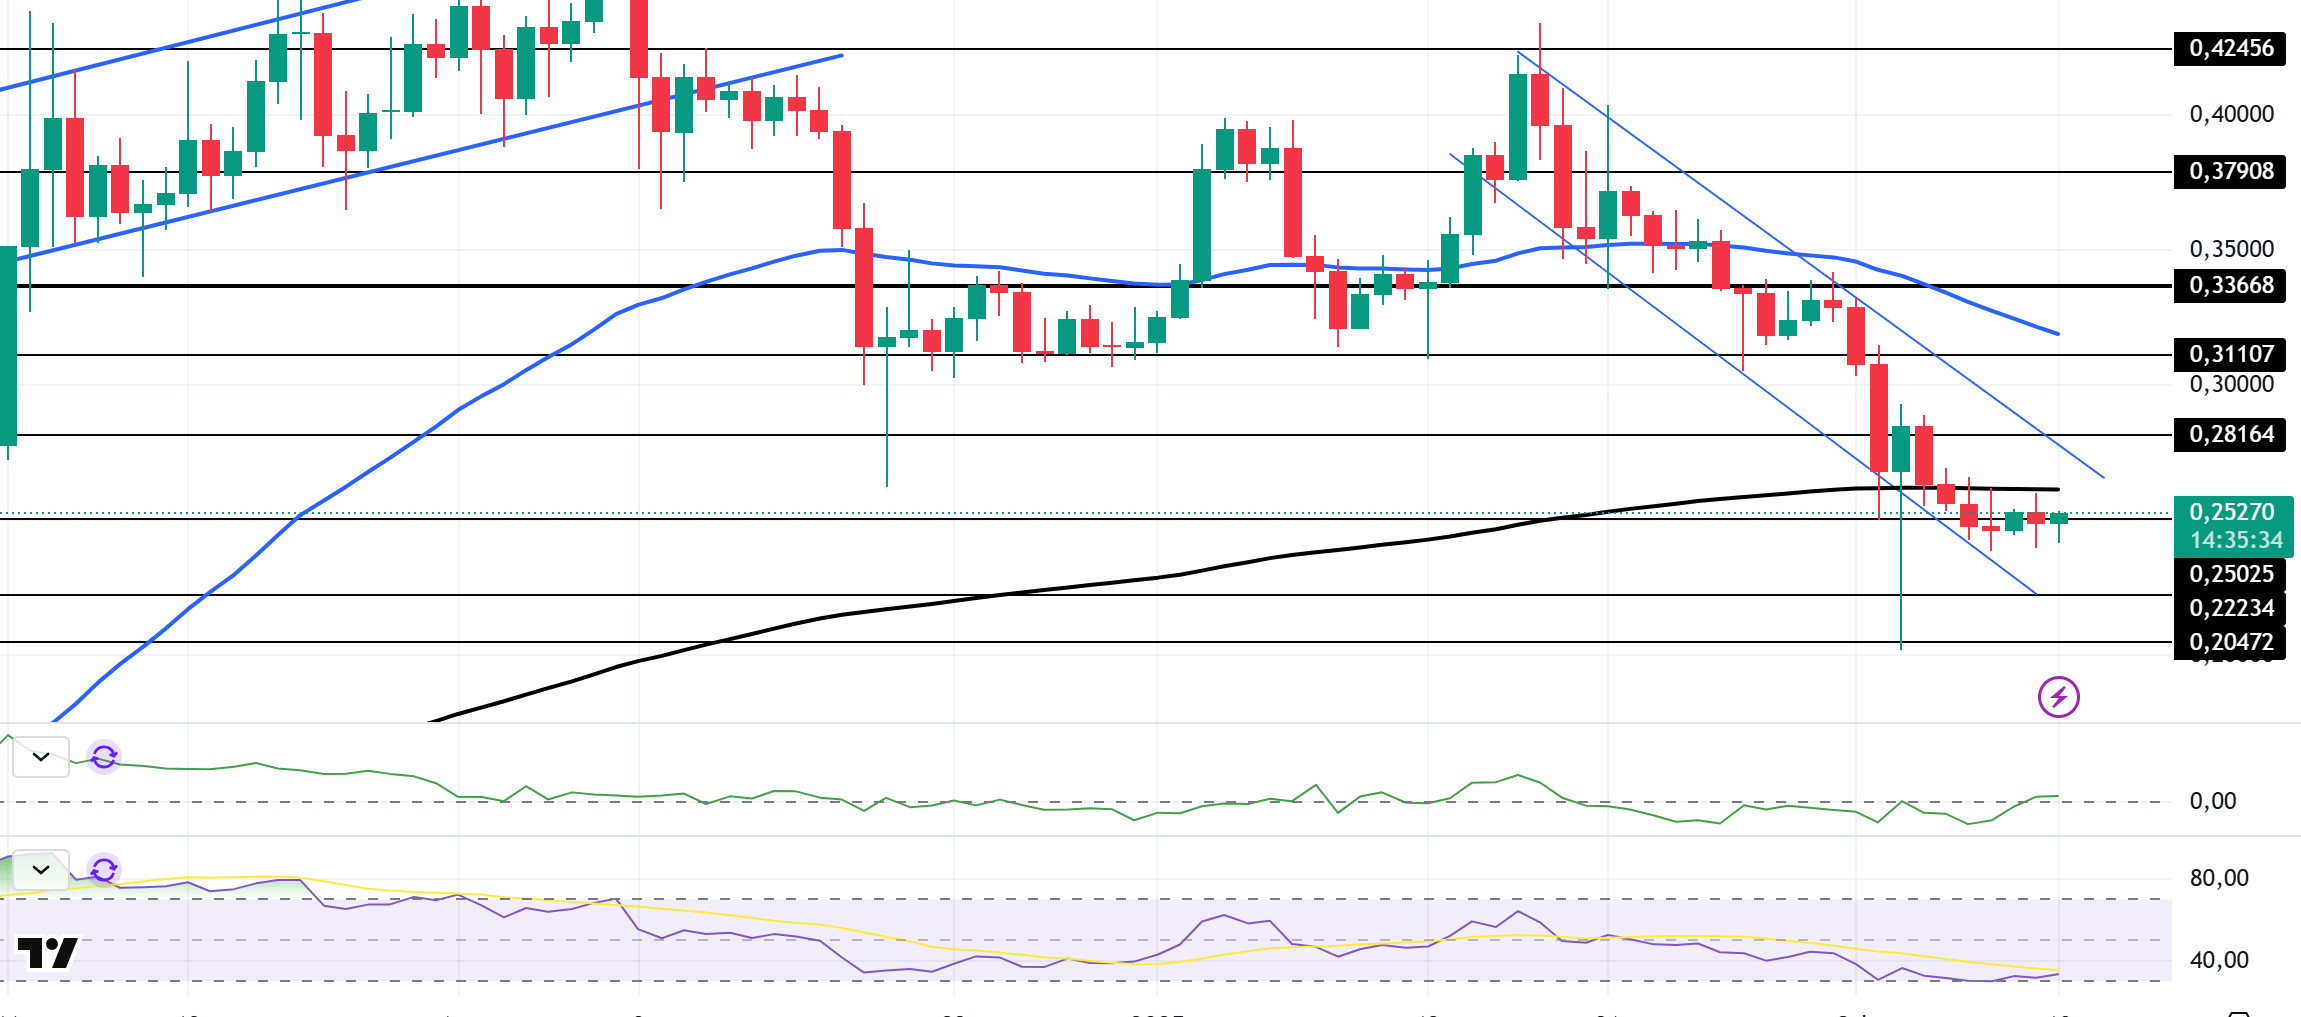
Looking at the daily chart, the asset, which has been in a downtrend since January 17, continued its decline and fell to the level of $ 0.25025. It is currently testing the 200 EMA (Black Line) as resistance. Although the 50 EMA (Blue Line) remains above the 200 EMA (Black Line), indicating that the bull continues for the asset, the difference between the two averages is about 23%, which may increase the probability of continuing to fall. If this bearish momentum continues, the asset may test the $0.20472 level once again. When we look at the Chaikin Money Flow (CMF)20 indicator, it is in positive territory, close to the neutral zone. However, money inflows have increased. Relative Strength Index (RSI)14, on the other hand, found value in the oversold zone. The asset, which was slightly up from here, tested the bottom of the downtrend as support. As of now, DOGE, which cannot break here, is on the rise. In case of possible macroeconomic conditions and negative developments in its ecosystem and pullbacks, the $0.20472 level can be followed as a strong support. In case the retracement ends and the rises begin, the 0.33668 dollar level should be followed as a strong resistance place.
Supports: 0.25025 – 0.22234 – 0.20472
Resistances: 0.28164 – 0.31107 – 0.33668
TRX/USDT
TRX, which started last week at 0.2254, rose by about 3% during the week and closed the week at 0.2321. This week, US consumer price index, unemployment benefit claims, producer price index data will be announced. Especially the consumer price index data will be closely followed by the market. If the inflation data is announced below expectations, it may be priced positively by the market.
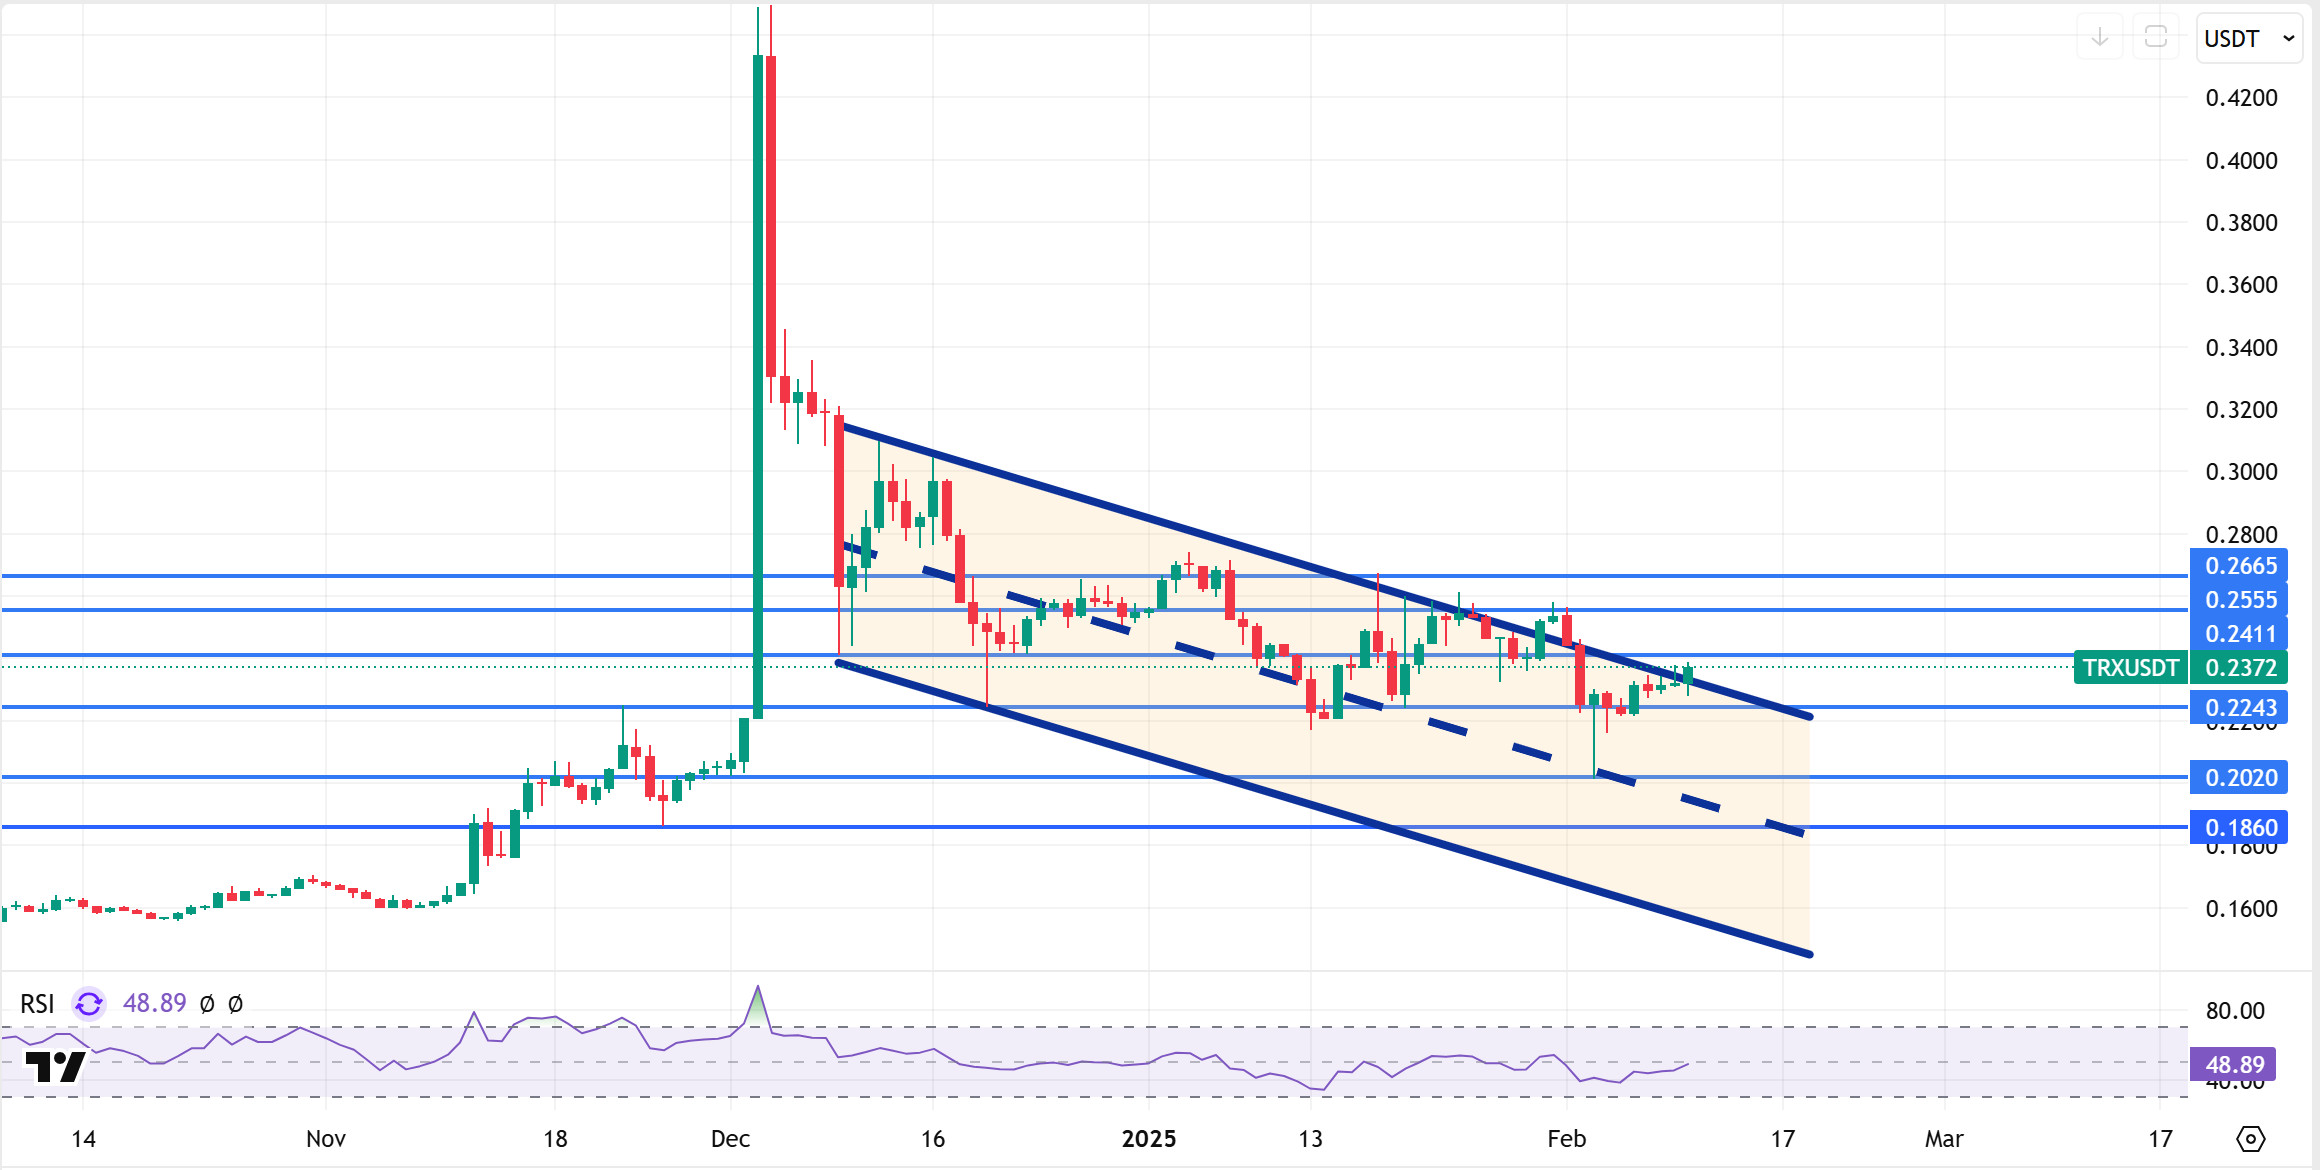
TRX, currently trading at 0.2372, is in the upper band of the bearish channel on the daily chart. With a Relative Strength Index value of 48, it can be expected to move towards the bearish channel middle band by falling slightly from its current level. In such a case, it may test the supports of 0.2243 and 0.2020. If it cannot close daily under the support of 0.2243, it may increase with the possible buying reaction and may want to break the channel upwards. In such a case, it may test 0.2411 and 0.2555 supports. As long as it stays above 0.1860 support on the daily chart, the bullish demand may continue. If this support is broken, selling pressure may increase.
Supports 0.2243 – 0.2020 – 0.1860
Resistances: 0.2411- 0.2555 – 0.2665
AVAX/USDT
After starting trading at $ 27.61 on the opening day of last week, AVAX fell sharply to $ 21.21. Although it recovered later, it fell to $24.86 with the selling pressure throughout the week and closed the week with a weekly loss of 9.96%. The tariff decisions taken by the US increased uncertainty in global markets and reduced investors’ risk appetite. This led to strong pullbacks in the crypto market.
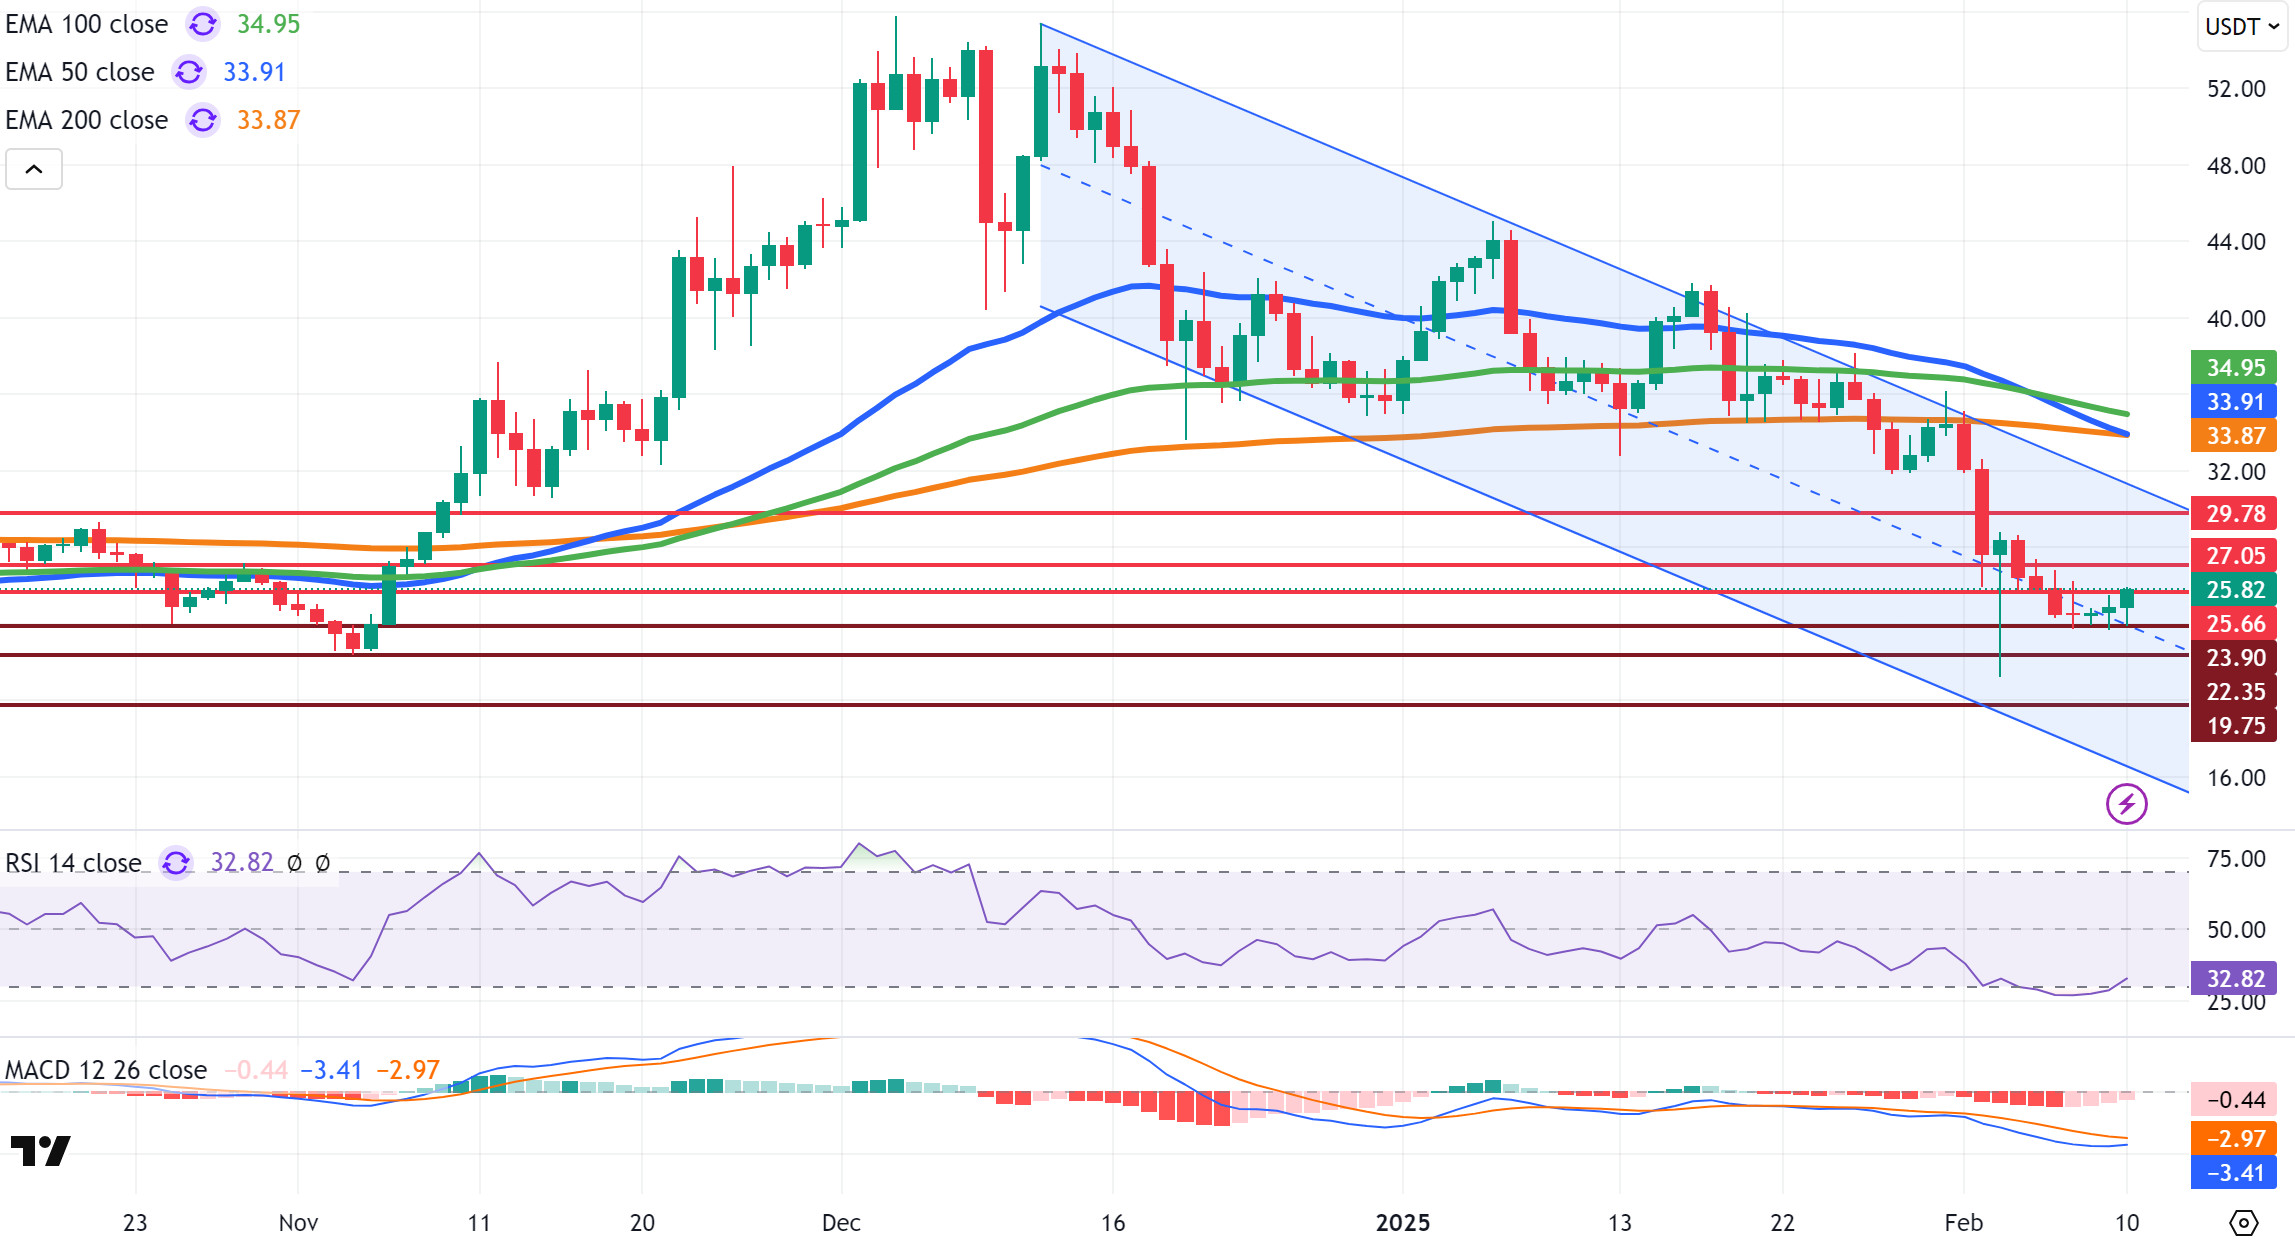
The Moving Average Convergence/Divergence (MACD) indicator is in negative territory, moving below the signal line. This indicates that selling pressure remains and negative momentum is still strong. AVAX is trading below the critical Exponential Moving Average (EMA) levels, namely EMA50 (33.91), EMA100 (34.95) and EMA200 (33.87). Especially below the EMA50 suggests that the price may remain bearish in the short term. If the MACD indicator continues its downward movement, it may test the $23.90 support level. If this support is broken, AVAX could fall as low as $22.35 and then $19.75. In contrast, a rebound of the MACD indicator into positive territory and an upside cross of the signal line could prompt an upside reaction from AVAX. In this case, if the $25.66 resistance level is tested and broken, it could move towards the $27.05 and then $29.78 resistance levels.
AVAX is trading close to critical support levels and selling pressure is still ongoing. However, as the RSI indicator is close to the oversold zone, there is a possibility of an upward movement with reaction purchases in the short term.
(EMA50: Blue Line, EMA100: Green Line, EMA200: Orange Line)
Supports 23.90 – 22.35 – 19.75
Resistances 25.66 – 27.05 – 29.78
SHIB/USDT
The Shiba Inu (SHIB) burn rate increased by 807% in the last 24 hours, resulting in 20.53 million SHIBs being removed from circulation. This spike in the daily burn rate indicates the SHIB community’s continued efforts to reduce supply. On the other hand, large investor net flows skyrocketed by 5,277% to reach 3.5 trillion SHIBs. This indicates that whales are buying heavily and strengthening their long-term positions in the market. The fact that outflows are decreasing while large investor inflows are increasing suggests that confidence in SHIB remains intact and the price has the potential to rebound. If this trend continues, we may see positive movements in the SHIB price thanks to decreasing supply and increasing demand.
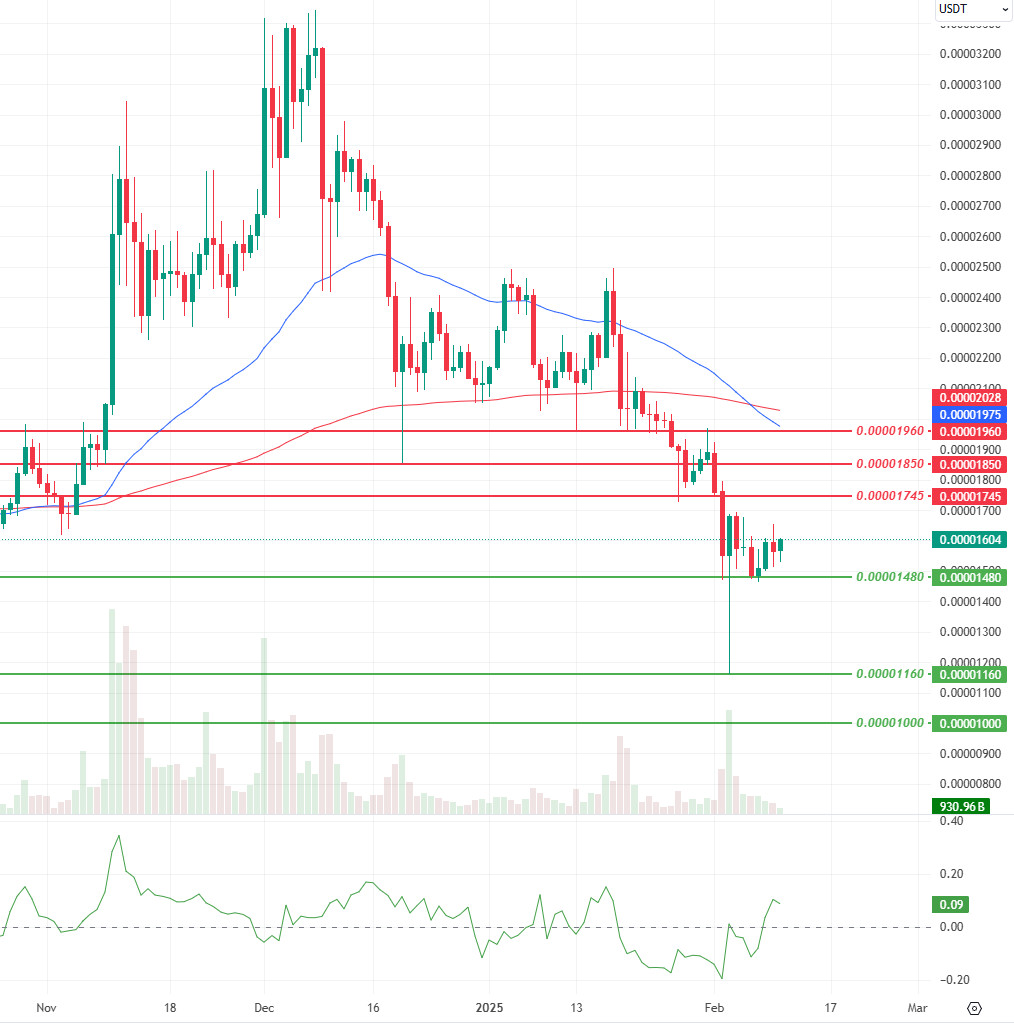
Shiba Inu (SHIB) technical analysis shows that the low momentum and decreasing trading volume seen last week seems to have been replaced by a stronger buyer pressure. The CMF (Chaikin Money Flow) oscillator hovered in the positive area at 0.09, indicating that the money entering the market is increasing and buyers are more dominant. Moreover, the increase in trading volume strengthened the price’s reaction from the $0.00001160 support level and SHIB managed to hold above the $0.00001480 resistance level. The decline in volatility suggests that the market has become more balanced and SHIB is more likely to hold at these levels. In this context, if the price continues to stay above the $0.00001480 level, a move towards the next resistance level of $0.00001745 may be observed.
In the negative scenario, the EMA50 (Blue Line) is seen to break below the EMA200 (Red Line). This may strengthen the downtrend. The first support level is the 0.00001480 dollar level and with the loss of this level, the risk of retracement towards the 0.00001160 dollar support levels may increase. If buyers do not step in at these levels, the decline may deepen.
Supports 0.00001480 – 0.00001160 – 0.00001000
Resistances 0.00001745 – 0.00001850 – 0.00001960
LTC/USDT
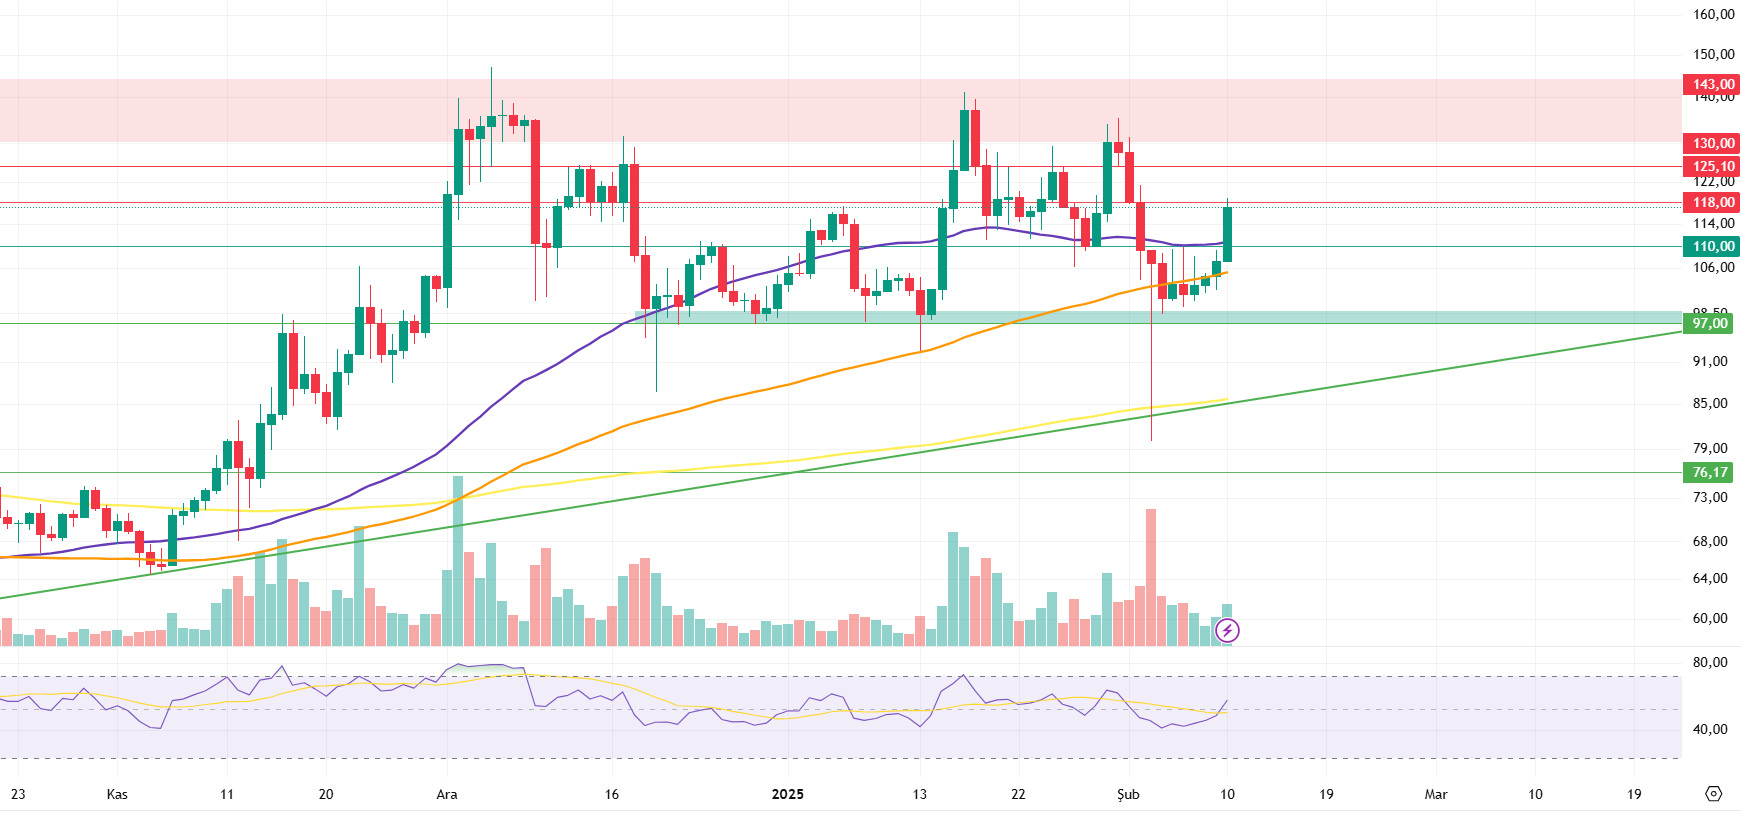
Litecoin (LTC), which lost 1.77% of its value last week with the bearish fluctuations in the market, started to rise today with CoinShares’ ETF application. However, LTC, which continues to be affected by the downward pressure on Bitcoin and the overall market, started the week at 107.13. According to Arkham data, open positions increased from $ 222 million on Monday last week to $ 330 million at the beginning of the week, and negative funding rates started to turn positive. It rose to 19th place in the market capitalization ranking.
On the daily chart, LTC remains above its 100-day moving average and has broken above the 50-day moving average (purple line) today. Testing the 118.00 horizontal resistance, if LTC breaks this level, it could reach the 125.10 horizontal resistance and then the horizontal major resistance band starting at 130.00. In a possible bearish scenario, the loss of support at 110.00 could cause the price to move back towards the green band at 97.00 . This support is a critical zone and if it is broken, the price is likely to move down to 85.80, where the 200-day moving average (yellow line) and the uptrend support are located.
Resistances 118.00 – 125.10 – 130.00
Supports 110.00 – 97.00 – 85.80
LINK/USDT
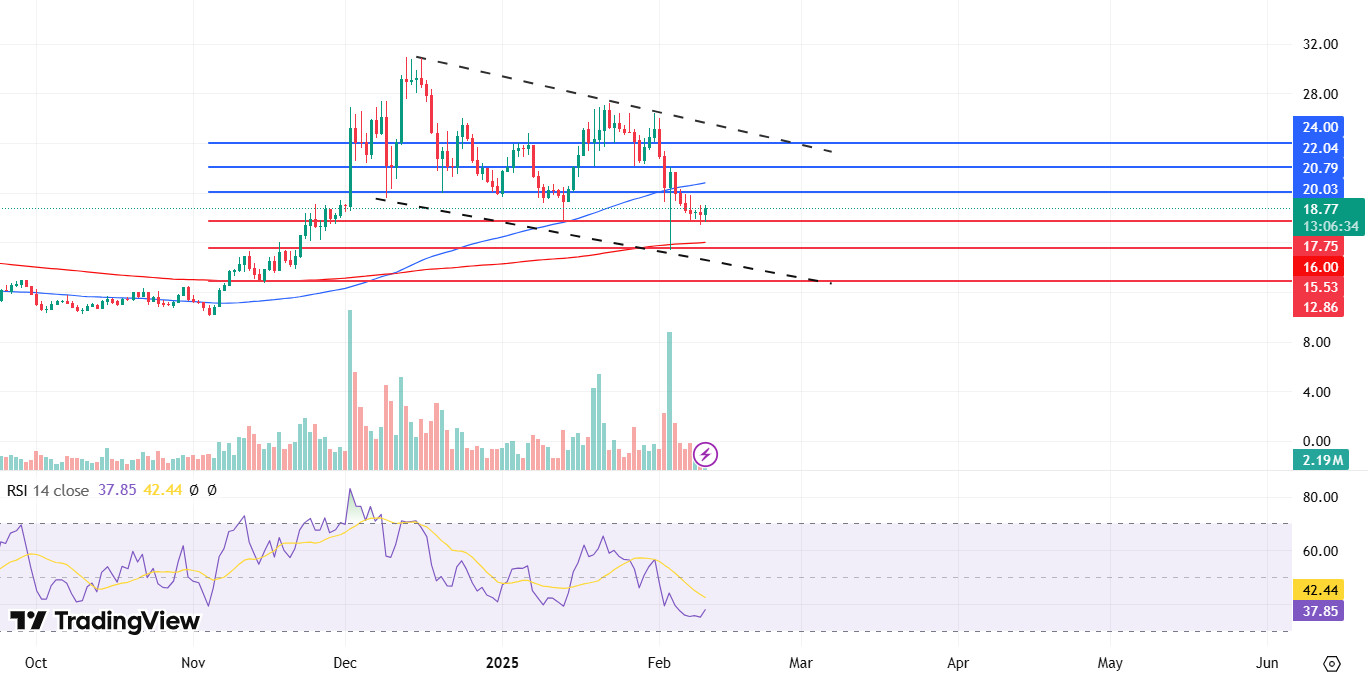
Link price action continues to move within a falling channel. In the last price action, the price touched the lower band of the channel and experienced strong volatility at the $17.75 level before staging a short-term rebound to reach the $18.77 level. Currently, the $ 17.75 level stands out as a strong support. However, if this level cannot be maintained, the price is likely to experience a pullback towards the $ 15.53 and $ 12.86 levels. These regions are critical as they point to both channel support and long-term support levels.
On the other hand, the RSI indicator is in negative territory at 37.85 and does not signal any turnaround, which increases pessimism among market participants. If the selling pressure continues, the possibility of the price moving towards the lower supports may strengthen.
On the upside, the $20.79 level is an important resistance point as it intersects the 100-day moving average (SMA100). In case of persistence above this level, the price is likely to target the resistance levels of $ 22.04 and $ 24.00. However, in order to talk about a new uptrend, the price needs to break the $24.00 level on volume and move above the channel resistance.
(SMA200: Red Line, SMA100: Blue Line)
Supports 17.75 – 15.33 – 12.86
Resistances 20.03 – 22.04 – 24.00
BNB/USDT
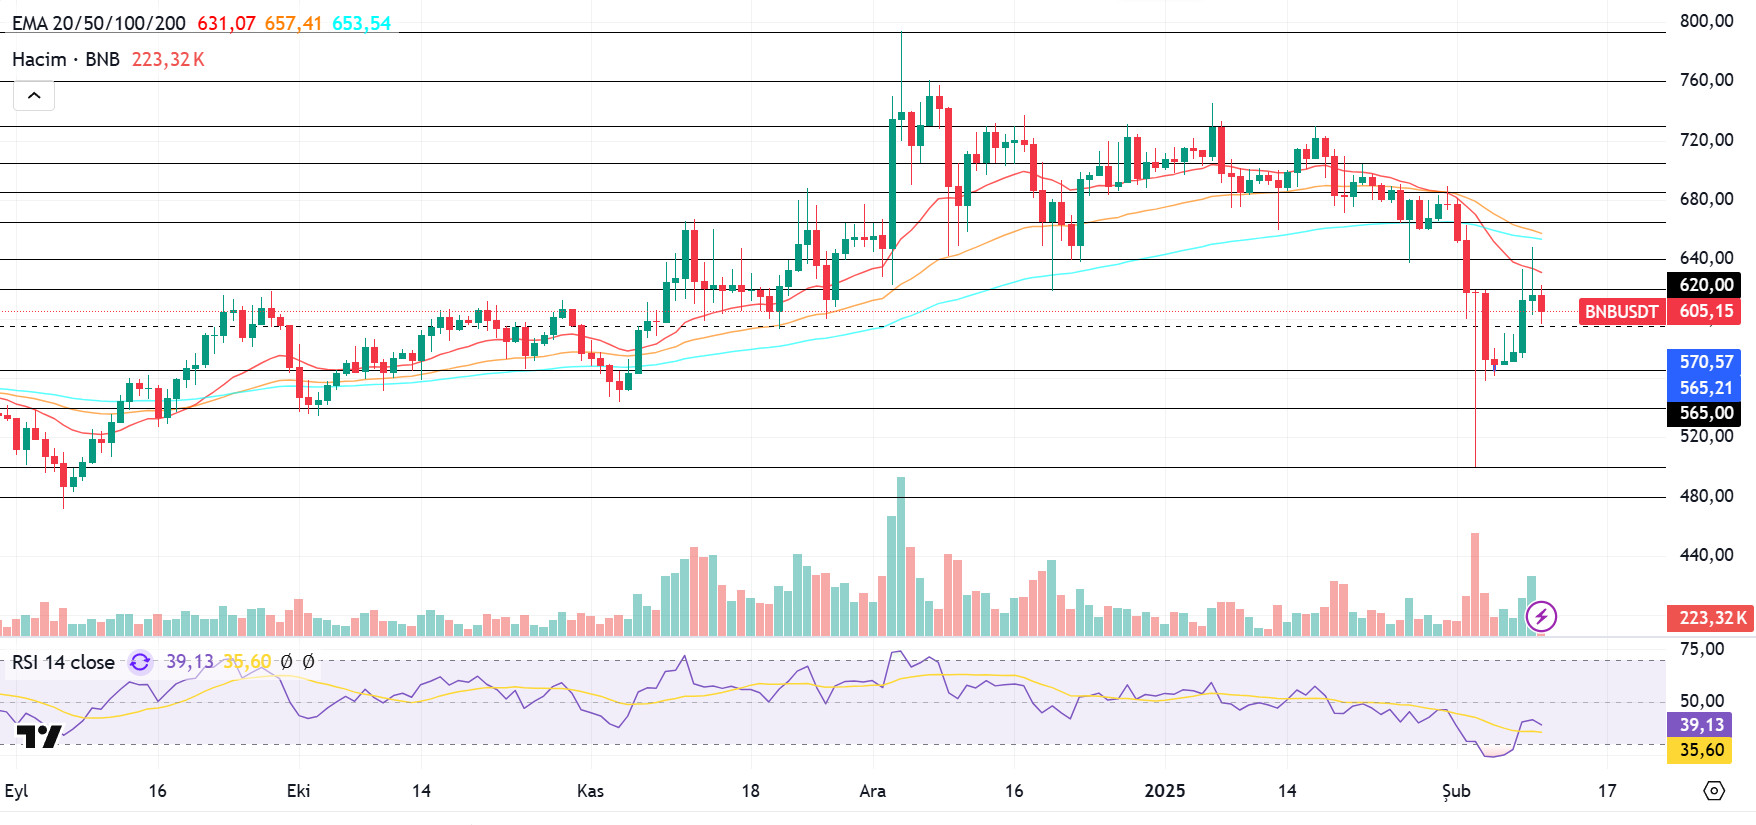
BNB/USDT, which retreated to $ 500 at the beginning of last week (Monday, 03 February), recovered from this level and completed the day with a close just below the $ 620 level. However, due to the increased selling pressure at these levels, the asset lost value again and fell to $565. As of 06 February, BNB/USDT, which showed a positive acceleration, managed to rise to the $ 650 level on 09 February, the last day of the week.
However, the asset, which faced selling pressure with the start of the new week, retreated to $595. Although it showed a partial recovery from this level, it remains below the EMA 20 (red line), EMA 50 (orange line) and EMA 100 (blue line), maintaining its negative outlook.
Volume indicators reveal that the positive candles formed with the buying support seen as of 06 February increased the buying volume. Accordingly, strong and positive trading volume is needed for the price to regain a positive momentum as of the new week. On the other hand, the RSI indicator moved in line with the price movements and fell below the 50 level. The fact that the RSI remains below these levels indicates that selling pressure may continue.
In this context, if the negative momentum observed at the beginning of the new week continues, the price is expected to retreat towards the $ 595 level. If $ 595 is broken downwards, there is a possibility of a retreat to $ 565 and $ 540, respectively. On the other hand, a possible support that can be taken from the $ 595 level can contribute to the price rising towards $ 620 again. If $ 620 is broken upwards, the $ 640 and $ 665 levels will be followed as new resistance zones.
Supports 595 – 565 – 540
Resistances 620 – 640 – 665
ADA/USDT
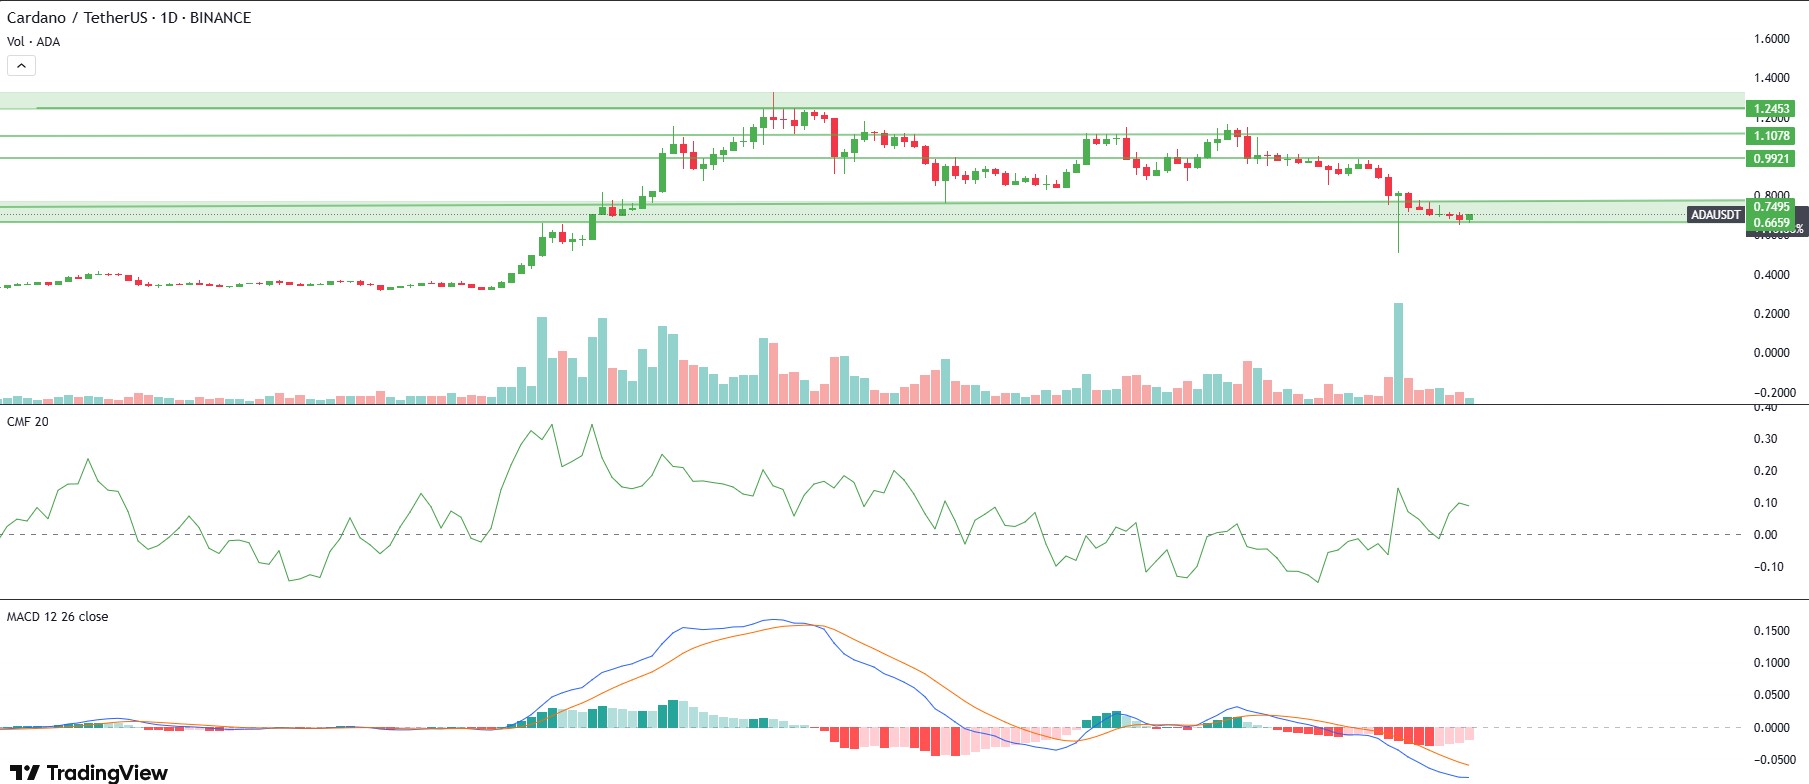
Yesterday, the news that China will impose tariffs of up to 15% on US energy and vehicles led to some decline in the market. ADA, which continued at $ 0.8231 last week, ended the week at $ 0.6474 due to the general sell-off in the market. The upcoming ADA cashback integration with Walmart represents an important milestone for Cardano. Cashback integration; The cashback program can increase retail user interest and engagement by encouraging everyday consumers to interact with the Cardano ecosystem.
Technically, it continues its downside potential by continuing its horizontal movement in the green zone since last week. The Moving Average Convergence/Divergence (MACD) indicator is in negative territory below zero and may change its trend direction if it crosses the signal line to the downside. CMF (Chaikin Money Flow) continues its negative trend. If CMF stays above the 0.15 level, it may change the trend direction and approach the upside. In this case, ADA’s rise may test the $1.0023 resistance level. In case these resistance levels are broken to the upside, the uptrend may continue up to 1.1078 resistance levels. In a possible volatility scenario, if ADA’s price falls, it may retest the $0.6662 support level and the .5745 support level. In case these support levels are broken, the decline may deepen.
Supports: 0.5745 – 0.6662 – 0.9973
Resistances: 1.0023 – 1.1078 – 1.2265
LEGAL NOTICE
The investment information, comments and recommendations contained in this document do not constitute investment advisory services. Investment advisory services are provided by authorized institutions on a personal basis, taking into account the risk and return preferences of individuals. The comments and recommendations contained in this document are of a general type. These recommendations may not be suitable for your financial situation and risk and return preferences. Therefore, making an investment decision based solely on the information contained in this document may not result in results that are in line with your expectations.

