
Fear & Greed Index
Source: Alternative
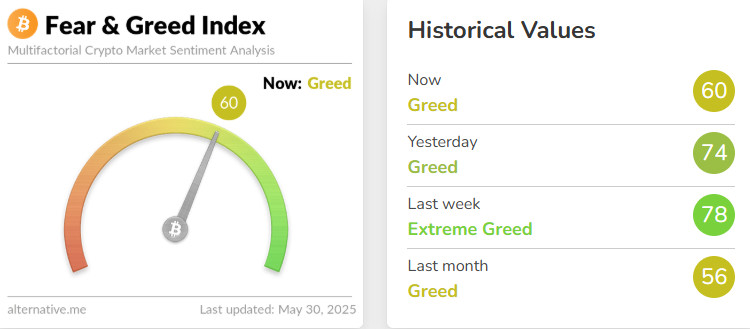
Change in Fear and Greed Value: -18
Last Week’s Level: 78
This Week’s Level: 60
The Fear and Greed index declined from 78 to 60 this week, indicating a significant weakening in market sentiment. Developments regarding trade policies and economic management, especially in the US, caused investors to take cautious positions. Although Donald Trump’s decision to postpone the 50% tariffs on the European Union until July 9 initially eased tensions, the subsequent court rulings and appeals against these rulings increased uncertainties. While the content of the meeting with Fed Chairman Jerome Powell at the White House remains unclear, the market continues to carefully monitor such contacts.
However, Strategy’s recent purchase of 4,020 BTC ($427.1 million) at an average of $106,237 and GameStop’s purchase of 4,700 BTC showed that institutional demand remains strong. Telegram’s plan to raise $1.5 billion in funding with the participation of giant investors such as BlackRock, Mubadala and Citadel signaled continued institutional interest in the Web3 ecosystem. However, despite these positive developments, a cautious mood prevailed throughout the market due to the uncertainties on the policy side. Although institutional purchases and capital flows generated positive signals, there was a clear weakening in investor confidence this week.
Fund Flow
Source: CoinShares
Overview
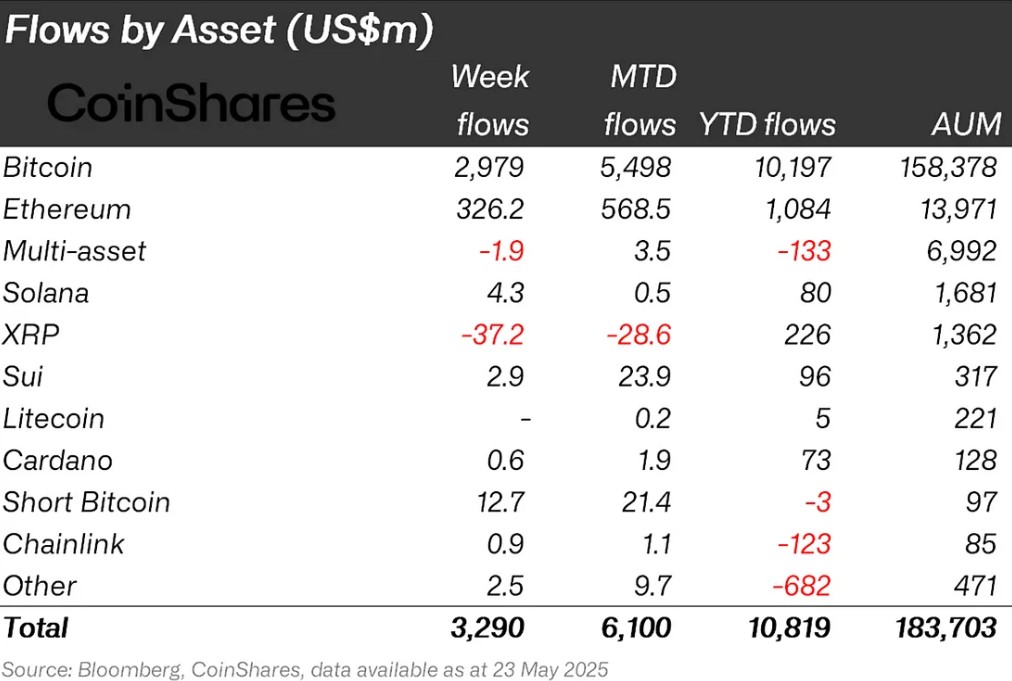
The crypto market had a week of ups and downs due to macroeconomic uncertainties and regulatory news. Although the correction in Bitcoin reached 4%, dragging the overall market down, positive news from important institutions such as the SEC and institutional participation were considered as an important development for the sector.
Fund Entries
Bitcoin (BTC): Texas joins the ranks of US states creating official Bitcoin reserves. The SB 20 bill, passed on May 2025, 21, authorizes the state government to invest for 12 months in digital assets with a market value exceeding $500 billion.
Short Bitcoin: Inflows into short bitcoin positions totaled $12.7 million.
Ethereum (ETH): Following the rise in cryptocurrencies with the progress in layer-2 technologies, the expansion of the stablecoin ecosystem and the increase in institutional demands, the Ethereum network saw an inflow of 326 million dollars and its price reached $ 2,788.
SUI: Cetus, a major decentralized exchange (DEX) in the Sui ecosystem, suffered a major cyberattack. 21Shares filed a formal application with Nasdaq for a new exchange-traded fund (ETF) that will track the spot price of SUI, the native token of the Sui blockchain. During this period, the SUI network saw inflows of $2.9 million.
Cardano (ADA): The SEC postponed the Grayscale Spot Cardano ETF decision. With this news, an inflow of 0.6 million dollars was seen this week.
Chainlink (LINK): Tron Dao announced an agreement with Chainlink as the official oracle solution. It will provide services to the Tron ecosystem, which has about $ 6 billion of Defi TVL. With this development, there was an entry of $ 0.9 million.
Other: In addition to all these developments, the US blocking chip imports to contain China’s technological rise has a negative impact on Bitcoin and altcoins.
Solana (SOL): Bitwise postponed the decision to convert the SOL Crypto Index Fund into an ETF. Activity on the Solana network saw $4.3 million in inflows.
Fund Outflows:
Multi-asset: The US SEC announced that it will hold a panel discussion on “DeFi and the American Spirit” on June 9. There was a net outflow of $34.29 million from the ARKB ETF. Total outflows from digital funds this week were -1.9 million dollars.
Ripple (XRP): Met with UAE officials at the Dubai FinTech Summit to discuss crypto regulation and blockchain adoption. Later in the week, the SEC delayed the 21Shares Spot XRP ETFs, resulting in an outflow of $37.2 million on XRP.
Total Market Cap
Source: Tradingview
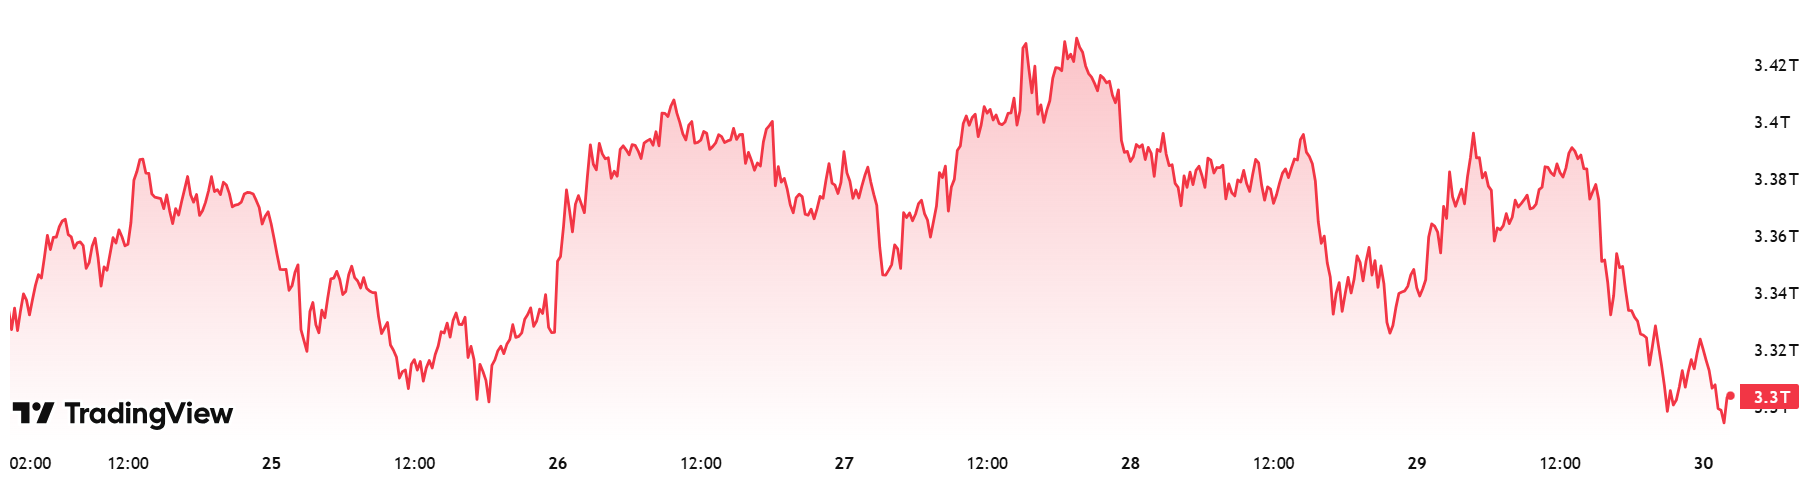
- Last Week Market Capitalization: 3.37 trillion Dollars
- Market Capitalization This Week: 3.3 trillion Dollars
This week, the total market capitalization in the cryptocurrency market fell by $69.12 billion, down 2.05%. With this movement, the total market capitalization fell to 3.3 trillion dollars.
Total 2
Total 2 started the new week with a market capitalization of $1.21 trillion, down 0.75% to $9.02 billion. With this movement, it fell to $ 1.2 trillion.
Total 3
Total 3, which started the week at $ 899 billion, fell 2.18% to $ 880 billion, with a loss of $ 19 billion on a weekly basis.
Bitcoin Dominance
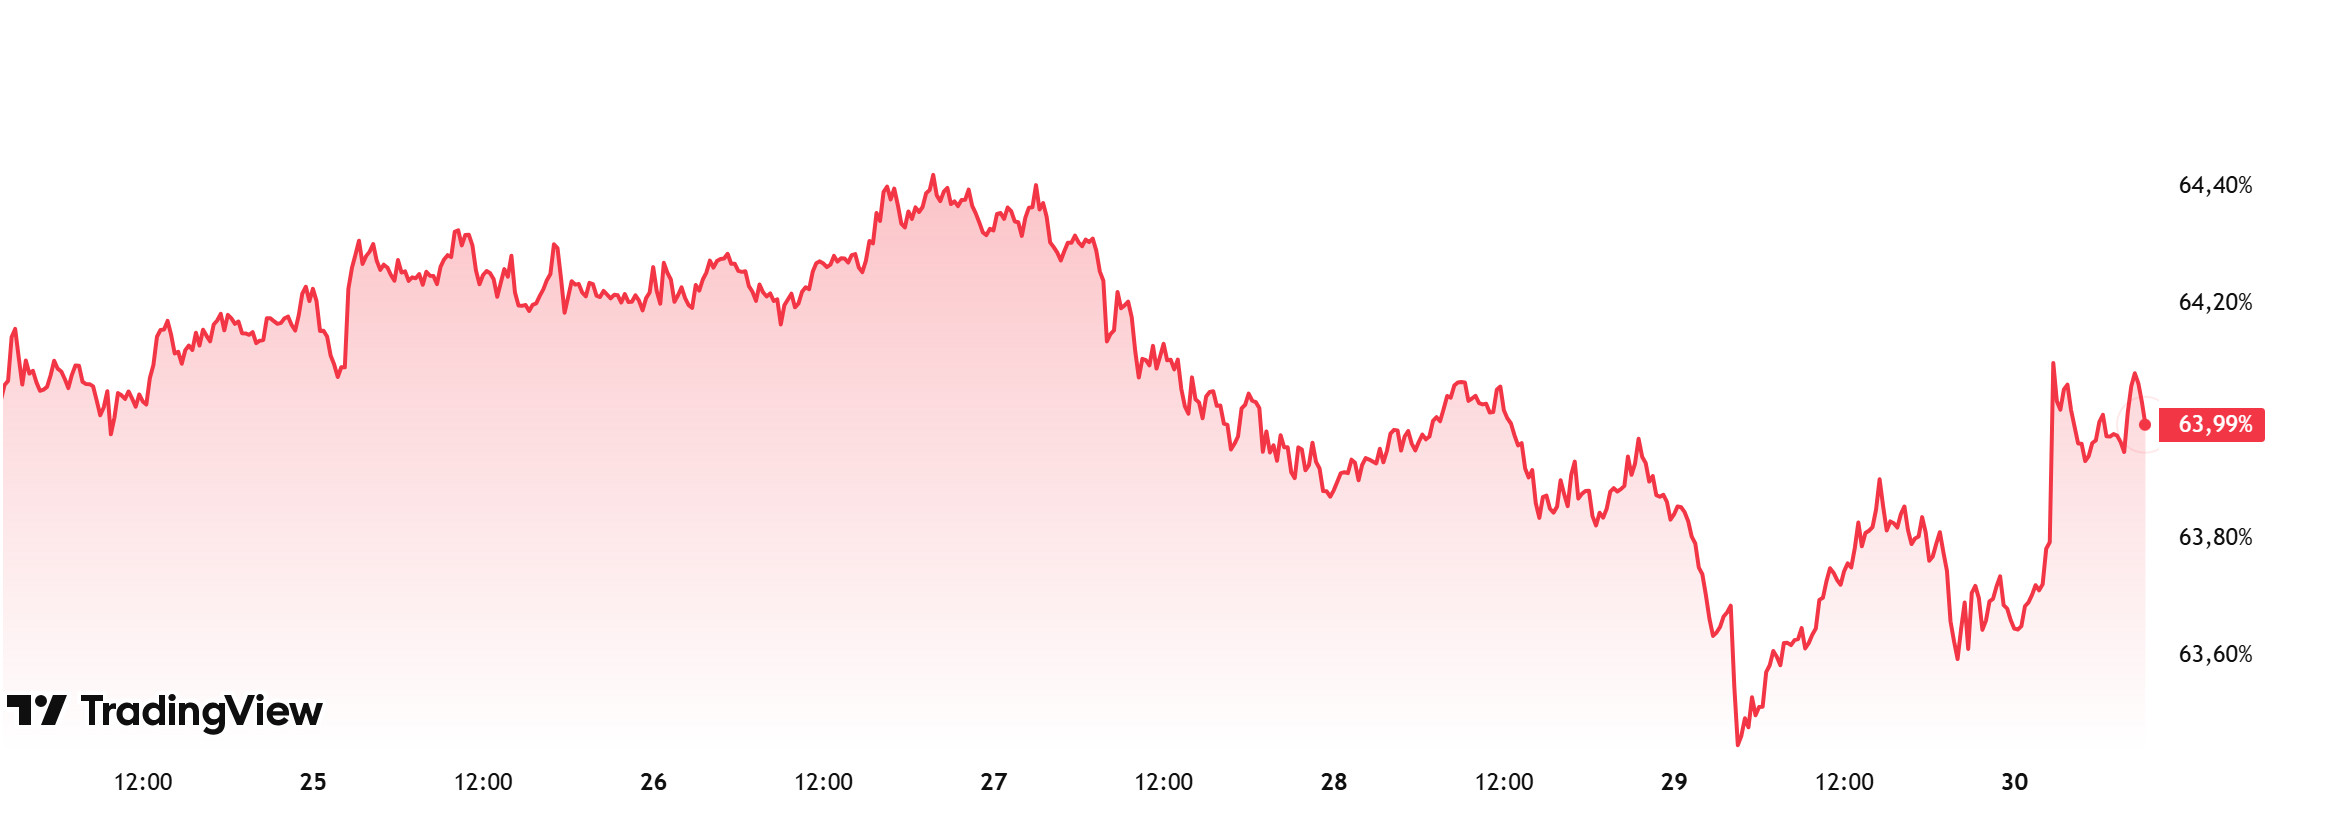
Source: Tradingview
Bitcoin dominance, which started the week at 64.21%, retreated towards the middle of the week and fell to 63.47%. After this correction, the dominance, which entered the recovery process, is currently at 63.99%.
This week, Strategy purchased 4,020 Bitcoin and Gamestop purchased 4,710 Bitcoin. In addition, Metaplanet announced that it will issue $50 million in zero-interest bonds to increase its Bitcoin holdings.
Data on Bitcoin spot ETFs show a total net inflow of $458.82 million to date.
Recently, the price performance of Ethereum and other altcoins has been weak in BTC parity, leading to a decline in altcoin market dominance and a slight increase in Bitcoin dominance. This suggests that investor interest is still in Bitcoin.
Continued institutional investor interest and increased net inflows into spot ETFs continue to create a constructive mood across the market. However, despite these supportive factors, altcoins have exhibited relative weakness against Bitcoin. In light of the current technical and fundamental data, it seems likely that Bitcoin dominance will consolidate in the 62%-64% band next week.
Ethereum Dominance
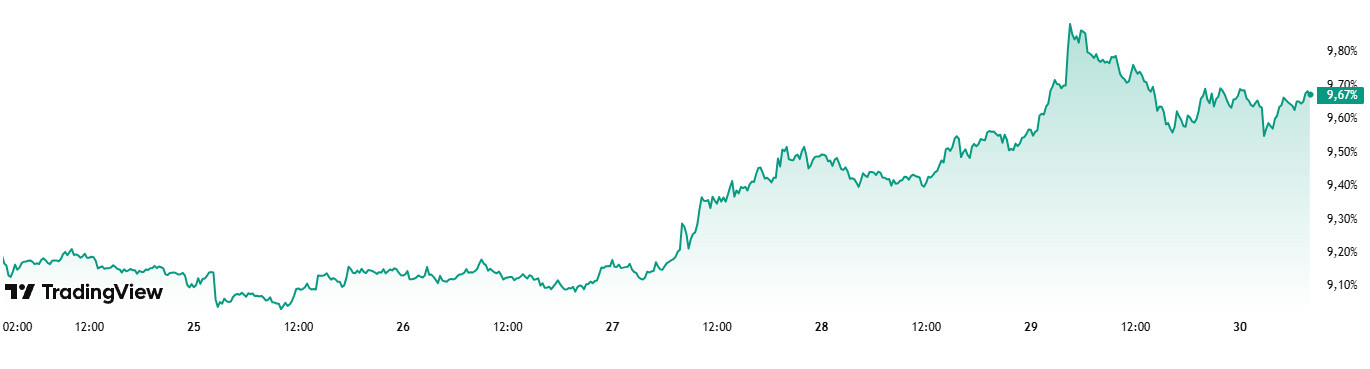
Source: Tradingview
Weekly Change
- Last Week’s Level: 9.13%
- This Week’s Level: 9.67%
Ethereum dominance continued the upward momentum it started six weeks ago, rising towards 10% as of the current week. In addition, a total net inflow of $274.2 million in Spot Ethereum ETFs between May 23 and 29, 2025 contributed to this rise.
In this context, Ethereum dominance ended last week at 9.13% and is hovering at 9.67% as of the current week.
In the same period, Bitcoin dominance performed relatively weakly and showed a downward trend in contrast to Ethereum. This indicates a shift in capital allocation within the market in favor of Ethereum.
On the other hand, Consensys founder and Ethereum co-founder Joseph Lubin wrote in the Financial Times that the current financial system faces structural pressures such as a crisis of confidence, high inflation and accumulated debt. Lubin argued that blockchain networks like Ethereum could do for the financial world what HTTP did for the internet in the 1990s. The goal is not to eliminate traditional banks or fiat money, but to create an open financial architecture that can work with them, and this system has been adopted by institutions such as BlackRock and JPMorgan. Lubin’s statement is a clear indication of Ethereum’s vision.
Bitcoin Spot ETF
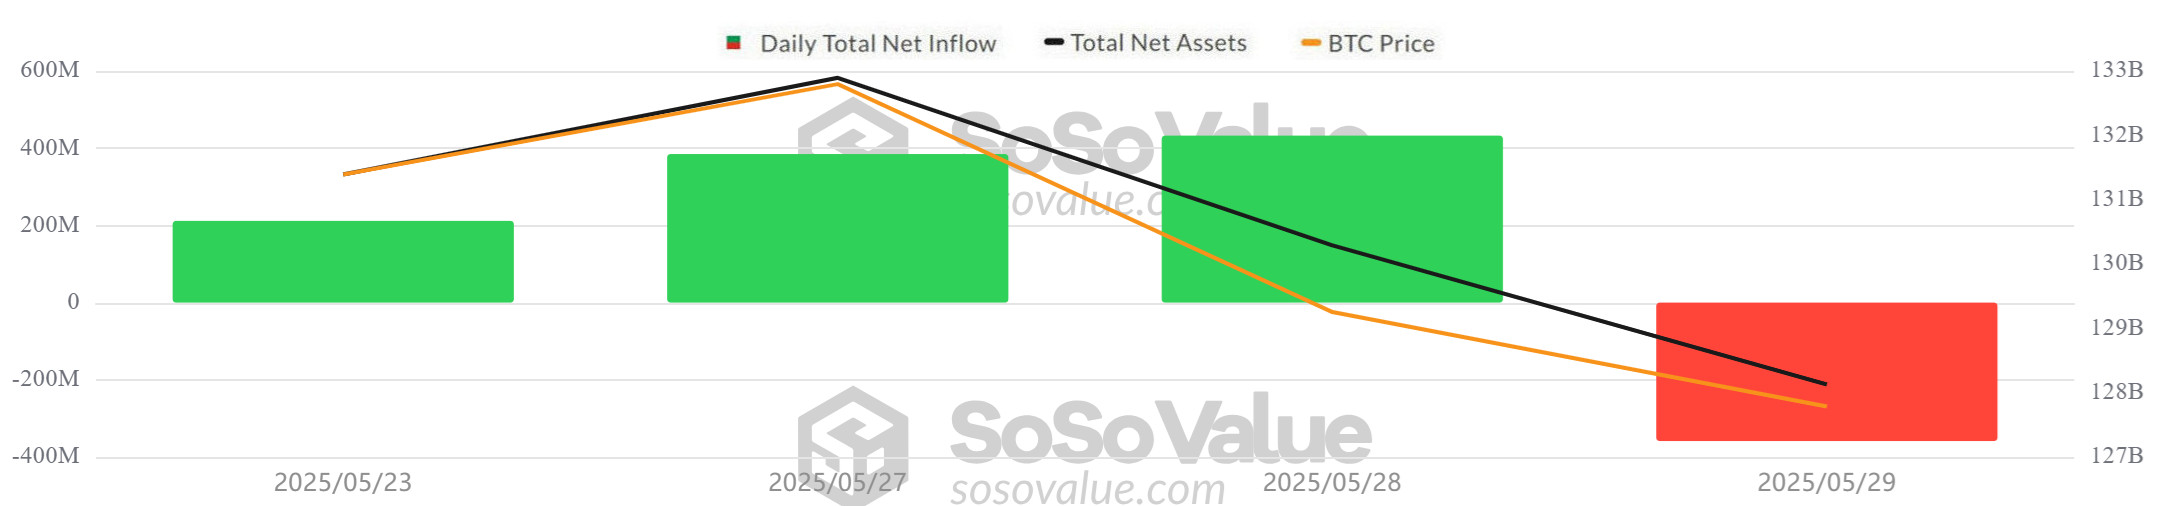
Source: SosoValue
NetFlow Status: Spot Bitcoin ETFs saw a total net inflow of $683.0 million between May 23-29, 2025. The highest inflow day was recorded on May 28 with $432.7 million. In the said date range, BlackRock’s IBIT ETF had a total inflow of $1.446 billion, while Grayscale GBTC ETF had a net outflow of $223.6 million, Fidelity FBTC ETF had a net outflow of $258.8 million and Ark ARKB ETF had a net outflow of $235.7 million. The 10-trading-day positive net flow series ended on May 29 with an outflow of $346.8 million.
Bitcoin Price: Bitcoin started the day at $111,696 on May 23 and closed at $105,589 on May 29. During this period, the BTC price fell by 5.47% on a weekly basis. While the sharpest pullback in prices occurred on May 23 with a 3.92% drop, the overall outlook remained volatile and weak. The price decline, especially in recent days, has been coupled with profit realization and risk-off signals.
Cumulative Net Inflows: Total cumulative net inflows in spot Bitcoin ETFs rose to $44.97 billion by the end of the 346th trading day.
| Date | Coin | Open | Close | Change % | ETF Flow (mil$) |
|---|---|---|---|---|---|
| 23-May-25 | BTC | 111,696 | 107,318 | -3.92% | 211.7 |
| 26-May-25 | BTC | 109,004 | 109,434 | 0.39% | 0 |
| 27-May-25 | BTC | 109,434 | 108,938 | -0.45% | 385.4 |
| 28-May-25 | BTC | 108,938 | 107,781 | -1.06% | 432.7 |
| 29-May-25 | BTC | 107,781 | 105,589 | -2.03% | -346.8 |
| Total for 23–29 May 2025 | -5.47% | 683.0 | |||
Between May 23-29, 2025, strong inflows and a sharp outflow day were observed together in the Spot Bitcoin ETF market. In particular, the outflow of $346.8 million on May 29 ended a 10-day streak of positive net flows. This suggests that investors are tending to short-term profit realization and taking more cautious positions against increasing volatility.
However, heavy inflows into the BlackRock IBIT ETF confirmed that institutional interest remains strong. The fact that the decline in the Bitcoin price has been in line with ETF flows suggests that the market is fragile and investor sentiment is fluctuating. In the coming period, whether ETF outflows will continue and the impact of macroeconomic developments will play a critical role in determining the direction of Bitcoin.
Ethereum spot ETF
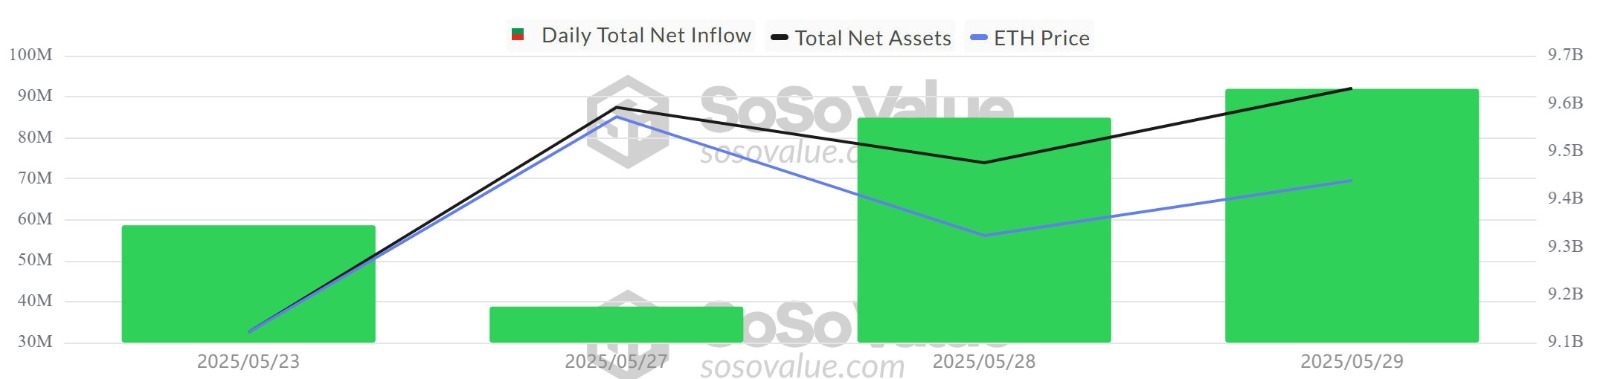
Source: SosoValue
Between May 23-29, 2025, Spot Ethereum ETFs saw a total net inflow of $274.2 million. The highest inflow during this period was recorded on May 29 with $91.9 million. During this period, BlackRock’s ETHA ETF totaled $ 188.4 million, Fidelity FETH ETF totaled $ 67.4 million and Grayscale ETH ETF totaled $ 13.9 million. As of the end of the 214th trading day in Spot Ethereum ETFs, total cumulative net inflows reached $2.99 billion. The positive net flow on all trading days, especially in the period May 16-29, reveals that institutional investor interest continues.
| Date | Coin | Open | Close | Change % | ETF Flow (mil$) |
|---|---|---|---|---|---|
| 23-May-25 | ETH | 2,664 | 2,525 | -5.22% | 58.6 |
| 26-May-25 | ETH | 2,550 | 2,562 | 0.47% | 0 |
| 27-May-25 | ETH | 2,562 | 2,659 | 3.79% | 38.8 |
| 28-May-25 | ETH | 2,659 | 2,680 | 0.79% | 84.9 |
| 29-May-25 | ETH | 2,680 | 2,630 | -1.87% | 91.9 |
| Total for 23–29 May 2025 | -1.28% | 274.2 | |||
While the Ethereum price fluctuated between May 23-29, 2025, the continuation of positive net inflows in Spot Ethereum ETFs attracted attention. The consecutive inflows in ETFs, especially in the last 9 trading days except May 22, when the US stock markets were closed, show that the market was supported by strong institutional demand. Despite the price correction in this period, the purchases in ETFs indicate that investors maintain their long-term expectations. The stability in ETF flows despite the weak course of the Ethereum price confirms that the interest of institutional investors has not waned despite the short-term volatility. In the coming period, if the Ethereum price moves upwards again , inflows to ETFs can be expected to strengthen further and total net inflows can be expected to exceed USD 3 billion.
Bitcoin Options Distribution
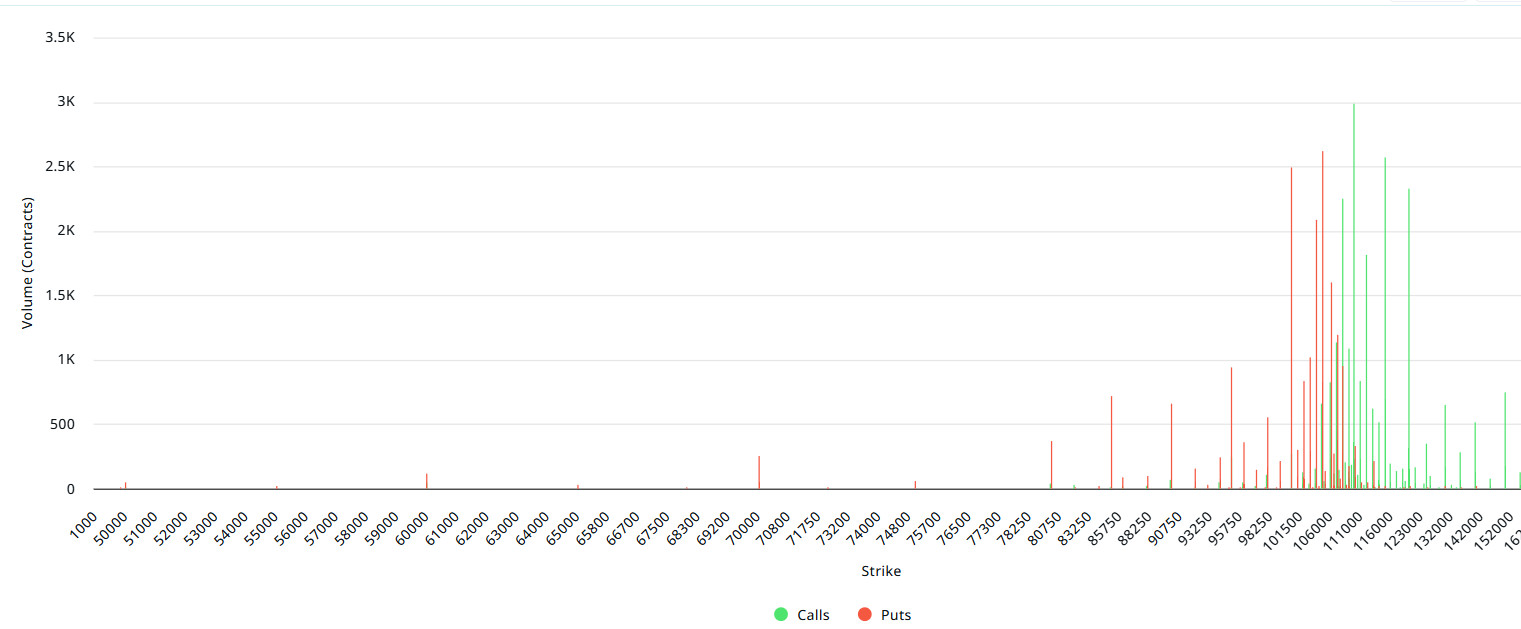
Source: Laevitas
BTC: Notional: $10.03B | Put/Call: 0.87 | Max Pain: $100K
Deribit Data: Deribit data shows that BTC options contracts with a nominal value of approximately $10.03 billion expired today. At the same time, if we look at the risk conversion in the next 1-week period according to the data in the last 24 hours, put options are the dominant side in hedging more than call options in the 24-hour period. This indicates that the expectation of a decline is increasing. When we look at the expected volatility, it is above the realized volatility. This indicates that call option fees are expensive. On the other hand, the positive spread value shows that investors are acting appetite. Skrew values suggest that there is selling pressure today and next week.
Laevitas Data: When we examine the chart, it is seen that put options are concentrated in the band of 95,000 – 108,000 dollars. Call options are concentrated between 108,000 – 120,000 dollars and the concentration decreases towards the upper levels. At the same time, the $ 100,000 level is seen as support and the $ 110,000 level as resistance. On the other hand, there are 2.65K put options at the $105,000 level, where there is a peak and there is a decrease in put volume after this level. However, it is seen that 2.93K call option contracts peaked at the level of 110,000 dollars. When we look at the options market, we see that pu and call contracts are balanced on a daily and weekly basis.
Option Expiration
Put/Call Ratio and Maximum Pain Point: In the last 7 days data from Laevitas, the number of call options decreased by about 30% compared to last week to 115.33 85K. In contrast, the number of put options was 84K, in line with last week. The put/call ratio for options was set at 0.87. This indicates that call options are more in demand among investors than put options. Bitcoin’s maximum pain point is seen at $100,000. It can be predicted that BTC is priced at $104,700 and if it does not break the $100,000 level, which is the pain point, the rises will continue. In the coming period, there are 5.51K call and 4.94K put options at the time of writing.
Ethereum Options Distribution
Source: Laevitas
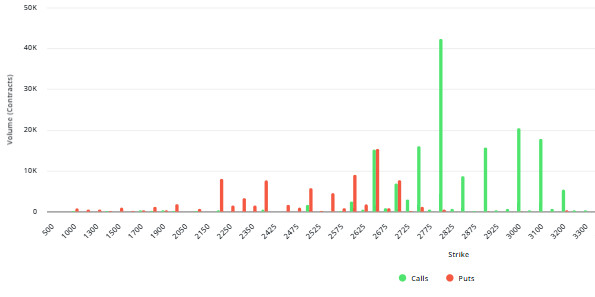
ETH: 1.63B notional | Put/Call: 0.81 | Max Pain: $2,300
Laevitas Data: Looking at the chart, we see that put options are concentrated between 2,500 and 2,700, with a total of over 40K contracts in this range. This concentration suggests that options market players see the $2,500 level as a support level. However, there are also significant call volumes at the $2,750 and $3,200 levels. Especially at the $2,800 level, there is over 42K contracts. This shows that investors have a strong upside expectation for these levels. When the general outlook is analyzed, although there is a cautious outlook against certain support levels in downward movements, the movement above $ 2,800 in terms of upside potential has the potential to push the price even higher.
Deribit Data: ATM volatility ratios are 65.74% and 66.29%, respectively, indicating that the market is expecting high volatility. Butterfly data similarly supports its expectation.
Option Expiration: Ethereum options with a notional value of $1.63 billion expire on May 30. The Max Pain level is calculated at $ 2,300, while the put/call ratio is at 0.81.
Legal Notice
The investment information, comments and recommendations contained in this document do not constitute investment advisory services. Investment advisory services are provided by authorized institutions on a personal basis, taking into account the risk and return preferences of individuals. The comments and recommendations contained in this document are of a general type. These recommendations may not be suitable for your financial situation and risk and return preferences. Therefore, making an investment decision based solely on the information contained in this document may not result in results that are in line with your expectations.


