
Fear & Greed Index
Source: Alternative
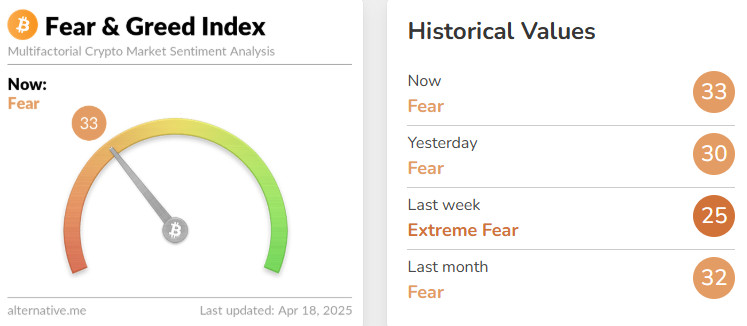
Change in Fear and Greed Value: +8
Last Week’s Level: 25
This Week’s Level: 33
This week, the index rose to 33, remaining in the fear zone. Although sentiment in the market recovered to a limited extent, the cautious mood continued. Trump’s statement that he expects a deal with China in 3-4 weeks eased geopolitical tensions after last week’s harsh rhetoric. While Fed Chairman Powell’s speech emphasized inflation, messages that the balance sheet reduction will proceed slowly limited the tightening concerns in the markets. On the other hand, Strategy’s purchase of 3,459 BTC supported market sentiment, indicating continued institutional demand. Overall, the easing of geopolitical tensions and institutional buying helped dissipate excessive fear. However, the index is still hovering at low levels, indicating that uncertainties remain.
Fund Flow
Source: Coin Shares
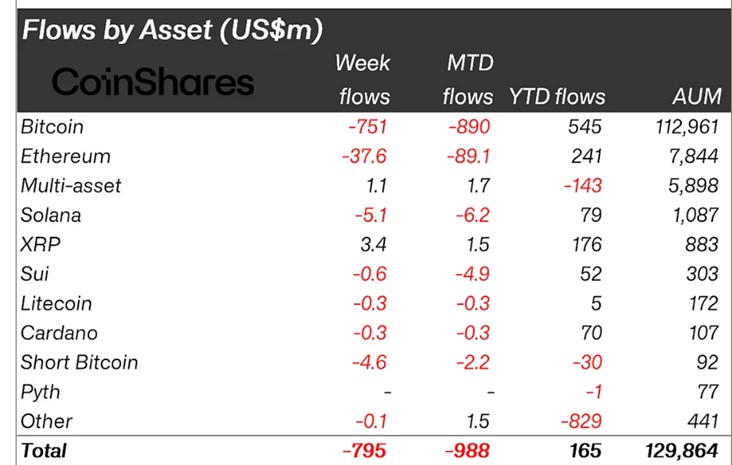
Overview: Digital asset investment products have seen large outflows since Trump’s announcements in April amid news of US tariffs that threaten economic growth. Net outflows totaled $795 million.
Fund Inputs
Multi-asset: Spot Bitcoin ETFs saw net inflows totaling $12.7 million, with outflows of $44.9 million from Grayscale ETHE ETF, $11.4 million from Fidelity FETH ETF and $4.3 million from BlackRock ETHA ETF. Total assets saw inflows of $1.1 million compared to last week.
Ripple (XRP): In Ripple and the SEC’s lawsuit, which has been ongoing since 2020, the appeals court accepted the parties’ joint application for settlement talks. With this development, Ripple saw an entry of $3.4 million.
Fund Outflows
Bitcoin (BTC): With China’s retaliatory statements against the tariffs imposed by the US and the negative impact of FED Chairman Powell’s speech, an outflow of 751 million dollars was seen last week.
Ethereum (ETH): Trump said that he expects to reach an agreement with China in 3-4 weeks, causing movement in Ripple. The ETH network saw an outflow of $37 million.
Solana (SOL): A centralized exchange, Solana announced significant upgrades to its infrastructure but saw outflows totaling $5.1 million amid Fed rhetoric, trade policy and macroeconomic uncertainty.
Litecoin (LTC): Fidelity began rolling out an individual retirement program that allows all US citizens over the age of 18 to invest in Litecoin. Despite the news of the program, macroeconomic uncertainties led to uncertainty in Litecoin, with outflows of $0.3 million.
Cardano (ADA): The probability of ADA ETFs being approved has increased to 64%. ADA, which has not yet received ETF approval news, saw outflows of 0.3 million dollars during the week.
SUI’s announcement that a good deal could be struck with China and other countries as a result of US President Trump’s open negotiation policy on tariffs caused volatility in the markets, affecting alt coins. SUI saw an outflow of $0.6 million on this news.
Short Bitcoin: Outflows to short bitcoin positions totaled $5 million.
Other: While inflation was emphasized in Fed Chairman Powell’s speech this week, messages that balance sheet reduction will proceed slowly limited tightening concerns in the markets. For this reason, sub-coins saw an outflow of $ 0.1 million.
Total MarketCap
Source: Tradingview
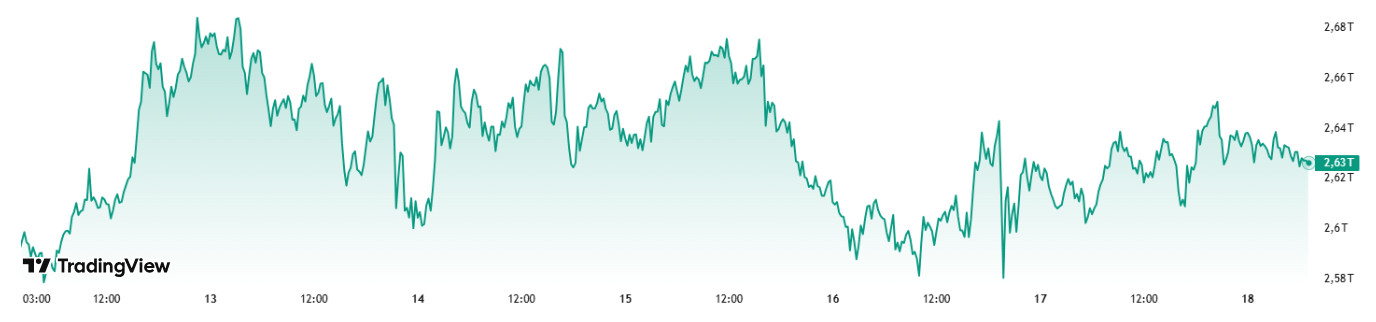
Last Week Market Capitalization: 2.62 trillion Dollars
This Week Market Capitalization: 2.63 trillion Dollars
Last week, the cryptocurrency market increased by 6.47%, with an increase of approximately $ 159 billion, and the week closed positively. This week, there was an increase of $8 billion in the market. This corresponds to an increase of 0.33% and the total market capitalization is currently hovering at $2.63 trillion.
Total 2
Total 2, which closed last week with an increase of 5.81%, started the new week with a market capitalization of 953.57 billion dollars. This week, with a depreciation of 0.83%, a depreciation of 7.89 billion dollars was realized and it has been stable for 3 days at 944 billion dollars.
Total 3
Total 3, which increased by 7.06% with an increase of $ 50.16 billion last week, started this week at $ 760.76 billion. During the week, a decline of 0.89% was recorded with a decrease of $ 6.79 billion.
After seeing positive closures on both altcoins and Bitcoin in the crypto market last week, a more mixed picture prevails this week. Although the total market capitalization (Total Market) increased by $8 billion this week, the Total 2 index, which represents the altcoin markets, lost $7.89 billion and the Total 3 index lost $6.79 billion. This can be interpreted as Bitcoin increasing its market dominance and starting to dominate the market more. As a matter of fact, according to this data, it is seen that an increase of $ 15.89 billion was realized on the Bitcoin side (Total – Total 2), while a loss of $ 1.1 billion stood out on the Ethereum side. We can say that the general situation of other altcoins stands out as the weakest link of the week with a loss of $ 6.79 billion.
Bitcoin Dominance
Source: Tradingview
Bitcoin Dominance
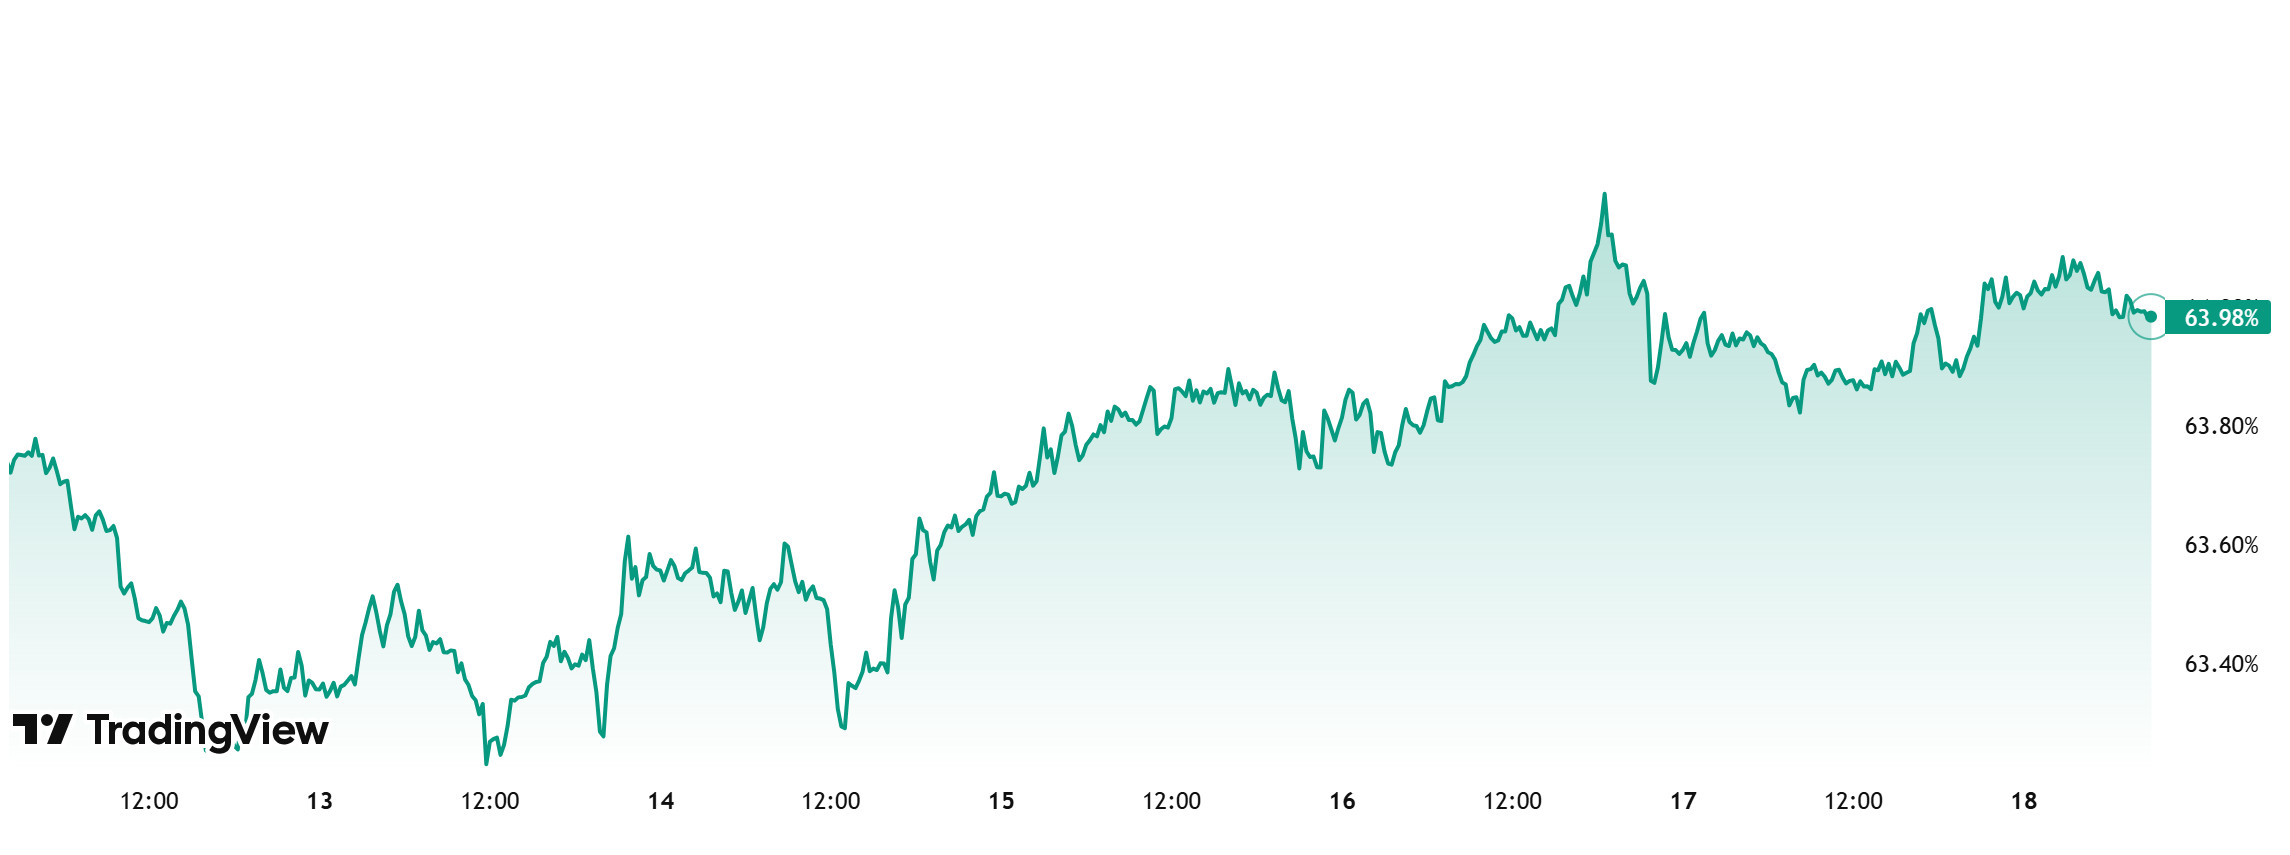
Starting the week at 63.55%, BTC dominance rose during the week to 64.14% and is currently at 63.98%.
Bo Hines, executive director of Trump’s Digital Asset Advisory Council, stated that the US could use revenue from tariffs to buy Bitcoin. Under the “budget-neutral BTC purchase” plan proposed by Bo Hines, OKG Research estimates that up to $874 billion in structural Bitcoin purchases could be made.
While these developments were taking place in the US, 3459 Bitcoin was purchased by Strategy and 319 Bitcoin was purchased by Metaplanet this week. When we analyze Bitcoin spot ETFs, it is seen that there have been money inflows throughout this week.
In addition to all these developments, the US President Trump’s openness to a negotiated policy on tariffs, and his indication that a good deal can be made with China and other countries, may encourage institutional and ETF investors to buy.
If the buying effect created by positive news remains limited, the selling pressure that may occur on Bitcoin can be expected to be less compared to the overall market as long as institutional investor purchases continue.
In light of these developments, we can expect BTC dominance to rise to 65% – 66% for the first time since February 2021.
Ethereum Dominance
Source: Tradingview
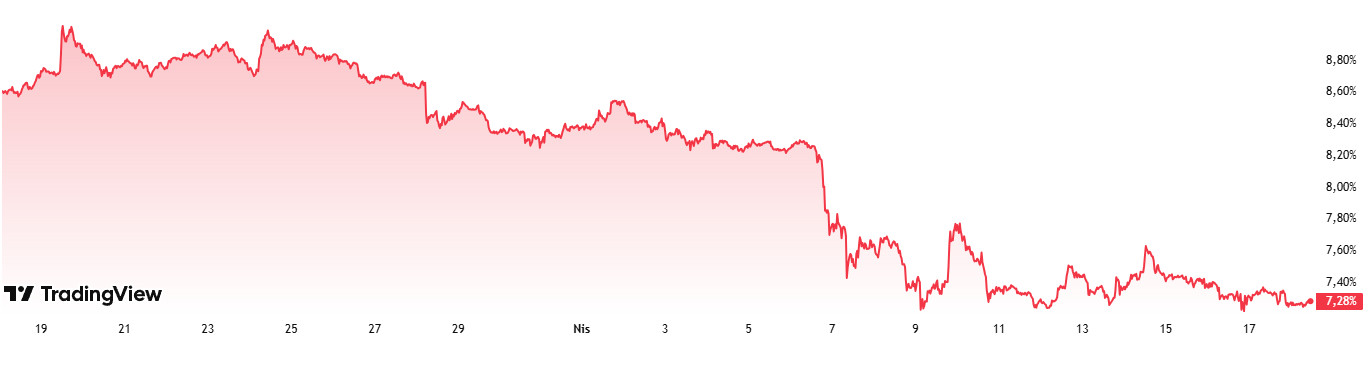
Weekly Change:
Last Week’s Level: 7.37%
This Week’s Level: 7.28%
After rising as high as 8.88% in the week starting on March 17, Ethereum dominance resumed its downtrend amid pressure in this region. Over the last four-week period, this pressure has continued significantly and the Ethereum dominance has approached its historical lows with the pullbacks.
In addition, a total net outflow of $ 61.5 million from Spot Ethereum ETFs between April 11-17, 2025 contributed to the continuation of the negative outlook on a weekly basis.
On the other hand, Ethereum generated $1.014 billion in fee revenue from decentralized applications (dApps) in the first quarter of 2025, maintaining its leadership among all dApp platforms. This development can be considered as a positive indicator for the Ethereum ecosystem in the long-term perspective.
In the same period, Bitcoin dominance also showed a positive trend; however, in the last week, it exhibited a negative trend, similar to Ethereum dominance.
In this context, Ethereum dominance ended last week at 7.37% and is hovering around 7.28% as of the current week.
Bitcoin Spot ETF
Source: SosoValue
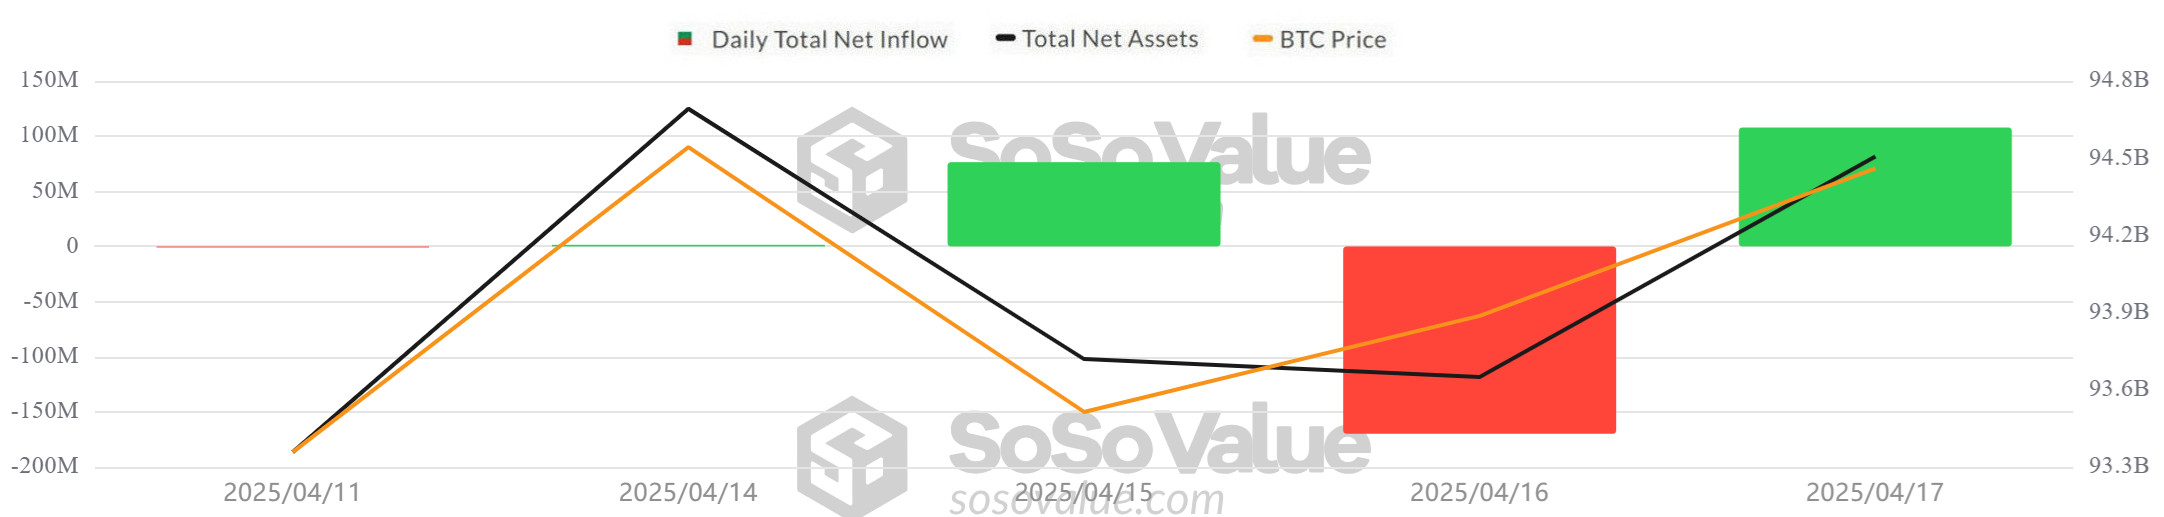
NetFlow Status: Spot Bitcoin ETFs saw a total net inflow of $12.7 million between April 11-17, 2025. With this week, the 7-day negative net inflow streak ended on April 14, 2025. During the week, BlackRock IBIT ETF stood out with net inflows of $186.5 million, while Fidelity FBTC ETF and Ark ARKB ETF stood out with net outflows of $123.1 million and $88.5 million, respectively.
Bitcoin Price: Bitcoin, which opened at $79,607 on April 11, closed at $84,947 on April 17, up 6.71%. The sharpest rise of the week took place on April 11, with Bitcoin gaining 4.79%. This rise signaled a rebound in investor confidence.
Cumulative Net Inflows: Spot Bitcoin ETFs saw total cumulative net inflows rise to $35.47 billion after 318 trading days.
| Date | Open Price (USD) | Close Price (USD) | Change (%) | ETF Flow (Million USD) |
|---|---|---|---|---|
| April 11, 2025, | 79,607 | 83,423 | 4.79% | -1.0 |
| April 14, 2025, | 83,760 | 84,591 | 0.99% | 1.5 |
| April 15, 2025, | 84,591 | 83,643 | -1.12% | 76.4 |
| April 16, 2025, | 83,643 | 84,030 | 0.46% | -171.1 |
| April 17, 2025, | 84,030 | 84,947 | 1.09% | 106.9 |
| Total (April 11–17, 2025) | 6.71% | 12.7 | ||
While the effects of macroeconomic developments in the April 11-17, 2025 timeframe continue, crypto markets have started to take a more balanced stance against this pressure. The resumption of inflows in ETFs after 7 days of outflows was interpreted as a signal of a partial recovery in market sentiment. The limited inflows throughout the week showed that investors continued to price geopolitical and macroeconomic developments. This process reveals that market sensitivity is high and two-way pricing may continue depending on news flow. In the coming days, the FED’s rhetoric, trade policies and the trend in ETF flows will continue to be decisive on Bitcoin price.
Ethereum spot ETF
Source: SosoValue
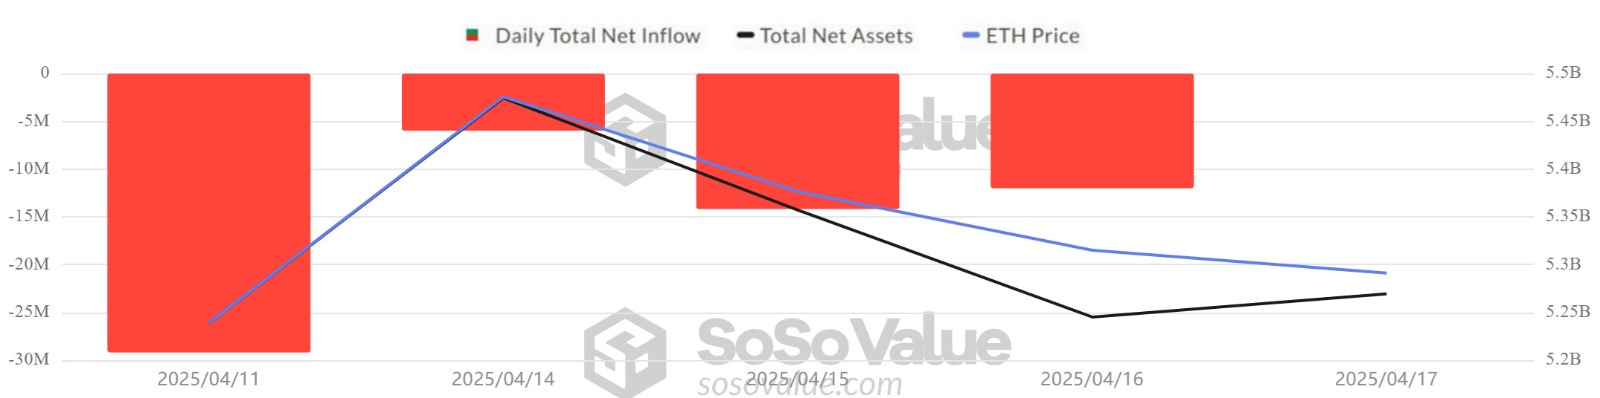
Between April 11-17, 2025, Spot Ethereum ETFs saw a total net outflow of $61.5 million. The largest outflow of the week was recorded on April 11 with $29.2 million, while outflows of $44.9 million from Grayscale ETHE ETF, $11.4 million from Fidelity FETH ETF and $4.3 million from BlackRock ETHA ETF were particularly noteworthy. The cumulative total net inflows of Spot Ethereum ETFs at the end of the 186th trading day fell to $2.26 billion. The 7-day series of negative net flows in Spot Ethereum ETFs ended with zero flows as of April 17.
| DATE | COIN | Open | Close | Change % | ETF Flow (mil$) |
|---|---|---|---|---|---|
| 11-Apr-25 | ETH | 1,522 | 1,566 | 2.89% | -29.2 |
| 14-Apr-25 | ETH | 1,597 | 1,623 | 1.63% | -6 |
| 15-Apr-25 | ETH | 1,623 | 1,588 | -2.16% | -14.2 |
| 16-Apr-25 | ETH | 1,588 | 1,577 | -0.69% | -12.1 |
| 17-Apr-25 | ETH | 1,577 | 1,583 | 0.38% | 0 |
| Total for 11 – 17 Apr 25 | 4.01% | -61.5 | |||
Between April 11 and 17, 2025, global markets were still reeling from the US-China tariff tensions, but the markets have started to take a more balanced stance against this pressure. The recovery signals in the Ethereum price indicate that investors are open to risk-taking again. In this process, the direction of ETF flows and macroeconomic statements will continue to be decisive on Ethereum pricing.
Bitcoin Options Breakdown
Source: Laevitas
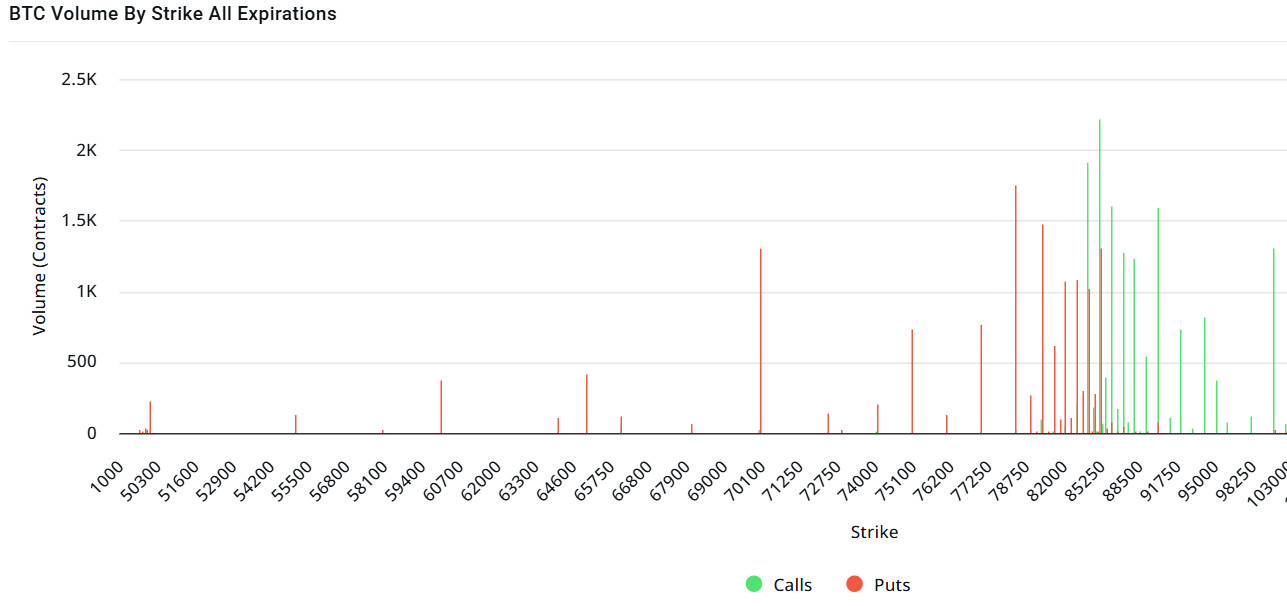
BTC: Notional: $1.98B | Put/Call: 0.62 | Max Pain: $84K
Deribit Data: Deribit data shows that BTC options contracts with a nominal value of approximately $ 1.98 billion expired today. At the same time, if we look at the risk conversion in the next 1-week period according to the data in the last 24 hours, call options are the dominant side in hedging more than put options in the 24-hour period. This shows us that the bullish expectation is increasing. When we look at the expected volatility, the fact that it is below the realized volatility is a bearish signal, but it shows us that call contract fees are cheap, whereas the contract fees of put options are above normal. When we look at the term structure data, we do not expect much volatility during the option expiration.
Laevitas Data: When we examine the chart, we see that put options are concentrated between 85,250 – 78,000 dollars. Call options are concentrated between the levels of 84,000 – 94,000 dollars and the concentration decreases towards the upper levels. At the same time, the level of approximately $ 78,000 is seen as support and the level of $ 85,000 as resistance. On the other hand, there are 1.75K put options at the $ 78,000 level, where there is a peak and there is a decrease in put volume after this level. However, it is seen that 2.21K call option contracts peaked at $ 85,000. When we look at the options market, we see that call contracts are dominant on a daily and weekly basis.
Option Expiration
Put/Call Ratio and Maximum Pain Point: In the last 7 days of data from Laevitas, the number of call options decreased by 47% compared to last week to 91.74K. In contrast, the number of put options decreased by 45% to 70.57K. The put/call ratio for options was set at 0.62. This shows that call options are more dominant among traders. Bitcoin’s maximum pain point is seen at $84,000 at the time of writing. It can be predicted that BTC is priced at $84,700 and if it does not break the $84,000 level, which is the pain point, downwards, the rises will continue. In the coming period, there are 3.12K call and 2.17K put options at the time of writing.
Ethereum Options Distribution
Source: Laevitas
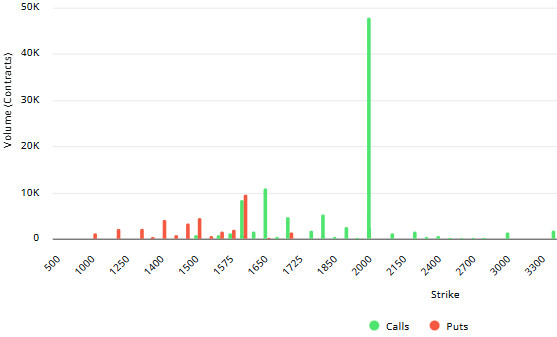
ETH: $280M notional | Put/Call: 0.84 | Max Pain: $1,600
Laevitas Data: When we first focus on Put options, it is noticeable that the volume is particularly concentrated in the $1,500 – $1,600 band. There are about 10K contracts at the $1,600 level. The presence of 4.5K contracts at the $1,500 level indicates that this level is considered as a support zone. A break below these levels may increase short-term selling pressure. On the other hand, on the Call options side, it is noteworthy that the volume is gathered especially in the $ 1,600 – $ 1,650 band. The highest density here is at the $1,650 level, with about 11K contracts. This shows that investors are positioning this level as a target price or resistance point. However, the most striking detail on the chart is the Call volume at the $2,000 level. There are about 48K contracts here, which represents by far the highest volume compared to all other levels. This implies that market players are focusing on this level in anticipation of higher volatility and a potential breakout.
Deribit Data: The ATM volatility rate is 44.34, down 18.83% on a daily basis but still high. This suggests that the market is prepared for large price movements. 25Δ Risk Reversal (RR) rose to 11.76 and increased by 14.26%, suggesting that traders are showing more interest in upside positions.
Option Expiration
Ethereum options with a notional value of $280 million expired on April 18. The maximum pain point (Max Pain) was realized at $ 1,600, while the put/call ratio was 0.84.
Legal Notice
The investment information, comments and recommendations contained in this document do not constitute investment advisory services. Investment advisory services are provided by authorized institutions on a personal basis, taking into account the risk and return preferences of individuals. The comments and recommendations contained in this document are of a general type. These recommendations may not be suitable for your financial situation and risk and return preferences. Therefore, making an investment decision based solely on the information contained in this document may not result in results that are in line with your expectations.
