
Fear & Greed Index
Source: Alternative
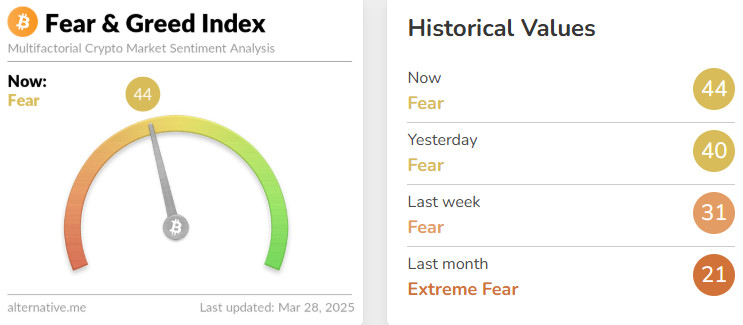
Change in Fear and Greed Value: +13
Last Week Level: 31
This Week’s Level: 44
This week, the index rose from 31 to 44. While MicroStrategy’s $585 million purchase of Bitcoin boosted confidence in the market, Trump’s statements on auto, lumber and drug tariffs created uncertainty. However, on April 2, he said that he could grant exemptions to some countries, partially mitigating the effects. Fed member Bostic’s lowering of interest rate cut expectations and stating that inflation will not reach the target until 2027 created a cautious atmosphere in the markets. On the other hand, the 2.4% growth of the US economy and stable unemployment data supported risk appetite by limiting excessive fear.Overall, the increase in institutional demand for Bitcoin and economic stability pulled the index up, while uncertainties in trade policies continue to put pressure.
Fund Flow
Source: CoinShares
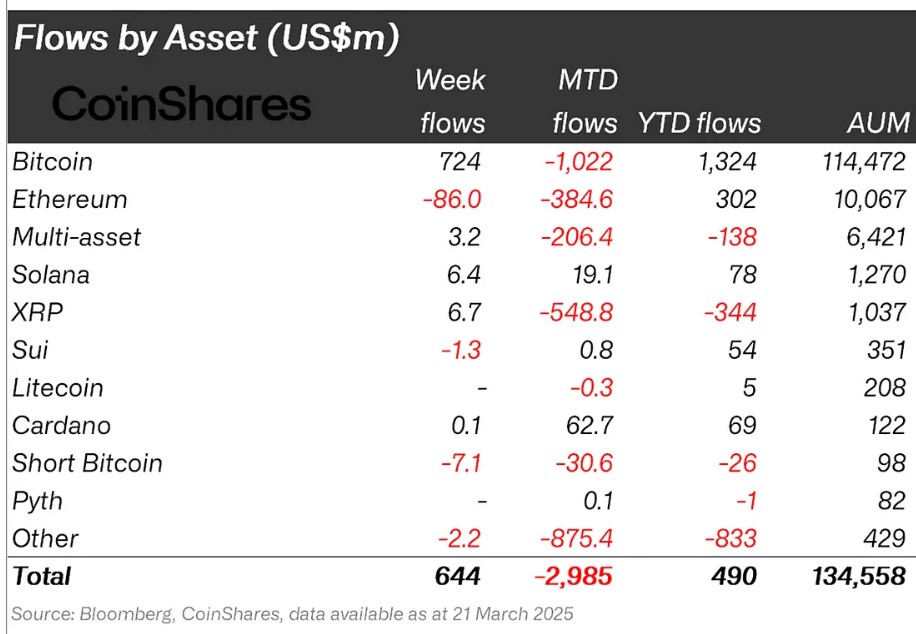
Overview: Trump’s tariff announcements and expectations for stablecoins at the crypto summit increased investors’ risk appetite for crypto assets. Digital assets saw a total inflow of $644 million this week.
Fund Inputs:
Bitcoin (BTC): Bitcoin saw a limited rise after President Donald Trump announced a 25% tariff on automotive imports. GameStop announced that it accepts Bitcoin as a treasury reserve asset. The company’s board of directors unanimously approved this decision. Bitcoin rose again to the $ 87,000 level. In this process, it saw an inflow of $ 724 million.
Multi-asset: Digital mutual funds saw inflows this week totaling $3.2 million.
Solana (SOL): Solana saw inflows totaling $6.4 million on the news that Blacrock tokenized $1.7 billion of money market funds onto the SOLANA network.
Ripple (XRP): The litigation process between the SEC and Ripple, which has been ongoing since 2020, is nearing its end. With the preliminary agreement reached by the parties, it created expectations that restrictions on Ripple’s sales could soon be lifted. In this process, $ 6.7 million was seen.
Cardano (ADA): Trump’s announcement in early March that Cardano would be added to the strategic crypto reserve led to a price spike. However, ADA was not added to the digital asset reserve and the government has not announced any plans to do so. In this process, inflows to ADA decreased, seeing an inflow of $0.1 million.
Fund Outflows
Ethereum (ETH): Russia started using the Ethereum network for oil trade with China and India. The ETH network saw an outflow of -$86 million.
SUI: While the amount of stablecoins doubled daily active addresses decreased significantly compared to last year. Outflows totalled $1.3 million during this period.
Short Bitcoin: Outflows from short bitcoin positions totalled -$7.1 million.
Other: Altcoins have seen outflows of $2.2 million since the ETF application news.
Total MarketCap
Source: Tradingview
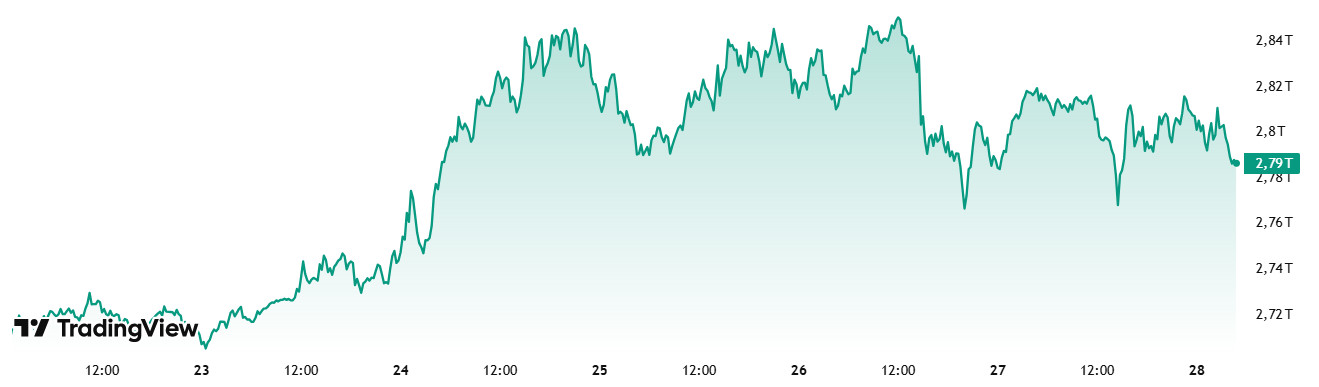
Last Week Market Capitalization: 2.76 trillion Dollars
This Week Market Capitalization: 2.79 trillion Dollars
Last week, the cryptocurrency market rallied by 4.22% with an increase of approximately $111.97 billion and ended the week with a positive close. This week, the total market capitalization has risen by 1.60% with an increase of $44 billion, starting at $2.76 trillion and hovering at $2.79 trillion. If it does not fall below the $2.76 trillion valuation before the close of the week, a 3-week positive streak will be achieved.
Total 2
Total 2 ended last week above the $1 trillion level with an increase of 4.18%. Total 2, which started the week with a market capitalization of $1.06 trillion, rose to $1.11 trillion during the week and then fell back to $1.06 trillion. Compared to the beginning of the week, the market capitalization increased by $6.95 billion, an increase of 0.66%.
Total 3
Total 3 rose 1%, with a value increase of $8.11 billion. Accounting for 29.57% of the crypto market, Total 3 represented 18.43% of this week’s market gains.
This week, there has been a positive mood in the cryptocurrency market in general. The increases on the market show that important subgroups in the market are also rising. The fact that Total 3 performed better than Total 2 draws attention to the performance problems on Ethereum. On the other hand, 84% of the total value gains this week were concentrated on Bitcoin, while the remaining 16% was shared among altcoins. In the case of Ethereum, a negative impact of 1.16 billion dollars was observed in contrast to the rise in the market.
Bitcoin Dominance
Source: Tradingview
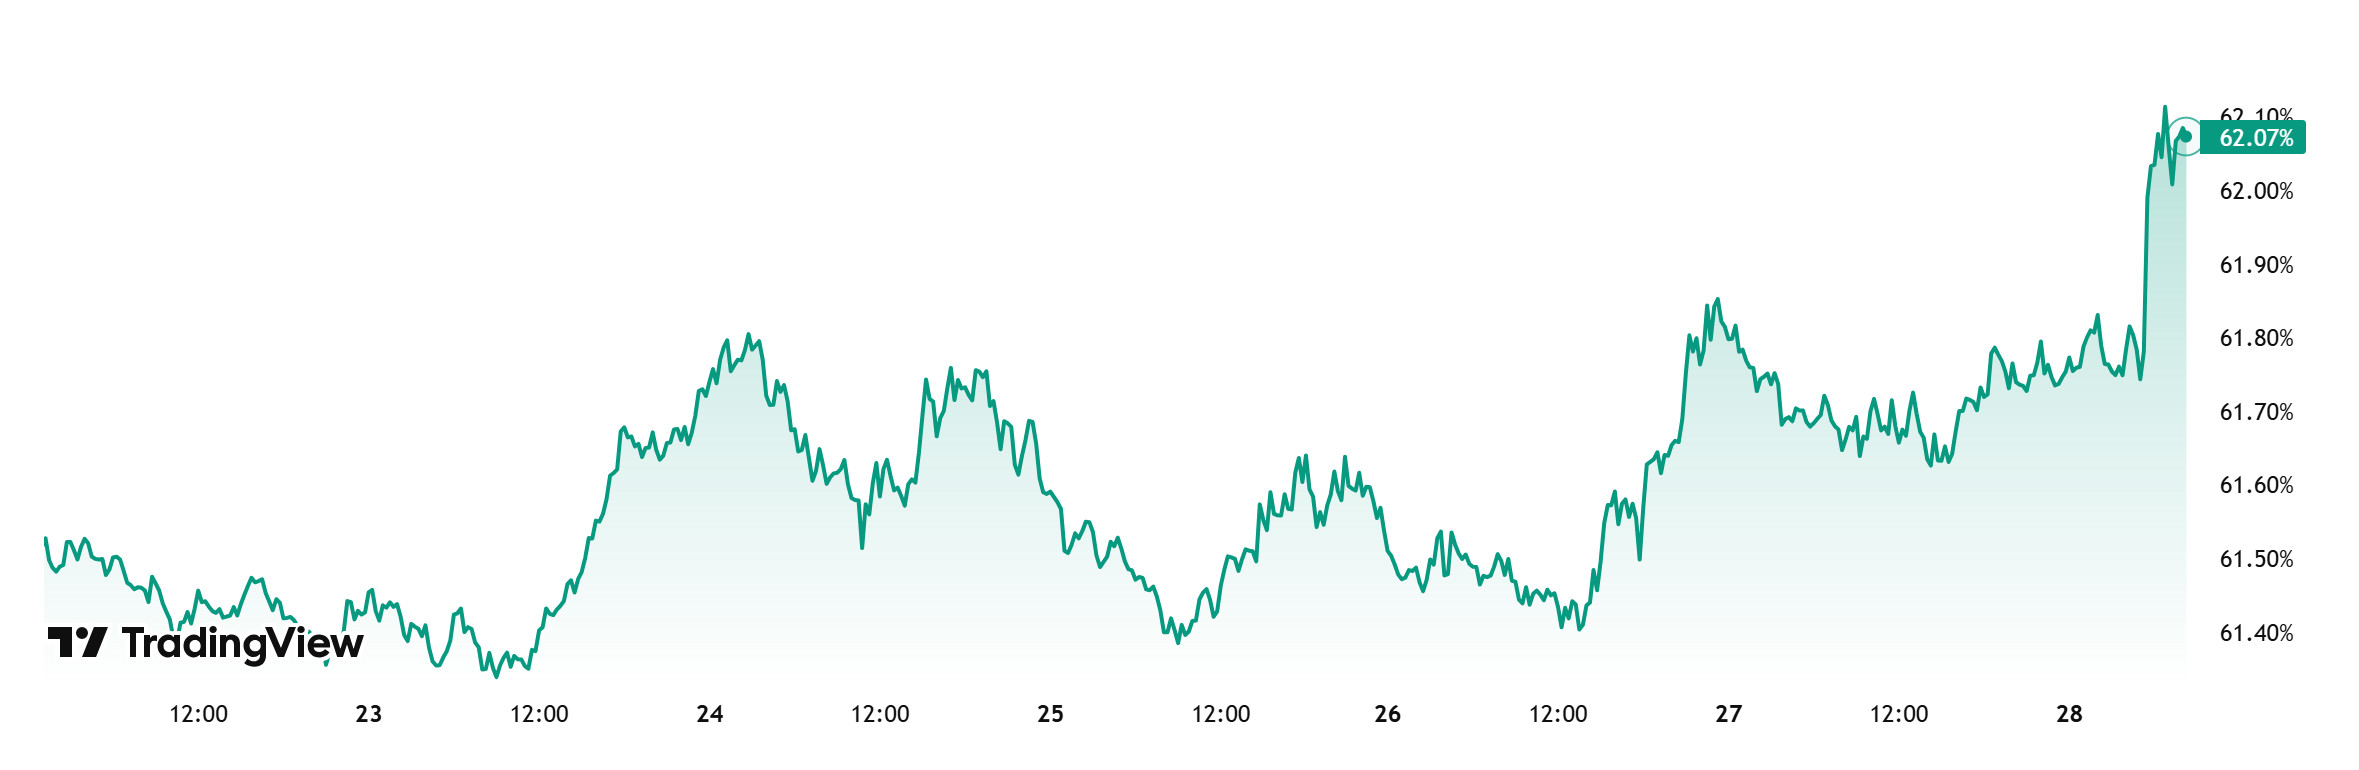
BTC dominance, which started the week at 61.77%, showed a downward trend until the middle of the week, but then started to rise and is currently at 62.07%.
With $5 billion in cash assets, GameStop updated its investment policy to add Bitcoin as a treasury reserve asset. It also announced a $1.3 billion bond issue to buy Bitcoin. During the week, Strategy bought 6,911 Bitcoin, Metaplanet bought 150 Bitcoin and KULR Technology bought 56.3 Bitcoin. When we examine Bitcoin spot ETFs, it is seen that money inflows have continued since March 14.
If US President Trump takes positive steps regarding the tariffs, which are expected to start next week, there may be a further increase in the buying appetite of institutional and ETF investors. In light of these developments, we can expect BTC dominance to rise to 63% – 64% levels with the increasing interest of Bitcoin investors.
Ethereum Dominance
Source: Tradingview
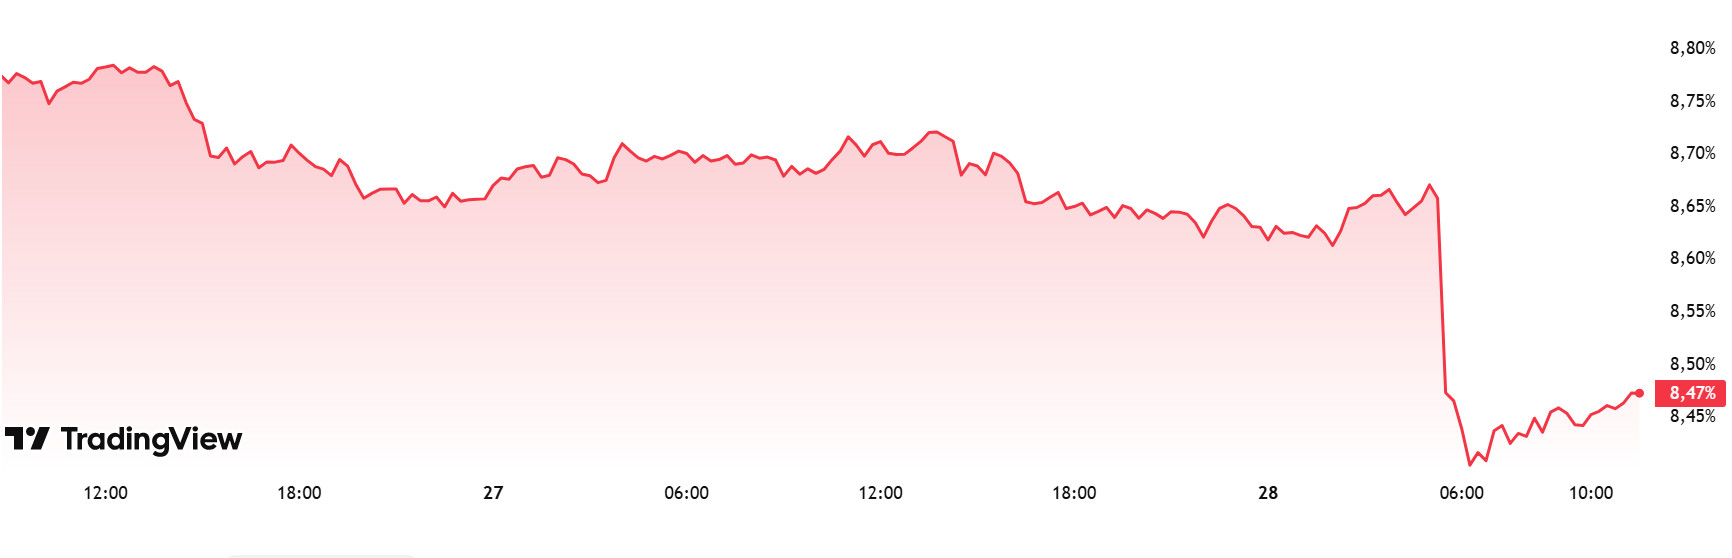
Weekly Change:
Last Week’s Level: 8.75%
This Week’s Level: 8.47%
Ethereum dominance recovered slightly to 10.88% after falling as low as 9.23% in the first week of February 2025. However, as of the last week of February, the dominance, which entered a downward trend again with the selling pressure in this region, continued to be significantly suppressed in the last five-week period.
In this direction, Ethereum dominance, which fell below the 8.50% level followed as of the current week, continued its negative outlook on a weekly basis, with a total net outflow of $ 32 million from Spot Ethereum ETFs between March 21-27, 2025.
In the same period, a reverse movement was observed in Bitcoin dominance, and as of the last week, a positive trend has been exhibited in contrast to Ethereum dominance.
In this context, Ethereum dominance ended last week at 8.75% and is hovering at 8.47% as of the current week.
Bitcoin Spot ETF
Source: SosoValue
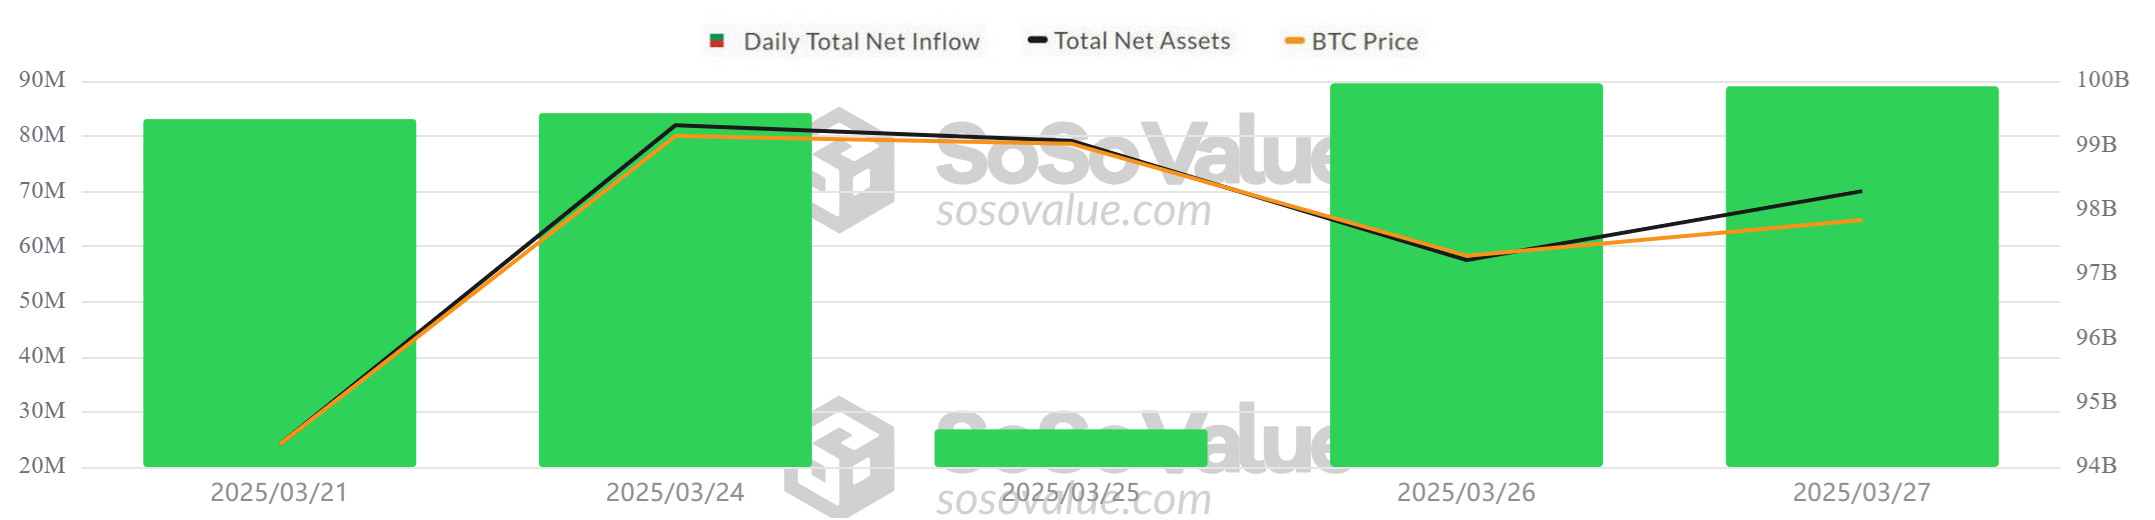
NetFlow Status: Spot Bitcoin ETFs saw a total net inflow of $372.7 million between March 21-27, 2025. BlackRock IBIT ETF and Fidelity FBTC ETF stood out with net inflows of $277 million and $180 million, respectively. Spot Bitcoin ETFs gained strong momentum with net inflows for 10 consecutive days, bringing total net inflows to over $1 billion.
Bitcoin Price: Bitcoin, which opened daily at $84,223 on March 21, 2025, experienced a 3.57% increase on a weekly basis and closed daily at $87,232 on March 27. On March 24, it reached $87,498, up 1.64% on a daily basis, hitting the highest daily close of the week. The increase in spot Bitcoin ETF inflows led to a positive momentum in the Bitcoin price.
Cumulative Net Inflows: Spot Bitcoin ETFs saw a total net inflow of $372.7 million between March 21-27, 2025, while cumulative net inflows reached $36.427 billion by the end of the 303rd trading day.
| Date | Coin | Open Price | Close Price | Change % | ETF Flow (mil$) |
|---|---|---|---|---|---|
| 21-Mar-25 | BTC | 84,223 | 84,088 | -0.16% | 83.1 |
| 24-Mar-25 | BTC | 86,082 | 87,498 | 1.64% | 84.2 |
| 25-Mar-25 | BTC | 87,498 | 87,392 | -0.12% | 26.8 |
| 26-Mar-25 | BTC | 87,392 | 86,909 | -0.55% | 89.6 |
| 27-Mar-25 | BTC | 86,909 | 87,232 | 0.37% | 89.0 |
| Total for 21 – 27 Mar 25 | 3.57% | 372.7 | |||
While the recovery in Bitcoin price continued in the March 21-27, 2025, date range, Spot Bitcoin ETFs also saw consecutive net inflows. Despite the global uncertainties in the market, institutional investors continued to show interest in Bitcoin ETFs. This contributed to ETF inflows remaining positive. The series of 10 consecutive days of net inflows in Bitcoin ETFs shows that confidence has been restored in the market. If this inflow trend continues in the coming days, the Bitcoin price can be expected to continue its upward movement. Despite short-term price fluctuations, strong institutional investor interest in the long term may support the market to move in a positive direction.
Ethereum spot ETF
Source: SosoValue
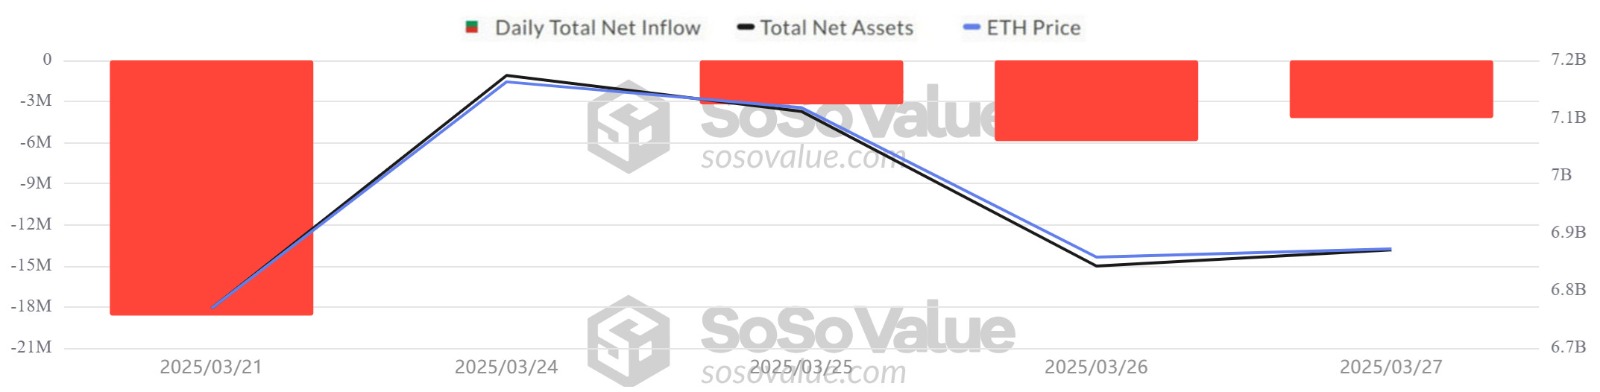
Between March 21-27, 2025, Spot Ethereum ETFs saw a total net outflow of $32 million. The most notable outflows were $11.9 million from BlackRock ETHA ETF and $13.4 million from Grayscale ETH ETF. The cumulative net inflows of spot Ethereum ETFs at the end of the 171st trading day fell to $2.422 billion.
| Date | Coin | Open Price | Close Price | Change % | ETF Flow (mil$) |
|---|---|---|---|---|---|
| 21-Mar-25 | ETH | 1,983 | 1,965 | -0.91% | -18.6 |
| 24-Mar-25 | ETH | 2,005 | 2,081 | 3.79% | 0 |
| 25-Mar-25 | ETH | 2,081 | 2,066 | -0.72% | -3.3 |
| 26-Mar-25 | ETH | 2,066 | 2,009 | -2.76% | -5.9 |
| 27-Mar-25 | ETH | 2,009 | 2,003 | -0.30% | -4.2 |
| Total for 21 – 27 Mar 25 | 1.01% | -32.0 | |||
ETH’s recent price action shows that individual investors are still active in the market. However, unless there are strong inflows from ETFs again, the sustainability of this rise may be limited. If global economic uncertainties persist, ETF outflows may also continue, which could put pressure on the Ethereum price again. Restored institutional confidence and regulatory clarity could support Ethereum’s medium and long-term outlook. In the short term, the direction of ETF net flows is likely to remain the key determinant of price movements.
Bitcoin Options Breakdown
Source: Laevitas
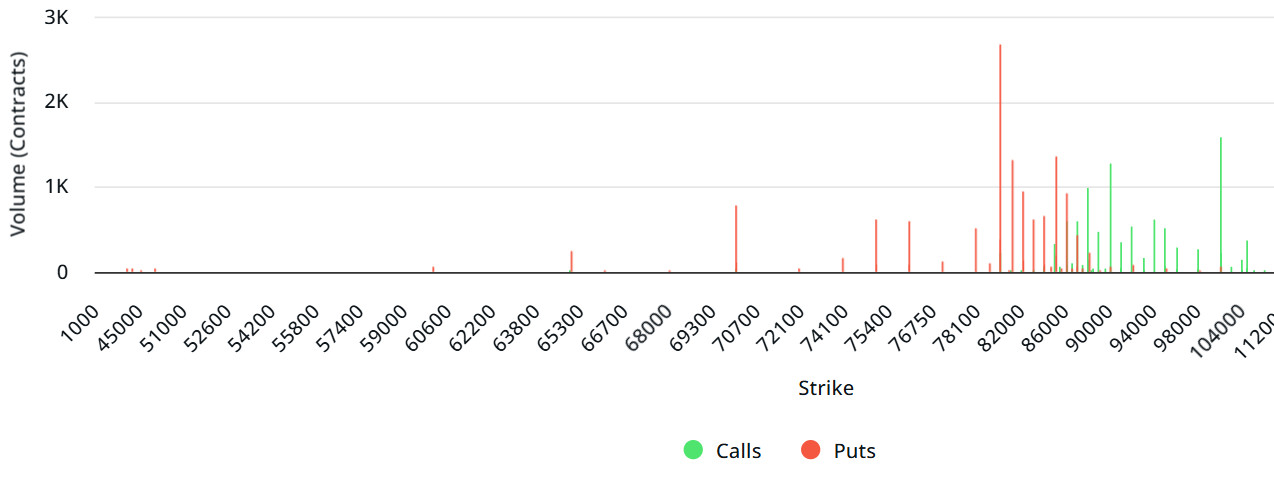
BTC: Notional: $12.17B | Put/Call: 1.14 | Max Pain: $86K
Deribit Data: Deribit data shows that BTC options contracts with a notional value of approximately $12.17 billion expired today. At the same time, according to the data in the last 24 hours, if we look at the risk conversion in the next 1 month, put options are the dominant side in hedging more than call options. This indicates that the investor’s need to hedge against the decline has increased. When we look at the expected volatility, the fact that it is above the realized volatility is a bullish signal, but it shows us that call contract fees are expensive, whereas the contract fees of put options are low.
Laevitas Data: When we examine the chart, it is seen that put options are concentrated in the $ 75,000 – $ 86,000 band. Call options are concentrated between $ 88,000 – 105,000 and the concentration decreases towards the upper levels. At the same time, the level of about $ 80,000 is seen as support and the level of $ 90,000 as resistance. On the other hand, there are 2.68K put options at the $ 80,000 level, where there is a peak and there is a decrease in put volume after this level. However, at the $100,000 level, call options peaked at 1.59K units. When we look at the options market, we see that the selling pressure continues on a daily and weekly basis. Although bearish dominance is present, strong signs of decline in open interest data in the coming period may make investors pessimistic.
Option Expiration
Put/Call Ratio and Maximum Pain Point: In the last 7 days of data from Laevitas, the number of call options decreased by 25% compared to last week to 61.22K. In contrast, the number of put options decreased by 10% to 49.21K. The put/call ratio for options was set at 1.14. A put/call ratio of 1.14 indicates that put options are more dominant among investors. Bitcoin’s maximum pain point is set at $86,000. At the time of writing, BTC was priced at $ 85,067 and we can say that if it exceeds the pain point of $ 86,000, the rises can start. In the next 7 days, there are 1.87K call and 1.25K put options at the time of writing.
Ethereum Options Distribution
Source: Laevitas
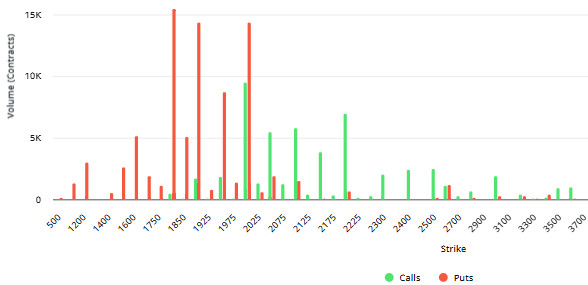
ETH: Notional: $2.15B | Put/Call: 0.39 | Max Pain: $2.4K
Deribit Data: At The Money (ATM) volatility, a measure of market volatility, rose by a strong 40.09% to 93.46. The 25Δ Risk Reversal (RR) increased by 2.33% to -1.41, while the 25Δ Butterfly Spread (BF) decreased by 1.17% to -0.7. Based on this data, we can conclude that the options market was mainly characterized by increased volatility and uncertainty. The strong increase in demand, especially for put options, increases expectations that volatility will increase in the short term as the first quarter of 2025 will end.
Laevitas Data: When we examine the chart, it is seen that Put options are concentrated in the band between $ 1,800 – $ 1,950. Especially at the $1,800 level, the Put volume peaked and there are approximately 15.43K contracts at this point. This suggests that the $1,800 level is seen as a strong support. On the other hand, we see that Call options are concentrated between the $2,000 and $2,200 levels. At the $2,000 level, Call volume reaches a relative high point, where there are about 9.5K contracts. This suggests that this level could work as an important resistance. In the current situation, “Bearish dominance” seems more pronounced.
Option Expiration
Ethereum options with a notional value of $2.06 billion expired at 08:00 UTC on March 28. The maximum pain point is $2,400 and the put/call ratio is 0.39.
Legal Notice
The investment information, comments and recommendations contained in this document do not constitute investment advisory services. Investment advisory services are provided by authorized institutions on a personal basis, taking into account the risk and return preferences of individuals. The comments and recommendations contained in this document are of a general type. These recommendations may not be suitable for your financial situation and risk and return preferences. Therefore, making an investment decision based solely on the information contained in this document may not result in results that are in line with your expectations.
