
Fear & Greed Index

Source:Alternative
Change in Fear and Greed Value: +7
Last Week Level: 60
This Week’s Level: 67
This week, the Fear & Greed index rose from 60 to 67, indicating a strong improvement in investor sentiment. Institutional demand was again a key driver of this rise. Strategy’s purchase of 15,355 BTC in just one week showed that the market still sees serious confidence in institutional players. In addition, the company’s new $21 billion share sale plan supported expectations that BTC purchases would continue, positively affecting investor perception. China’s lifting of a 125% tariff on ethane imports from the US raised optimism that trade tensions on a global scale could ease somewhat. This development, together with the resumed trade talks with the US, points to a short-term easing in geopolitical risk perception. On the other hand, Morgan Stanley’s plans to offer cryptocurrency services on its E*TRADE platform was an encouraging development for retail investors by strengthening the bridge between traditional finance and digital assets. Although the SEC’s postponement of several ETF filings this week maintained uncertainty on the regulatory front, the overall outlook showed strong institutional demand and constructive market news supported the upward movement in market sentiment.
Fund Flow
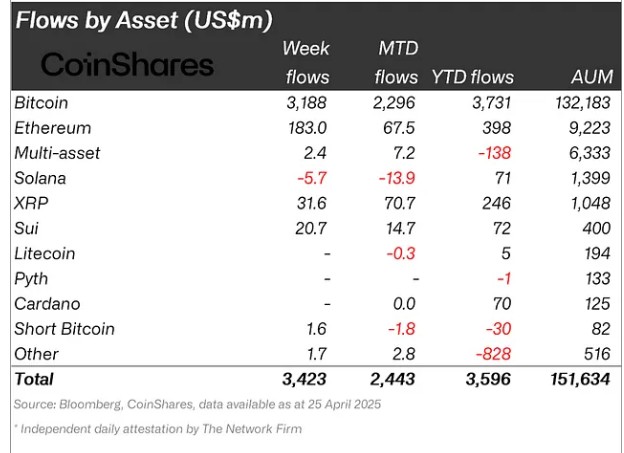
Source: CoinShares
Overview The markets saw a positive momentum last week, with inflows totaling $3.4 billion, driven by both increased institutional interest and news flow on the global economy front. Developments such as Trump’s decision to suspend tariffs for 90 days and the strategic Bitcoin reserve expected to be established in the US increase institutional investor interest and support fund inflows in crypto assets.
Fund Inputs:
Bitcoin (BTC): MicroStrategy’s subsidiary Strategy’s new purchase of 6,556 BTC and Japan’s Metaplanet’s increase in Bitcoin holdings to over 5,000 BTC reveal that the number of companies adopting the crypto as a reserve asset is growing rapidly. With this news, Bitcoin saw inflows of $3.188 billion last week.
Ethereum (ETH): Ethereum’s price rebounded amid rumors of a willingness to compromise on tariffs with China following US President Trump’s decision to suspend tariffs for 90 days. This week, the ETH network saw an inflow of $183 million.
Multi-asset: Bitcoin ETF data recorded a significant inflow, exceeding $3 billion on a weekly basis. Thus, total digital funds reached $2.4 million, up from last week.
Ripple (XRP): Ripple was rumored to have offered $4-5 billion for Circle, and then Circle allegedly rejected Ripple’s offer as too low. Ripple confirmed that it will not do an IPO in 2025. President Monica Long said the company is financially strong and does not need to raise capital or visibility. XRP experienced a $31.6 billion inflow of money in light of this news.
SUI: 21Shares has filed for an ETF with the SEC. SUI’s price rose 10.9% in the last 24 hours following the ETF filing. Sui Foundation announced a partnership with Fireblocks to improve enterprise infrastructure. With these developments, $20.7 million was raised.
Short Bitcoin: Inflows into short bitcoin positions totaled $1.6 million.
Fund Outflows
Solana (SOL): SEC delays Franklin spot SOL ETF decision. Solana saw a total outflow of $5.7 million on this news.
Other: Trump announced possible trade deals with India, South Korea and Japan. He also signed a decree easing some 25% tariffs on the automotive sector. These steps increased the expectation that trade wars and tariff news could soften, leading to inflows in altcoins with the idea of further strengthening the role of digital assets as a long-term store of value. This week saw inflows of $1.7 million.
Total MarketCap

Source : Tradingview
- Last Week Market Capitalization : 90 Trillion Dollars
- Market Capitalization This Week: 97 Trillion Dollars
This week, the total market capitalization in the cryptocurrency market increased by approximately USD 72.60 billion, an increase of 2.51%. With this move, the total market capitalization reached $2.97 trillion during the week and is close to the $3 trillion threshold again.
Total 2
Total 2, which closed last week with an increase of 8.17%, started the new week with a market capitalization of 1.04 trillion dollars. This week, with a value increase of 1.01%, an increase of 10.57 billion dollars was realized and the 1 trillion dollar threshold was exceeded.
Total 3
Total 3, which increased by 6.99% with an increase of $ 53.50 billion last week, started this week at $ 818.75 billion. During the week, a value increase of 0.58% was recorded with an increase of 4.85 billion dollars.
Following the positive closures seen in both Bitcoin and the altcoin market last week, it is possible to say that the bullish movement continues as of this week. According to weekly data, the total growth in the crypto market amounted to approximately $72.60 billion. While $62.03 billion of this growth was driven by Bitcoin (Total – Total 2), Ethereum (Total 2 – Total 3) ranked second with an increase of $5.72 billion. The remaining $4.85 billion was distributed among other altcoins.
Bitcoin Dominance
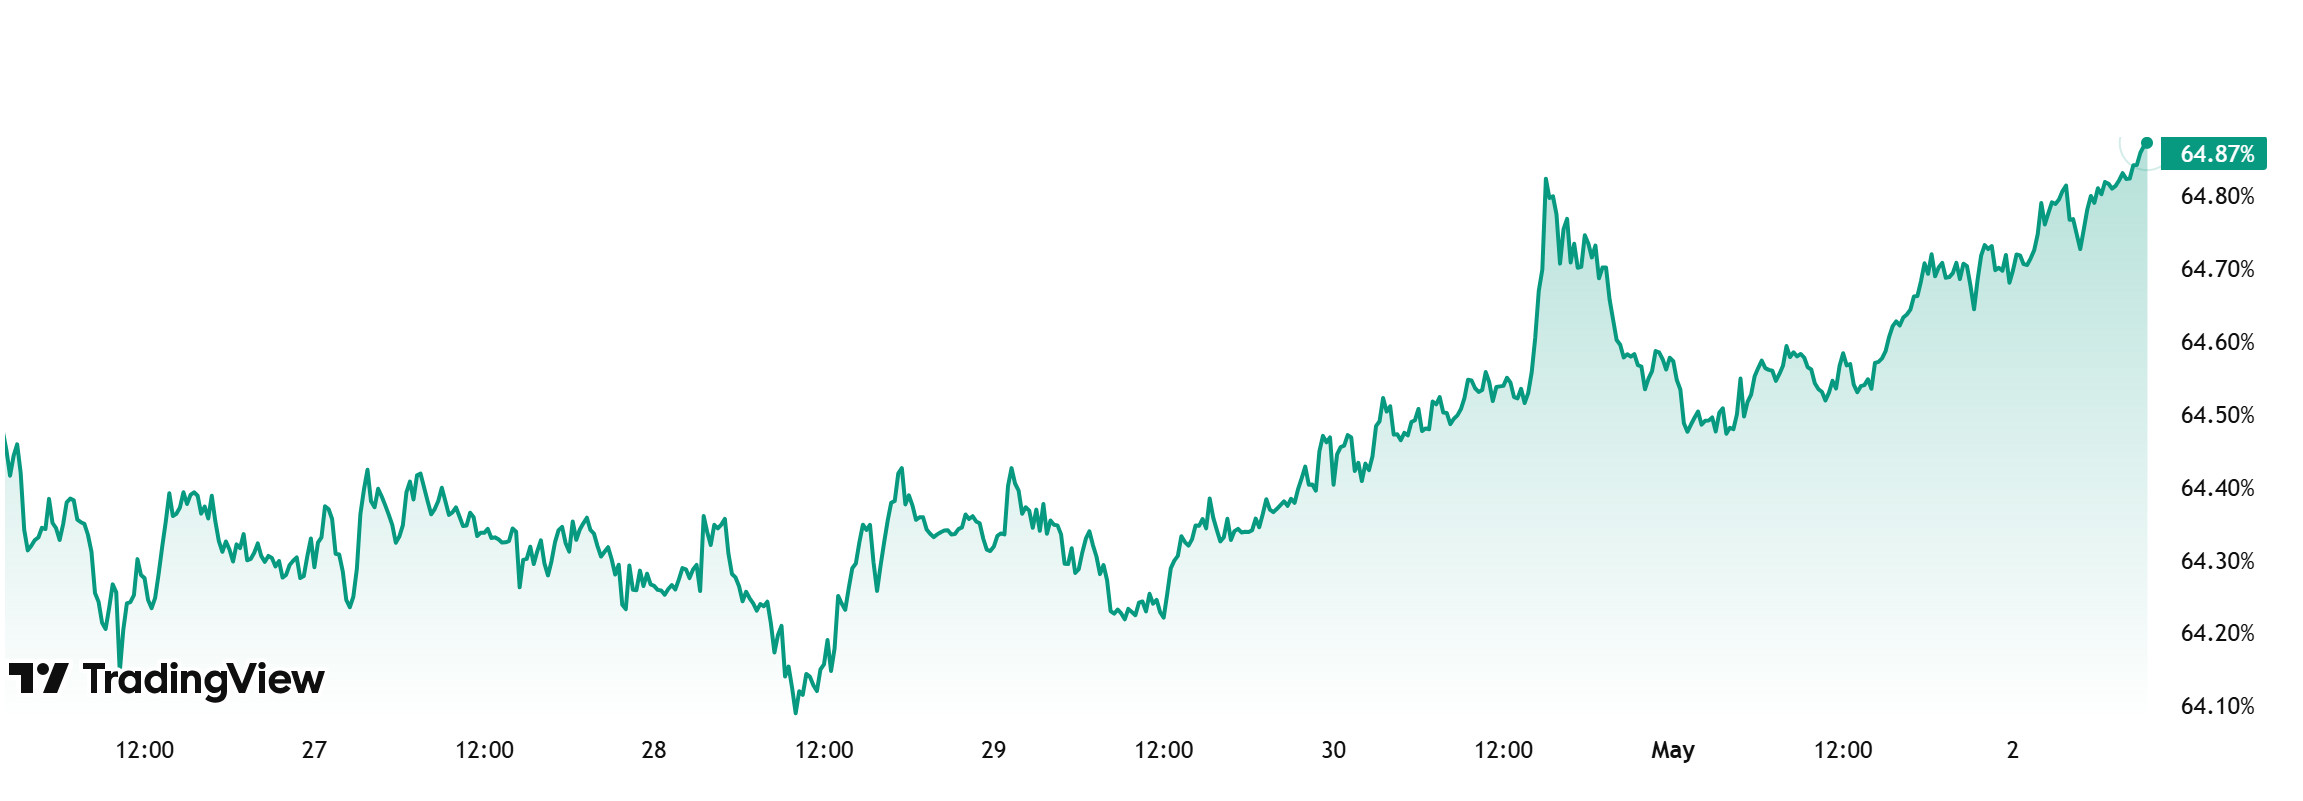
Bitcoin Dominance
BTC dominance, which started the week at 64.27%, has risen throughout the week. It is currently at 64.87%.
This week, 15,355 Bitcoin purchases were made by Strategy. In addition, the company applied for a $ 21 billion stock issue and announced that the proceeds will be used for Bitcoin purchases
Data on Bitcoin spot ETFs shows a total net inflow of $1.13 billion during the week
In addition to all these developments, US President Trump’s frequent statements on tariffs, and in particular, his statements that a good deal can be reached with China, may increase the appetite of institutional and ETF investors to buy Bitcoin. This could lead to continued inflows into Bitcoin.
In the new week, BTC dominance can be expected to rise to 65% – 66% levels as institutional investors continue to buy and ETF inflows are likely to increase.
Ethereum Dominance
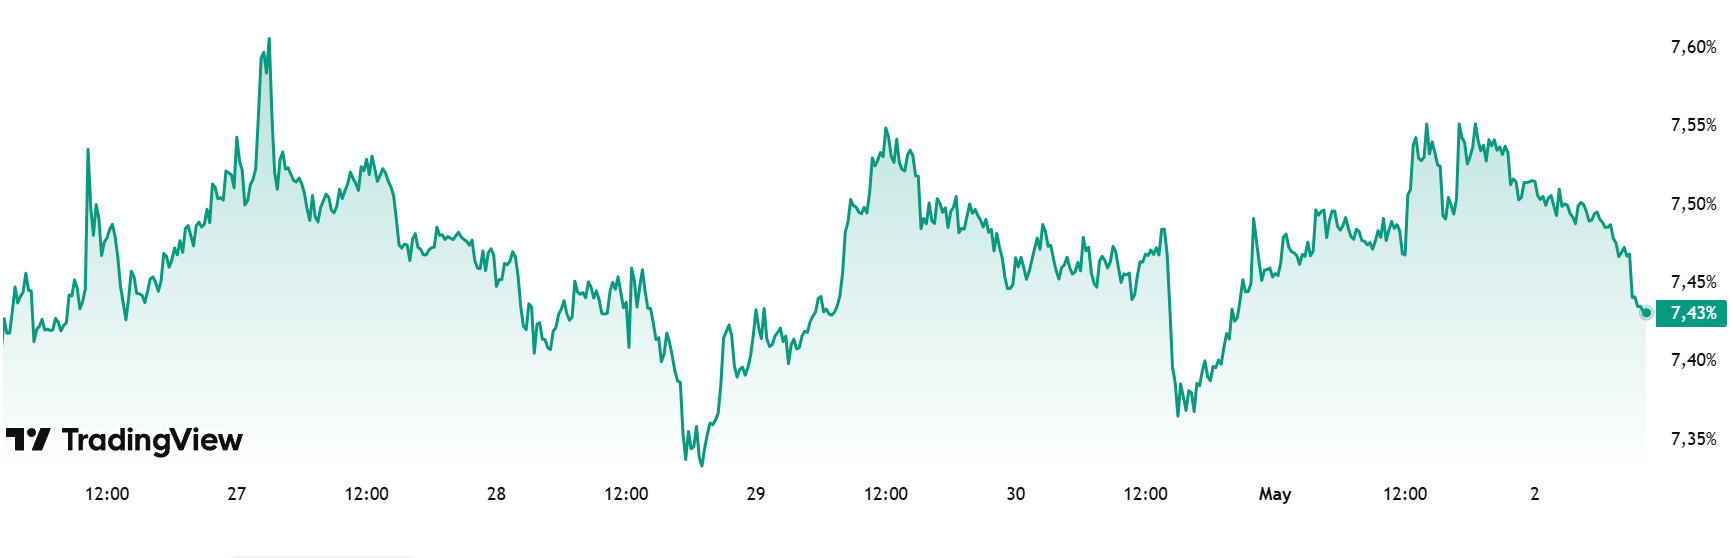
Source: Tradingview
Weekly Change:
- Last Week’s Level: 7.47%
- This Week’s Level: 7.43%
The pressure on Ethereum dominance has continued significantly over the last five weeks and has fallen to a historical low of 6.95%. However, in the last two-week period, Ethereum dominance, which tends to recover from these low levels, has started to gain positive momentum again.
A total net inflow of $ 190.80 million in Spot Ethereum ETFs between April 25 and May 1, 2025 has also been an important factor supporting this recovery.
In the same period, Bitcoin dominance also followed a positive trend and showed an upward trend with Ethereum.
In this context, Ethereum dominance completed last week at 7.47%, while it has been flat at 7.43% as of the current week.
On the other hand, there was a significant improvement in the transaction capacity of the Ethereum network; the gas limit was increased by 100 times, with the potential to reach approximately 2,000 transactions per second. In addition, the launch of the PerfNet test network, which aims to strengthen the network infrastructure, is also considered a noteworthy step for the ecosystem. The Ethereum Foundation updated its vision statement, focusing on decentralization and ecosystem development. In addition, Starknet, Ethereum’s Layer-2 solution, plans to launch Bitcoin staking in the third quarter of 2025, an initiative that aims to both increase the security of the network and incentivize Bitcoin users.
Bitcoin Spot ETF
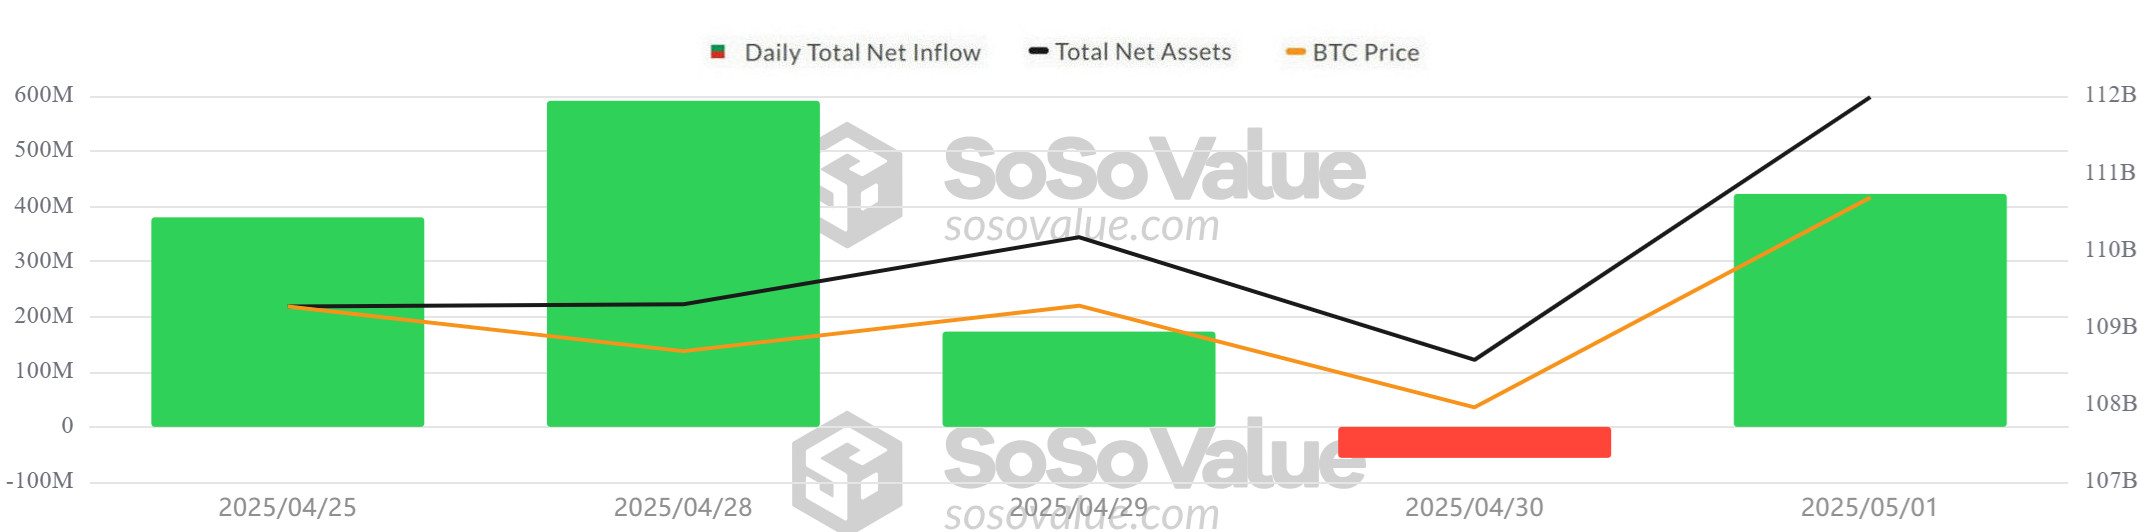
Source: SosoValue
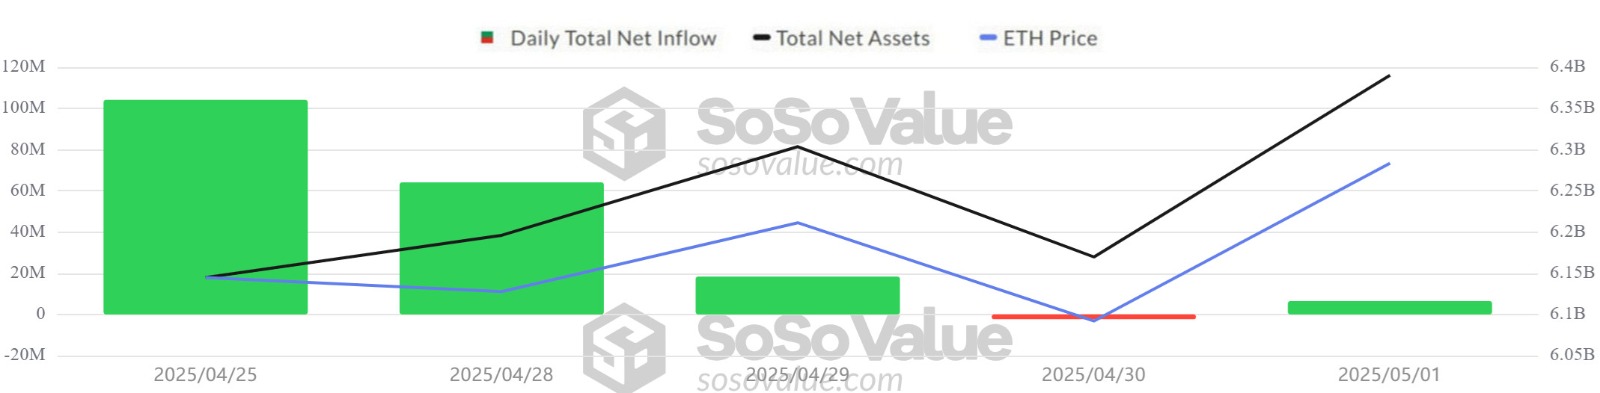
Netflow Status: Between April 25 and May 01, 2025, Spot Bitcoin ETFs saw a total net inflow of $1.51 billion. While strong inflows continued during this period, BlackRock’s IBIT ETF in particular attracted more than $2 billion in net inflows. Although the overall positive trend continued, the 7-day positive net inflow streak ended on April 30 with an outflow of $56.3 million.
Bitcoin Price: Bitcoin, which opened at $ 93,980 on April 25, closed at $ 96,489 on May 1 and completed this process with an increase of 2.67%. While the strongest rise in this period was experienced with an increase of 2.46% on May 1, limited retracements were observed on April 29 and 30.
Cumulative Net Inflows: Spot Bitcoin ETFs saw a total net inflow of $1.51 billion between April 25 and May 01, 2025, while cumulative total net inflows rose to $39.532 billion by the end of the 327th trading day.
| DATE | COIN | PRICE | Change % | ETF Flow (mil$) |
|
|---|---|---|---|---|---|
| Open | Close | ||||
| 25-Apr-25 | BTC | 93,980 | 94,638 | 0.70% | 380 |
| 28-Apr-25 | 93,749 | 95,011 | 1.35% | 591.2 | |
| 29-Apr-25 | 95,011 | 94,256 | -0.79% | 172.8 | |
| 30-Apr-25 | 94,256 | 94,172 | -0.09% | -56.3 | |
| 01-May-25 | 94,172 | 96,489 | 2.46% | 422.5 | |
| Total for 25 Apr – 01 May 25 | 2.67% | 1510.2 | |||
Between April 25 and May 01, 2025, institutional interest in the Spot Bitcoin ETF market continued strongly. ETF inflows continued with high volume, especially with BlackRock’s contribution of more than $2 billion. However, limited outflows from some funds such as Fidelity and Ark indicate that the cautious approach in the market continues. Despite the limited outflows on April 30, the overall flow trend remained positive. The weekly rebound in the Bitcoin price and inflows to ETFs, taken together, signal that institutional confidence continues and the positive outlook may be maintained in the medium term. In the coming period, macroeconomic data from the US and FED rhetoric may again play a decisive role on ETF flows and Bitcoin pricing.
Ethereum spot ETF
Source: SosoValue
Between April 25 and May 1, 2025, Spot Ethereum ETFs saw a total net inflow of $190.8 million. The largest inflow in this process was recorded on April 25 with $104.1 million, while net inflows of $121.9 million to BlackRock ETHA ETF, $73.7 million to Fidelity FETH ETF and $22.2 million to Grayscale ETH ETF were noteworthy. The total cumulative net inflows of Spot Ethereum ETFs at the end of the 195th trading day rose to $2.506 billion.
| DATE | COIN | PRICE | Change % | ETF Flow (mil$) |
|
|---|---|---|---|---|---|
| Open | Close | ||||
| 25-Apr-25 | ETH | 1,769 | 1,784 | 0.85% | 104.1 |
| 28-Apr-25 | 1,791 | 1,799 | 0.45% | 64.1 | |
| 29-Apr-25 | 1,799 | 1,797 | -0.11% | 18.4 | |
| 30-Apr-25 | 1,797 | 1,793 | -0.22% | -2.3 | |
| 01-May-25 | 1,793 | 1,838 | 2.51% | 6.5 | |
| Total for 25 Apr – 01 May 25 | 3.90% | 190.8 | |||
April 25 to May 1, 2025 signaled a positive turn in the ETF market. The return of institutional investors to buy positions also pushed the Ethereum price up. Ethereum gained 3.90% during this period, while inflows to ETFs in particular indicate that investors’ risk appetite is starting to increase. The upcoming May 7th Pectra update may also support the continuation of this interest. If the stability in ETF flows continues in the coming days, the upward trend in Ethereum can be expected to gain strength.
Bitcoin Option Distribution
Source: Laevitas
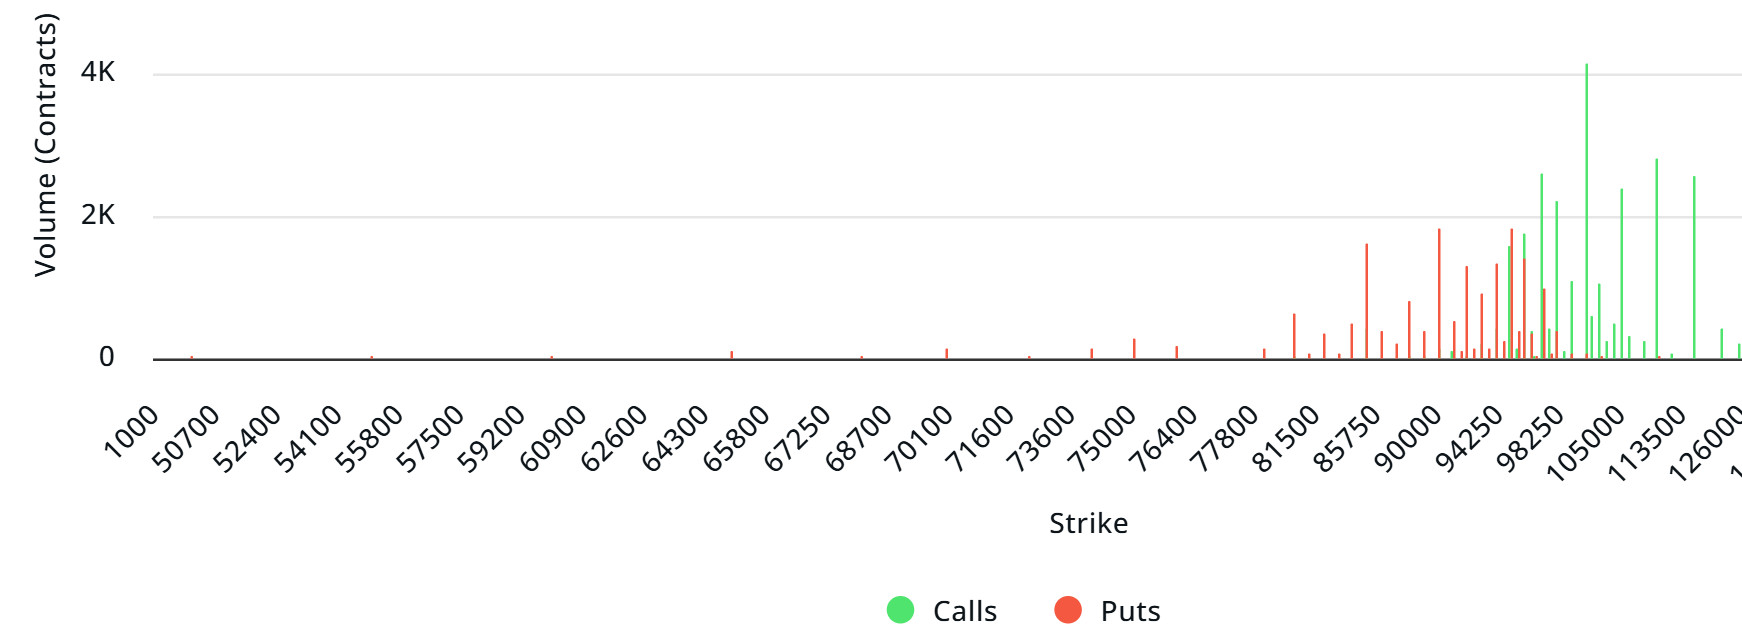
$BTC: Notional: $2.54B | Put/Call: 0.95 | Max Pain: $90K
Deribit Data: Deribit data shows that BTC options contracts with a nominal value of approximately $ 2.54 billion expired today. At the same time, according to the data in the last 24 hours, if we look at the risk conversion in the next 1-week period, call options are the dominant side in hedging more than put options in the 24-hour period. This shows us that the bullish expectation is increasing. When we look at the expected volatility, the fact that it is above the realized volatility is a bullish signal, but it shows us that call contract fees are expensive, whereas the contract fees of put options are low. Skrew values indicate that there is a slight buying pressure in the short term and that purchases will strengthen in the medium term.
Laevitas Data: When we examine the chart, we see that put options are concentrated in the $ 85,000 – $ 97,250 band. Call options are concentrated between $ 96,000 – $ 115,000 and the concentration decreases towards the upper levels. At the same time, the $ 95,000 level is seen as support and the $ 100,000 level as resistance. On the other hand, there are 1.78K put options at the $ 95,000 level, where there is a peak and there is a decrease in put volume after this level. However, it is seen that 3.75K call option contracts peaked at the $ 100,000 level. When we look at the options market, we see that call contracts are dominant on a daily and weekly basis.
Option Expiration
Put/Call Ratio and Maximum Pain Point: In the last 7 days of data from Laevitas, the number of call options decreased by 33% to 74.89K compared to last week. In contrast, the number of put options decreased by 26% to 51.96K. The put/call ratio for options was set at 0.95. This shows that call options are more dominant among traders. Bitcoin’s maximum pain point is seen at $90,000 . It can be predicted that BTC is priced at $ 96,650 and if it does not break the $ 90,000 level, which is the pain point, downwards, the rises will continue. In the coming period, there are 4.30K call and 2.56K put options at the time of writing.
Ethereum Options Distribution
Source: Laevitas
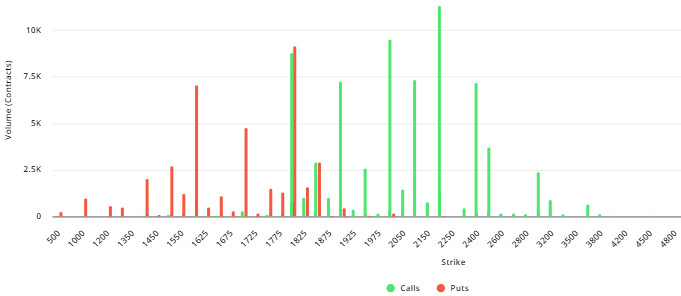
ETH: $316M notional | Put/Call: 0.88 | Max Pain: $1,800
Laevitas Data: When we examine the chart, it is seen that put options are concentrated in the band of $ 1,600 – $ 1,700. Especially at the $1,675 level, there are about 7K put contracts and it is noteworthy that there is a significant decrease in volume after this level. This suggests that the $1,675 level is seen as an important support level by market participants. Call options, on the other hand, are generally concentrated in the $1,800-$2,000 band and the volume gradually decreases in the upward regions after these levels. It is noteworthy that the volume peaked with approximately 10K call contracts, especially at the $ 2,000 level. This structure reveals that the $2,000 level is perceived as a strong resistance zone.
Deribit Data: There is strong demand for near-term call options, while implied volatility is trending lower. Although short-term bullish expectations are increasing in the market, we may witness limited price movements. With skew and risk reversal values in balance, we can interpret that the market is in a cautious optimism rather than an extreme directional trend.
Option Expiration
Ethereum options with a nominal value of $316 million expired on May 2. Max Pain is at $ 1,800, while the put/call ratio is 0.88.
LEGAL NOTICE
The investment information, comments and recommendations contained in this document do not constitute investment advisory services. Investment advisory services are provided by authorized institutions on a personal basis, taking into account the risk and return preferences of individuals. The comments and recommendations contained in this document are of a general type. These recommendations may not be suitable for your financial situation and risk and return preferences. Therefore, making an investment decision based solely on the information contained in this document may not result in results that are in line with your expectations.
