BTC/USDT
We left behind another week of high volatility in the crypto market. The better-than-expected unemployment and non-farm employment data from the US was one of the main factors that increased volatility in Bitcoin. On the other hand, among the positive developments, MicroStrategy’s continued Bitcoin purchases attracted attention, while the steps taken by various countries within the scope of strategic reserves also contributed to the expansion of the market.
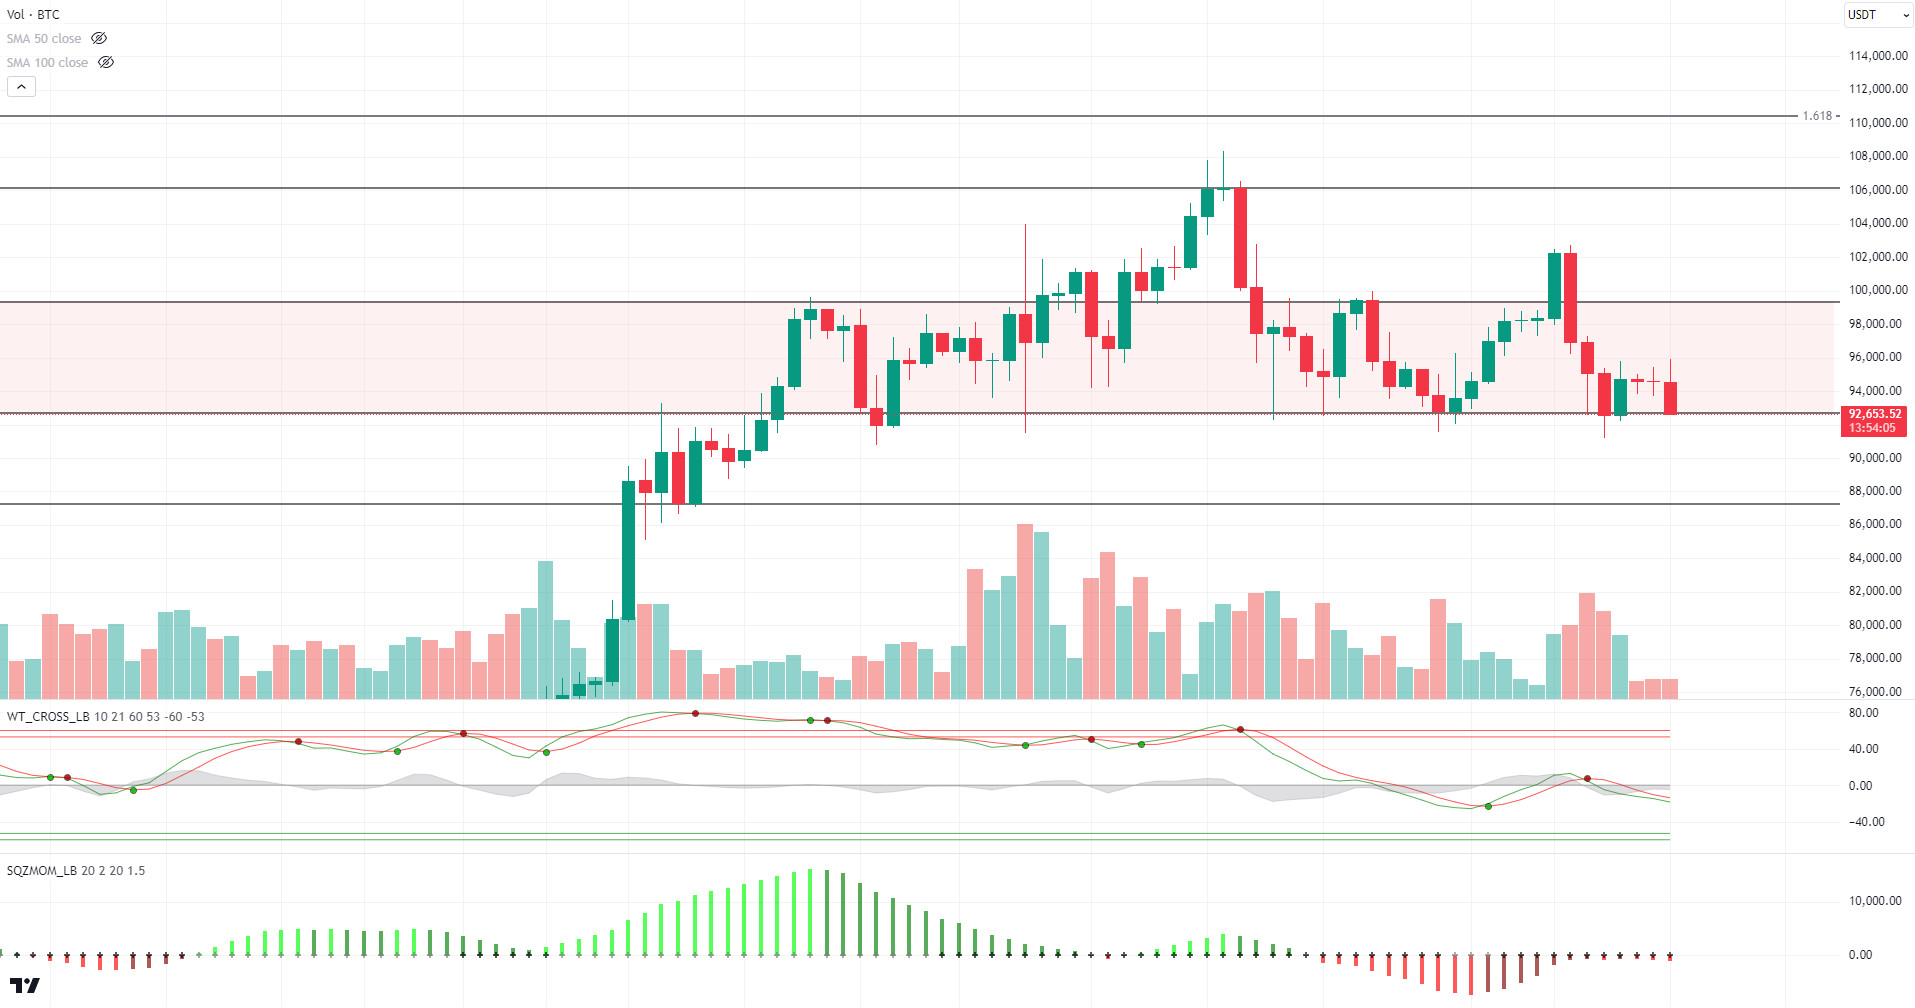
When we look at the technical outlook from a daily perspective, BTC, which fell to 91,300 with volatility, lost 5.48% on a weekly basis, erasing the previous week’s gains. In BTC, which is currently trading at 93,000, technical oscillators continue to maintain the sell signal, while we see that the momentum indicator displays a weak image in the negative zone. With the deepening of the decline, long trades at 90,000 and 91,000 on the weekly liquidation chart can be targeted. In a possible new upward movement, 96,000 and 98,000 levels, where short trades gain weight, can be targeted.
In the rest of the week, eyes will be on the US macro data, PPI and CPI data. In addition, earnings reports of CITI Group, JP Morgan and BlackRock companies in the US will be the other elements we will follow.
Supports 92,800 – 90,000 -88,500
Resistances 95,000 – 99,100 – 103,800
ETH/USDT
The better-than-expected December employment data released in the US on Friday caused a rise in bond yields and increased selling pressure in the crypto market, which is among the risky assets. These developments also led to a decline in the Ethereum (ETH) price. The Pectra upgrade to the Ethereum network, which is expected to be completed in the first quarter of 2025, aims to provide improvements in key areas such as data logistics, staking applications and smart contract deployment. The upgrade will have a positive impact on the efficiency and scalability of the Ethereum network. In the NFT ecosystem, Azuki, one of the largest collectors of Ethereum, announced the launch of a token called AnimeCoin. The launch news caused an increase in the floor prices of Azuki, Azuki Elementals and Beanz collections, indicating that the demand for Ethereum-based projects in the NFT market continues. In addition, Base, one of the Ethereum-based Layer-2 networks, attracts attention with an increase in the number of transactions. In particular, the launch of AI-Agent and DeSci projects on Base created a high demand on the network and significantly increased transaction volumes.
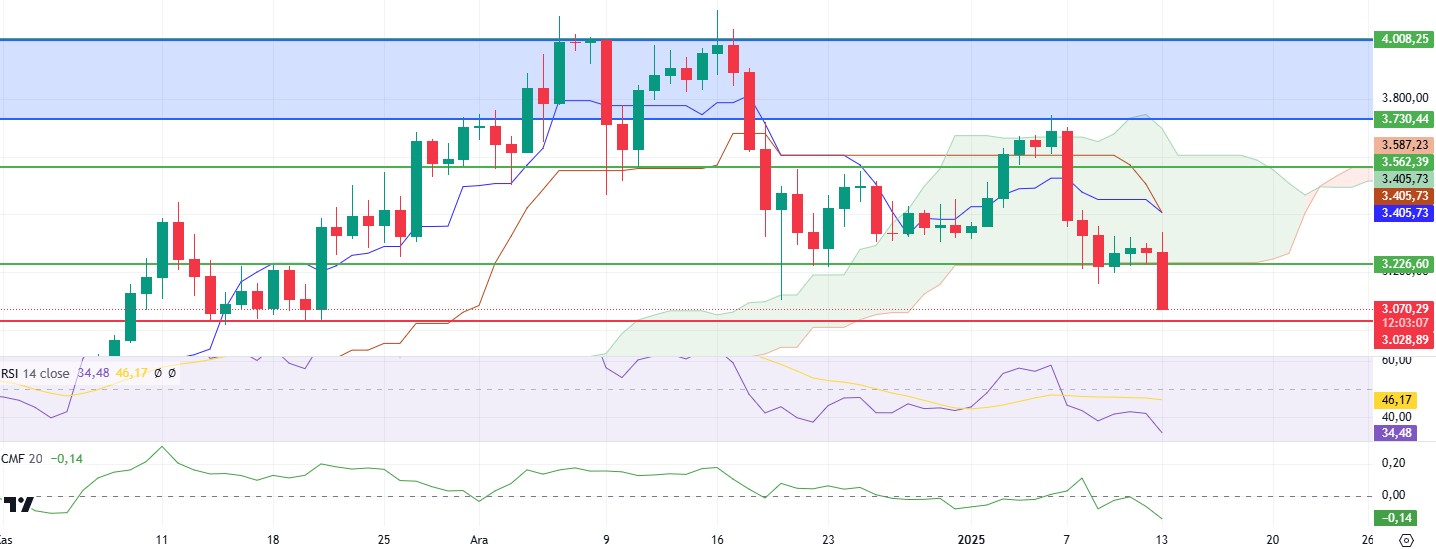
On the technical analysis side, it is noteworthy that the Ichimoku indicator has moved below the kumo cloud where the price has been supported for a long time. This suggests a negative outlook for the market and raises the possibility of a deeper decline. The intersection of Tenkan-sen and Kijun-sen levels is also considered as an additional negative factor. Relative Strength Index (RSI) and momentum indicators signaled a downward momentum, while Chaikin Money Flow (CMF) rejected from the zero zone and headed down. These data suggest that selling pressure may strengthen and new capital inflows to the market remain limited.
In case the price fails to make a permanent close above the 3,226 level, lower support levels are likely to be tested. The 3,226 level is critical for a positive outlook. Exceeding this level may allow the market to initiate a move towards recovery. However, current technical indicators suggest that weakness signals may continue in the short term.
Supports 3,028 – 2,874 – 2,404
Resistances 3,226 – 3,562 – 3,730
XRP/USDT
There is growing anticipation on Wall Street for the creation of a spot exchange-traded fund (ETF) for XRP. Following the success of the adoption of Bitcoin and Ethereum ETFs, the approval of an ETF for XRP could significantly boost XRP’s liquidity and adoption among institutional investors. Such a development could give a strong boost to XRP’s market capitalization and trading volumes. Ripple’s new US dollar-indexed stablecoin, Ripple USD (RLUSD), is now available on global exchanges. Designed at an institutional level, the stablecoin aims to appeal to a wide range of users by combining the stability of fiat currencies with the efficiency of blockchain technology. This is a strategic move that will not only strengthen Ripple’s position in the financial technology space but also increase the volume of transactions on the network.
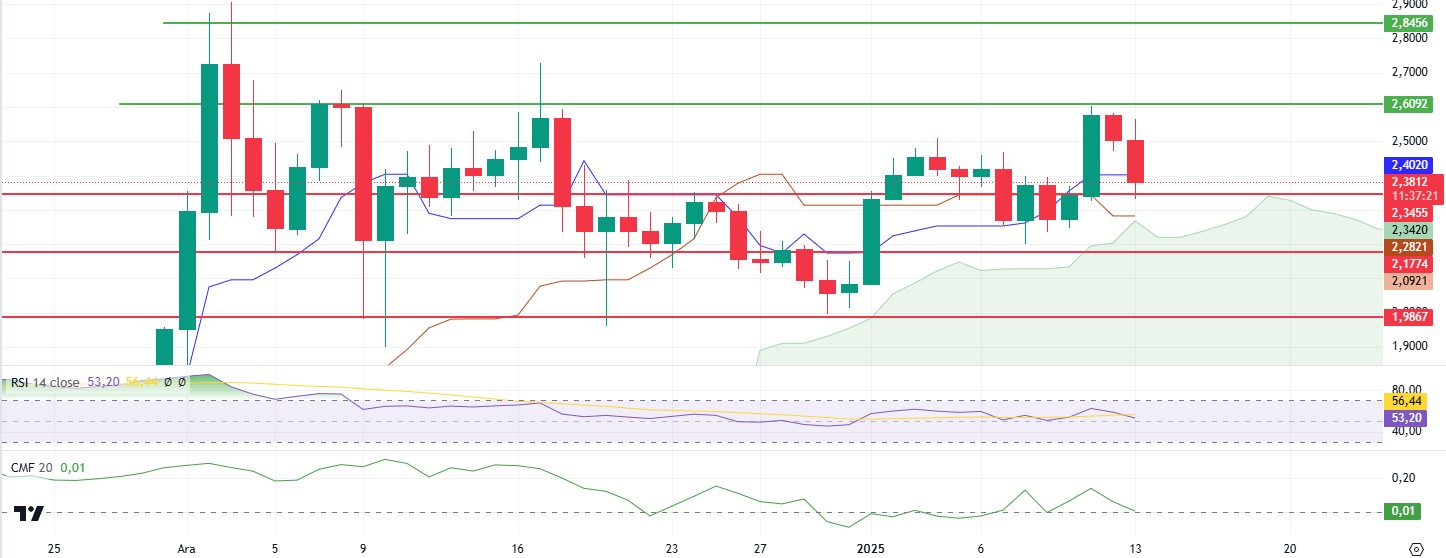
XRP surpassed the technical resistance of 2.35 and quickly rose as high as 2.60. However, due to the general selling pressure in the crypto market, the price fell back to the 2.35 level. This move suggests that the market sees this level as an important demarcation point, both as a support and resistance. The intersection of tenkan-sen and kijun-sen on the Ichimoku indicator generated a positive signal. However, this positive outlook may remain limited due to uncertainties in market conditions. The Chaikin Money Flow (CMF) indicator started to show a negative momentum amid the recent selling pressure, suggesting a weakening in the market’s liquidity inflows. Relative Strength Index (RSI) has also moved downwards, indicating that buying pressure has diminished and selling pressure has increased.
It is critical for the price not to lose the 2.35 level for a rebound. In case of a decline below this level, the price can be expected to retreat to lower support levels respectively. On the upside, the 2.60 level stands out as an important resistance that needs to be broken if the price is bullish again. While Ripple and XRP’s fundamental developments offer a positive outlook in the long term, short-term technical indicators suggest that selling pressure may continue for a while.
Supports 2.3455 – 2.1774 – 1.9867
Resistances 2.6567 – 2.8456 – 3.0605
SOL/USDT
Last week, Solana developers created a quantum-resistant vault that uses a decades-old cryptographic technique to protect users’ funds against potential quantum computer attacks. The solution, called Solana Winternitz Vault, implements a hash-based signature system that generates new keys for each transaction. Solana Mobile announces its intention to launch its second smartphone, Seeker. Solayer, one of Solana’s leading restaking applications, officially announced the decentralization of its protocol. According to BlockBeats, on January 7, the Solana Foundation introduced proposal SIMD-0215, which aims to expand Solana’s infrastructure to accommodate billions of user accounts. This proposal includes the addition of a new hash called ‘Accounts Lattice Hash’. On the other hand, Solayer introduced InfiniSVM, a hardware-accelerated blockchain for Solana, targeting network speeds of 100 Gbps with atomic state consistency. Canadian firm Sol Strategies announced a strategic investment in Solana. On the Onchain side, there was a surge in trading activity, with open interest reaching $6.68 billion, a historic record. DeFi TVL also reached a 3-year high of $9.54 billion. Next week, inflation data from the US will be important.
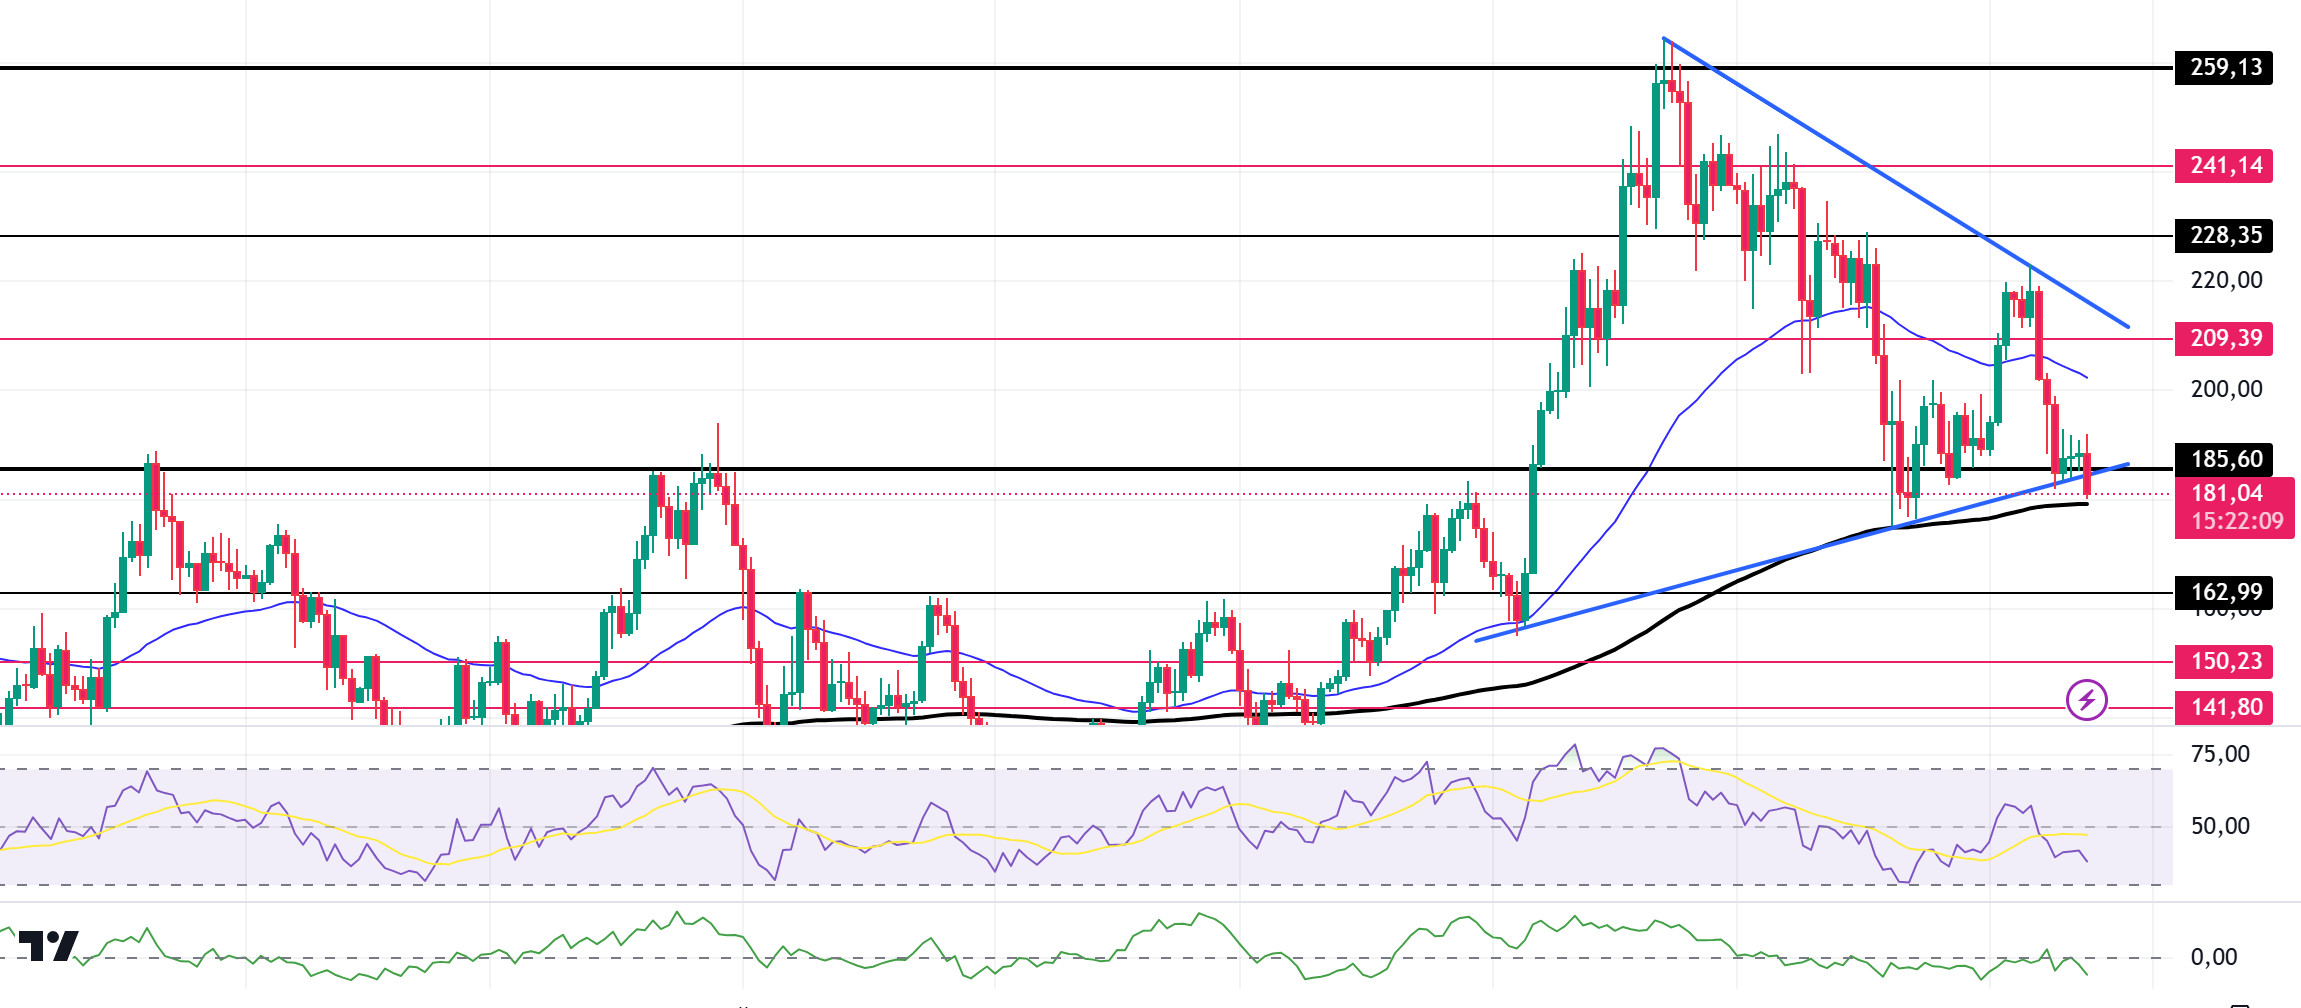
SOL, the 5th largest crypto by market capitalization, has been in the base zone of the symmetrical triangle pattern, continuing to decline throughout the week. This continued the downtrend that has been in place since November 22. The asset is stuck between the 50 EMA (Blue Line) and the 200 EMA, testing the 200 EMA as support at the time of writing. From here, the price may gain momentum from both the strong support at 185.60 and the support of the symmetrical triangle pattern. These two supports make this a very strong support. On our daily chart, the 50 EMA (Blue Line) continues to be above the 200 EMA (Black Line). This shows that the trend is bullish in the medium term. Relative Strength Index (RSI) 14 is moving in the negative territory, adding selling pressure. However, when we analyze the Chaikin Money Flow (CMF)20 indicator, we see that money inflows and outflows have increased. If the positive results in macroeconomic data and positive developments in the ecosystem continue, it may test the first major resistance level of 209.39. In case of negative macroeconomic data or negative news in the Solana ecosystem, the 162.99 level can be followed and a buying point can be determined
Supports 162.99 – 150.23 – 141.80
Resistances 185.60 – 209.39 – 228.35
DOGE/USDT
Elon Musk aims to pay for the X platform with DOGE. According to Forbes, leaked information suggests that X Money will launch soon without approval from all states in the US. Alex Finn stated that changes in the platform code indicate that the launch is being accelerated. On the other hand, Elon Musk shared on the X platform that “if dollar inflation is solved, the price in dollars to buy cryptocurrency will actually go down, other things being equal. The important thing is the ratio of dollar to crypto. Senator Joni Ernst emphasized the importance of D.O.G.E, the newly created Department of Government Efficiency led by billionaire entrepreneurs Elon Musk and Vivek Ramaswamy, saying that taxes should not be wasted. “Doge is inevitable,” he said, urging other senators and politicians to join this initiative. On the Onchain side, IntoTheBlock data shows that those who have held the asset for less than a month have increased their holding period by 110% in the last month. Dogecoin futures assets also reached 106.95 billion DOGE, reflecting increased market interest and price appreciation. According to the data, more than 60 billion DOGE transactions were executed as whales actively participated in trading. “The decline in social media posts and the general sentiment around Dogecoin may signal a buying opportunity for traders,” Santiment said. Next week, inflation data from the US will be important.
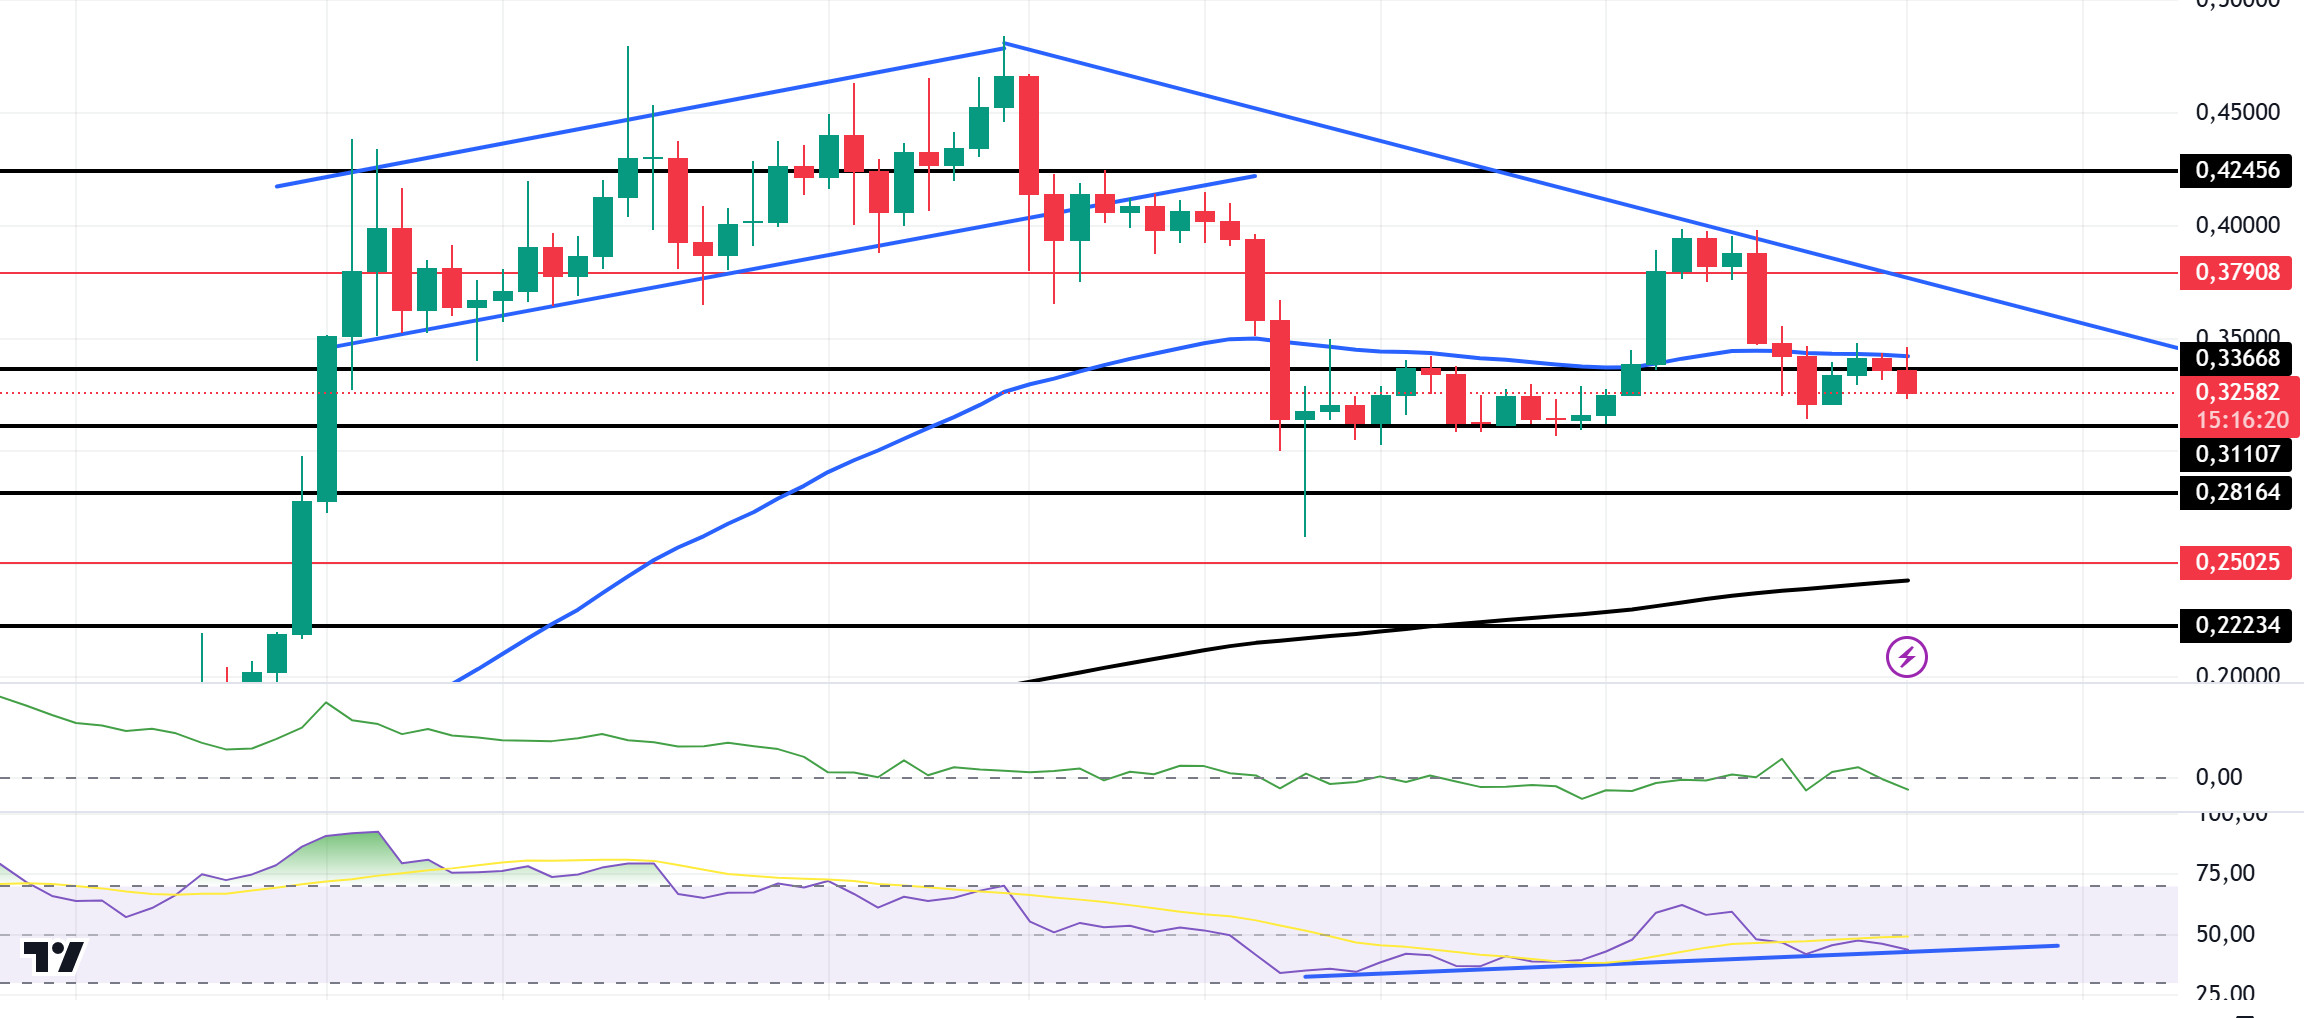
Looking at the daily chart, the 50 EMA (Blue Line) continues to stay above the 200 EMA (Black Line), indicating that the bull continues for the asset, but the difference between the two averages is 40.40%, increasing the possibility that the decline may continue. At the same time, the 50 EMA is acting as resistance at the time of writing. Again on our daily chart, the asset, which has been in a downtrend since December 8, has been slightly rising, gaining volume at 0.31107. When we look at the Chaikin Money Flow (CMF)20 indicator, it moved from the neutral zone to the negative zone. Relative Strength Index (RSI)14 found value in the middle of the negative zone. At the same time, the RSI chart shows an uptrend and is currently testing the support level. This could push the price higher. In case of possible negative developments in macroeconomic conditions and ecosystem and pullbacks, 0.31107 can be followed as a strong support. In case of a continuation of the rises, 0.42456 should be followed as a strong resistance.
Supports: 0.31107 – 0.28164 – 0.25025
Resistances: 0.33668 – 0.37908 – 0.42456
TRX/USDT
TRX, which started last week at 0.2627, fell by about 11% during the week and closed the week at 0.2335. This week, producer price index, consumer price index, unemployment claims and retail sales data will be announced on the US side. Especially the consumer price index data will be closely followed by the market and if it is announced above expectations, it may create selling pressure in the cryptocurrency market.
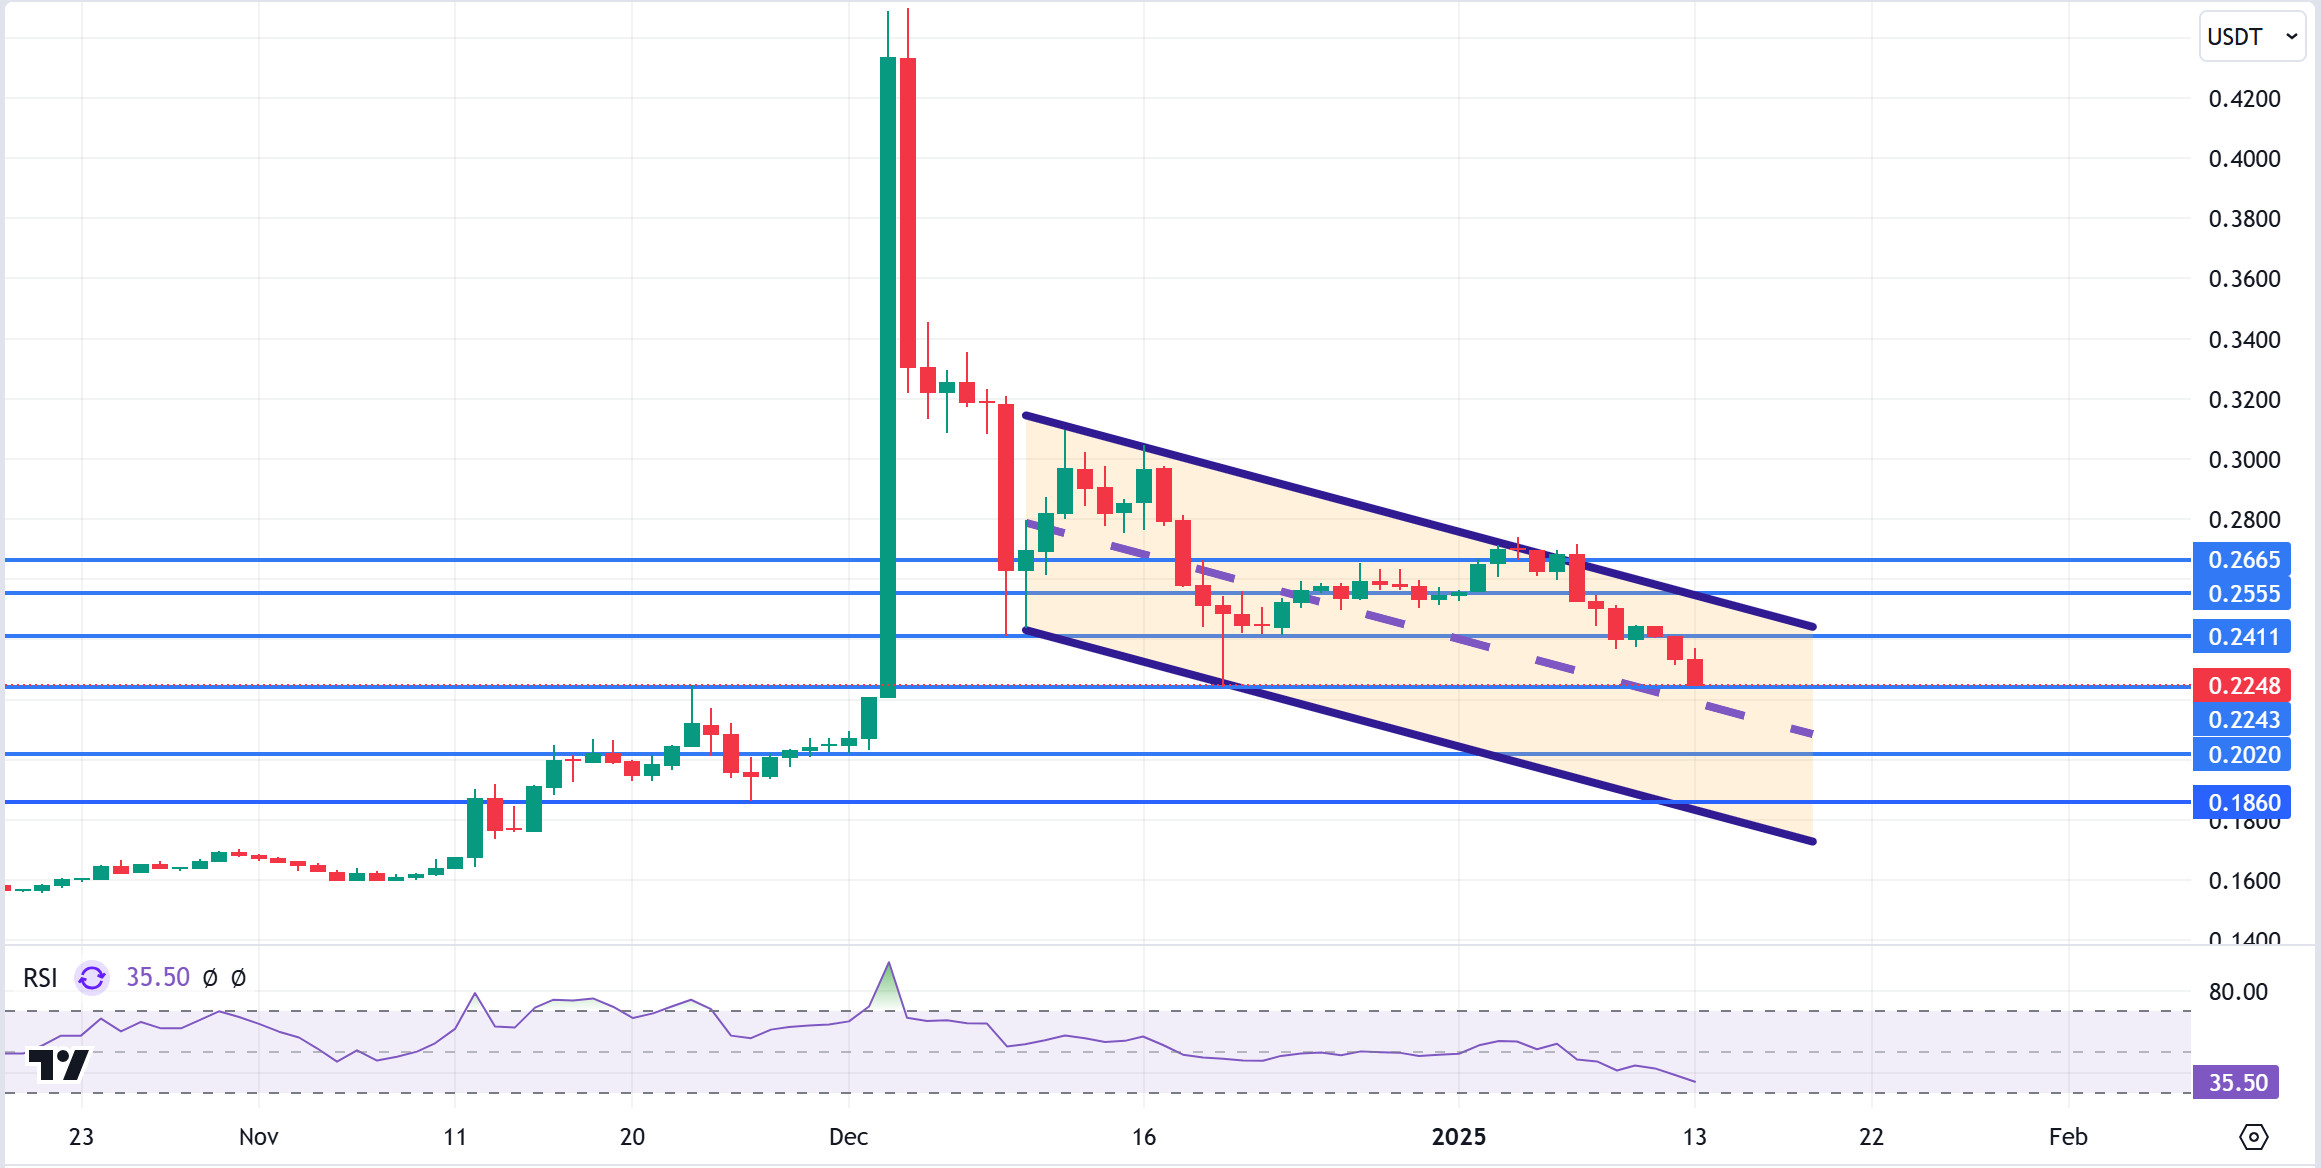
TRX, currently trading at 0.2248, is in the middle band of the bearish channel on the daily chart. With a Relative Strength Index value of 35, it can be expected to rise slightly from its current level and move towards the upper band of the bearish channel. In such a case, it may test the 0.2411 and 0.2555 resistances. If it cannot close above 0.2411 resistance on a daily basis, it may decline with the possible sales reaction and may want to move to the lower band of the channel. In such a case, it may test 0.2020 support. As long as it stays above 0.1860 support on the daily chart, the bullish demand may continue. If this support is broken, selling pressure may increase.
Supports: 0.2243 – 0.22020 – 0.1860
Resistances: 0.2411 – 0.2555 – 0.2665
AVAX/USDT
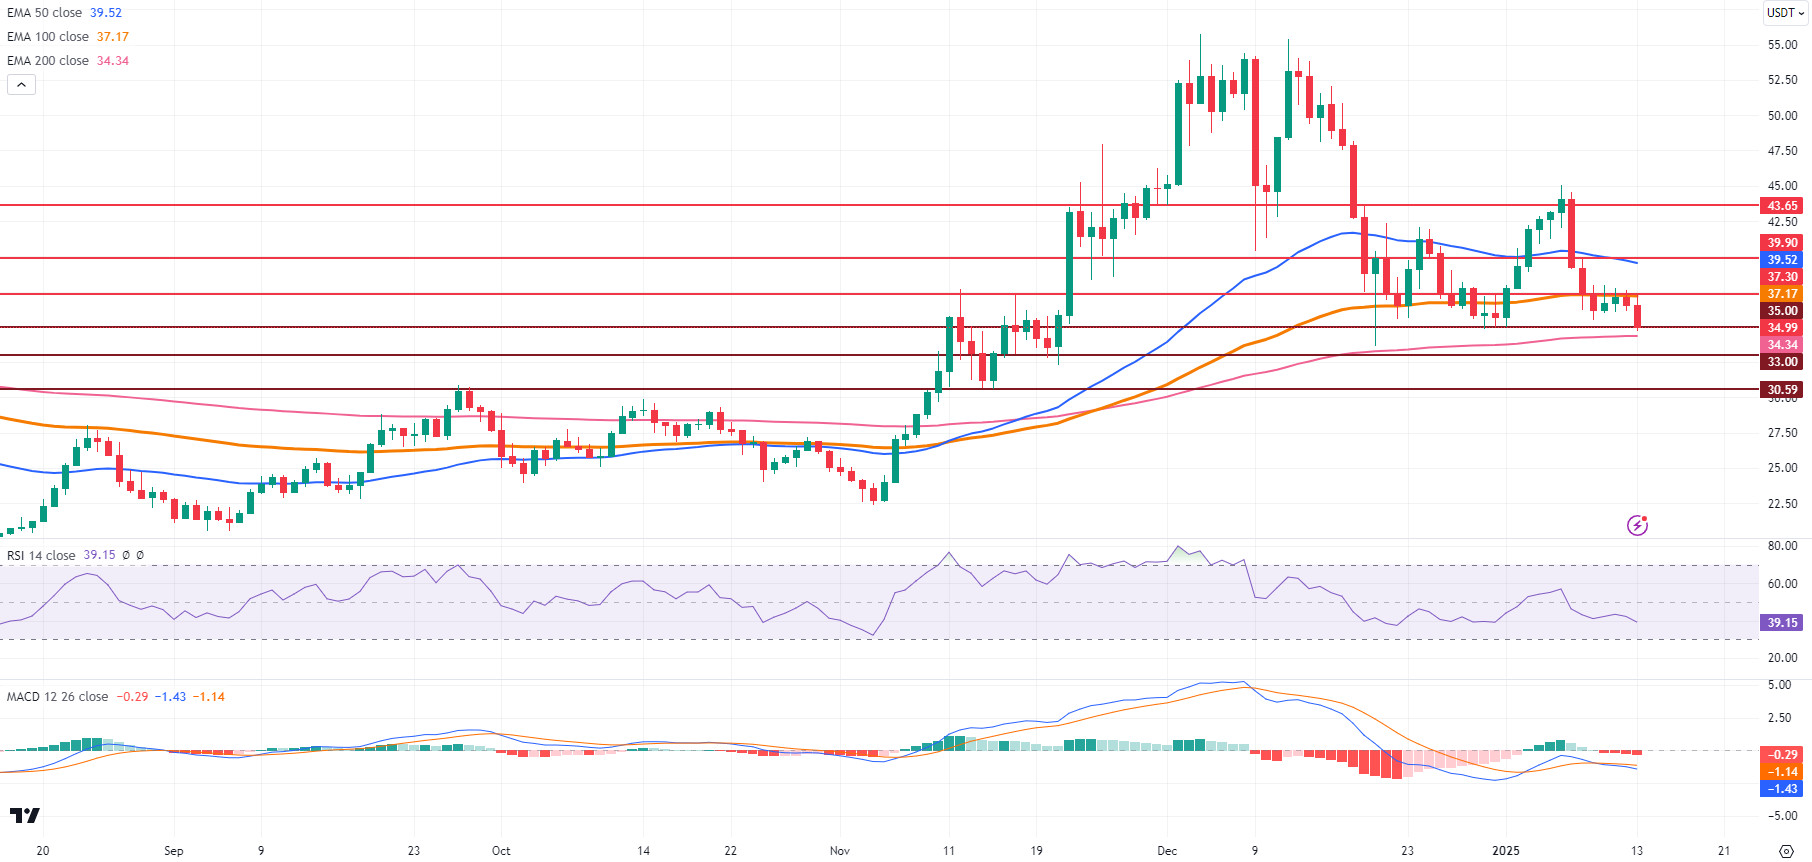
AVAX, which started last week at 43.11, fell sharply with the selling pressure created by the US economic data in the crypto market and closed the week at 36.54. AVAX tested the 100-period Exponential Moving Average (EMA100) resistance level at 37.30 on its way up, but failed to break this level and went down. AVAX, which started the new week negatively, is testing the critical support level at 35.00.
The Moving Average Convergence/Divergence (MACD) indicator is in negative territory and below the signal line, indicating that bearish momentum continues. The Relative Strength Index (RSI 14) is at 39.15 and close to oversold territory. Continuation of the RSI at these levels may strengthen the possibility that the market is under pressure but buying is likely to come.
On the daily chart, the 35.00 and EMA200 support levels stand out as strong support. If these levels are maintained, AVAX may retest the 37.30 resistance and the EMA100 level. After a close above this level, AVAX may test the EMA50 and 39.90 resistance levels in the continuation of the rise. A close above 39.90 resistance level may support a rise to 43.65 main resistance level. Otherwise, a break of the 35.00 level may cause AVAX to fall to the EMA200 and 33.00 support levels, and a close below these levels may cause a pullback to 30.59. RSI’s decline below 35 and MACD’s continued weakness in the negative territory may reinforce the deepening of the decline.
The US inflation data to be released on January 15, 2025 may increase volatility in the market. In this process, AVAX may fluctuate between support and resistance levels. While maintaining critical supports increases the potential for recovery, closes above resistance levels may strengthen the bullish momentum. In the opposite case, the decline may deepen.
(EMA50: Blue Line , EMA100: Orange Line , EMA200: Pink Line)
Supports: 35.00 – 33.00 – 30.59
Resistances: 37.30 – 39.90 – 43.65
SHIB/USDT
This week, the Shiba Inu ecosystem was highlighted by Shibarium’s transaction volume and community outreach efforts. Shibarium realized a total of 800 million transactions, demonstrating the network’s active usage. The SHIB community increased its weekly burn rate by 52.74%, removing 87 million tokens from circulation. While the community has made suggestions to expand the burn mechanism, lead developer Shytoshi Kusama stated that burns can only accelerate with the increased usage of Shibarium. These developments have once again highlighted the growth ambitions of the SHIB ecosystem and the importance of the burn strategy.
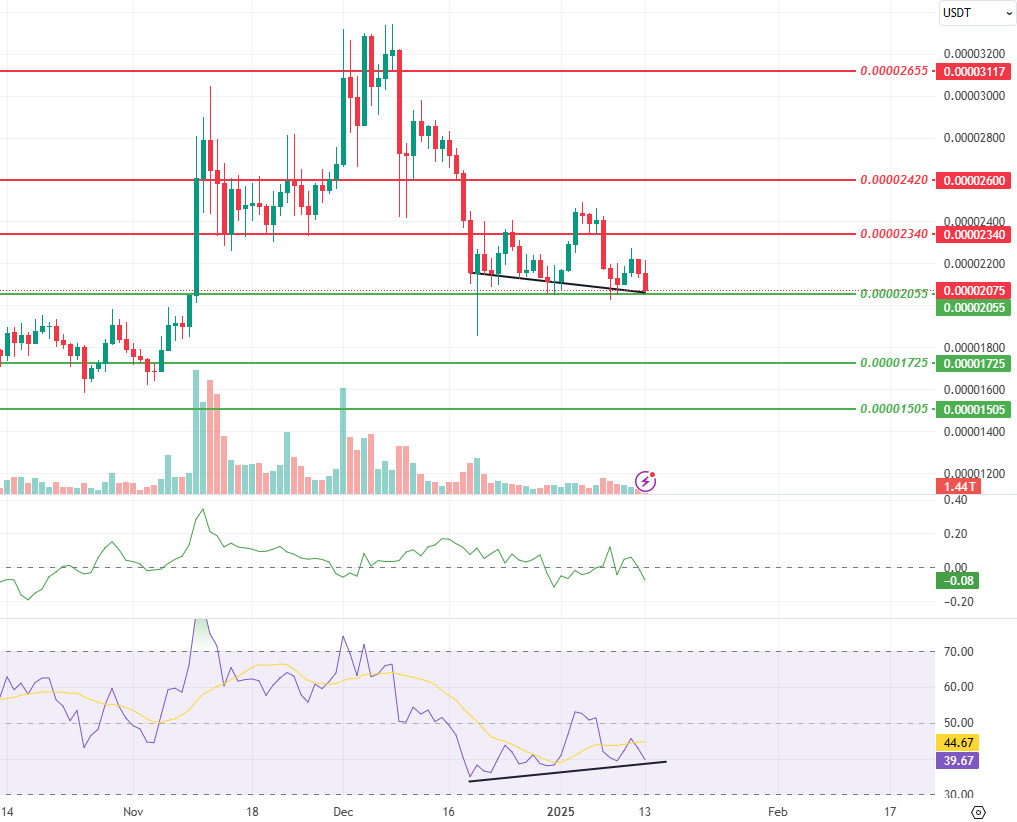
Technically, Shiba Inu (SHIB), after losing the 0.00002300 support level, moved towards 0.00002055, another support level. SHIB, which rose again with the reaction it received from the 0.00002055 support level, succumbed to selling pressure. When we analyze the Chaikin Money Flow (CMF) oscillator, we can say that selling pressure is stronger than buying pressure. In this context, if the price persists below the 0.00002055 level, it may bring a retracement towards the next support level of 0.00001725. On the other hand, when we examine the Relative Strength Index (RSI) oscillator, we see an increase in the RSI oscillator (Black Line) while the price has been falling since December 19. After this positive divergence, if the price maintains above the 0.00002055 level with increasing token burn rates, the next resistance level we should follow may be 0.00002340 levels.
Supports 0.00002055 – 0.00001725 – 0.00001505
Resistances 0.00002340 – 0.00002420 – 0.00002655
LTC/USDT
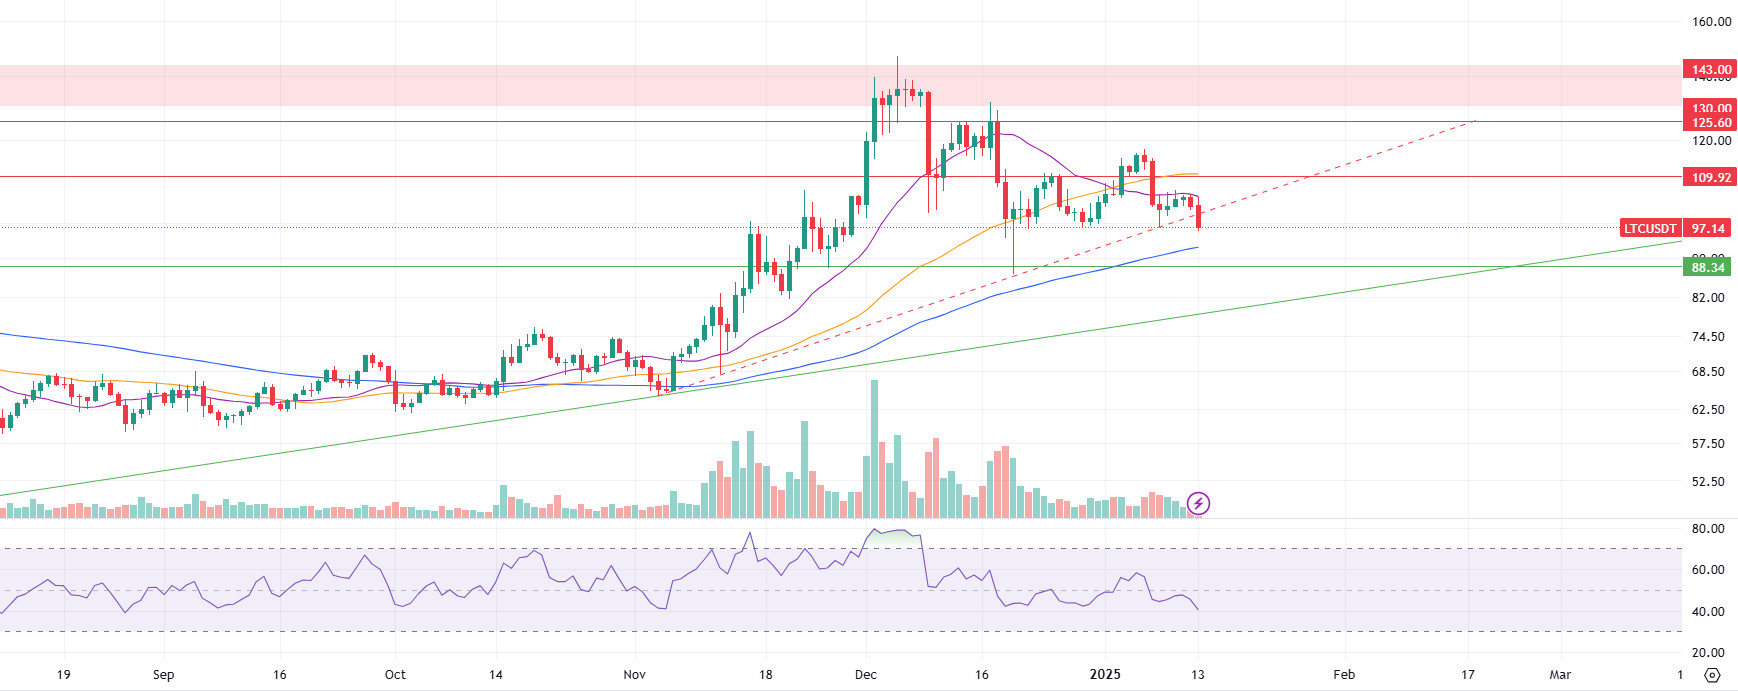
LTC, which lost 11.56% last week with a negative close, started the week at 102.35. In this process, the official X account was hacked on Saturday, while on the market side (according to Arkham data), there was a total position of 307 million dollars in futures trading on LTC at the beginning of last week, while this week there was 238 million dollars of trading. Funding rates have turned negative in some exchanges. In market capitalization, it fell one place to 23rd place.
LTC’s daily chart shows that the price is below the 20-day (purple line) and 50-day (orange line) simple moving averages and above the 100-day (blue line) moving average, while breaking the rising trend line (dashed red line) to the downside. This week’s movements are dominated by negative indicators, such as a break of the uptrend and a break below the moving averages. On the RSI (relative strength index) side, there is no sign of a reversal. According to this scenario, the first reaction level in the continuation of the decline may be 92.91, where the 100-day moving average is momentarily located. Subsequently, the horizontal support at 88.34 also coincides with the Fibonacci retracement level and constitutes an important support area. With a downside break of these levels, the uptrend support from August 2025 is momentarily at 79.00. In upside scenarios, the first stop is the 20-day moving average at 104.76. Subsequently, the coincidence of the 50-day moving average and horizontal resistance highlights 109.92 as an important resistance point for this week. Finally, selling pressure can be expected to be encountered at 125.60.
Resistances: 104.76 – 109.92 – 125.60
Supports 92.91 -88.34- 79.00
LINK/USDT
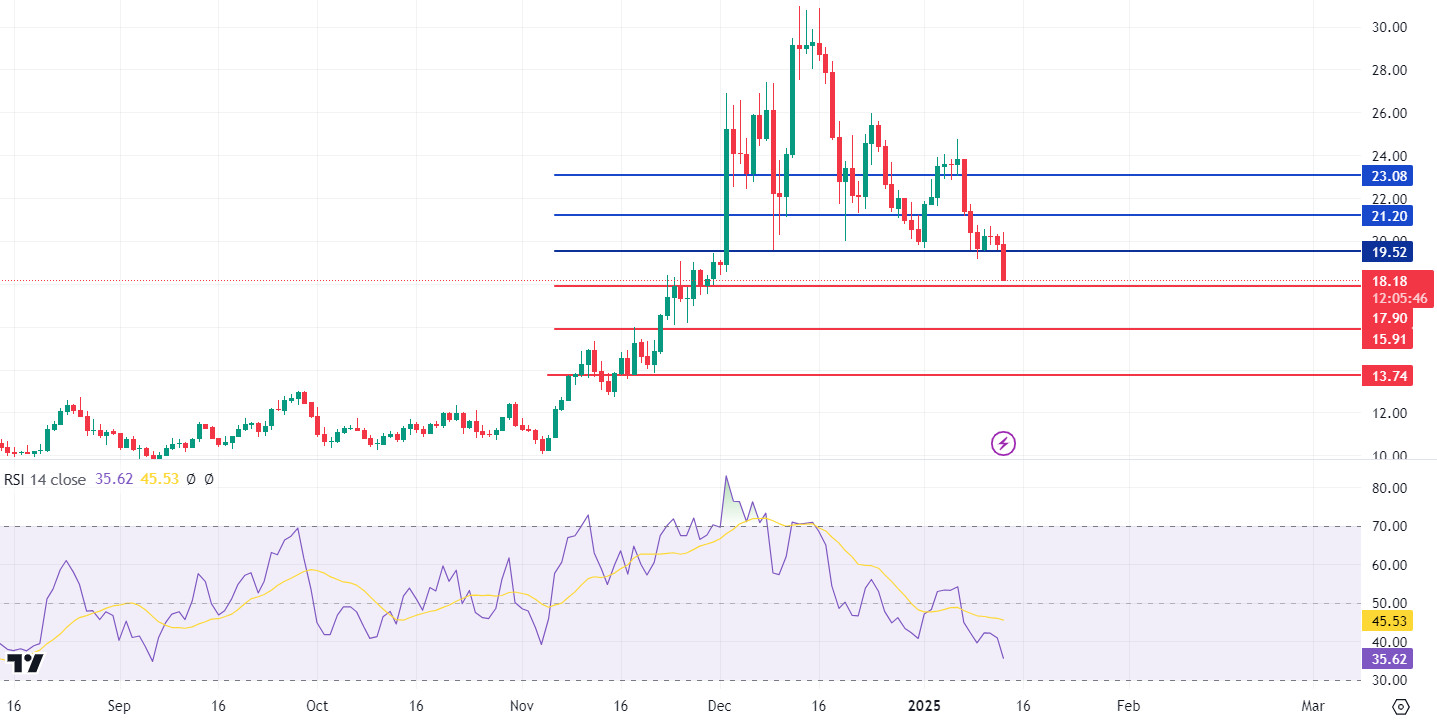
Although Chainlink (LINK) tried to hold on to the 19.49 support, which we stated as a critical level in the previous week, the negative technical outlook and the increased selling pressure on the market due to the impact of macroeconomic data paved the way for the start of a new downward movement. In addition, the loss of this level significantly strengthened the possibility of the “Shoulder to Head and Shoulders” pattern. At this point, it seems likely that the price will fluctuate between 19.52-17.90 for a while. In upward movements, although the first resistance is the 19.52 level, the 21.20 level is of great importance as a critical threshold. However, it should be kept in mind that a rise towards this level may be a fake move and may face a strong sell-off.
In downward movements, the 18.18 level appears as the first support point. A daily close below this level could pull the price down to 15.91 and 13.74, the pattern target, respectively. The Relative Strength Index (RSI) is currently hovering at 35.62 (negative territory), indicating that the selling pressure on the market continues. However, the RSI’s proximity to the oversold zone could create a perception of a bottom in the price and lead to a short-term rebound.
Supports 17.90 – 15.91 – 13.74
Resistances 19.52 – 21.20 – 23.08
BNB/USDT
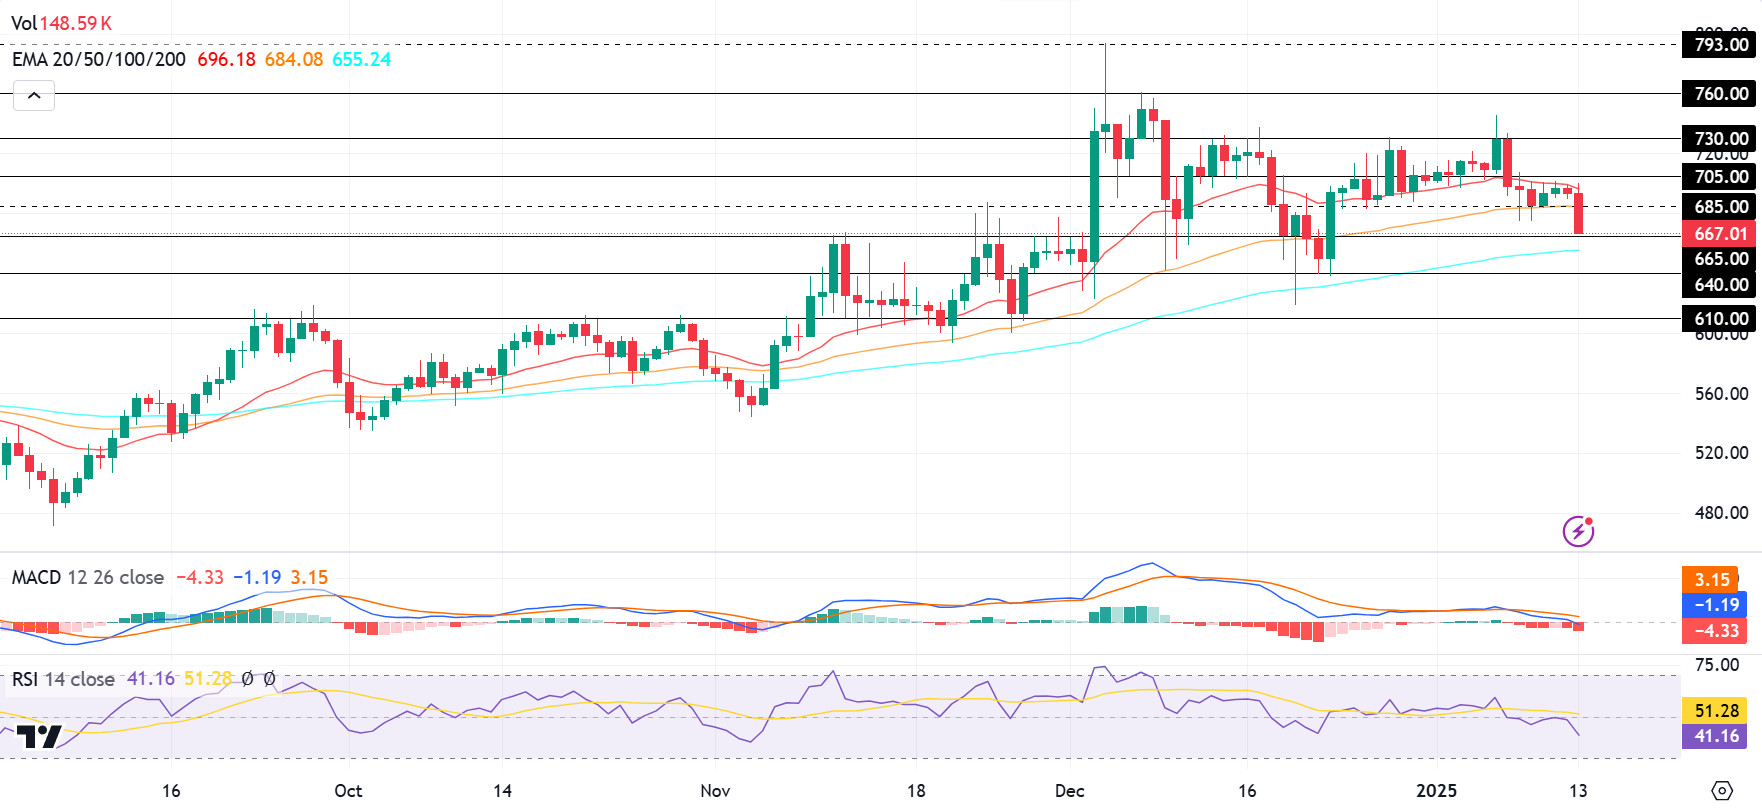
BNB/USDT, which gained a strong positive momentum at the beginning of last week with the support from the EMA 20 (red line) and 705 levels, continued to rise up to 745 levels. However, the asset entered a correction after the resistance encountered at these levels and continued its downward trend in the following days, falling below the 730 level. This downtrend, which continued until the middle of the week, was limited as the asset managed to hold above the EMA 50 (orange line) and regained positive momentum. In this context, BNB/USDT, which realized a rise towards the EMA 20 level, faced selling pressure from these levels as of the opening of the new week. With this pressure, it moved below the EMA 50 and 685 levels, maintaining its short-term negative outlook.
The RSI indicator fell below the 50 level and continued to move in this zone as the price was pressured. The RSI hovering below these levels may indicate that short-term selling pressure may continue. On the other hand, MACD indicator shows that selling pressure is increasing with negative signals. In this context, it is assessed that the trading volume in the direction of buying should increase in order to return to a positive momentum.
In this context, if the short-term negative momentum continues, the price can be expected to decline towards the 665 level. If the 665 level is broken down, there is a possibility of a pullback to 640 and 610 levels, respectively. However, a support from the 665 level could lead to a rebound towards the 705 level. If the 705 level is broken upwards, the 730 and 760 levels will be followed as new resistance zones.
Supports 665- 640- 610
Resistances 705- 730- 760
ADA/USDT
This week, the Cardano Foundation rejected a deal worth $3 million to facilitate integration, despite ADA assets being worth $2 billion. Since last week, ADA/USDT has risen 11% and its price has increased by 5.92% in the last 24 hours. Notably, this was the highest increase among crypto majors. Expected upgrades in this network of optimism could see momentum weaken with the sell-off in crypto assets this week.
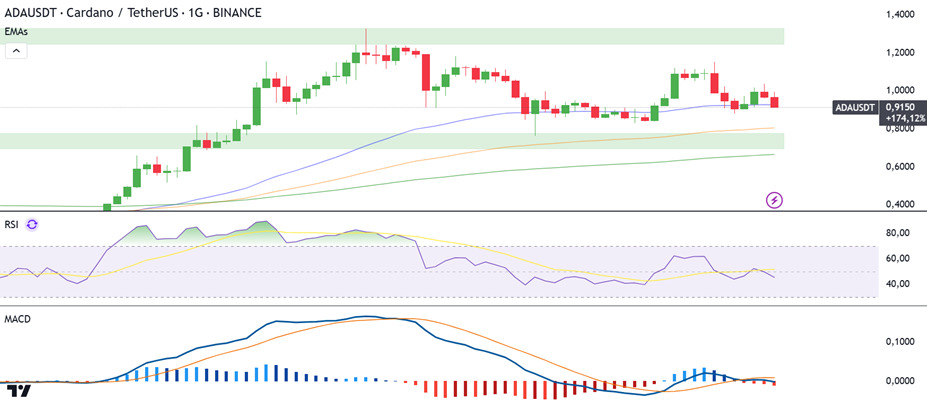
Looking at the technical chart, the Moving Average Convergence/Divergence (MACD) indicator is in negative territory and below the signal line, indicating that bearish momentum continues. The Relative Strength Index (RSI 14) is at 44 and close to oversold territory. If the RSI continues at these levels, it may indicate that the market is under pressure.
On the daily chart, the 0.9050 and EMA50 support levels stand out as strong support. If these levels are maintained, ADA may retest the 1.1050 resistance level. After a close above this level, ADA may test the 1.1100 resistance (Green Zone) levels in the continuation of the uptrend. Otherwise, a break of the 0.8850 level may cause ADA to fall to the EMA100 and 0.7749 (Green Zone) support levels. RSI’s break below 35 and MACD’s continued weakness in the negative zone may reinforce the deepening of the decline.
The US inflation data to be released this week may increase volatility in the market. In this process, ADA may fluctuate between support and resistance levels. Maintaining critical supports increases the potential for a rebound, while closing above resistance levels may strengthen the bullish momentum. In the opposite case, the decline may deepen.
(EMA50: Blue Line, EMA100: Orange Line, EMA200: Green Line)
Supports: 0.9050 – 0.8850 – 0.7749
Resistances: 1.1050 – 1.1100 – 1.1180
LEGAL NOTICE
The investment information, comments and recommendations contained in this document do not constitute investment advisory services. Investment advisory services are provided by authorized institutions on a personal basis, taking into account the risk and return preferences of individuals. The comments and recommendations contained in this document are of a general type. These recommendations may not be suitable for your financial situation and risk and return preferences. Therefore, making an investment decision based solely on the information contained in this document may not result in results that are in line with your expectations.


