BTC/USDT
We left behind a week of high volatility in Bitcoin and the ATH level reached above 109,000. In the week with macro data, non-farm employment data came well above expectations, while inflation data was in line with expectations, and in the Beige Book report published by the FED, an increase in economic optimism towards 2025 was observed and the expectation of an interest rate cut was brought to June. On the other hand, Microstategy, Sem Scientific and the government of El Salvador continued to buy Bitcoin.
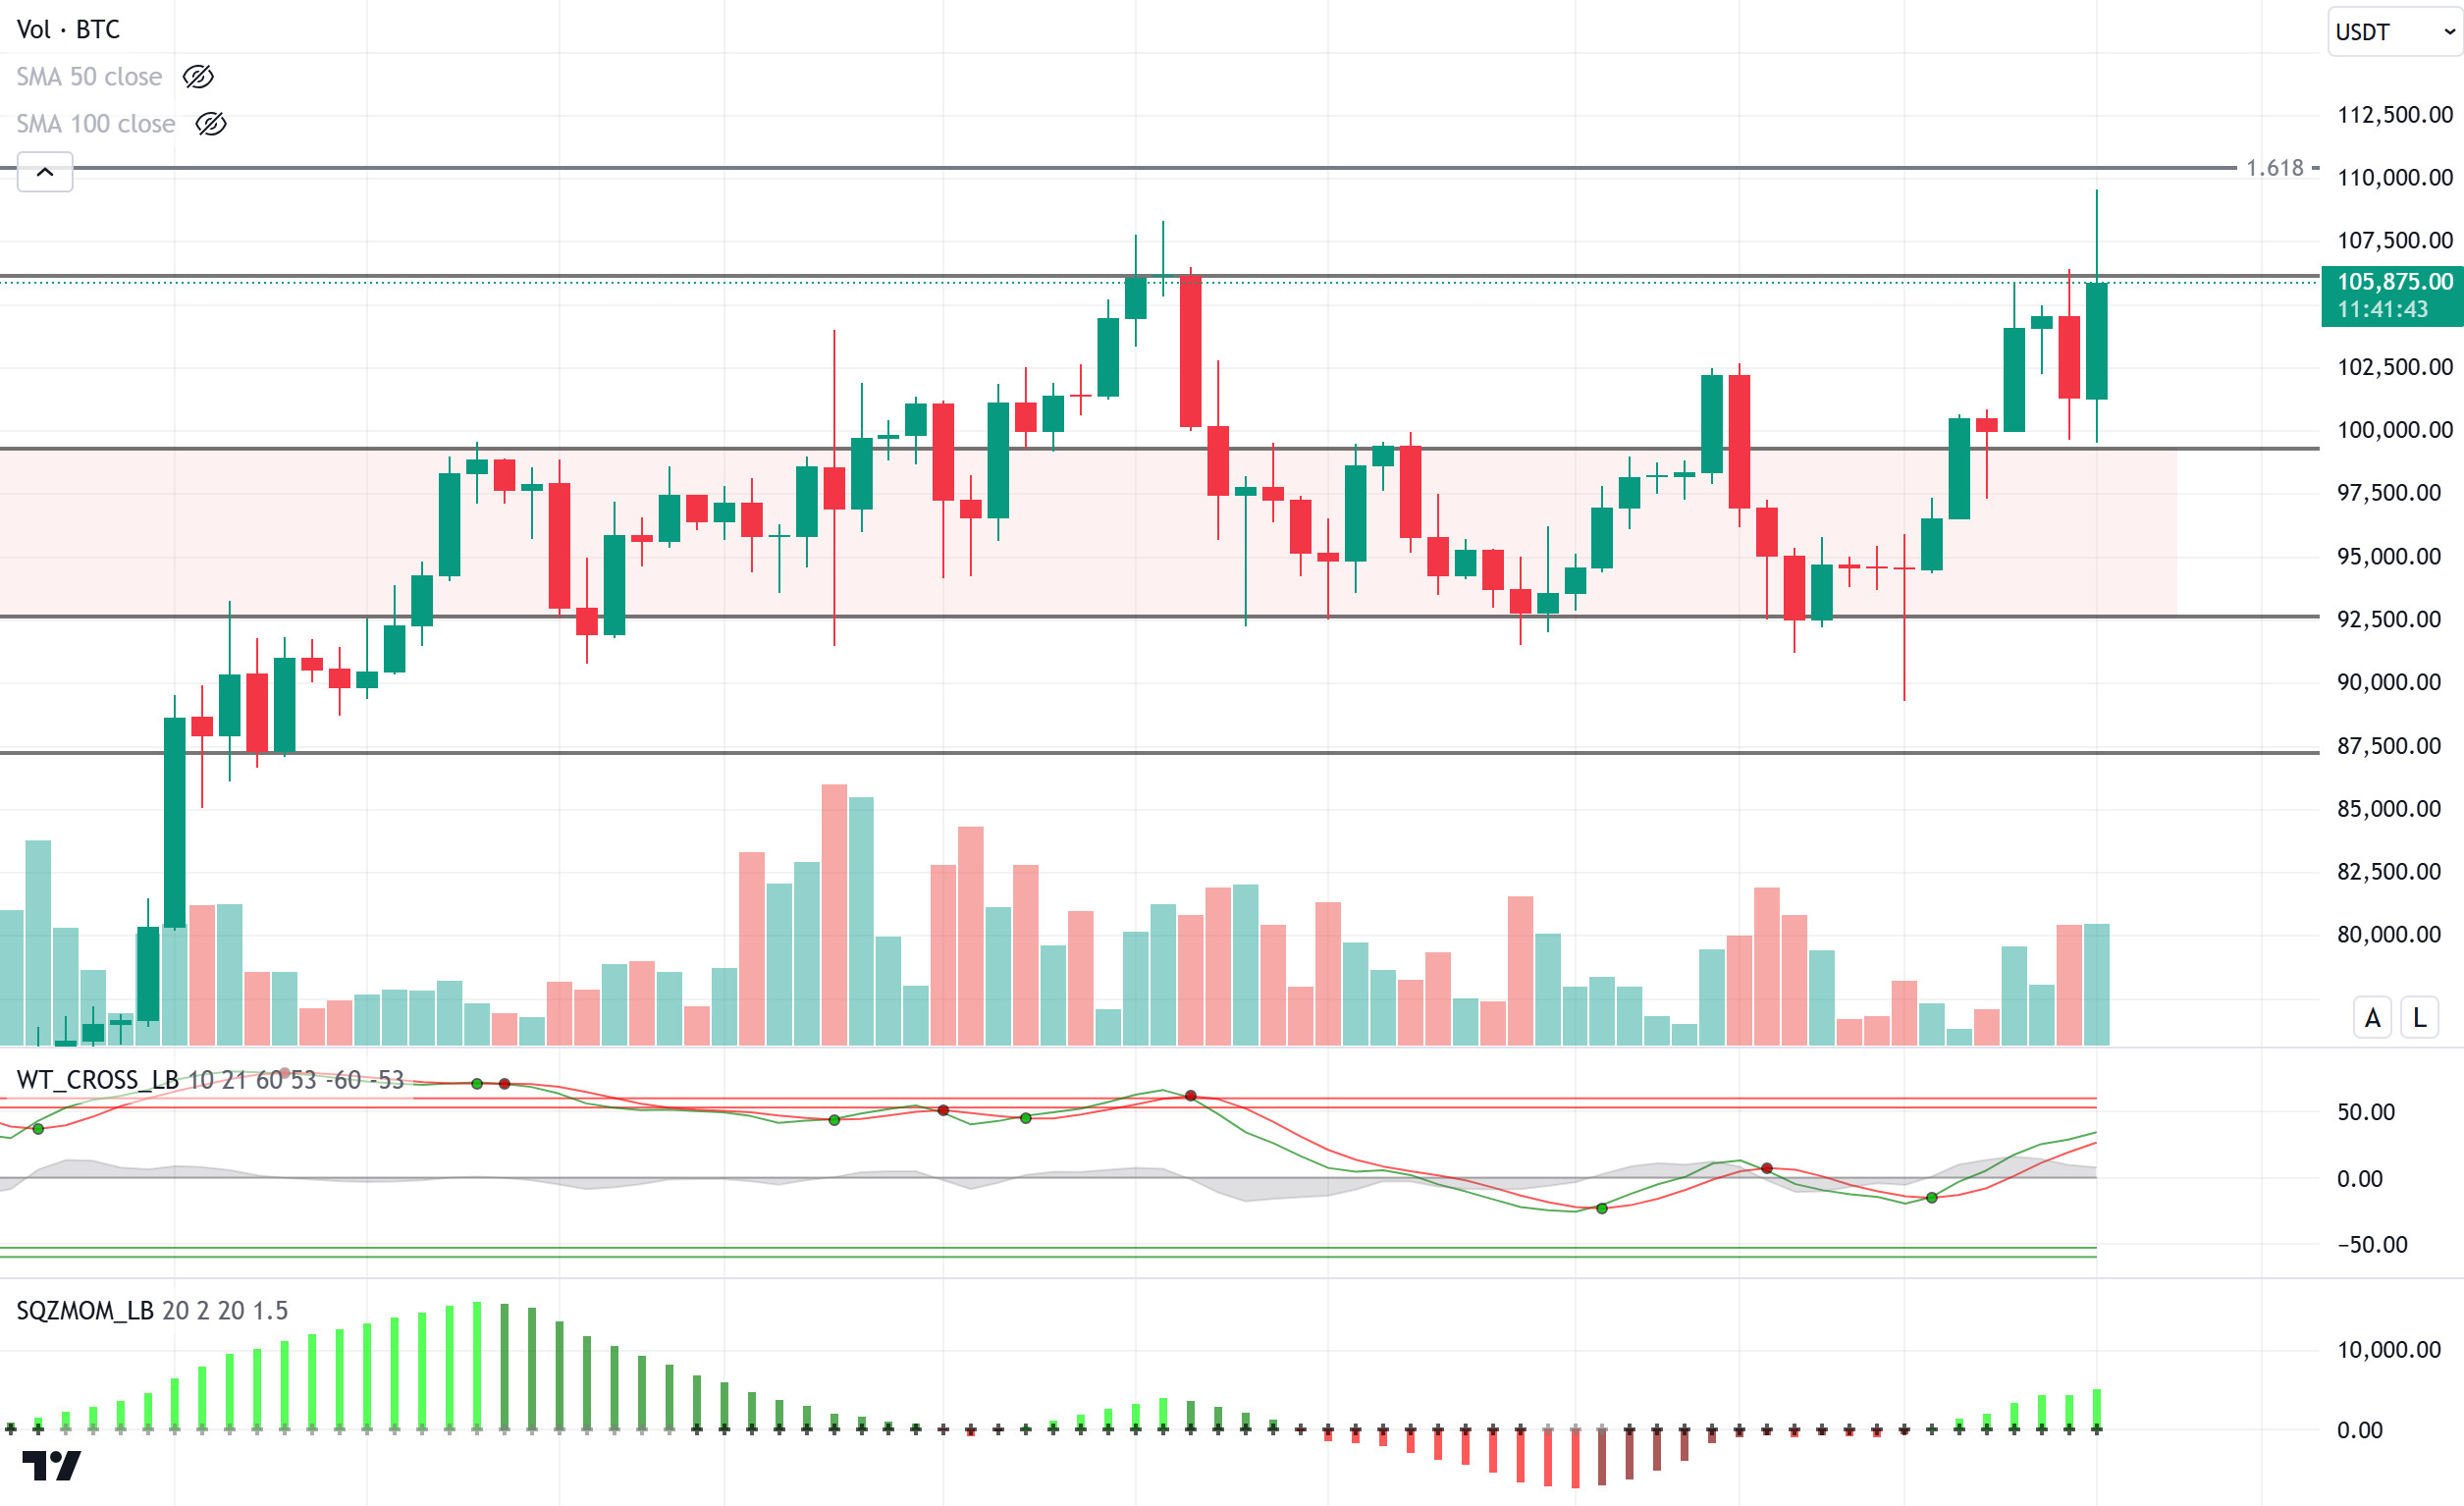
From a daily perspective, in the technical outlook, the price, which bottomed at 89,000, rose sharply to 109,450 as of today, moving the ATH level upwards. BTC, which fell to 99,600 on the last daily candle, recorded an ATH level in the same candle, providing a weekly return of 14.74%. As BTC continues to trade at the ATH level, we observe that technical oscillators continue to maintain the buy signal on the daily chart, while momentum is gaining strength. In the continuation of the rise, we will follow the psychological resistance levels of 110,000 and 115,000. In the event of a possible correction, the first support level is 106,000, followed by the 99,400 point just below the six-digit levels again.
Today, eyes will be on D. Trump’s inauguration ceremony and his statements about Bitcoin, especially the concrete steps he will take towards the Bitcoin reserve system may pave the way for the market to record new ATH levels in the coming days.
Supports 106,000 – 99,400 – 95,000
Resistances 108,000 – 109,400 – 110,000
ETH/USDT
Over the weekend, US President Donald Trump and his team launched the TRUMP and MELANIA coins, which reached multi-billion-dollar FDVs in a short period of time, drawing significant liquidity from the crypto market. This led to a week of high volatility in Ethereum. During this period, the ETH price fell as low as 3,131, before recovering and regaining the 3,292 level.
One of the positive news in the market was the announcement made by the Swiss State Bank PostFinance AG. The bank announced that it has developed a system that will allow its customers to earn passive income by staking on Ethereum. This decision could encourage the adoption of ETH by a wider user base. On the other hand, the Trump-backed World Liberty Financial (WLFI) company’s purchase of Ethereum with profits from TRUMP coin sales stood out as an important factor that enabled the price to recover and re-enter an uptrend.
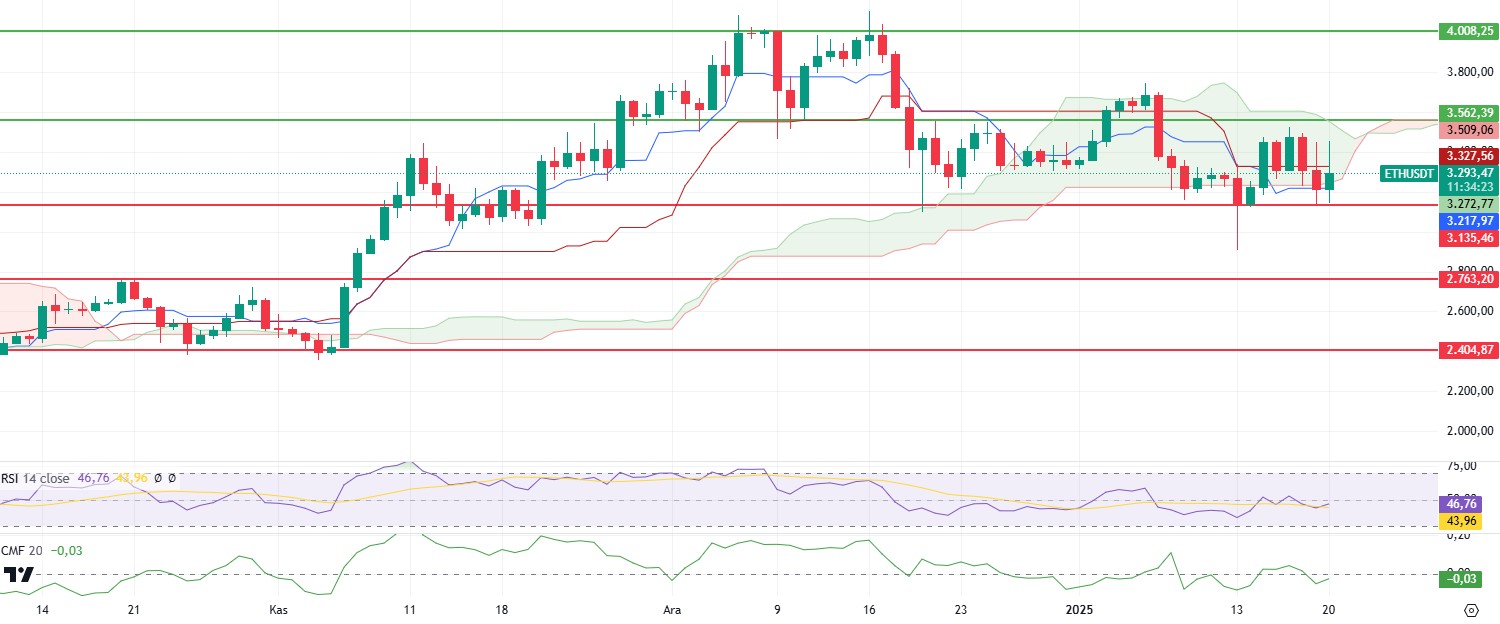
From a technical perspective, Ethereum regained the tenkan and kijun levels on the Ichimoku indicator and entered the kumo cloud, indicating a strengthening positive outlook. The Chaikin Money Flow (CMF) indicator crossed into positive territory, supporting the upside, which is another important signal confirming that buyers are gaining strength and market momentum is on the upside. However, the increase in Momentum and RSI indicators reinforces the expectation that Ethereum may continue its upward movement in the coming weeks.
As a result, Ethereum’s break above the 3,562 key resistance level could strengthen the positive trend and open the door for a rally towards the $4,000 levels. However, a breach of the major support at 3,135 could increase bearish risks, leading to a test of lower support levels. Therefore, it is crucial for traders to pay attention to key levels and keep a close eye on market dynamics.
Supports 3,135 – 2,763 – 2,404
Resistances 3,562 – 4,008 – 4,374
XRP/USDT
XRP has entered an uptrend as investors closely monitored developments in the lawsuit between Ripple Labs and the US Securities and Exchange Commission (SEC). The SEC’s 2020 lawsuit against Ripple Labs and CEO Brad Garlinghouse alleging that XRP was a digital asset security and was sold in an unregistered manner is seen as an important milestone in the crypto market. In July 2023, a federal judge ruled that sales of XRP on public digital asset exchanges were not securities, while sales to institutional investors violated federal law. The SEC’s appeal of this decision and the possibility of the case being dropped under President Donald Trump, who will take office on January 20, 2025, has increased optimism among market participants. In particular, Trump’s plan to appoint former SEC Commissioner Paul Atkins, known to be crypto-friendly, to replace current SEC Chairman Gary Gensler has further strengthened this expectation.
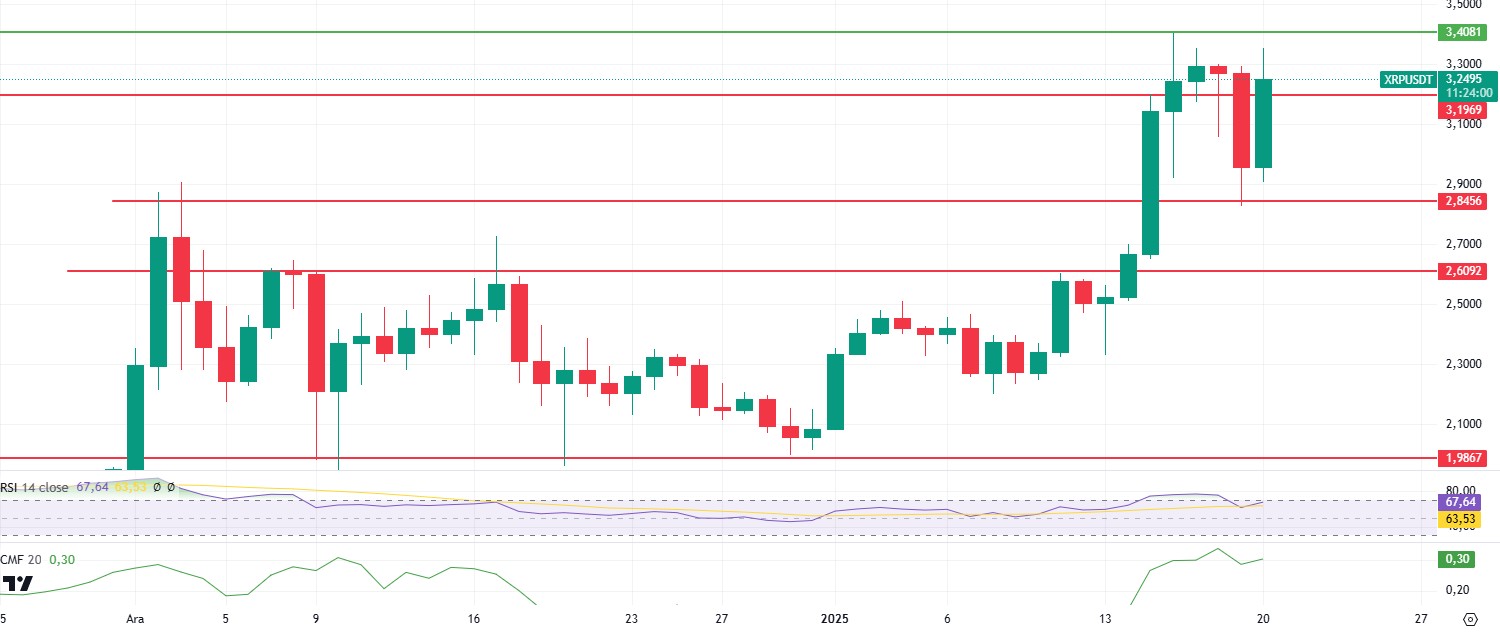
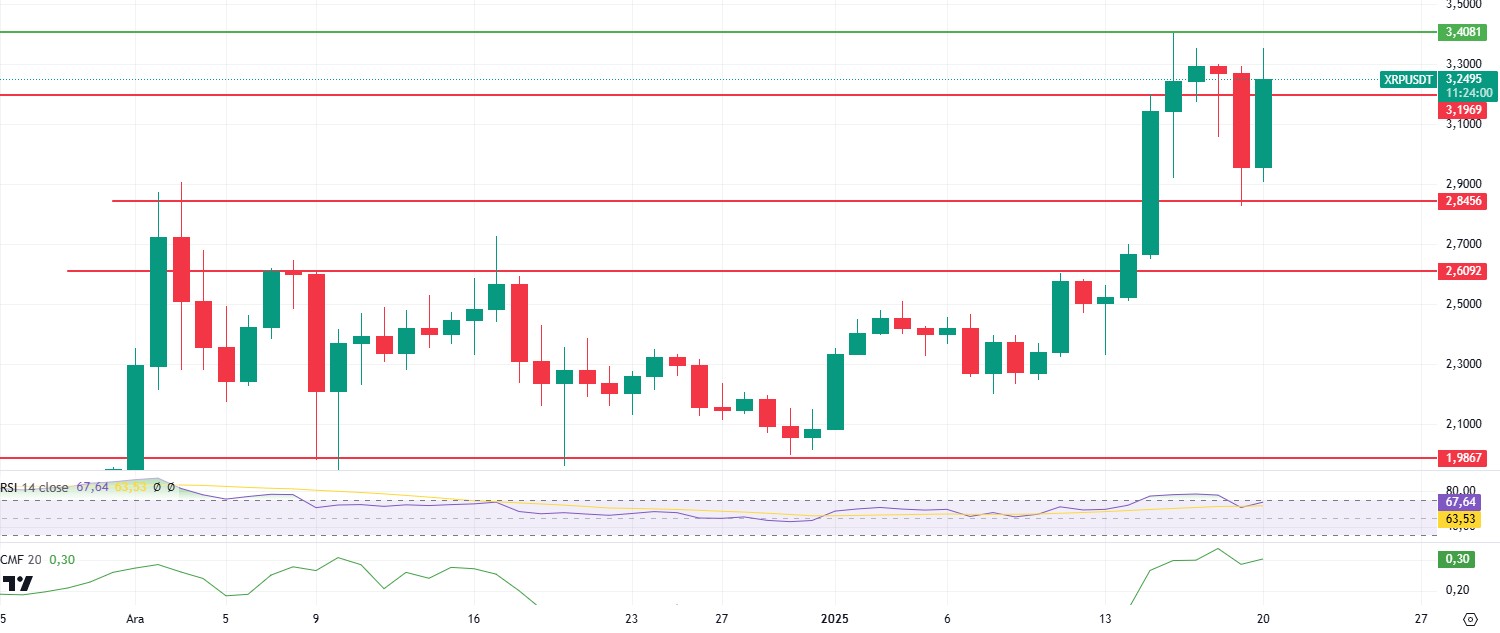
Technically, the XRP price maintained its positive outlook, rising above 3.19 again after a pullback to 2.84. This move is considered an important price reversal that shows that buyers are taking control. One of the most important factors supporting the rise is the increase in the momentum indicator, as well as the Chaikin Money Flow (CMF) indicator reaching 0.31, indicating that buyer pressure is strong in the market.
In line with this technical data, a break above 3.40 could pave the way for XRP to test higher resistance levels. However, a move below 2.84 could lead to a breakdown of the current trend and the start of a bearish move.
Supports 3.1969 – 2.8456 – 2.6092
Resistances 3.4081 – 3.7151- 4.0050
SOL/USDT
Last Saturday morning, Donald Trump surprised the crypto industry by launching his own meme coin on the Solana blockchain. Within hours, the cryptocurrency surged massively. It is now among the top 18 digital assets by market capitalization. The appearance of Trump’s official coin on the Solana network caused Solana to attract attention. SOL surpassed the $264 level, reaching an all-time high. However, after reaching this peak, its price experienced a pullback and is currently at $257.21. According to Moonshot, the token’s success propelled Moonshot into the top 10 apps in Apple’s US App Store and generated $400 million in volume in the first 12 hours. Leah Wald, CEO of Sol Strategies, expressed doubt that spot Solana exchange-traded funds (ETFs) will be approved in the United States in 2025. Despite the growing interest in the SOL ecosystem, Wald believes that regulatory hurdles and a change in leadership at the Securities and Exchange Commission (SEC) will delay the immediate approval of spot SOL ETFs. Mango Markets, a decentralized exchange based in Solana, is ceasing operations following regulatory issues and the SEC settlement. Solana introduced Roam, a decentralized WiFi network designed to transform global connectivity. Additionally, JPMorgan estimated that Solana ETP approvals could attract around $3-6 billion in new assets. Burwick Law is suing Pump.fun on behalf of investors who lost money in failed meme coins and other questionable projects. Mert Mumtaz of Helios Labs suggested that Solana could become deflationary following a vote proposal scheduled for next week. Sol Strategies staking rewards launched its first-ever non-custodial mobile staking app through Orangefin Ventures, which capitalizes on investment opportunities in Solana-based projects. Phantom announced that it has received $150 million in Series C funding and aims to become the world’s largest consumer finance platform. On the other hand, Solana Tokenomics Revision Proposed by Multicoin Capital Multicoin Capital proposed a variable rate token emission model for Solana, which aims to reduce inflation and stabilize the network. Oncahinde, data from the DeFiLlama platform shows that on January 19th, Solana’s DeFi Total Locked Value (TVL) reached an all-time high of $12.19 billion, according to Foresight News. It shows that SOL stake deposits increased significantly amid the market downturn. Solana deposited 1.4 million SOL to mitigate losses with passive income amid market volatility. On the other hand, FTX/Alameda completed its monthly distribution, transferring $32.35 million worth of SOL out of the stake and distributing it to 20 addresses. Solscan data shows that the account still has 6.47 million SOLs locked up, worth more than $1 billion. Pump.fun celebrated its first birthday by surpassing $400 Million in annual revenue. The latest data showed that Solana has acquired more than 10 million unique active addresses in the last 8 weeks and more than 22 million active addresses in the last days.
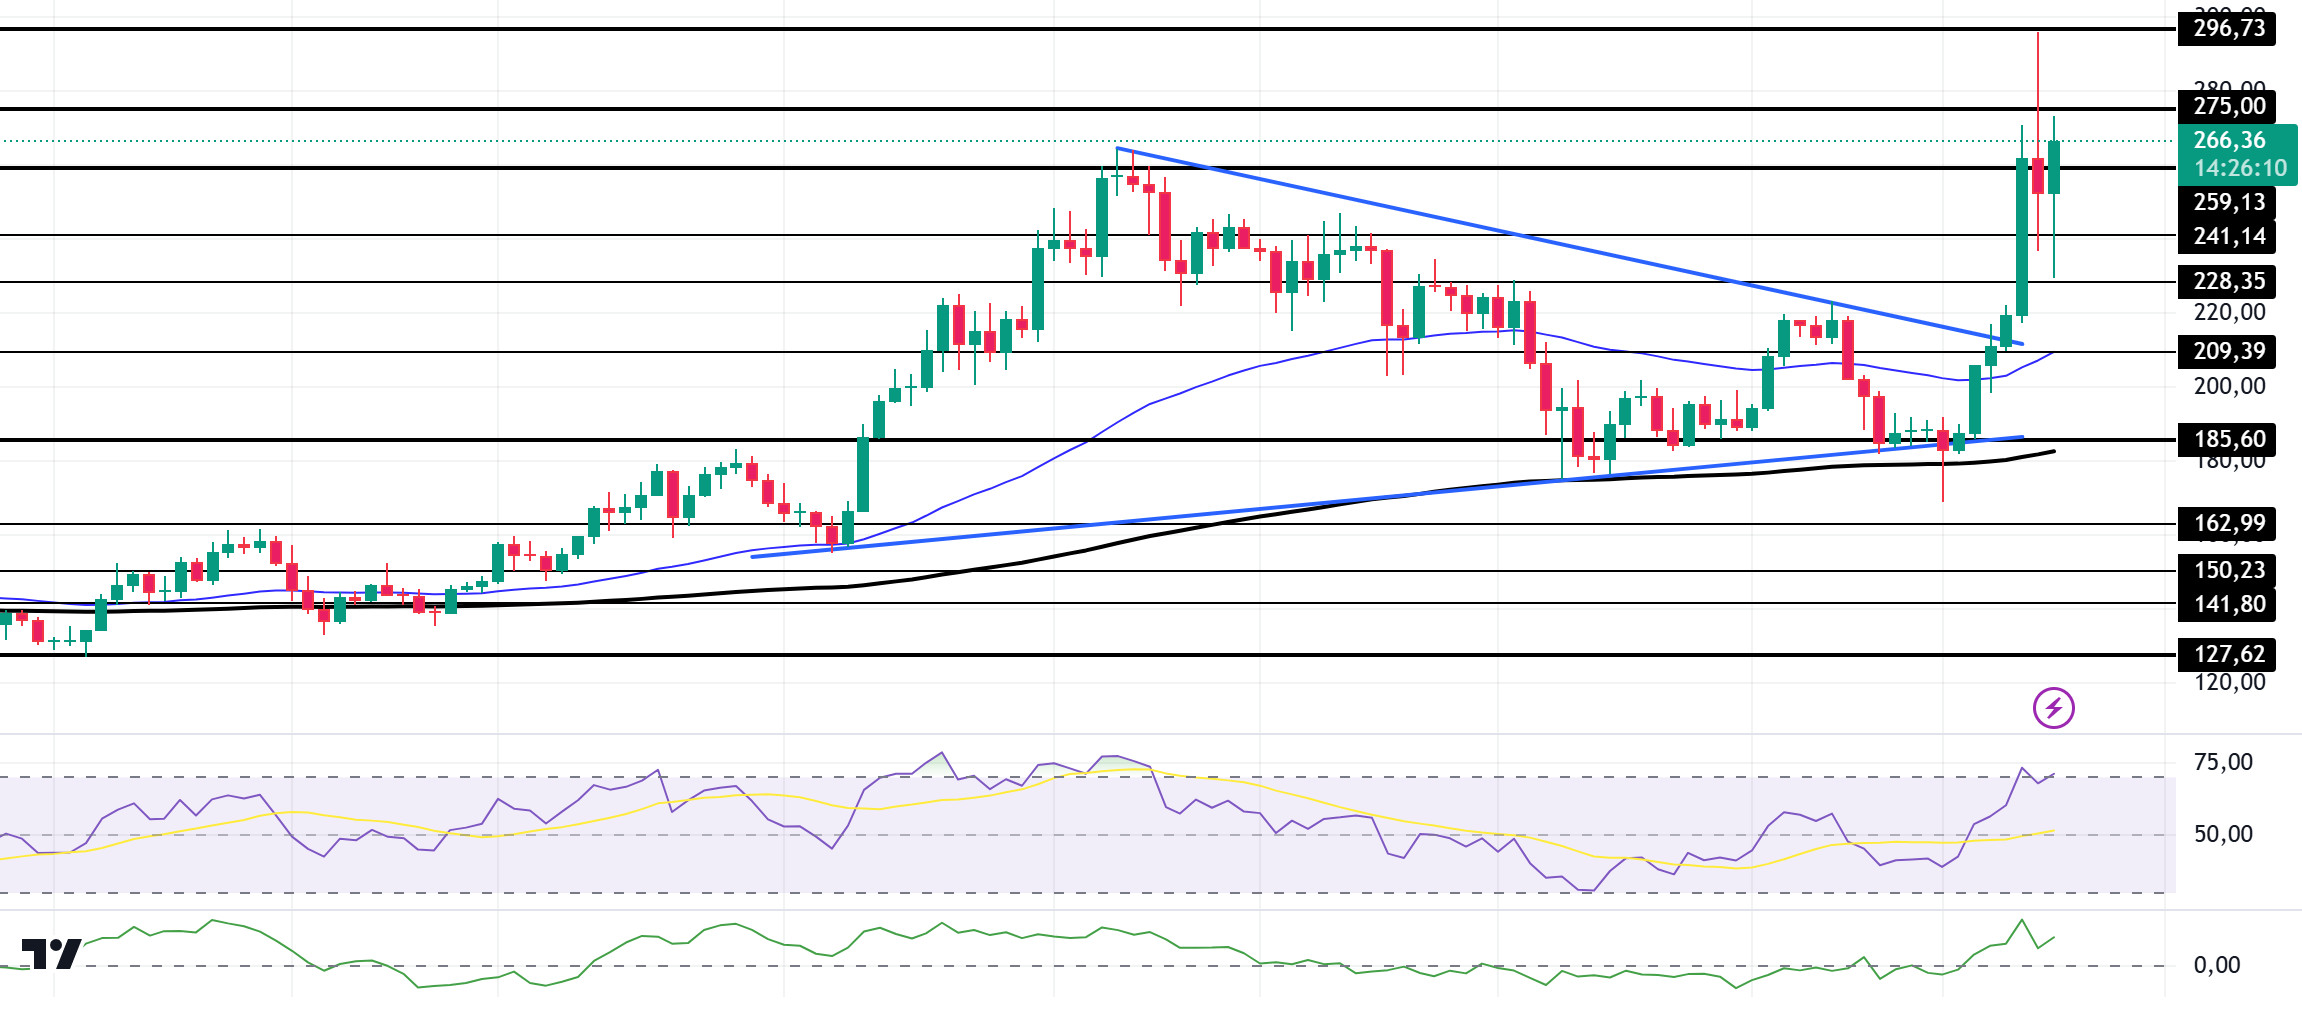
SOL, which grew by about 40.91% this week, broke the ceiling zone of the symmetrical triangle pattern and displayed a gigantic rise. This broke the downtrend that has been in place since November 22. The asset is above the 50 EMA (Blue Line) and the 200 EMA. This could mean that the uptrend will continue in the short term. If the price gains strong momentum from here, it may retest the strong resistance at 296.73. On our daily chart, the 50 EMA (Blue Line) continues to be above the 200 EMA (Black Line). This shows that the trend is bullish in the medium term. Relative Strength Index (RSI) 14 has moved in positive territory and is in overbought territory on the recent rise. However, the Chaikin Money Flow (CMF)20 indicator is in positive territory and money inflows have increased. If the positive results in macroeconomic data and positive developments in the ecosystem continue, it may test the first major resistance level of 275.00. In case of negative macroeconomic data or negative news in the Solana ecosystem, the 185.60 level can be followed and a buying point can be determined
Supports 241.14 – 228.35 – 209.39
Resistances 259.13 – 275.00 – 296.73
DOGE/USDT
Dogecoin price rallied this week amid ongoing whale accumulation. After months of consolidation, the meme coin appears poised for a significant breakout, supported by historical price trends and strengthening momentum indicators. Last week, Elon Musk said on the X platform that Bitcoin and Dogecoin prices could see a significant decline in the next two years, which he attributed to the unwinding of dollar inflation . On the other hand, the whale wars have begun. As Dogecoin whales became active, about 890 million tokens moved. Increased accumulations and whale activity underscore the growing interest in the meme-themed asset, sparking market optimism.
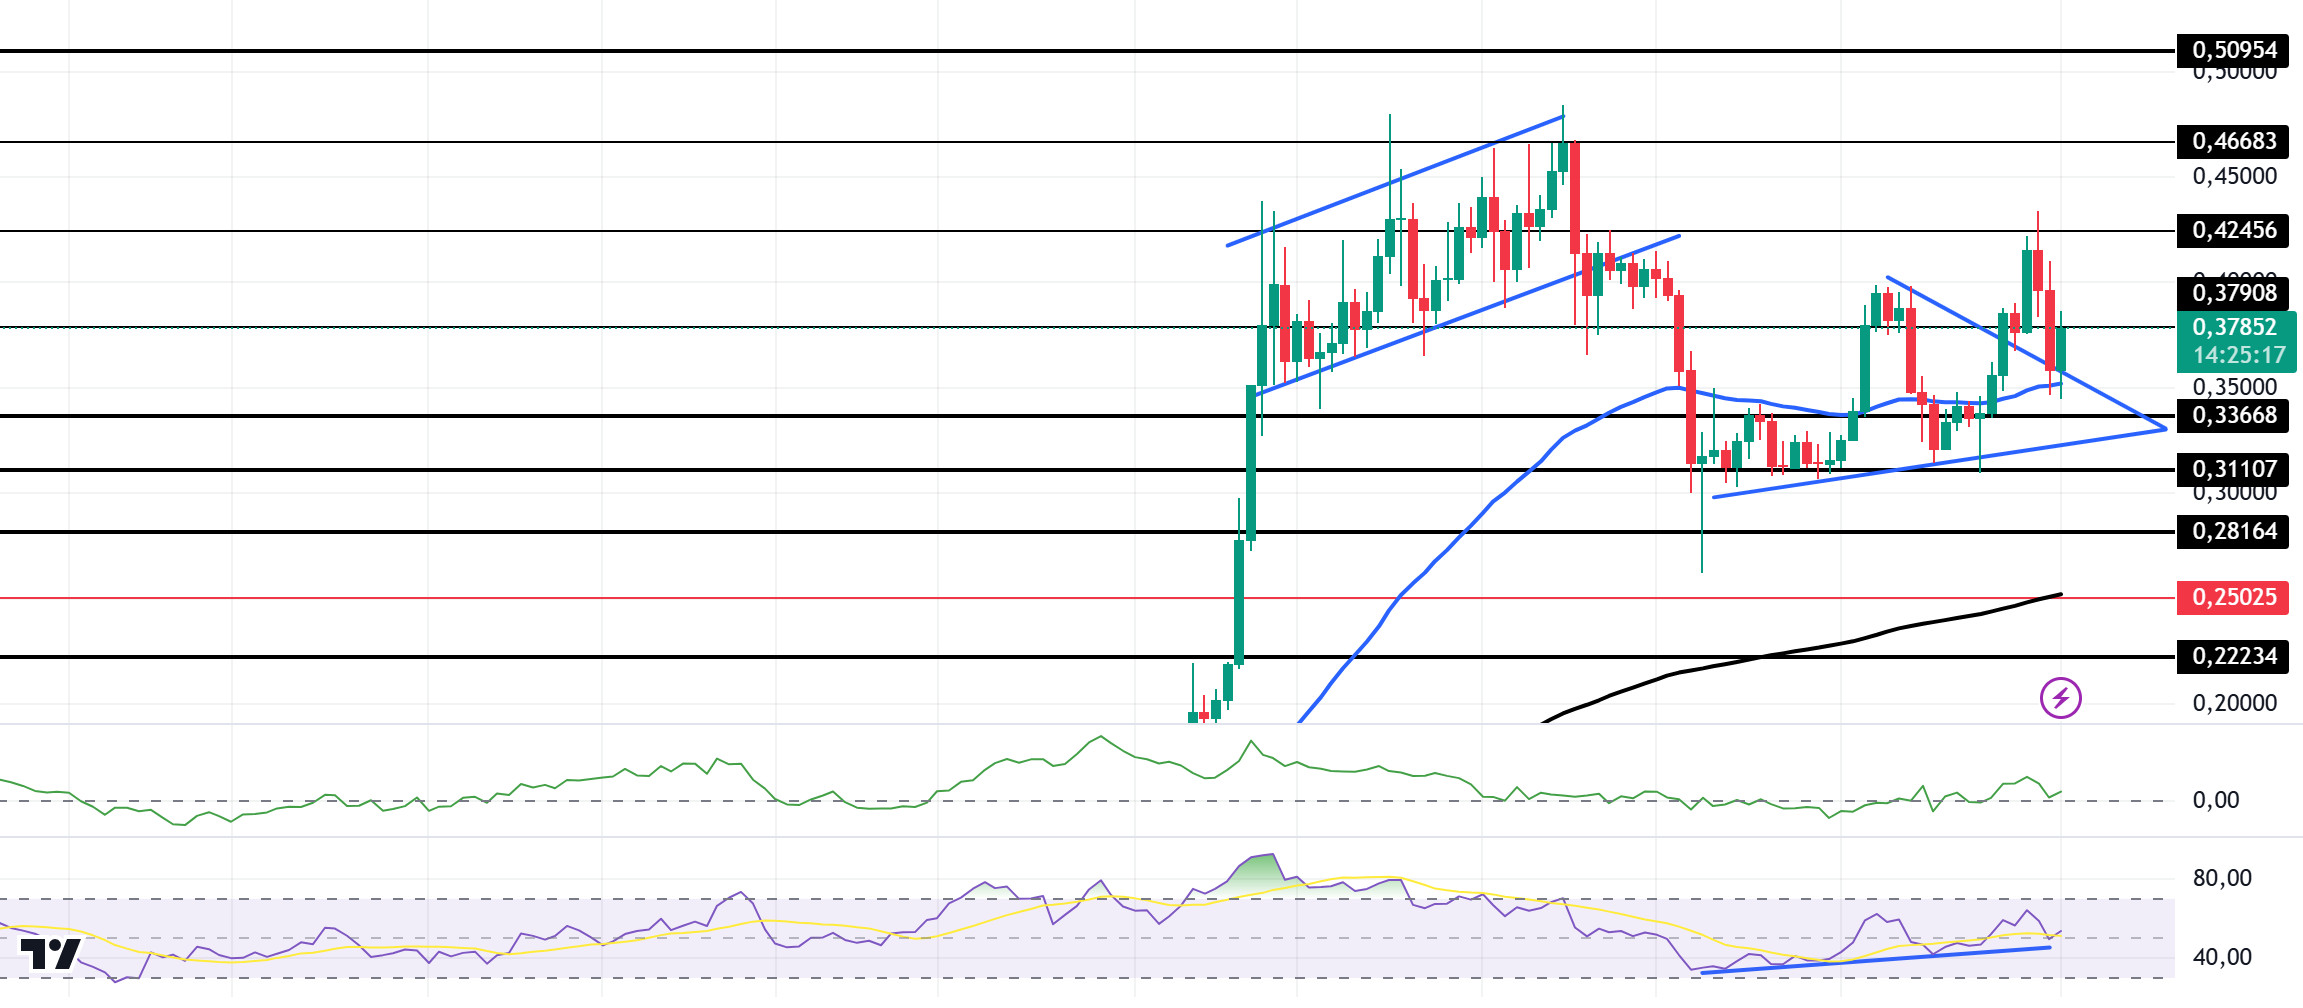
When we look at the daily chart, the asset, which has been stuck in a symmetrical triangle pattern since December 8, started to rise by breaking the ceiling of the symmetrical triangle pattern upwards last week. The asset, which is currently experiencing a retracement, has run the ceiling of the symmetrical triangle pattern as support. Although the 50 EMA (Blue Line) continues to remain above the 200 EMA (Black Line), indicating that the bull continues for the asset, the difference between the two averages is 39.12%, which may increase the possibility of a fall. If this bullish momentum continues, the asset may rise as high as 0.46683. When we look at the Chaikin Money Flow (CMF)20 indicator, it moved from the neutral zone to the positive zone. Relative Strength Index (RSI)14 also found value in the positive zone. At the same time, the uptrend continues on the RSI chart. In case of possible macroeconomic conditions and negative developments in the ecosystem and retracements, 0.33668 can be followed as a strong support. In case of continued rises, 0.46683 should be followed as a strong resistance.
Supports: 0.33668 – 0.31107 – 0.28164
Resistances: 0.37908 – 0.42456 – 0.46683
TRX/USDT
TRX, which started last week at 0.2335, fell by about 2% during the week and closed the week at 0.2286. This week, data on unemployment benefit claims, manufacturing purchasing managers index and services purchasing managers index will be released in the US. On Monday, Trump will deliver his inauguration speech. Especially Trump’s speech will be closely followed by the market and his statements about the crypto market can be expected to have a positive impact on the market.
TRX, currently trading at 0.2416, is in the upper band of the bearish channel on the daily chart. With a Relative Strength Index value of 47, it can be expected to move towards the bearish channel middle band by falling slightly from its current level. In such a case, it may test the 0.2243 support. If it cannot close daily under the support of 0.2243 , it may increase with the buying reaction and may want to break the upper band of the channel. In such a case, it may test 0.2555 resistance. As long as it stays above 0.1860 support on the daily chart, the bullish demand may continue. If this support is broken, selling pressure may increase.
Supports 0.2243 – 0.2020 – 0.1860
Resistances: 0.2411 – 0.2555 – 0.2665
AVAX/USDT
(EMA50: Blue Line, EMA100: Orange Line, EMA200: Pink Line)
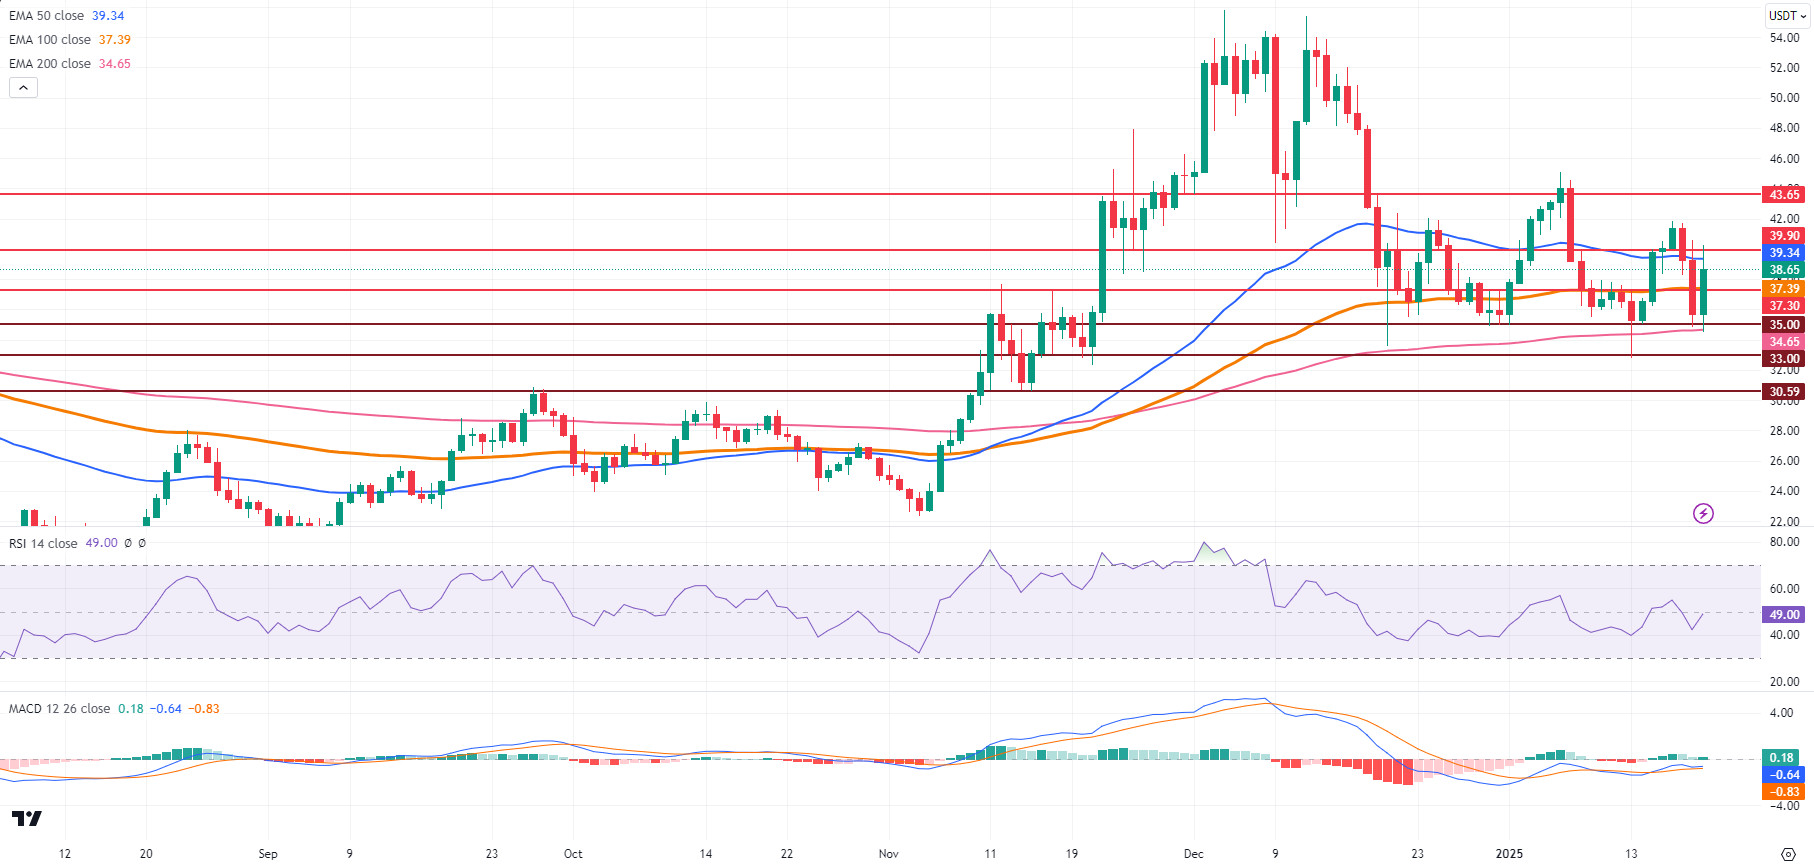
AVAX, which started last week at 36.53, rose to 41.82 due to the general positive developments in the crypto market and the positive atmosphere created by the inauguration of the new US President Donald Trump on January 20, 2025. On Friday, January 17, the “Trump memecoin” message shared by Donald Trump and the trading of this coin on the SOL network enabled the coin to become a trend and reach a high trading volume. This created selling pressure in the crypto market. Affected by this selling pressure, AVAX closed the week at 35.65. On the first day of the new week, Bitcoin’s ATH renewal had a positive impact on the crypto market. This effect was also reflected in AVAX and rose to the level of 40.50. Currently, AVAX is trading at 38.65.
The Moving Average Convergence/Divergence (MACD) indicator (-0.64) on AVAX is bullish towards positive territory, rising above the signal line (-0.83). This supports bullish momentum. Relative Strength Index (RSI) is at 49.00. If the RSI rises above the 60 level, buying may increase. If the RSI rises above 60 and the MACD indicator continues its rise to the positive zone, the upward movement in AVAX may continue. AVAX, which surpassed the 37.30 resistance level and the 100-period Exponential Moving Average (EMA100) level with its rise on the first day of the new week, may continue its uptrend to the EMA50 and 39.90 resistance levels if it closes above these levels. In case of a close above these levels, the main resistance level of 43.65 can be targeted. On the contrary, AVAX may retest the 35.00 support level and the EMA200 level if the MACD indicator moves downwards and cuts the signal line downwards and the RSI data falls below the 40 level. If these support levels are broken, the decline may deepen and fall as low as 30.59.
After January 20, 2025, the new US President Donald Trump’s positive statements about the crypto market may be effective in the rise of AVAX. In particular, AVAX’s upward momentum can be expected to increase if positive regulations on US-based cryptocurrencies are signed.
Supports 35.00 – 33.00 – 30.59
Resistances 37.30 – 39.90 – 43.65
SHIB/USDT
This week, Shiba Inu’s burn rate increased by 951% in the last 24 hours, with more than 30 million SHIB tokens burned. However, developments in the meme token market, such as Trump’s new memecoin, caused investor interest to shift to trend-driven and speculative assets. This has increased selling pressure on Shiba Inu. While maintaining support levels is critical, the decrease in volatility indicates that price movements may remain stable in the short term.
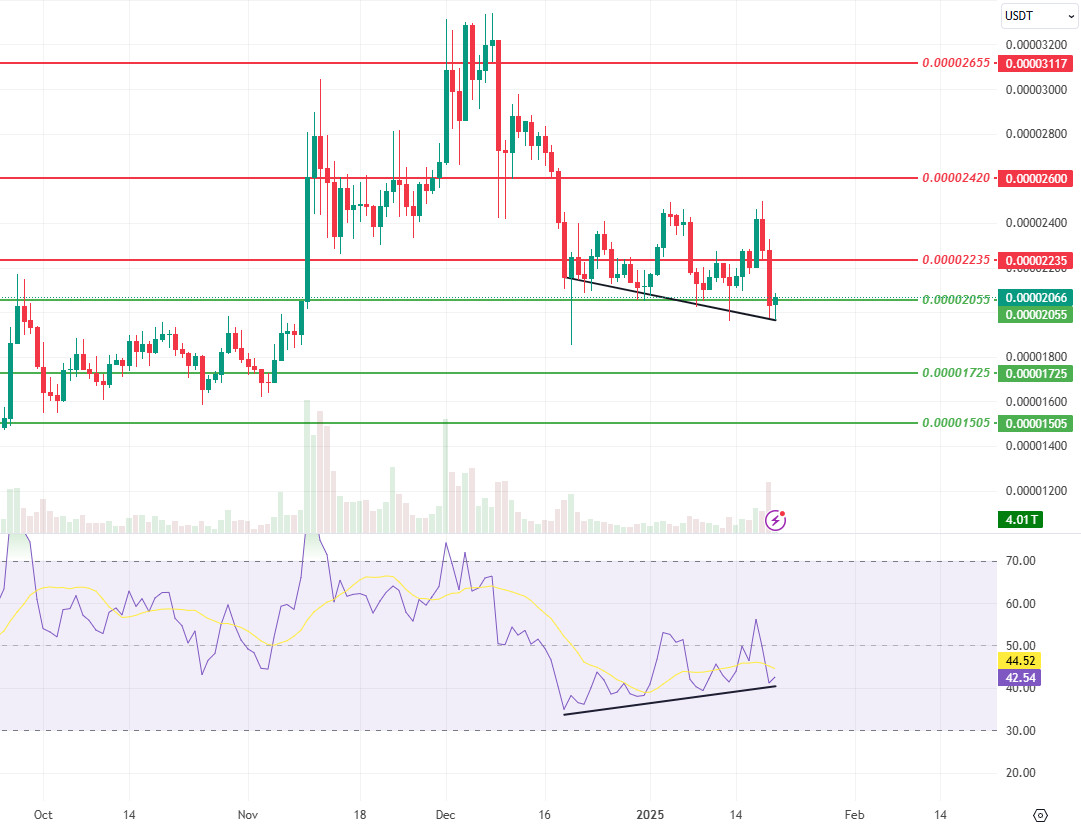
Technically, Shiba Inu (SHIB) is on the rise with the reaction it received from the 0.00002055 support level, but it has retreated without being able to maintain above the 0.00002420 level. This movement is supported by the decline in volume. There is a positive divergence between the Relative Strength Index (RSI) and the price (Black Line), which may increase the possibility of an upside recovery. If the price stays above the 0.00002055 level, a rebound towards the 0.00002235 level may be seen. If the 0.00002235 level is exceeded, the movement towards the 0.00002600 resistance levels may continue. On the other hand, a daily close below the 0.00002055 level may bring a decline towards 0.00001725 levels, even though the decline in volatility indicates that the range of movement in the market is narrowing.
Supports 0.00002055 – 0.00001725 – 0.00001505
Resistances 0.00002235 – 0.00002600 – 0.00003115
LTC/USDT
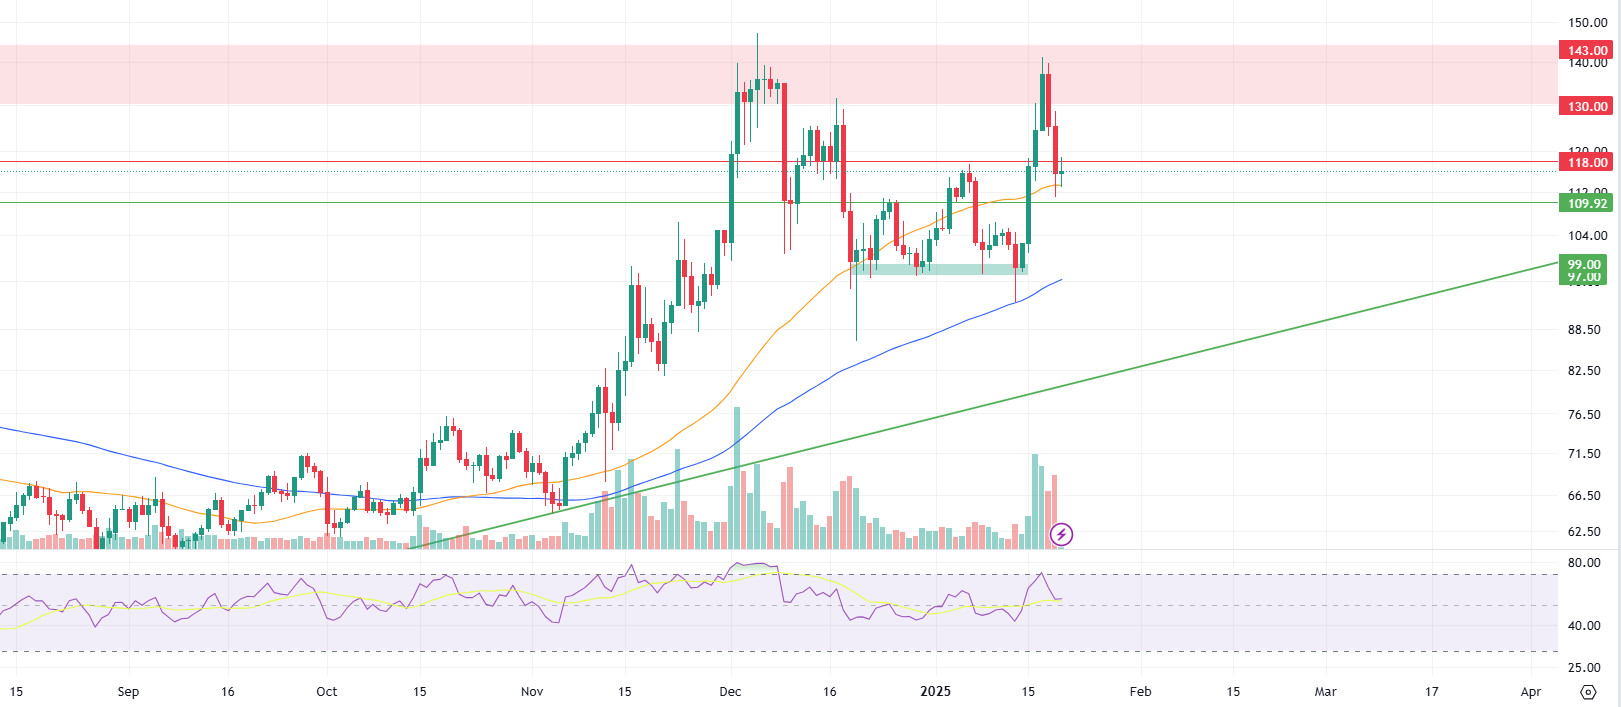
LTC, which gained 12.93% last week, started the new week at 115.57. According to Arkham data, at the beginning of last week, there was a total of $238 million in futures positions on LTC, while this figure increased to $333 million this week. Funding rate ratios are positive across all exchanges, showing a positive outlook for market conditions. LTC also moved up two places in the market capitalization rankings, from 23rd to 21st.
LTC’s daily chart shows that the price is trying to stay above the 50-day moving average (orange line). The first level where selling pressure may occur in its first upward movement stands out as the red horizontal resistance at 118.00. If this resistance is overcome, the price can be expected to move up to the 130.00 – 143.00 band. However, these levels stand out as areas where selling pressure may re-intensify. Below the 50-day moving average, the first support point will be the horizontal support at 109.92. If the decline continues, the 99.00 – 97.00 range, which was previously supported, stands out as an area where buyers may intensify. In addition, the 100-day moving average (blue line), the previous support level, is currently crossing at 96.30. This makes the 96.30 level an important support point that could be the last stop of the decline. If this support is also broken, a retracement to the main trend support (green sloping line), which is currently at 80.31, could occur.
Resistances 118.00 – 130.00 – 143.00
Supports 109.92 -96.30- 80.31
LINK/USDT
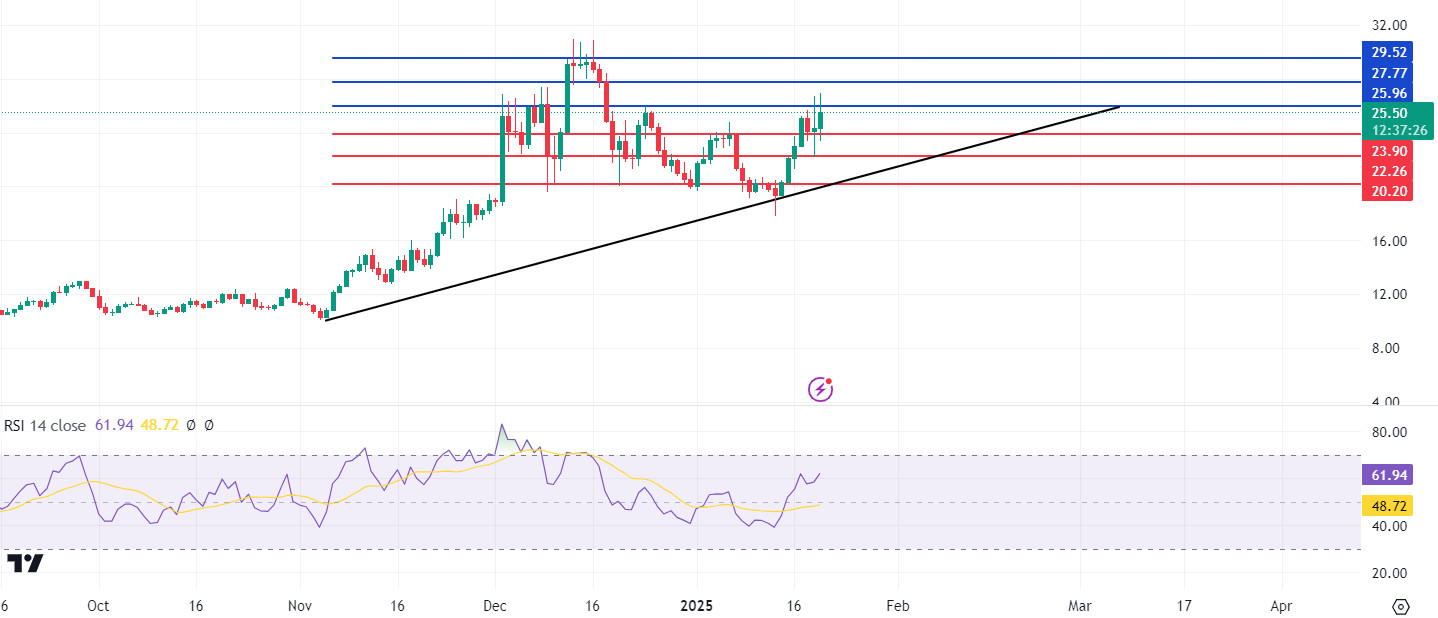
Chainlink (LINK), which was affected by the pullback in the market on Monday last week, exhibited a rapid recovery after this situation. On January 20, US President Trump will take office, another factor that increased volatility in the market. However, Ripple’s collaboration with Chainlink for the RLUSD stablecoin increased excitement and anticipation in the community, limiting the decline. After interrupting the bullish momentum that started on November 5 with a correction between December 16 and January 13, LINK managed to recover about 40% from this process.
Technically, the $25.96 level is a critical resistance point in terms of strengthening momentum. If this resistance is exceeded and the market expectation remains strong, a new upward movement is likely to be triggered with increasing volume. On the other hand, in a negative scenario, the $23.90 level stands out as the first support point. In case this level is broken downwards, the trend support of $ 22.26 (Black line) will play a decisive role. The Relative Strength Index (RSI) has broken strongly out of the negative zone and reached the 62 level and continues its upward movement. However, careful monitoring of the near resistance level and possible breakouts in the technical outlook with the RSI requires a strategic approach in terms of risk management.
Supports 23.90 – 22.26 – 20.20
Resistances 25.96 – 27.77 – 29.52
BNB/USDT
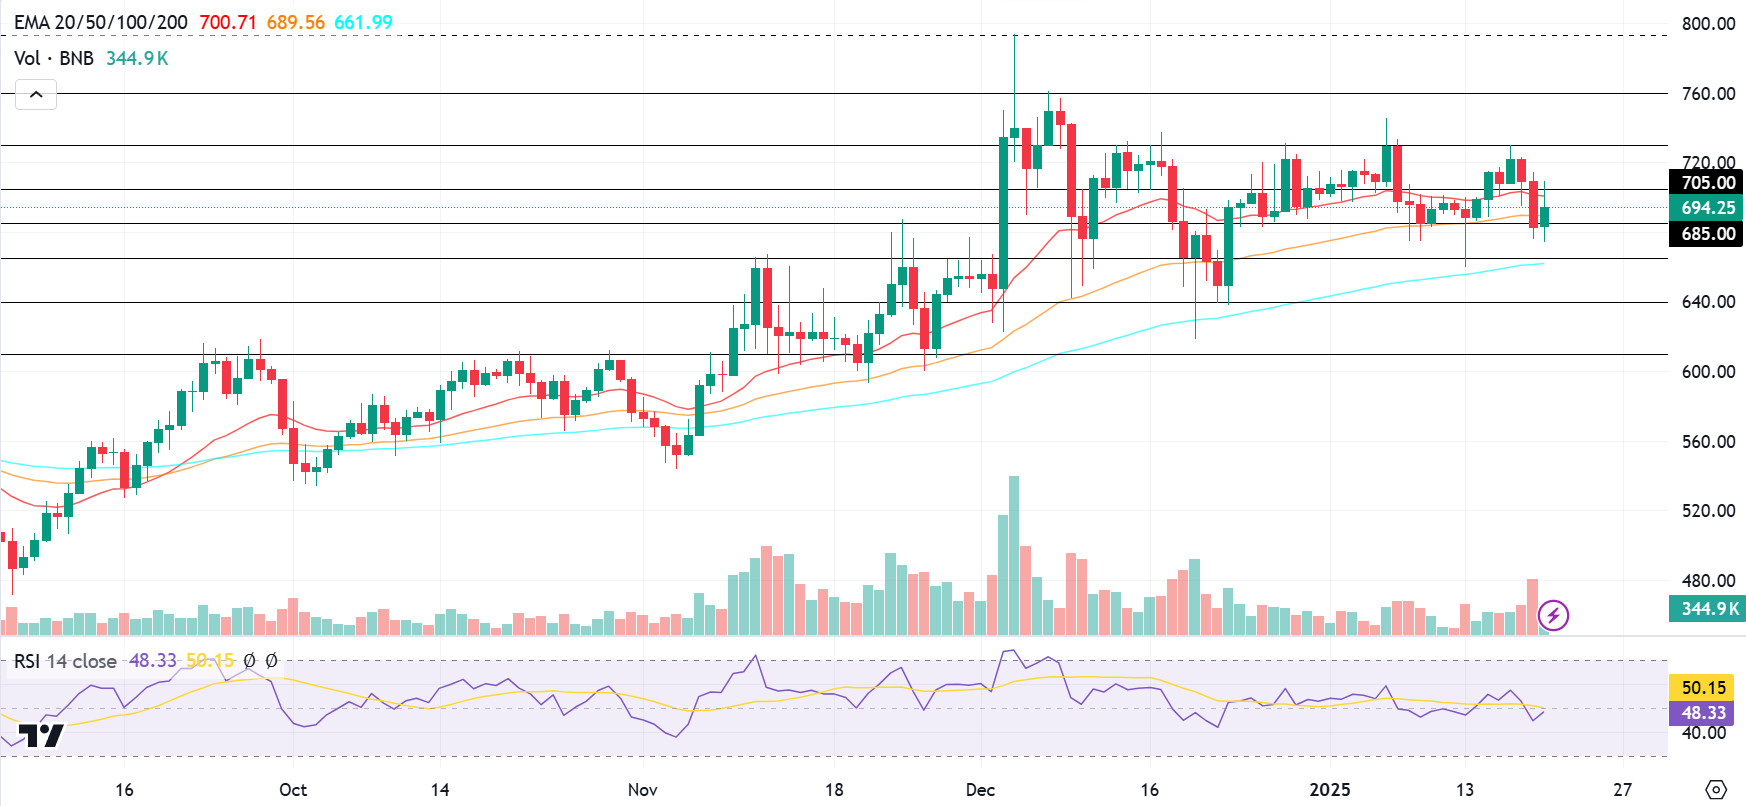
BNB/USDT, which retreated to the EMA 100 (blue line) region with pressure from the EMA 20 (red line) at the beginning of last week, entered a recovery phase with the support it received from these levels. In the following days, the asset gained positive momentum and rose up to the 730 level, but showed a tendency to retreat again due to the resistance it encountered in this region. In this process, BNB/USDT, which fell below the EMA 50 (orange line) and 685 levels, faced selling pressure at these levels with the opening of the new week. However, it recovered during the day and managed to hold above the 685 level again.
The volume indicator reveals that selling pressure has increased in recent days with negative candles. In this context, it is assessed that strong trading volume on the buying side should increase in order for the price to regain a positive momentum. On the other hand, the RSI indicator fell below the 50 level with the pressure on the price and continued to move in this region. The RSI hovering below these levels may indicate that short-term selling pressure may continue.
In this context, if the positive momentum experienced at the beginning of the new week continues, the price is expected to rise towards the 705 level first. If the 705 level is broken upwards, there is a possibility of a positive momentum up to 730 and 760 levels, respectively. However, a resistance that may be encountered at the 705 level may cause the price to retreat back towards the 685 level. If the 685 level is broken downwards, the 665 and 640 levels will be followed as new support zones.
Supports 685- 665- 640
Resistances 705- 730- 760
ADA/USDT
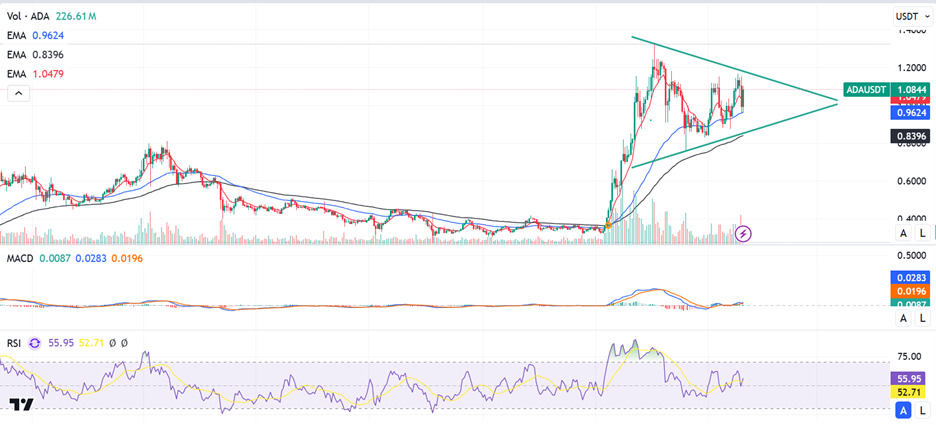
Yesterday evening, volatility was seen in the crypto market with Trump’s inauguration as President of the United States. ADA, which has been at 0.8990 levels since last week, increased with the effect of the positive atmosphere created by the crypto market before Donald Trump’s inauguration and completed the week at 1.0479.
Technically, it continues to complete the Bullish Pennant pattern since last week and maintains its upside potential
The Moving Average Convergence/Divergence (MACD) indicator is in positive territory above zero and bullish momentum may continue if it crosses the signal line to the upside. The Relative Strength Index (RSI 14) continues its positive trend at 54.15. If the RSI stays above 55, the uptrend may continue and approach the overbought zone. In this case, ADA’s rise may test the 1.2412 resistance level. In case these resistance levels are broken to the upside, the uptrend may continue up to 1.3454 resistance levels. In a possible volatility scenario, if ADA’s price falls, it may retest the 0.8396 support level and the 200-period Exponential Moving Average (EMA200) level. In case these support levels are broken, the decline may deepen and fall as low as the 0.7849 support level.
(EMA50: Red Line, EMA100: Blue Line, EMA200: Black Line)
Supports: 0.9624 – 0.8990 – 0.7849
Resistances: 1.2412 – 1.3454 – 1.3580
LEGAL NOTICE
The investment information, comments and recommendations contained in this document do not constitute investment advisory services. Investment advisory services are provided by authorized institutions on a personal basis, taking into account the risk and return preferences of individuals. The comments and recommendations contained in this document are of a general type. These recommendations may not be suitable for your financial situation and risk and return preferences. Therefore, making an investment decision based solely on the information contained in this document may not result in results that are in line with your expectations.


