BTC/USDT
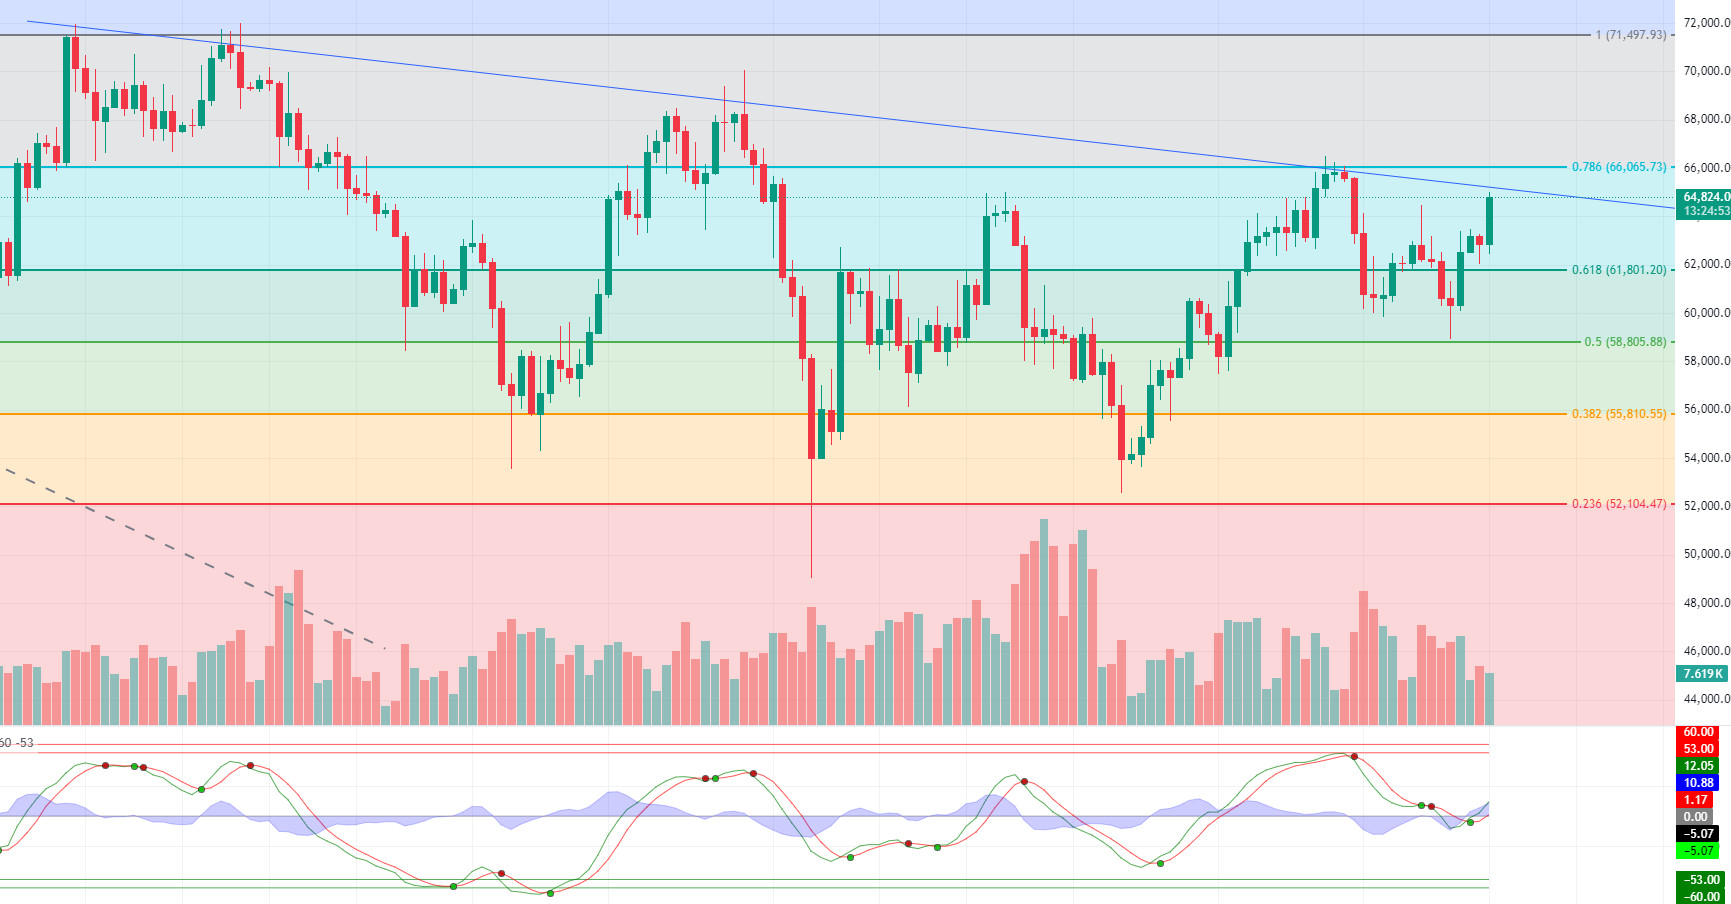
Bitcoin started to show the uptober effect again. Bitcoin, which was negatively affected by the geopolitical tensions between Iran and Israel, recovered after a retreat to 59,000 levels and started to reach above 64,000 levels. The rapid recovery in Bitcoin, which received the support of institutions with the introduction of ETFs against negative news, indicates that its strong stance has increased. As a matter of fact, Bitcoin ranks first in total assets in 2024 with a 49% return and continues to be supported and adopted by investors. When we look at Bitcoin returns in the quarterly timeframe, the fact that it has not yet risen may be an important indicator for the continuation of the upward trend.
When we look at the BTC daily technical analysis, the crossing of the fibonacci 0.618 (61,800) level continued the upward movement and reached 64,850, hitting the October peak. With the break of the falling major trend line, we can say that BTC’s expectation of movement towards the 0.786 (66,065) level may support upward pricing with the effect of positive weather. The fact that our technical indicator, the wave trend oscillator, generates a buy signal in the positive zone as it crosses above the 0 level on a daily basis may be a positive sign for the continuation of the trend structure. With geopolitical tensions, the news flow on the Israeli front, which previously said that it would respond to the Iranian attack, may reverse the positive mood. In this case, the level we will follow as a support level will be 0.618 (61,800).
Supports 61,800 – 58,800 – 55,810
Resistances 66,065 – 71,497 – 73,800
ETH/USDT
Increasing smart contract transactions and in-network mobility on Ethereum also shows its effect in terms of price. When Dune data is analyzed, it seems that there is an increase in TVLs in all L2 networks, especially Arbitrum, and the increase in locked ETHs in protocols such as Eigenlayer and Symbiosis continues.
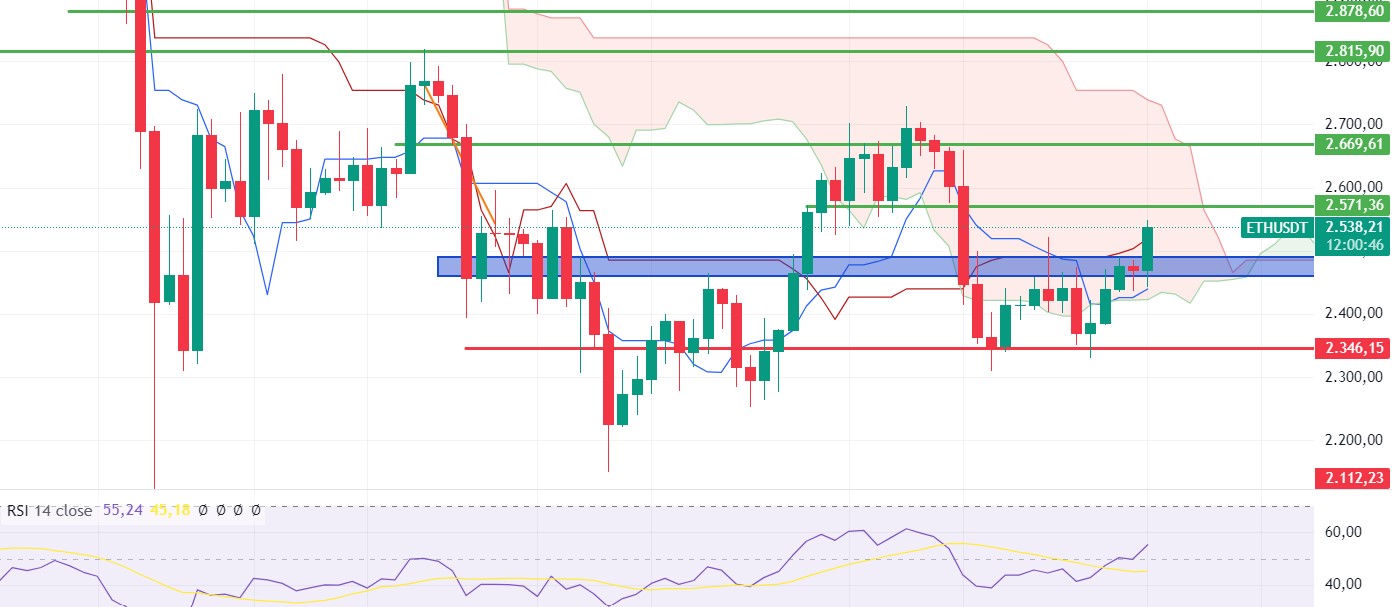
Technically, when we examine the chart, ETH, which has risen above kijun and tenkan levels in the daily time interval, continues to rise in the kumo cloud. RSI has a clear positive outlook while CMF continues to move sideways. Unless the 2,490 level is lost, it can be said that a positive trend has started. As formation targets, rises up to the first level 2,669 region can be targeted. Below the 2,490 level, a retracement to 2,400 levels can be expected.
In summary, while the positive outlook prevails for the short and medium term, the 2,490 level should be considered as the main support level.
Supports 2,490 – 2,400 – 2,346
Resistances 2,571 – 2,669 – 2,815
LINK/USDT
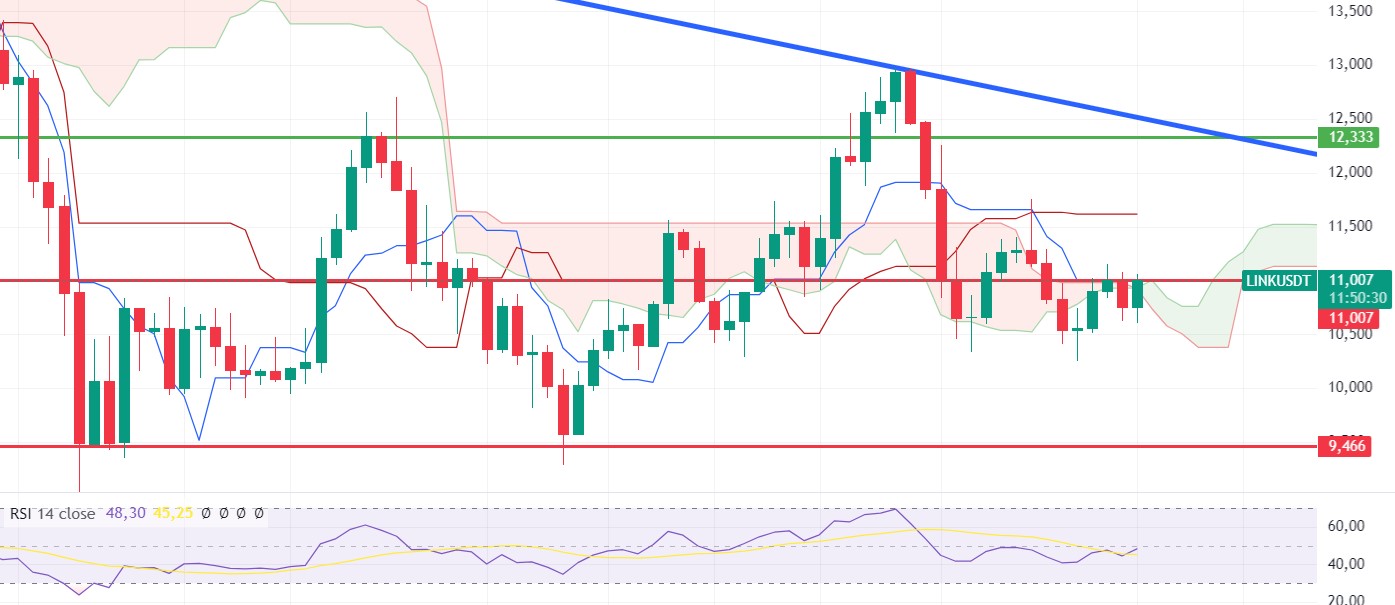
LINK, which has priced somewhat positively with the movement on Ethereum, is stuck at the $ 11 level, which is the tenkan and kumo cloud upper resistance level, as seen in the chart. With the strengthening of RSI, CMF and momentum, if this level is exceeded, rises can be expected first to the kijun level 11.61 and then to the falling trend line. However, with the rejection of the level, a new downward wave may start until 10.37. For now, it can be said that the most important range to follow is between these specified levels. It will be healthier for investors to take transactions according to the break or reactions.
Supports 10.98 – 10.52 – 9.46
Resistances 11.00 – 11.61 – 12.33
SOL/USDT
While tensions in the Middle East have eased slightly in the past week, the US elections are approaching. According to data from Polymarket, Trump is ahead with 54.2%. It is rumored that President-elect Trump is considering Robinhood’s Legal Affairs Manager for the Ministry of Security if he is elected. On the other hand, the US Supreme Court refused to review a case regarding the ownership of 69,370 Bitcoins seized from Silk Road. This corresponds to approximately 4.3 billion dollars. In other words, there seems to be no obstacle for the US to sell these Bitcoins. This may cause selling pressure on Bitcoin in the coming weeks. In the US economic data, inflation came in above expectations. While the expectation was 2.3%, it came in at 2.4%, raising the question of whether the FED cut 50 basis points early. This made it quite likely that the Fed will not consider a 50 basis point rate cut at the next meeting. According to the data from CME, the probability of a 25 basis point rate cut is 89.5%. At the same time, the increase in unemployment seems to push the possibility of no rate cut off the agenda. The 231 thousand expected forecast came in at 258 thousand.
In the Solana ecosystem, last week’s volume exceeded $14 billion. However, Solana is in the spotlight for different reasons, including Sygnum Bank’s claim that its scalable blockchain could challenge Ethereum’s dominance. In a recent statement, the Swiss bank claimed that there are indications that even low-budget institutions may prefer Solana’s scalability to Ethereum’s security advantage. Decentralized exchanges are experiencing an unprecedented dynamism led by Solana. The Solana network hosts 87% of new tokens on different networks. This shows the importance and trust in the Solana ecosystem. In a new report by Messari Research, Solana projects generated a staggering $173 million in pre-sale rounds in the third quarter of 2024. This marks an achievement that represents the highest quarterly funding total for Solana since Q2 2022. According to data from Artemis, Solana’s monthly active addresses surpassed 100 million, reaching an all-time high for the network. However, supporting metrics show that the majority of active wallets on Solana do not hold any SOL. According to Solana data provider Hello Moon, more than 86 million users did not hold any SOLs in their wallets last month. About 15.5 million users held less than 1 SOL and about 1.5 million held less than 10 SOL tokens. Next week, retail sales data from the US is among the data to be followed.
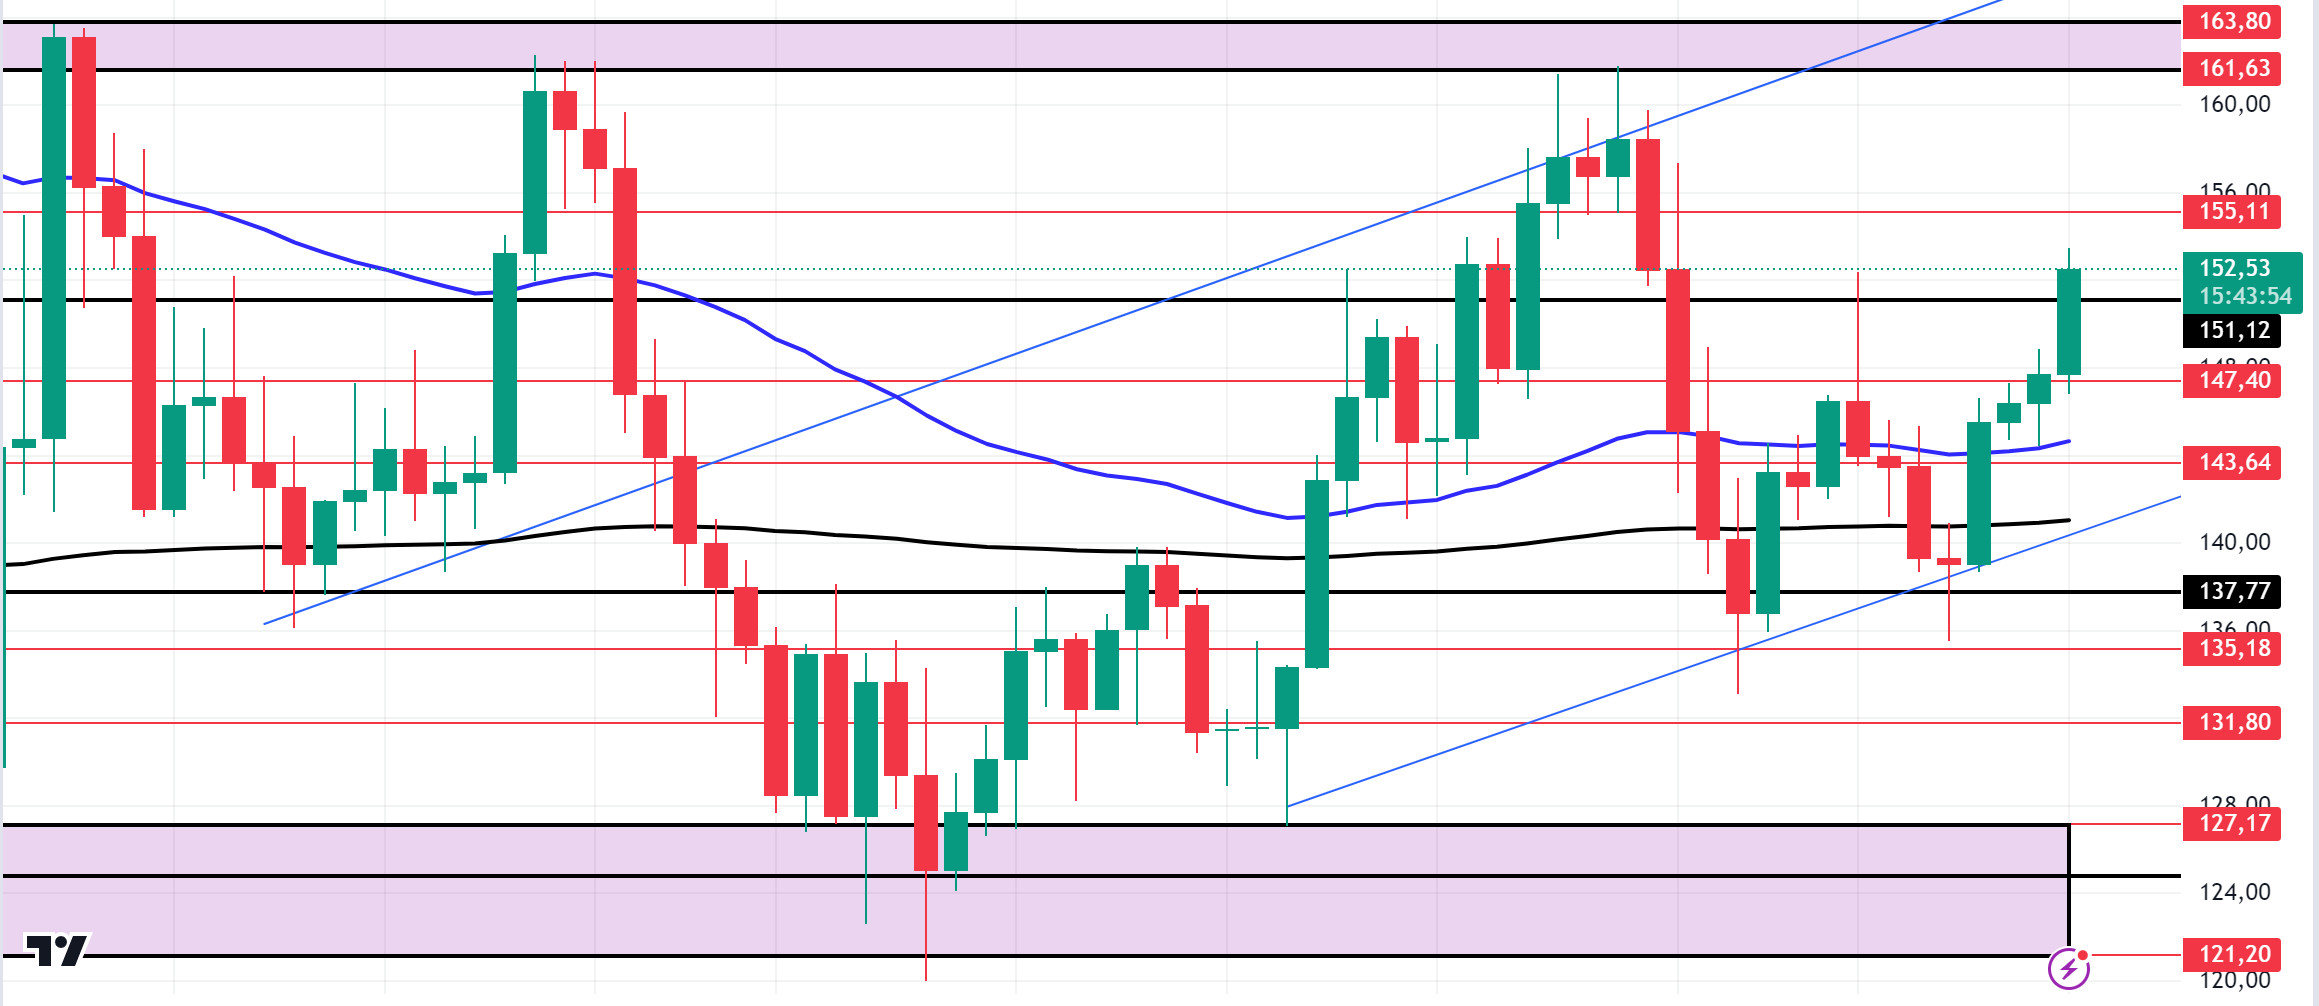
When we look at the SOL chart, it has been consolidating between 121.20 – 163.80 since August 2. The floor and ceiling levels in the consolidated area may be important places to take a position. On our daily chart, the 50 EMA seems to have found support from the 200 EMA. This may appear as a possible bullish harbinger. The 151.12 level, which is a strong resistance place, will be broken if there is a voluminous candle closure and may continue to rise. If the positive results in macroeconomic data and positive developments in the ecosystem continue, the first resistance levels are 161.63 – 163.80. Profit sales due to the rise of BTC will also affect SOL. However, if the political and macroeconomic data coming this week are negative for cryptocurrencies, the 137.77 level can be followed and a buying point can be determined.
Supports 147.40 – 143.64 – 137.77
Resistances 155.11 – 161.63 – 163.80
ADA/USDT
While tensions in the Middle East have eased slightly in the past week, the US elections are approaching. According to data from Polymarket, Trump is ahead with 54.2%. It is rumored that President-elect Trump is considering Robinhood’s Legal Affairs Manager for the Ministry of Security if he is elected. On the other hand, the US Supreme Court refused to review a case regarding the ownership of 69,370 Bitcoins seized from Silk Road. This corresponds to approximately 4.3 billion dollars. In other words, there seems to be no obstacle for the US to sell these Bitcoins. This may cause selling pressure on Bitcoin in the coming weeks. In the US economic data, inflation came in above expectations. While the expectation was 2.3%, it came in at 2.4%, raising the question of whether the FED cut 50 basis points early. This made it quite likely that the Fed will not consider a 50 basis point rate cut at the next meeting. According to the data from CME, the probability of a 25 basis point rate cut is seen as 89.5%. At the same time, the increase in unemployment seems to push the possibility of no rate cut off the agenda. The 231 thousand expected forecast came in at 258 thousand.
In the Cardano ecosystem, CEO Charles Hoskinson has continued to claim that Cardano is the “#1” blockchain despite its recent underperformance. Hoskinson made these bold claims in several recent X posts, confirming that the popular proof-of-stake blockchain is still “#1” and attributing this to a significant advantage in decentralized governance compared to other blockchains. He noted, however, that the negative perception is not due to failure, but to the implications of the new Voltaire era. On October 10, the founder made a statement on the X platform, discussing why negative sentiment about the network he founded has increased. Hoskinson stated that he thought he knew the reason for the increase in this negative perception and clarified this situation in a long article published on the X platform. According to him, this situation is linked to the beginning of the Voltaire era, emphasizing that the issues include “accumulated complaints, unprocessed roadmap elements, unfunded growth strategies and necessary partnerships.”
Another important development is that Cardano hosts the first legally enforceable smart contract. This means that the contract was signed in Argentine courts. The contract is a loan agreement between Cardano ambassadors Mauro Andreoli and Lucas Macchia for 10,000 Cardano ADA 0.3391 tokens – worth $3,380, payable in 4 months at a 10% interest rate. This could set a precedent for future sales of movable and immovable property on credit. As for the ADA coin, according to the Global In/Out of Money (GIOM), approximately 373,000 addresses controlling 5.21 billion ADA are currently at a loss. These addresses cost their holdings at an average price of 0.3700. In this context, it appears that many investors are not willing to sell before their investments rise above this level, creating a strong supply zone that could prevent rallies above 0.3900.
If we look at the liquidations in the Cardano ecosystem, it shows that a short position of $ 689 thousand was liquidated last week against a long position of $ 2.342 million. According to data from Intotheblock, the price, which exceeded the 0.4000 level with high whale movements at the end of last month, may mean that the cooling period has entered with the decrease in these movements. The number of large transactions has been steadily declining. The number of transactions dropped to 2,300 on October 6 and recovered slightly to 3,000 on October 7. The increase in whale activity indicates growing confidence. ADA coin holdings have decreased by around 50% in the last week, indicating that many investors have sold the token. This had a negative impact on ADA, causing it to fall.
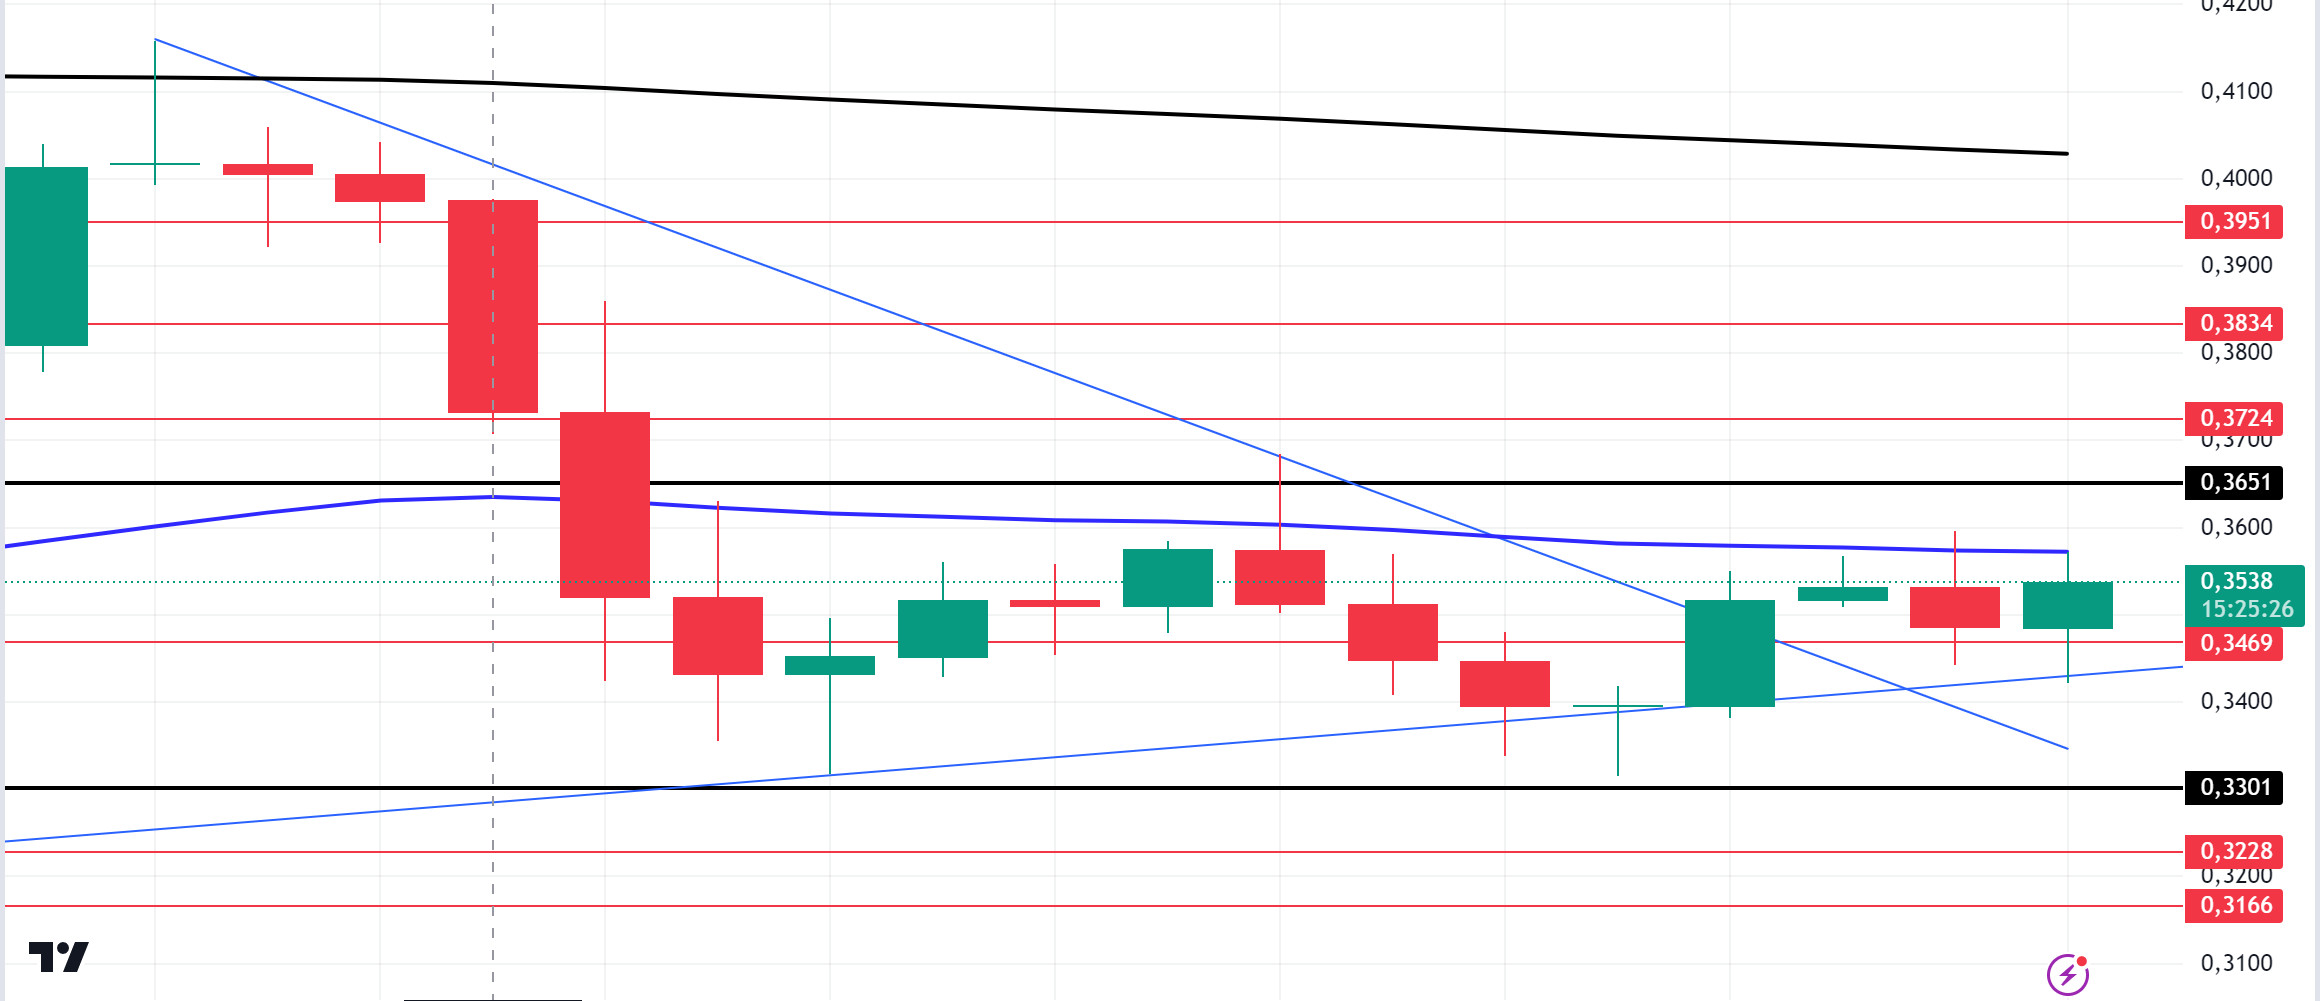
Looking at the chart, ADA has lost about 3.14% since last week. Since August 24, ADA, which has been accumulating since August 24, may break out of this cycle if the overall market moves positively. Looking at the daily chart, the 50 EMA remains below the 200 EMA. This shows that it is still in a downtrend. At the same time, the fact that it starts to rise from the trend line, which has been support since September 6, and breaks out of the symmetrical triangle may be a bullish harbinger. If the uptrend starts, we can identify the 0.3651 level as a strong resistance. In case of possible macroeconomic conditions and negative developments in the Cardano ecosystem, as well as the continuation of the downtrend, it may be priced up to 0.3301 – 0.3228 levels.
Supports 0.3469 – 0.3301 – 0.3228
Resistances 0.3651 – 0.3724 – 0.3834
AVAX/USDT
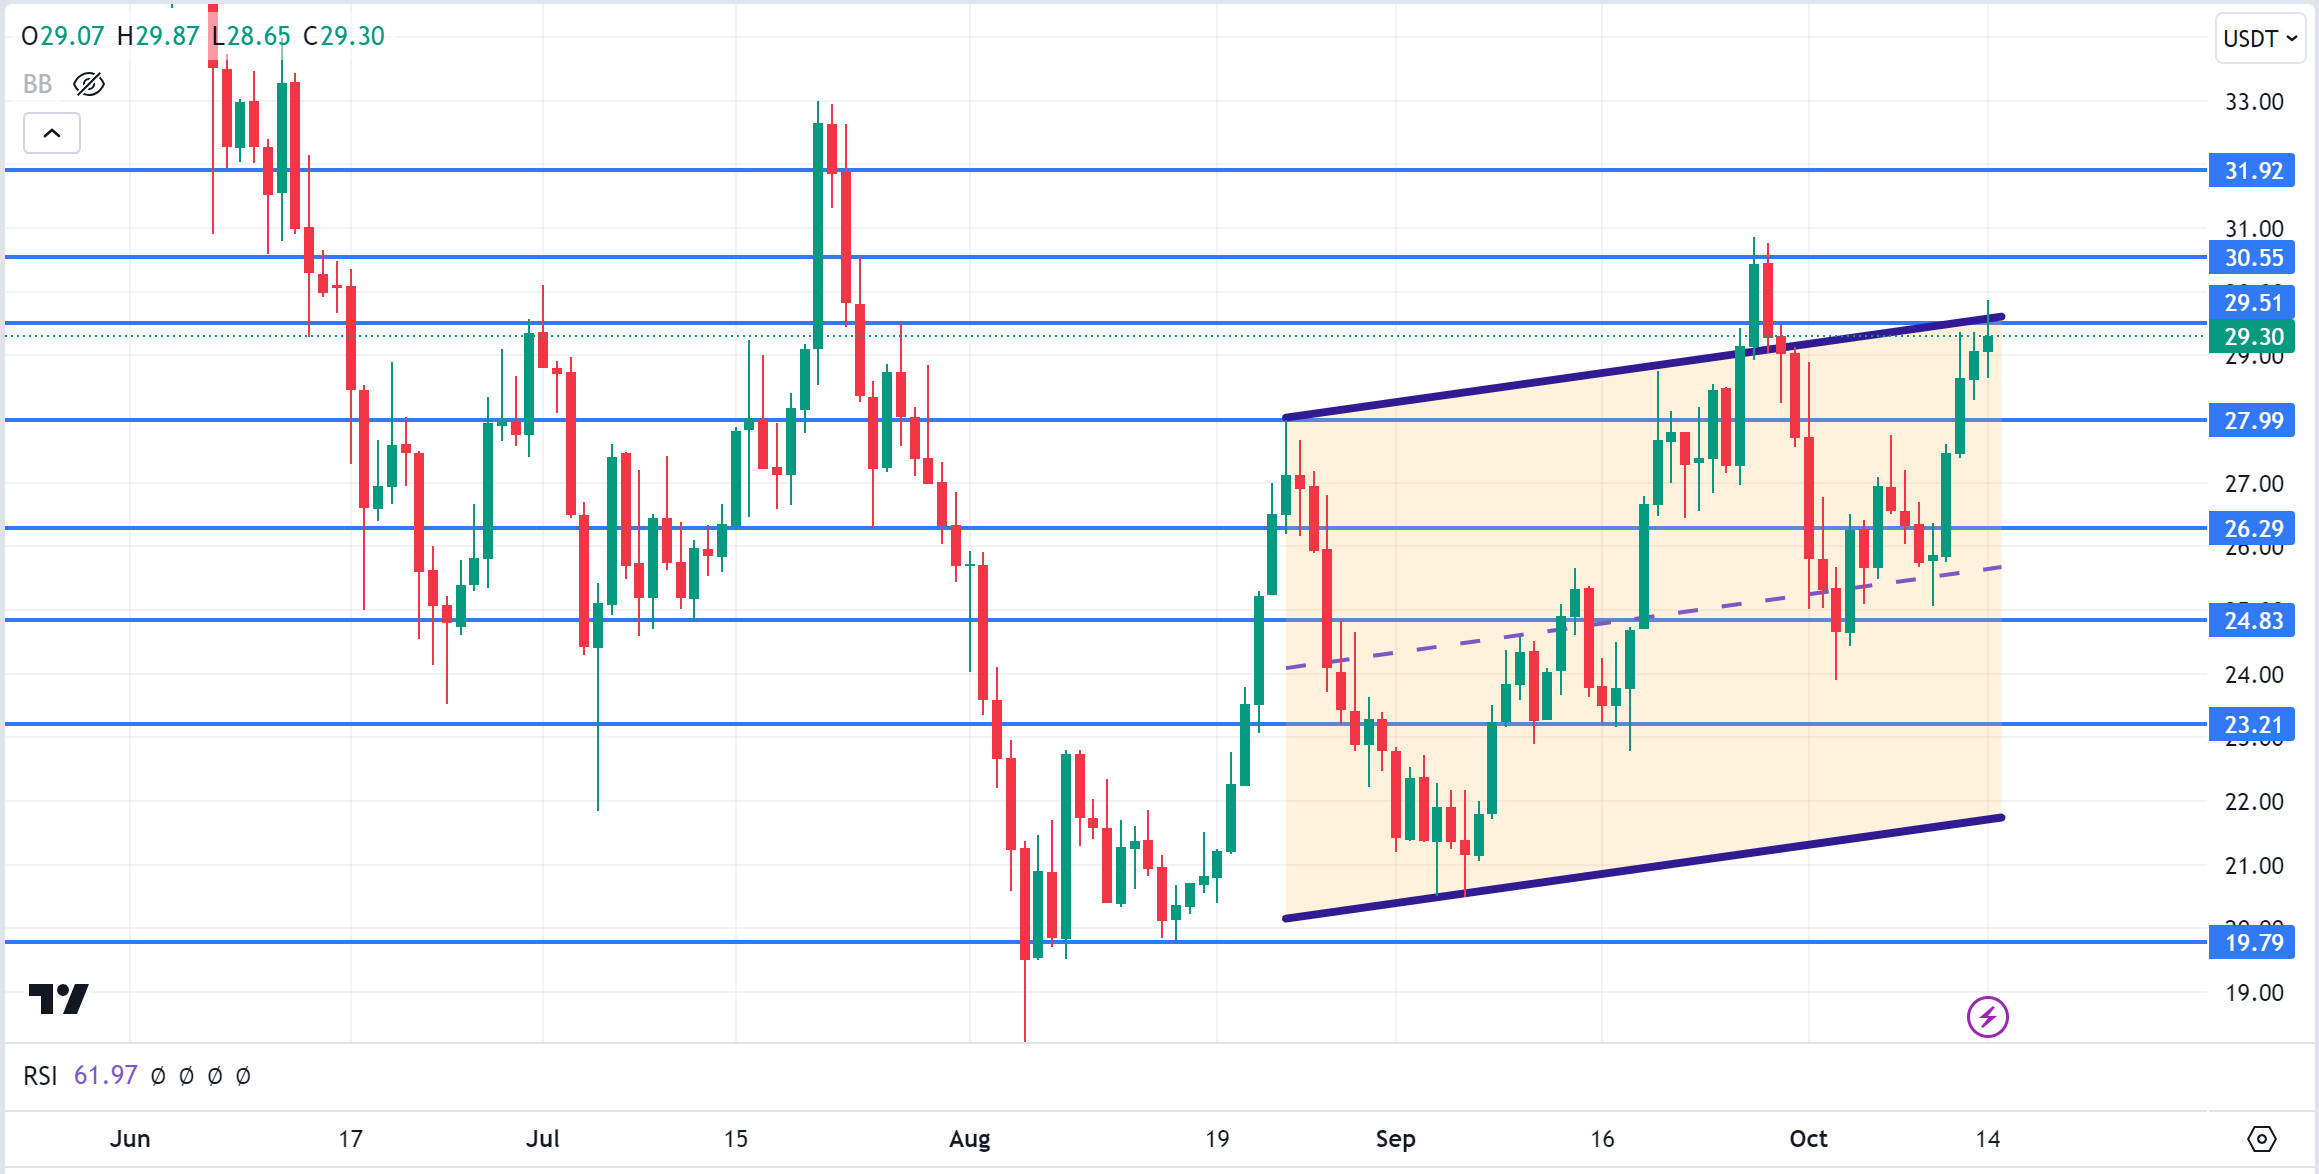
AVAX, which started the previous week at 26.93, rose by about 8% during the week and closed the week at 29.06. This week, unemployment claims and retail sales data will be released in the US. The market will continue to look for direction according to these data and news from the Middle East. These data will also affect the market and AVAX. High volatility may occur in the market during and after the data release.
AVAX, which is currently trading at 29.32 and continues its movement within the rising channel on the daily chart, may break the upper band of the channel upwards with the positive perception of the upcoming data by the market. In such a case, it may test the 29.51 and 30.55 resistances. Especially with the candle closure above 30.55 resistance, its rise may accelerate. With the reaction from the upper band of the channel and selling pressure, it may move towards the middle and lower band of the channel and test the supports of 27.99 and 26.29. As long as there is no candle closure below 19.79 support on the daily chart, the upward appetite may continue. The decline may deepen with the candle closure below this support.
Supports 27.99 – 26.29 – 24.83
Resistances 29.51 – 30.55 – 31.92
TRX/USDT
TRX, which started last week at 0.1544, rose about 5% during the week and closed the week at 0.1625.
This week, unemployment claims and retail sales data will be released in the US. These data are important to affect the market and data to be announced in line with expectations may have a positive impact.
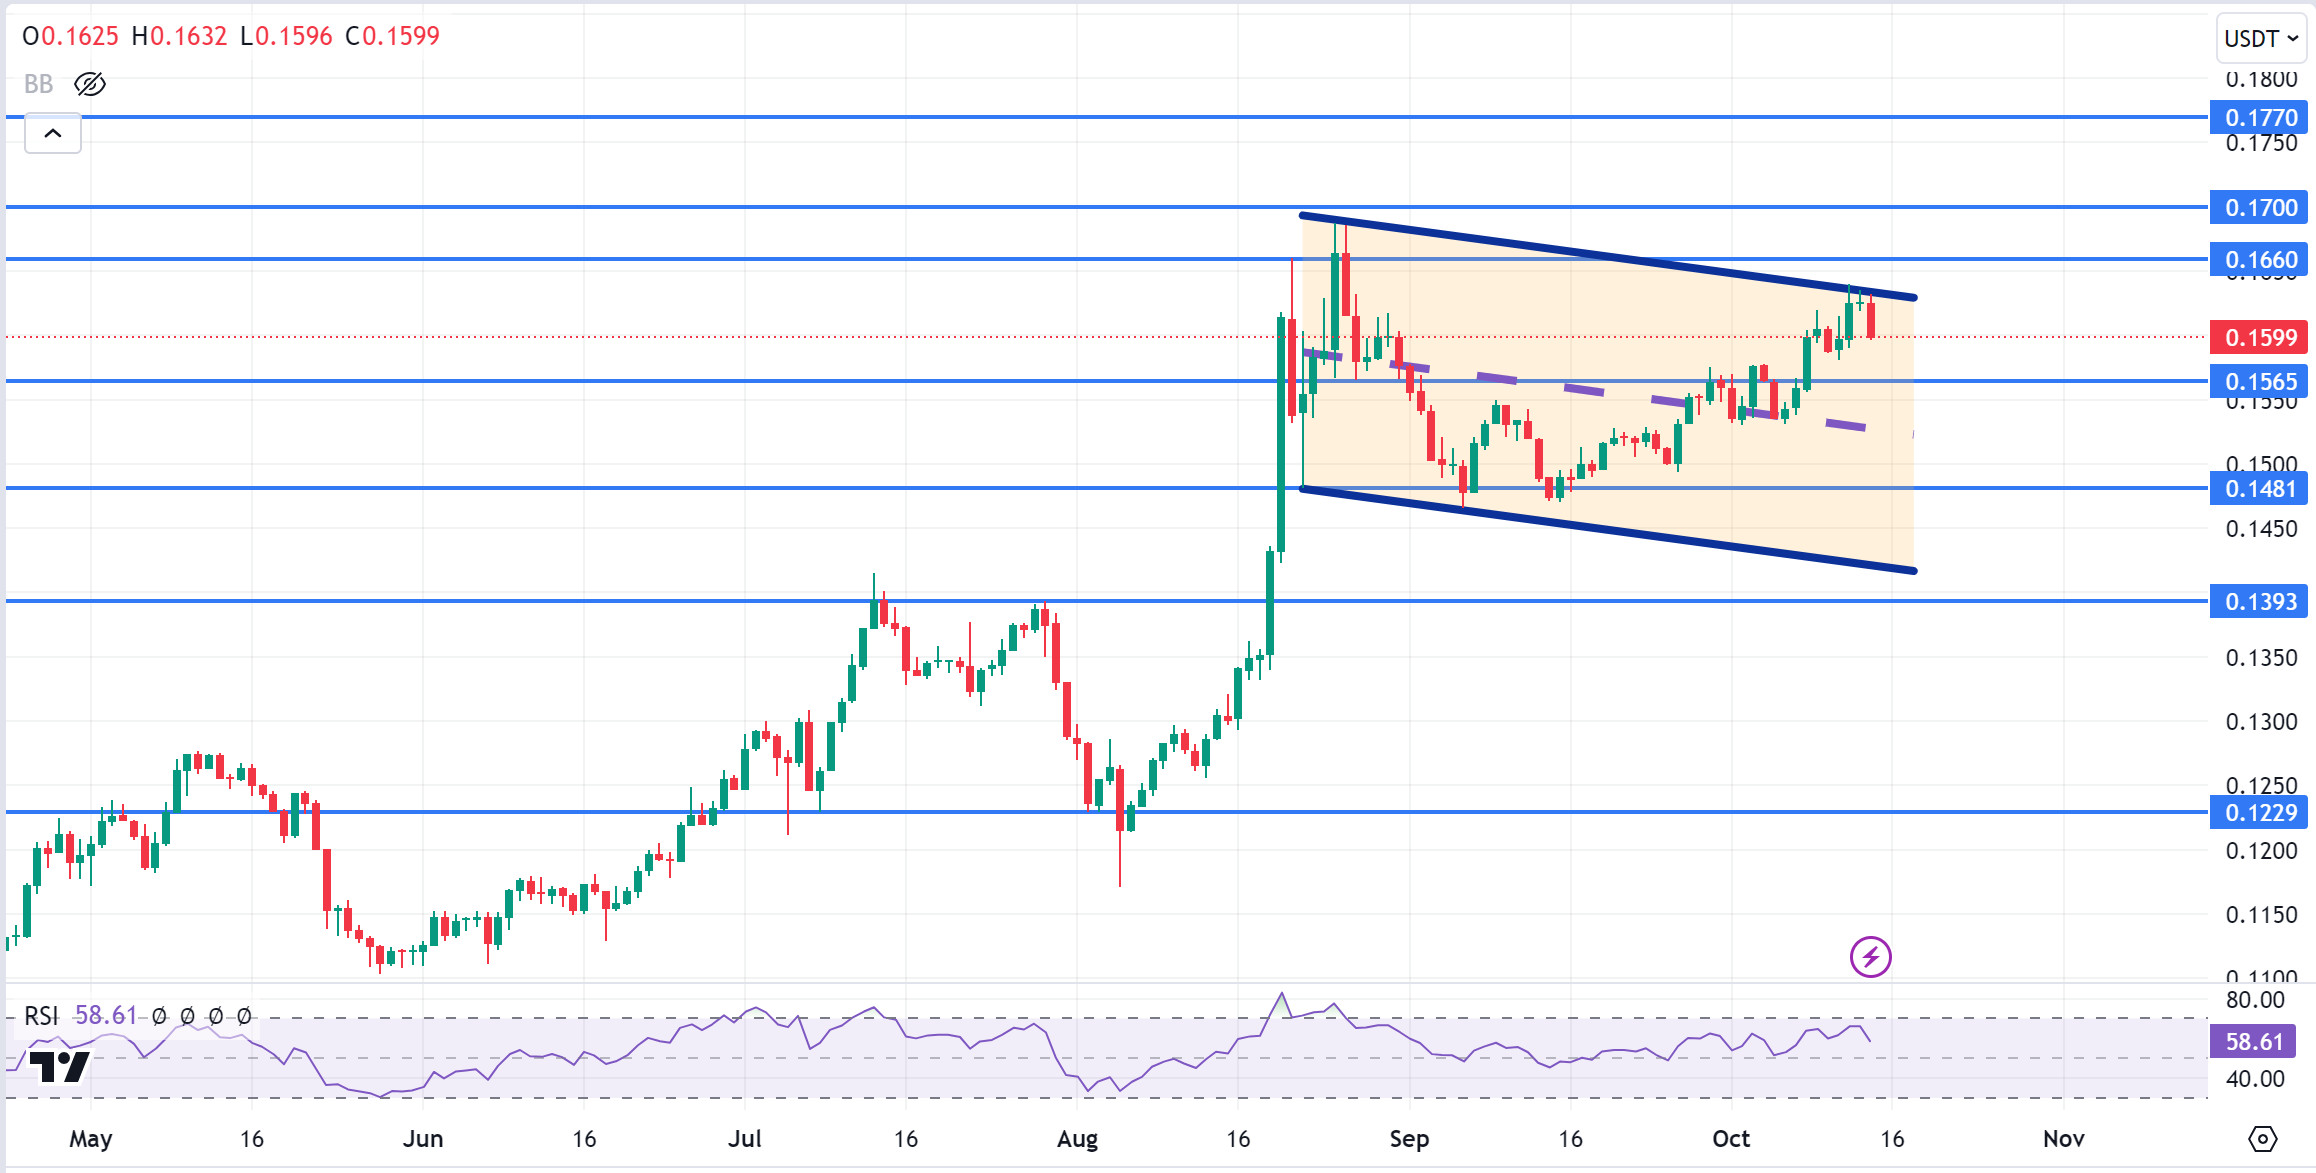
TRX, which is currently trading at 0.1599 and moving in a falling channel on the daily chart, is in the upper band of the channel. With the RSI value of 58, it can be expected to decline slightly from its current level and move to the middle band of the channel. In such a case, it may test 0.1565 support. If it cannot break 0.1565 support and rises with the next buying reaction, it may want to test 0.1660 resistance. As long as it stays above 0.1229 support on the daily chart, the bullish demand may continue. If this support is broken, selling pressure may increase.
Supports 0.1565 – 0.1481 – 0.1393
Resistances 0.1660 – 0.1700 – 0.1770
 XRP/USDT
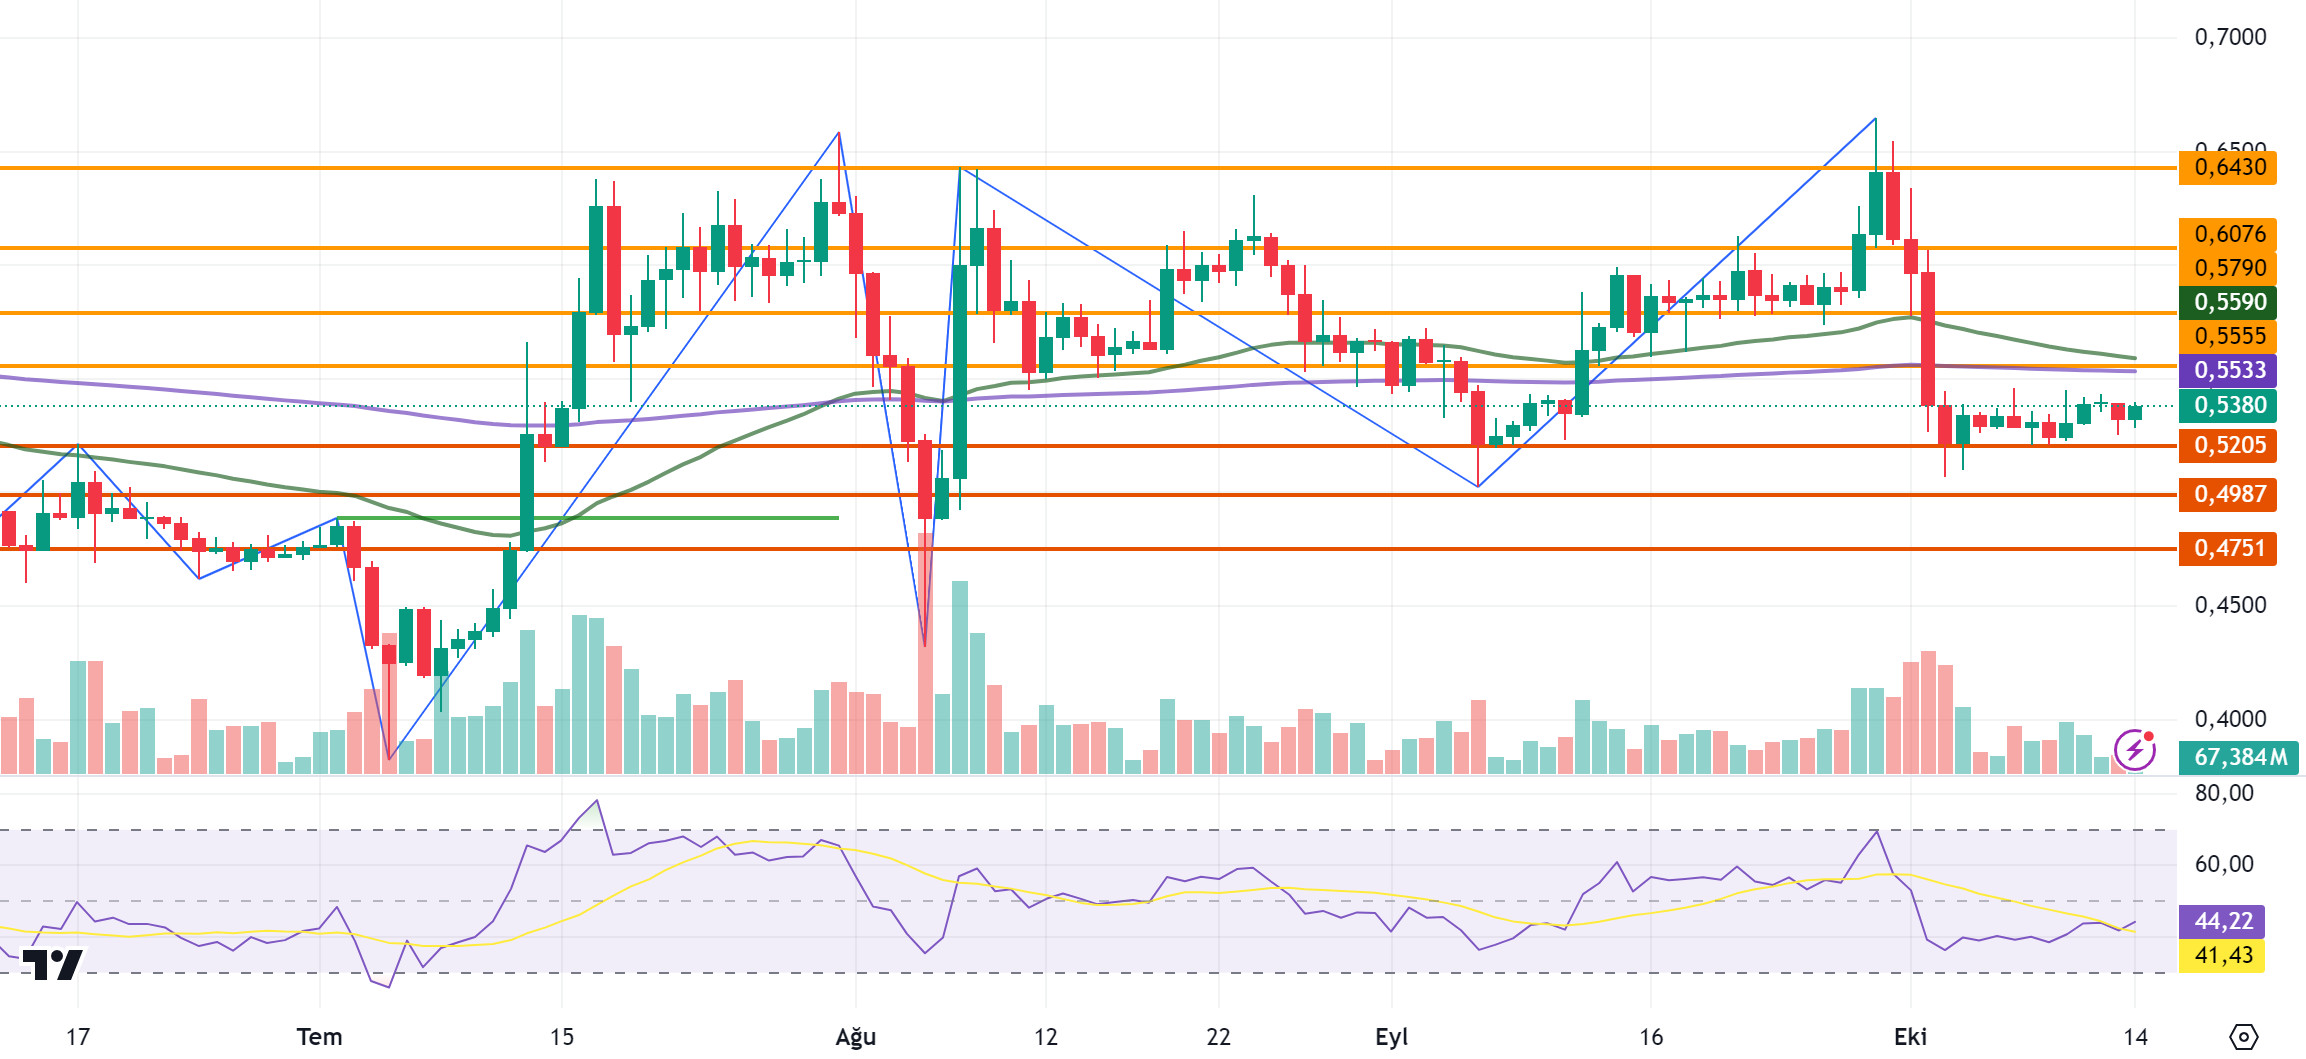
XRP, which started last week at 0.5334, traded in a horizontal band between 0.525 and 0.545 and closed the week at 0.5316. XRP, which started the week with a rise, is currently trading at 0.5380. After falling to 0.5066 after the events in the Middle East and the SEC’s appeal, it recovered with the ETF application news. XRP is trading below EMA levels with its sharp decline. In XRP, where selling pressure occurred with the SEC’s appeal, the decline with ETF news left the horizontal movement after the recovery. There is currently no positive or negative development in XRP and it may move within a horizontal band in this process. With the positive developments in the crypto market, XRP may rise in XRP under the influence of the rise that may occur in major coins and test the resistance levels of 0.5555-0.5790-0.6076 with its rise. In case of a decline with possible negative developments, XRP may test the support levels of 0.5205-0.4987-0.4751 with its decline.
XRP, which is traded below the EMA levels with the sharp decline it experienced, may decline and offer a short trading opportunity with possible sales at the EMA50 and EMA200 and 0.5555 resistance level. If these levels are broken in its rise, the rise may continue and may offer a long trading opportunity with possible purchases.
EMA50 (Green Line) – EMA200 (Purple Line)
Supports 0. 5205 – 0. 4987 – 0.4751
Resistances 0.5555 – 0. 5790 – 0.6076
DOGE/USDT
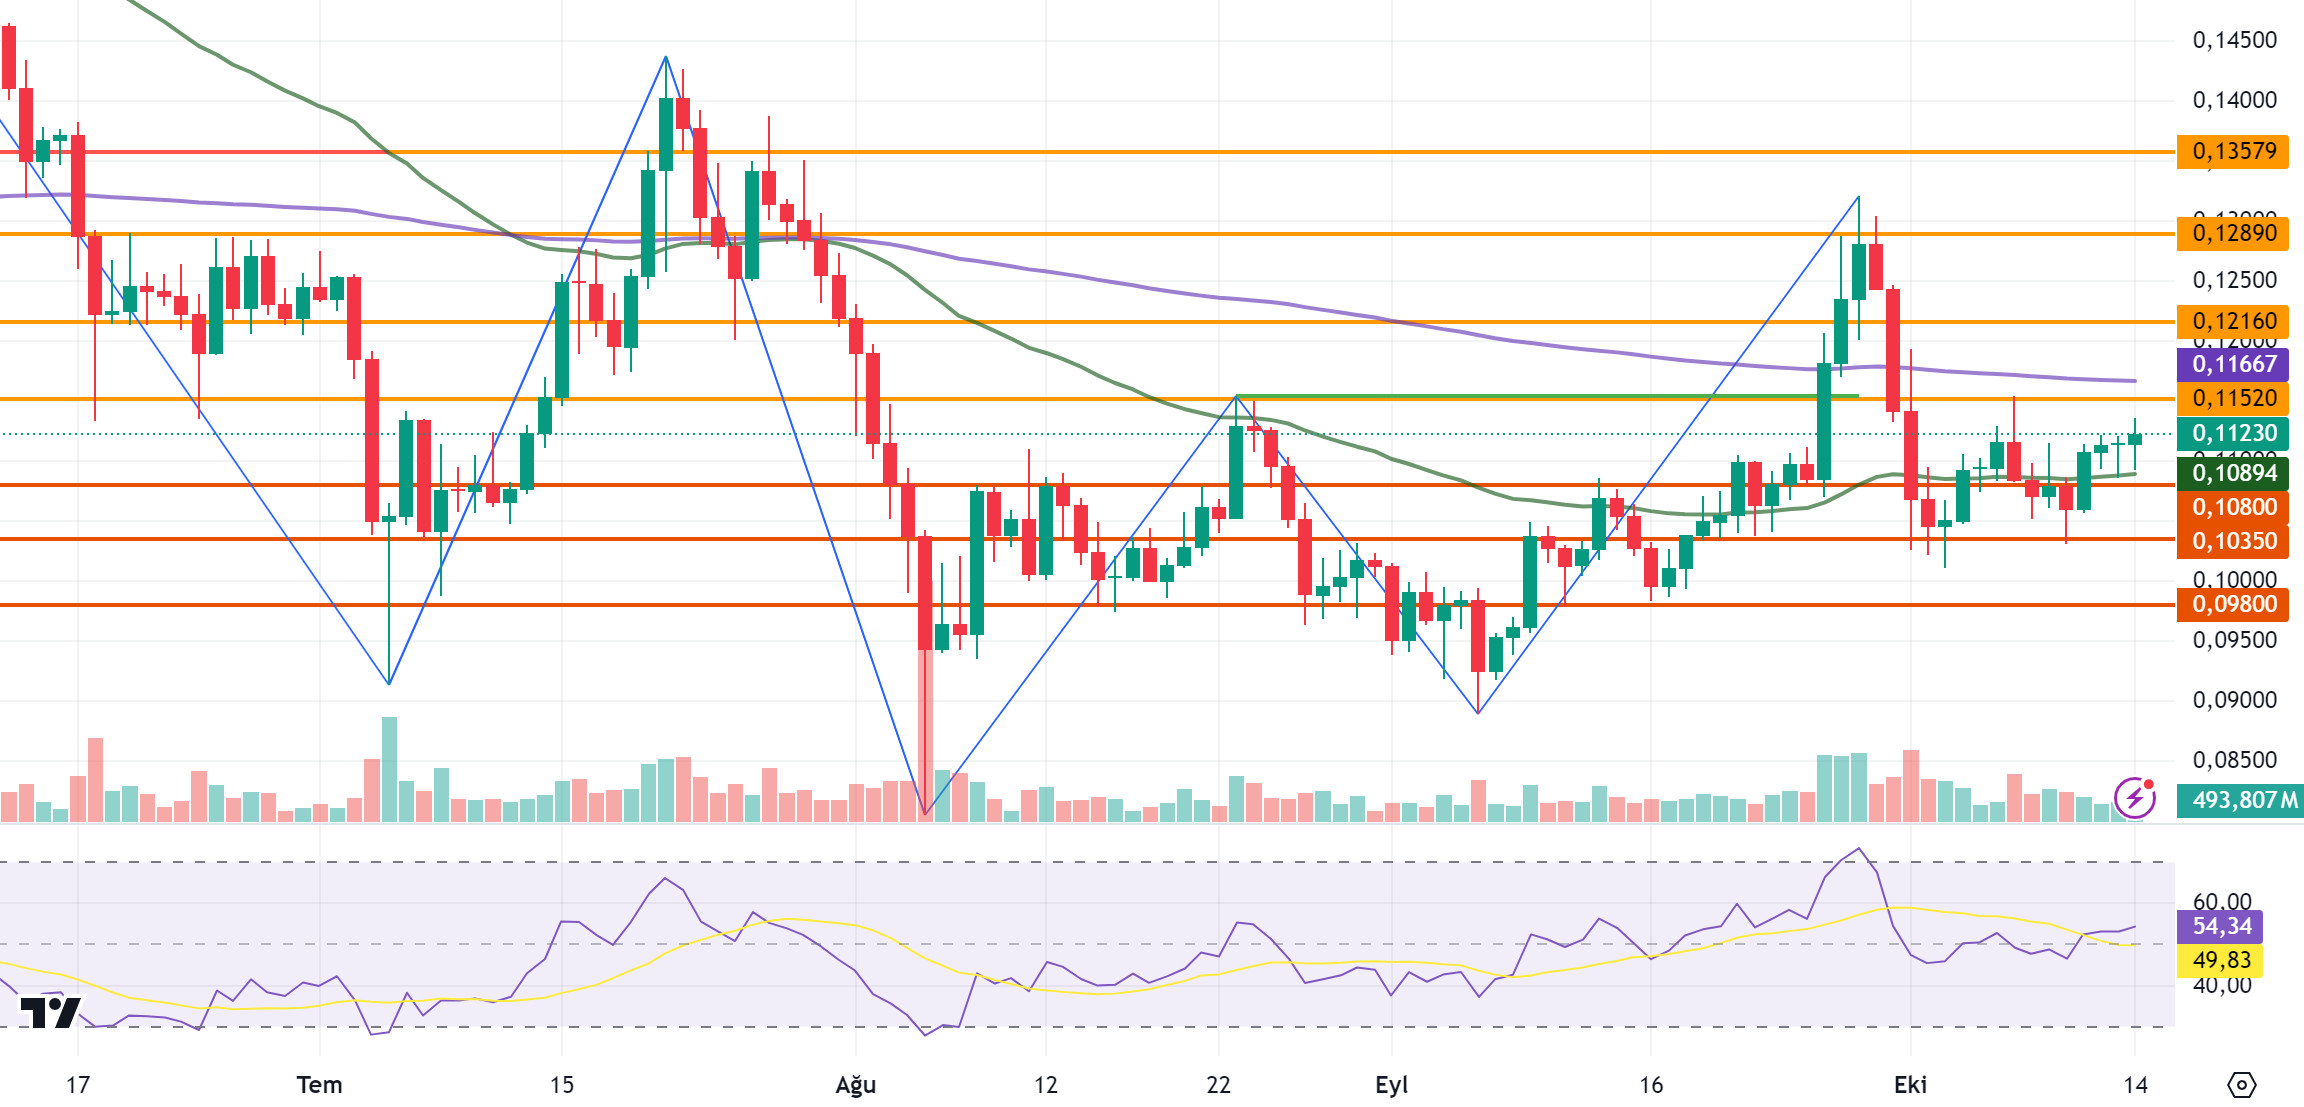
In the crypto market, which declined after the tension in the Middle East, DOGE fell to 0.1010 and then rose to 0.1115 levels with purchases. Last week, it continued to move in a horizontal band between EMA50 and EMA200 levels. After the horizontal movement in DOGE, the weekly close was realized at 0.1113. DOGE, which started the new week with a rise, continues to be traded at 0.1123. In the uptrend created by the positive environment across the crypto market, DOGE can test the resistance levels of 0.1152-0.1216-0.1289 with its rise. In case the positive environment is replaced by a negative environment with possible negative developments and a decline, DOGE may test the support levels of 0.1080-0.1035-0.0980 with its decline.
If DOGE declines, the EMA50 level comes to the fore. If it falls to the EMA50 level, it may rise with the purchases that may come at this level and may offer a long trading opportunity. In its rise, it may decline with possible sales at the EMA200 and 0.1150 level and may offer a short trading opportunity.
EMA50 (Green Line) – EMA200 (Purple Line)
Supports 0.1080 – 0.1035 – 0.0980
Resistances 0.1 152 – 0.1216 – 0.1289
DOT/USDT
Mythos brings 3.6 million new users to the Polkadot ecosystem. Following the migration of Mythical Games’ Blankos collection and DMarket assets to Polkadot, this integration is expected to generate more than 5 million wallets. Utilizing Polkadot’s parachain structure and EVM module, Mythos aims to provide a transparent and secure trading environment for NFT collections.
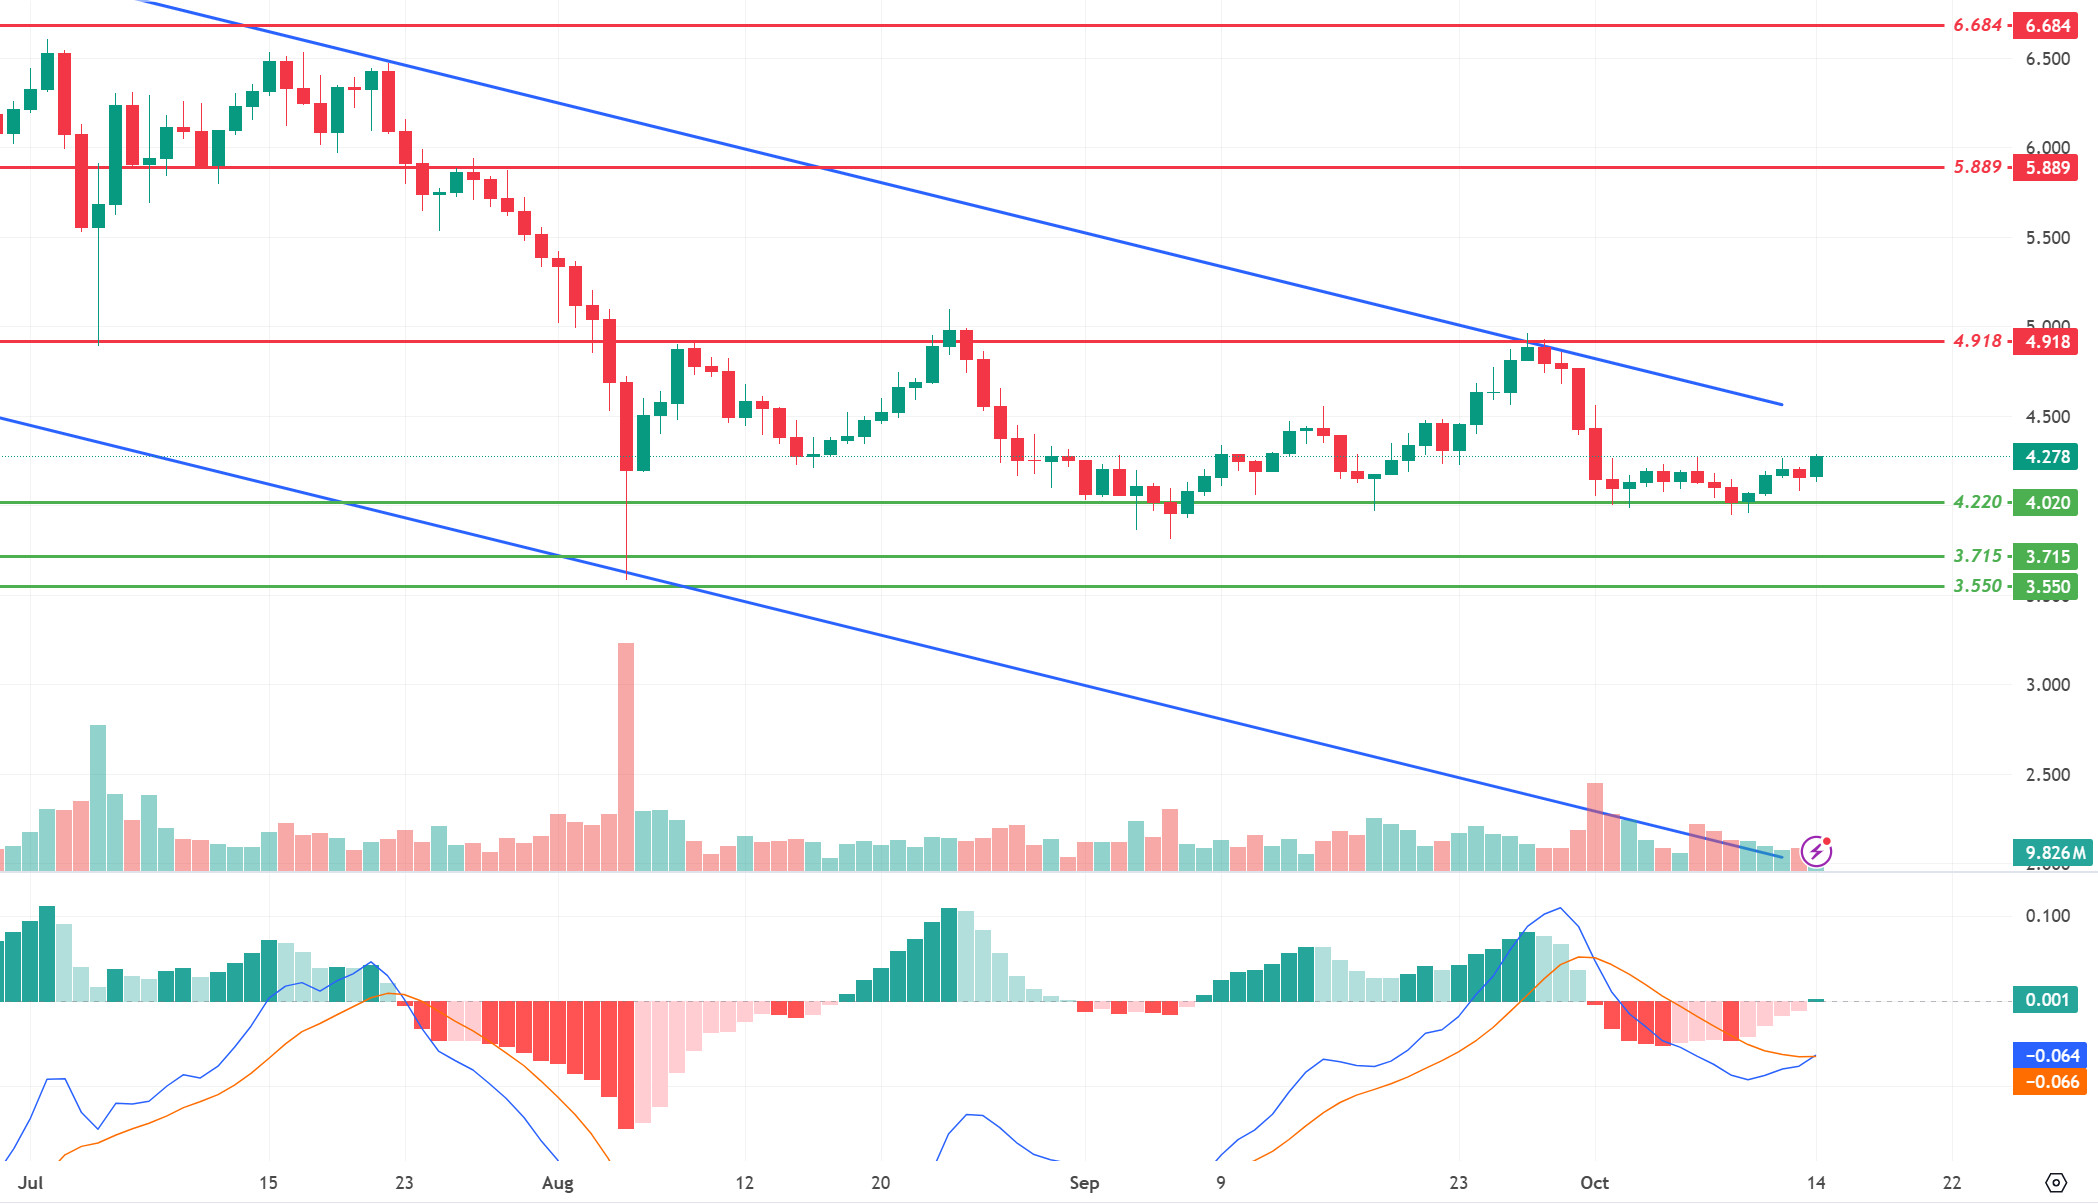
When we examine the daily chart of Polkadot (DOT), the price is moving towards the upper band within the descending channel. On the MACD, we see that selling pressure is decreasing and buying pressure is increasing. In a positive scenario, if the price breaks the upper band of the descending channel upwards, we may see a move towards the resistance levels of 4.918 and 5.889 respectively. On the other hand, if the selling pressure increases, the price may retreat towards the 4,220-support level.
Supports 4,220 – 3,715 – 3,550
Resistances 4.918 – 5.889 – 6.684
SHIB/USDT
Shiba Inu’s (SHIB) burn rate increased by 555% in the last 24 hours, leading to the burning of 5,166,319 SHIBs, which contributed to the reduction in supply. The BONE token, which plays an important role in the SHIB ecosystem, is used to cover gas fees and support the burning process in Shibarium. According to DeFiLlama data, Shibarium’s total value locked (TVL) in the DeFi ecosystem reached $4.37 million, surpassing the $3.9 million level in March. The community remains confident in Shibarium’s potential long-term impact.
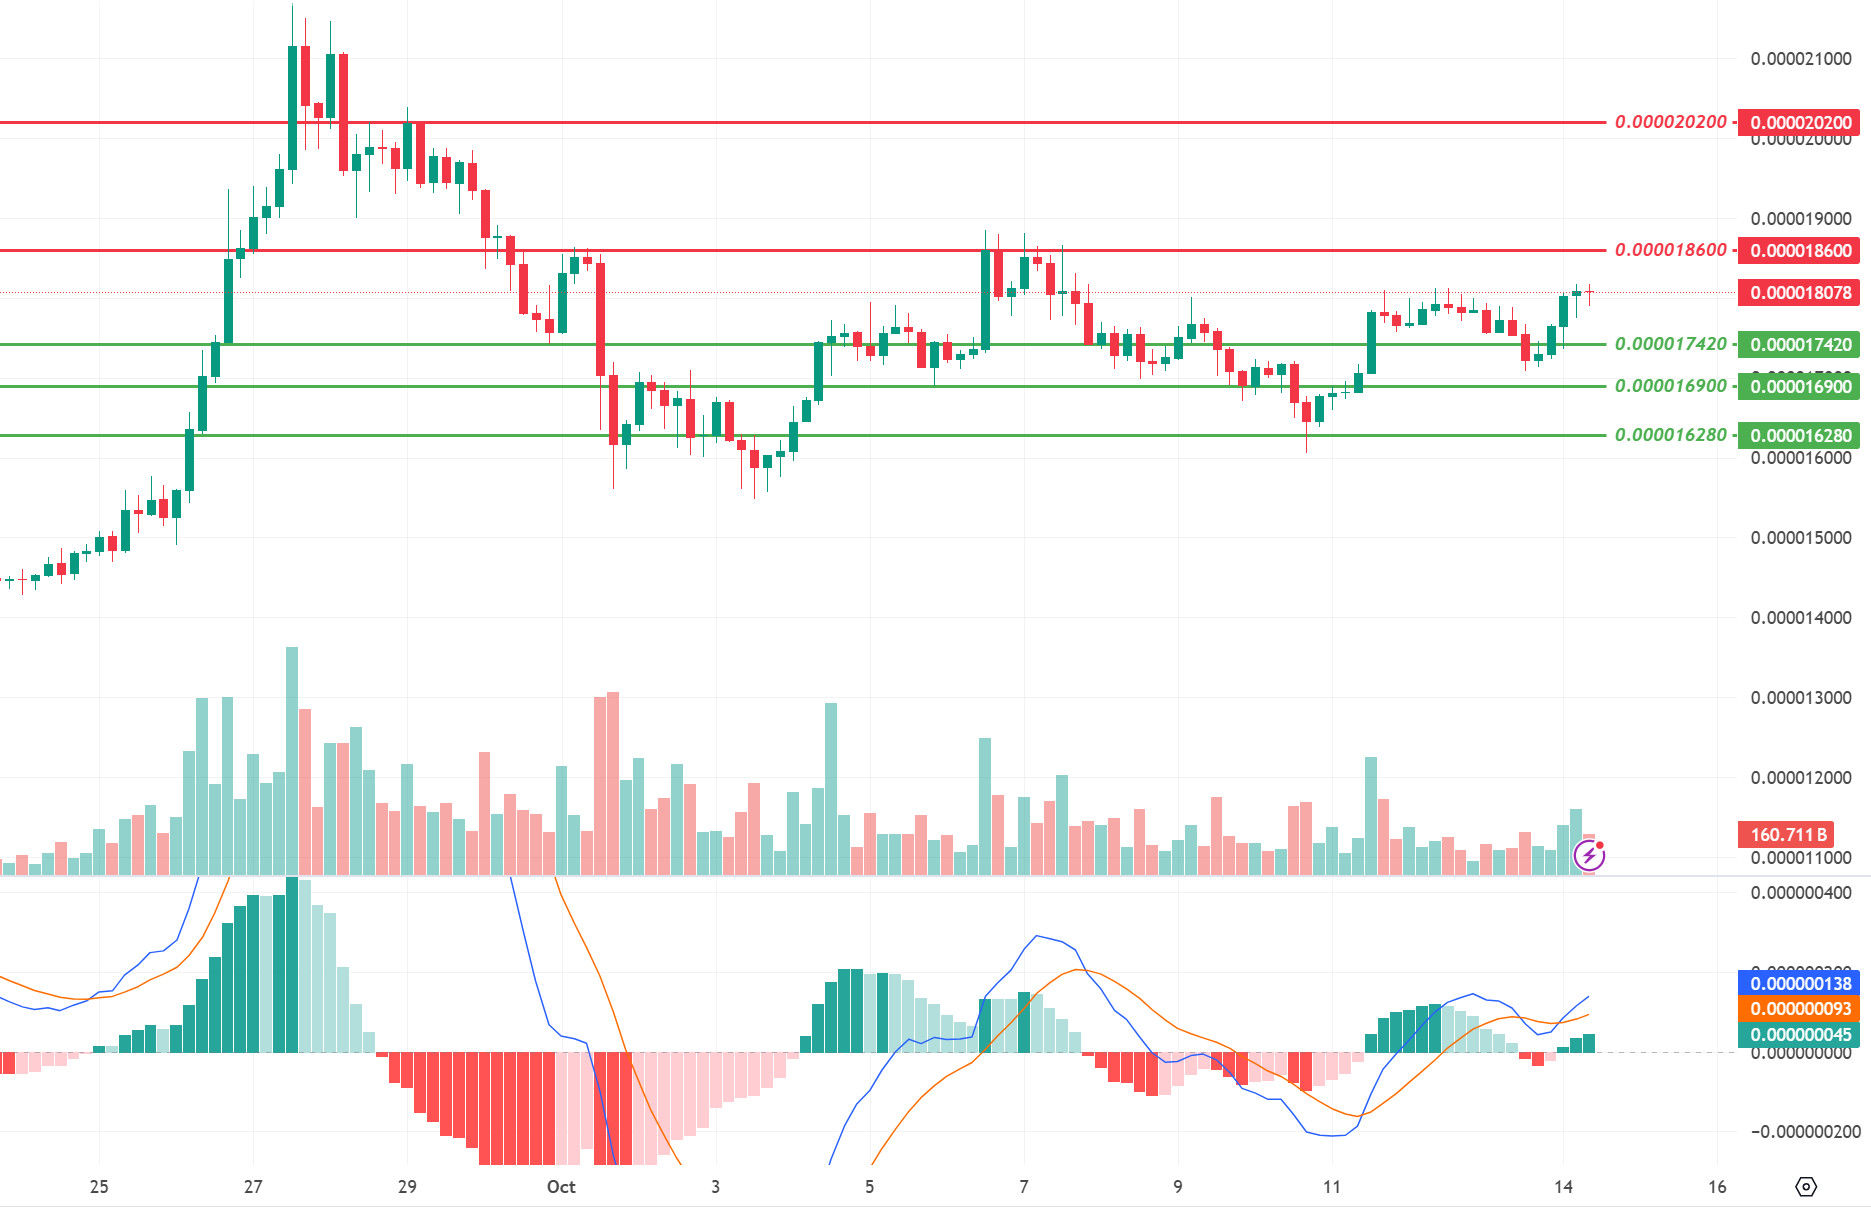
When we examine the 4-hour chart of Shiba Inu (SHIB), the price fell to the 0.00001628 support band. The price is trending towards the 0.00001860 resistance level with the reaction from the 0.00001628 support band. When we examine the MACD oscillator, we see that the buyer pressure continues to increase. If the price breaks the 0.00001860 levels upwards and provides permanence, we may see a rise towards 0.00002020 levels. On the other hand, if the selling pressure increases, the price may retreat towards the 0.00001742 support band.
Supports 0.00001742 – 0.00001690 – 0.00001628
Resistances 0.00001860 – 0.00002020 – 0.00002410
LEGAL NOTICE
The investment information, comments and recommendations contained in this document do not constitute investment advisory services. Investment advisory services are provided by authorized institutions on a personal basis, taking into account the risk and return preferences of individuals. The comments and recommendations contained in this document are of a general type. These recommendations may not be suitable for your financial situation and risk and return preferences. Therefore, making an investment decision based solely on the information contained in this document may not result in results that are in line with your expectations.


