BTC/USDT
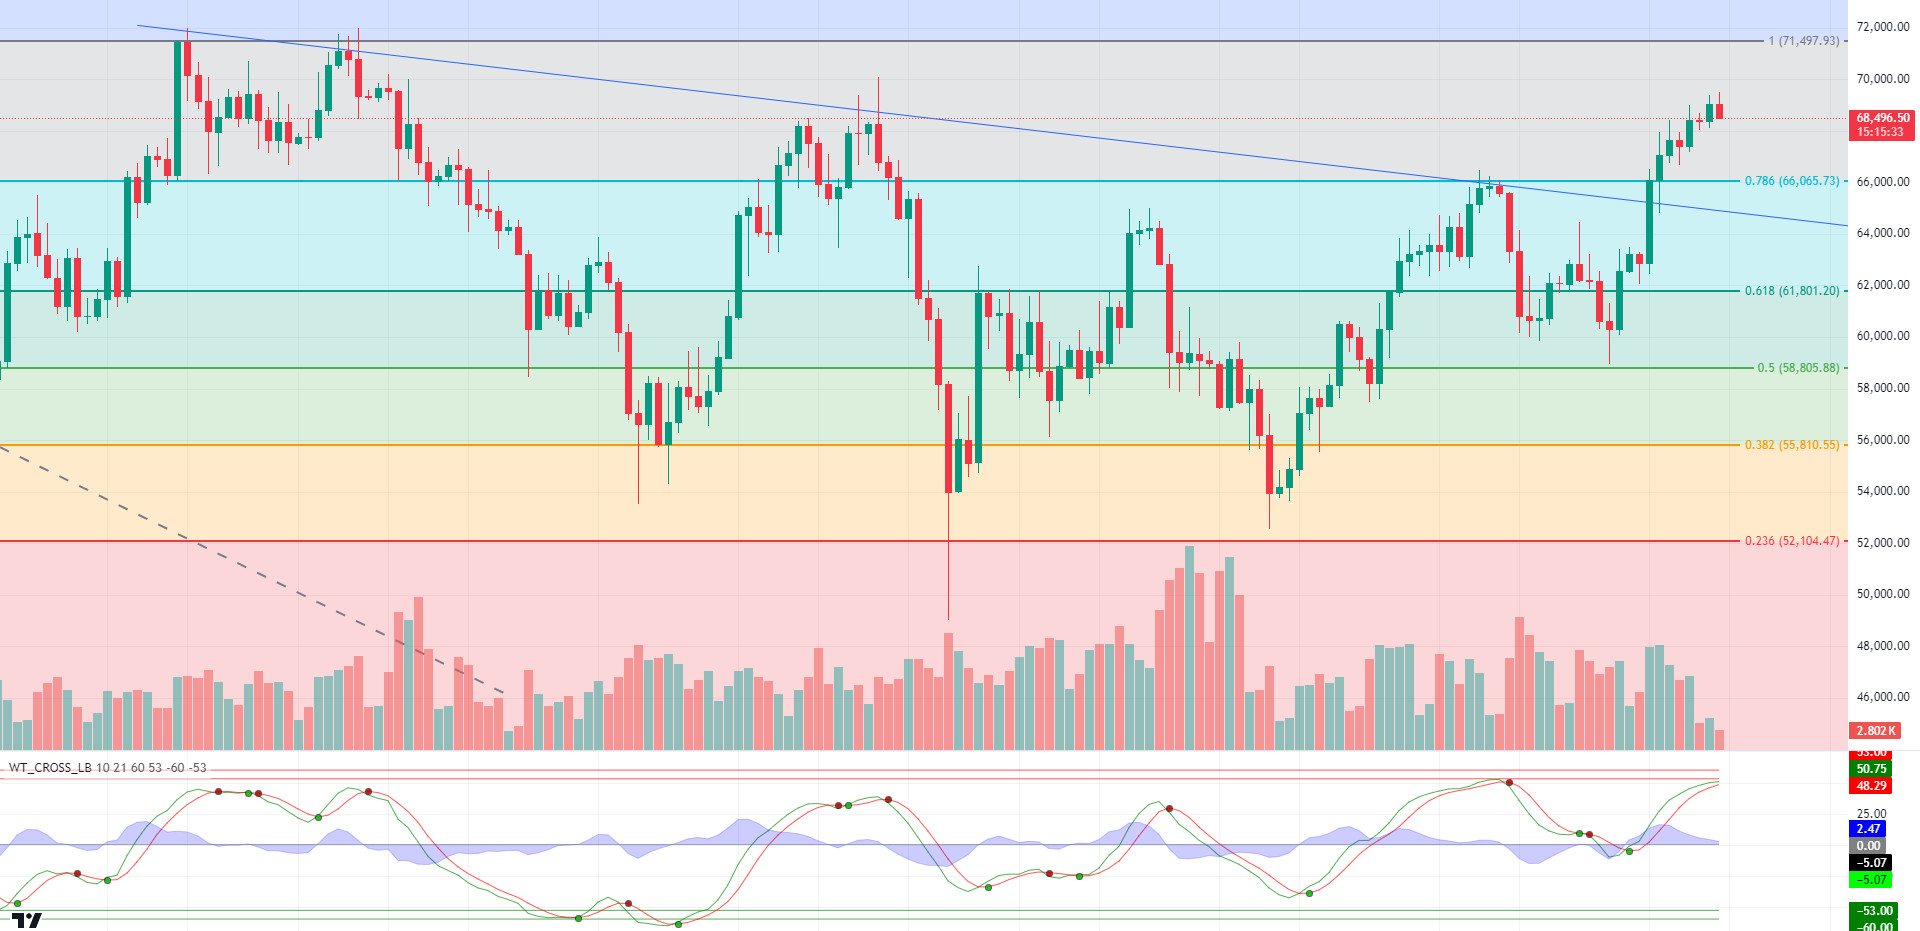
“Uptober” started to show its effect in Bitcoin. Bitcoin, which did not make a good start to October and fell as low as 59,000, caught an uptrend starting from the second week and withstood up to 70,000 levels. Behind the steady rise in Bitcoin, D. Trump, who is known to be pro-crypto in the US presidential elections, is seen to be gaining ground on his closest rival Kamala Harris in the polls. In addition, the fact that Bitcoin spot ETFs witnessed positive entries for the fifth consecutive day stands out as another factor behind the strong stance in Bitcoin. With the US elections approaching, volatility in the market is expected to increase and the upward momentum in Bitcoin is expected to continue.
When we look at the BTC daily technical analysis chart, we observe that the falling trend structure was broken with the crossing of the Fibonacci 0.786 (66,065) level. As we come to the end of October, the last resistance level before the ATH, which we expect to meet us as the election process approaches and the upward momentum continues, is Fibonacci 1 (71,497). The Wave trend oscillator, our technical indicator, continues to maintain its buy signal on a daily basis. In a potential correction, the level we expect to work as a support level is Fibonacci 0.786 (66,065).
Supports 66,065 – 61,800 – 58,800
Resistances 69,500- 71,497 – 73,700
ETH/USDT
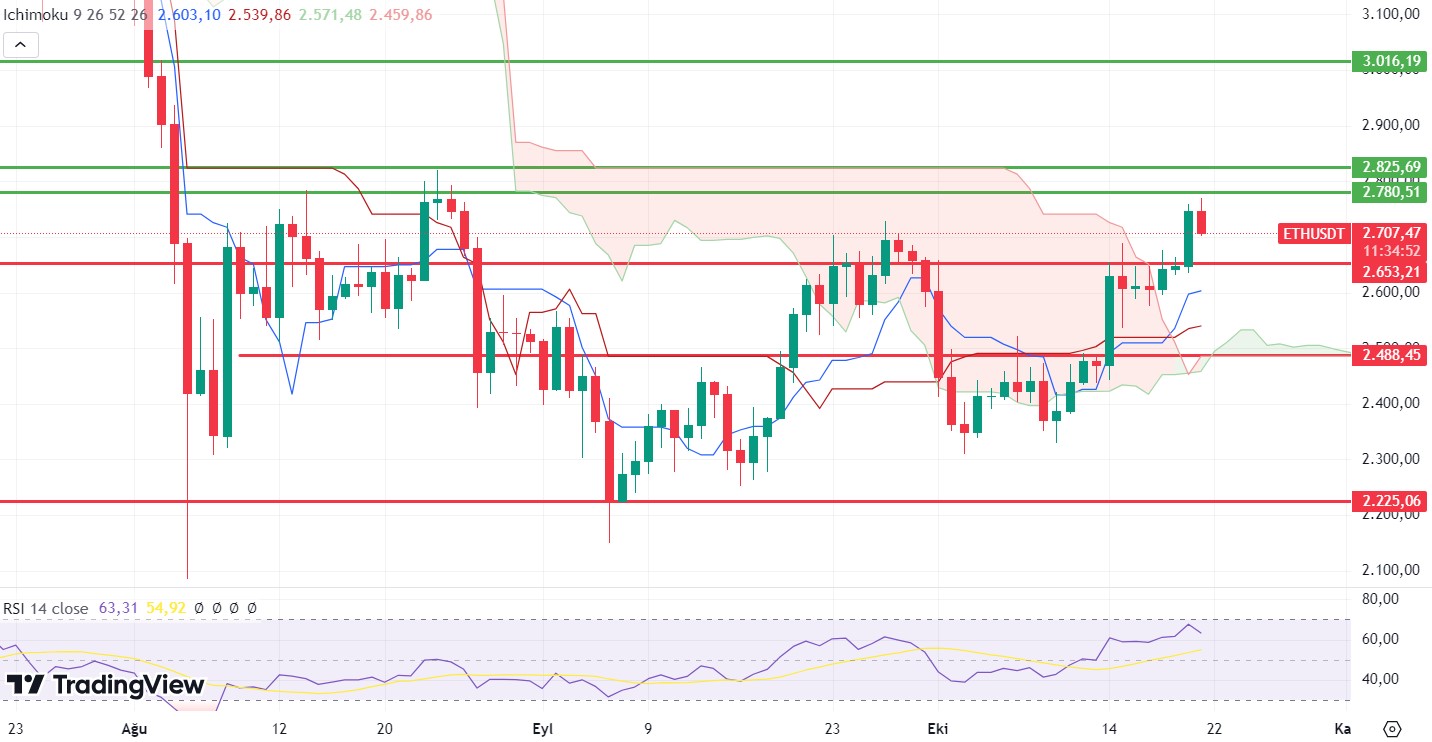
As the crypto market continues to rise in October, Ethereum is approaching important resistance levels. Increasing TVLs on Ethereum, especially on L2s, and new projects in LRT protocols are causing high ETH inflows to liquidity pools. Looking at Dune data, we can clearly see these increases on Scroll and Eigenlayer.
On the technical side, Relative Strength Index (RSI) and Chaikin Money Flow (CMF), which move in line with the price, stand out. In addition, it can be said that the positive outlook for Ethereum, which has exceeded the kumo cloud level, is maintained and that the rises will gain momentum by exceeding the 2,780 resistance. However, some correction may be seen in the short term with some retracement of the Bitcoin price. These corrections can be said to be natural up to 2,653 levels. Closures below this level may cause the declines to continue for a while.
Supports 2,653 – 2,488 – 2,225
Resistances 2,780 – 2,825 – 3,016
LINK/USDT
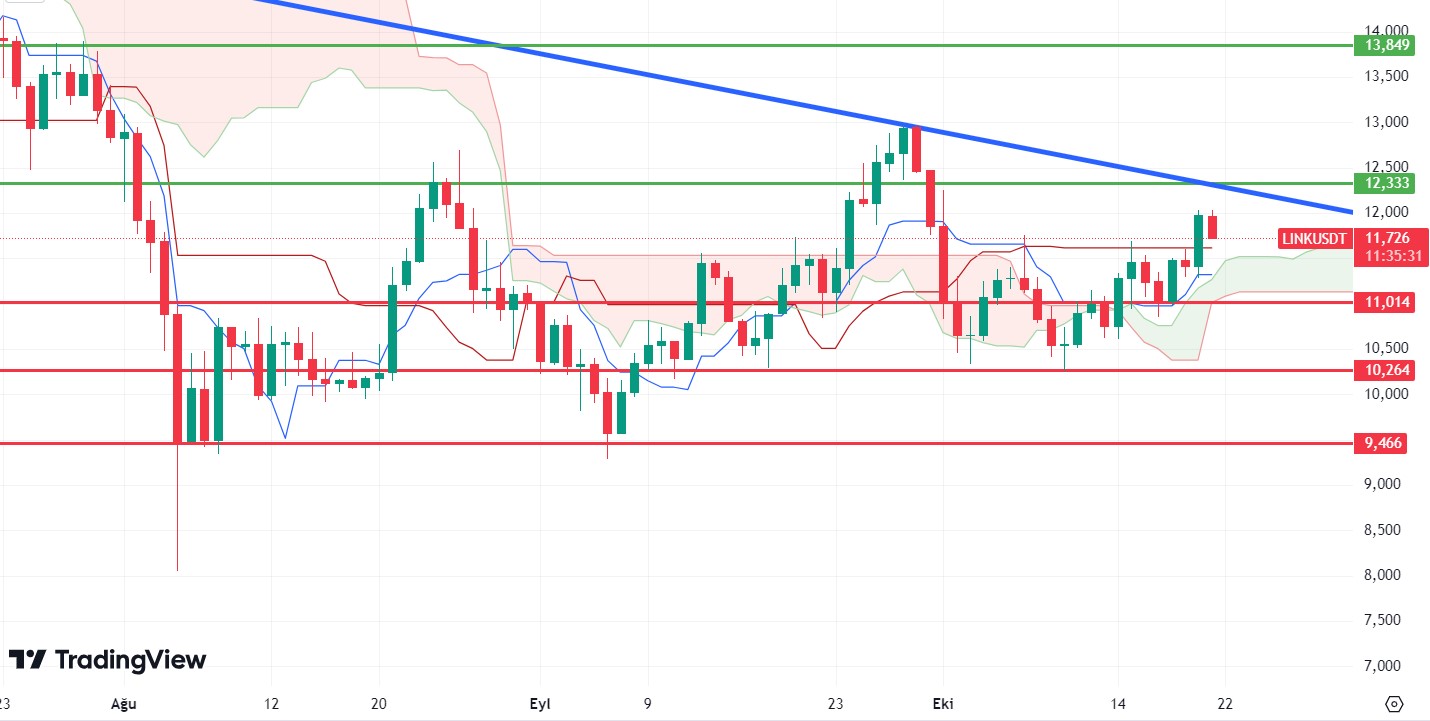
For LINK, which looks positive again with the rising market, the closures above the tenkan and kijun levels indicate that the rises may continue a little more in the daily timeframe. It can be said that the most important resistance level for LINK approaching the falling trend line is 12.33. Although it seems quite difficult to exceed this level in the short term, it can be said that very serious rises can start with the break of the level. The 11 level is the main support level, but the break of the level may deepen the declines by starting a negative trend again.
Supports 11 – 10.26 – 9.46
Resistances 12.33 – 13.84 – 14.76
SOL/USDT
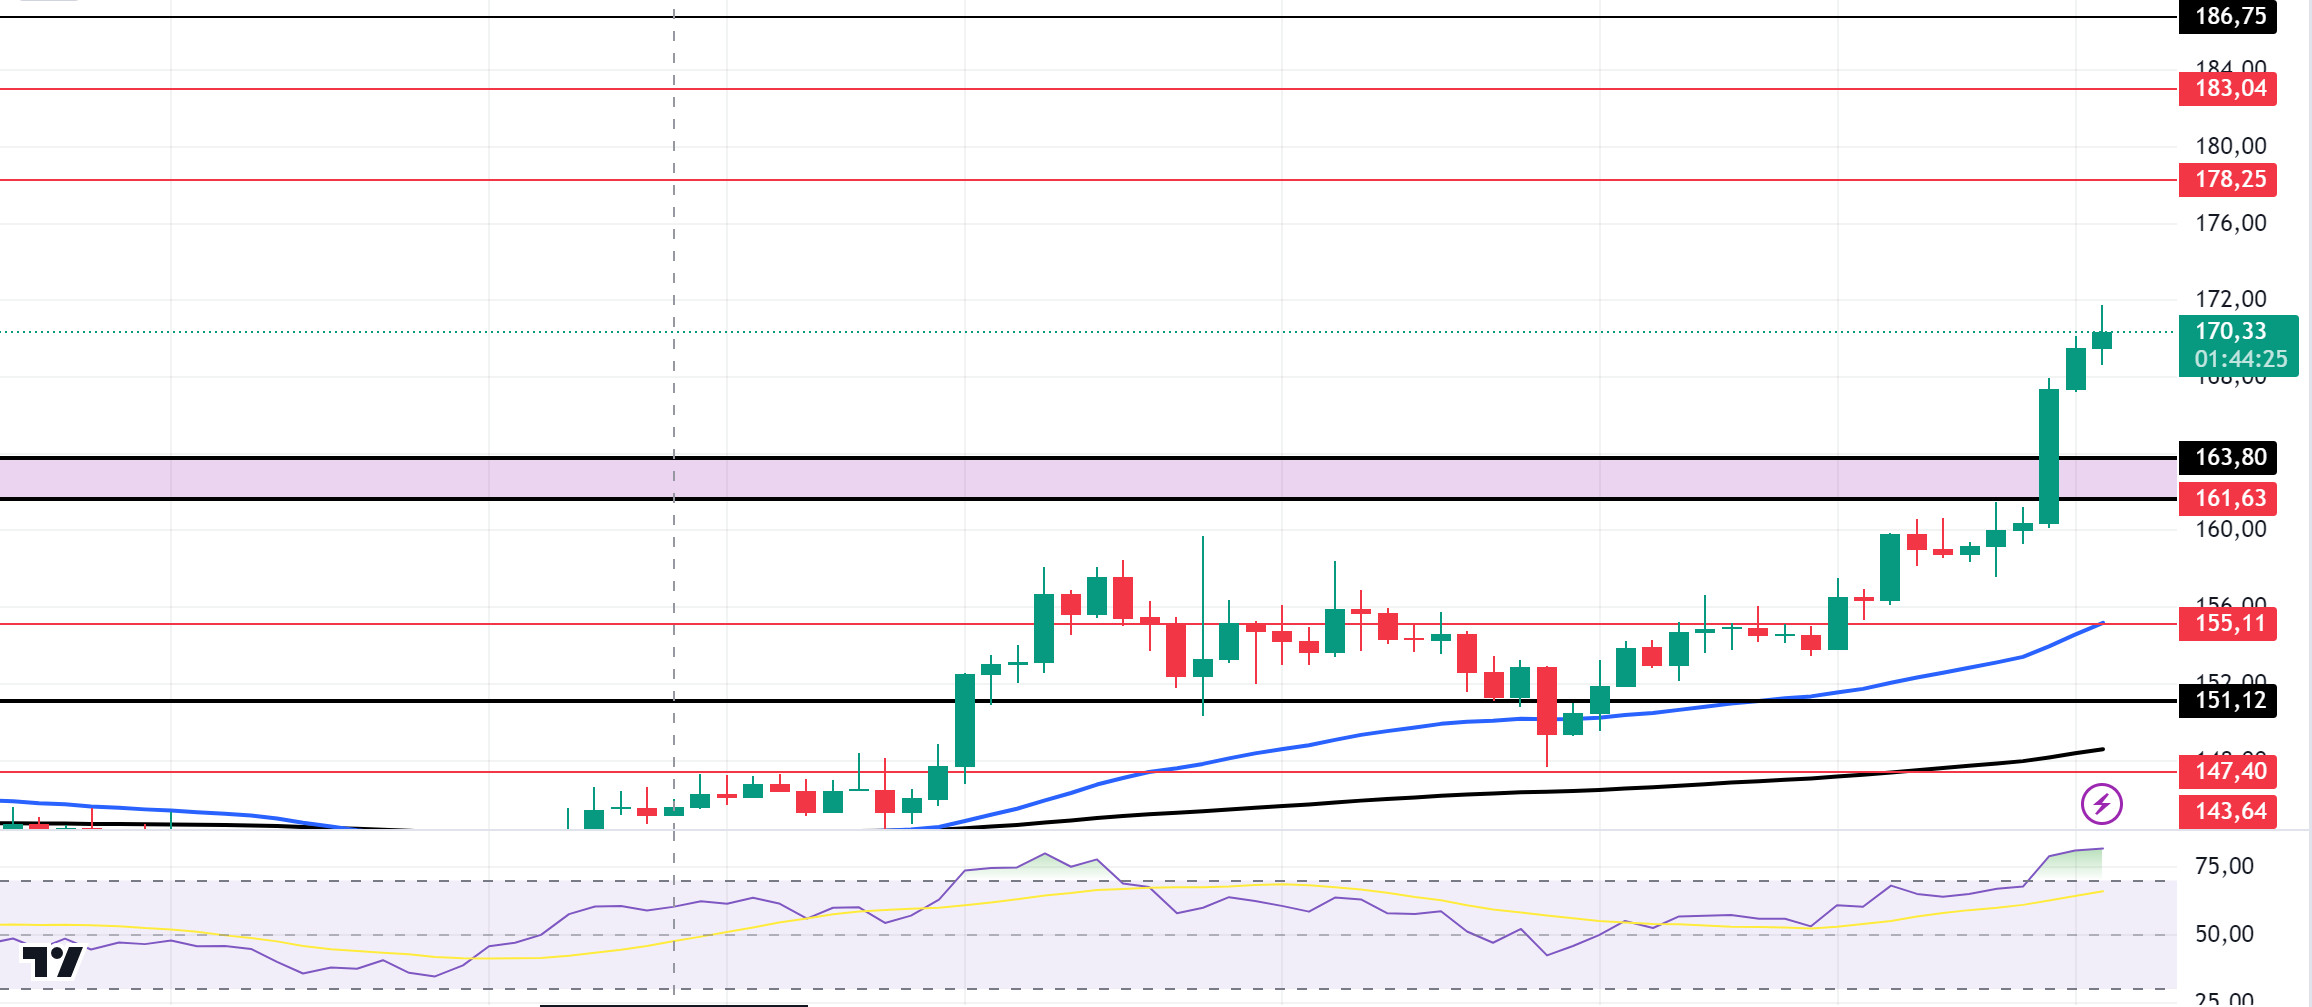
The American elections are approaching. According to data from Polymarket, Trump is ahead with 61.3%. According to data from CME, the probability of a 25 basis point rate cut is 90.2%. Last week, we witnessed a large inflow of stablecoins such as Tether (USDT) to centralized exchange platforms. Stablecoin inflows usually represent an increase in demand from retail investors. This is generally bullish for the market. On the other hand, US unemployment claims from America were highly anticipated. This met expectations with 241 thousand. Another data, retail sales data, came in better than expected. This is a development that reduces the risk of recession considerably. In the Solana ecosystem, according to the data, the amount of SOL locked in Solana’s DeFi ecosystem reached 36 million SOL. This is the highest level ever recorded. This amount corresponds to approximately 6 billion dollars at current prices. According to data from Artemis, last week’s trading volume rose to $5.8 billion. However, interest in the Solana blockchain doubled in 2024. The number of active addresses on the Solana network has also increased sharply. According to data from A16zcrypto, founders’ interest in building on Solana increased from 5.1% to 11.2%. Among the data to follow this week, US SEC Chairman Gensler’s speech and manufacturing data are important. When we look at the SOL chart, since August 2, it has broken the consolidated area between 124.92 – 162.99 upwards in a voluminous way. The ceiling level in the consolidated area may be an important place to take a position on pullbacks. On our daily chart, the 50 EMA (Blue Line) seems to have found support from the 200 EMA (Black Line). This indicates that the trend will continue upwards. The ascending triangle pattern was broken. The 162.99 level, which is a strong resistance, may be broken by a bullish candle, signaling a possible continuation of the uptrend. Indeed, the divergence is noticeable with the Relative Strength Index (RSI) in the 14 overbought zone. This may cause a pullback in the price. If the positive results in macroeconomic data and positive developments in the ecosystem continue, the first major resistance level is 185.60. Profit sales due to the rise of BTC will also affect SOL. In this case, the 162.99 level can be followed and a buying point can be determined.
Supports 162.99 – 150.23 – 141.80
Resistances 170.05 – 173.58 – 185.60
ADA/USDT
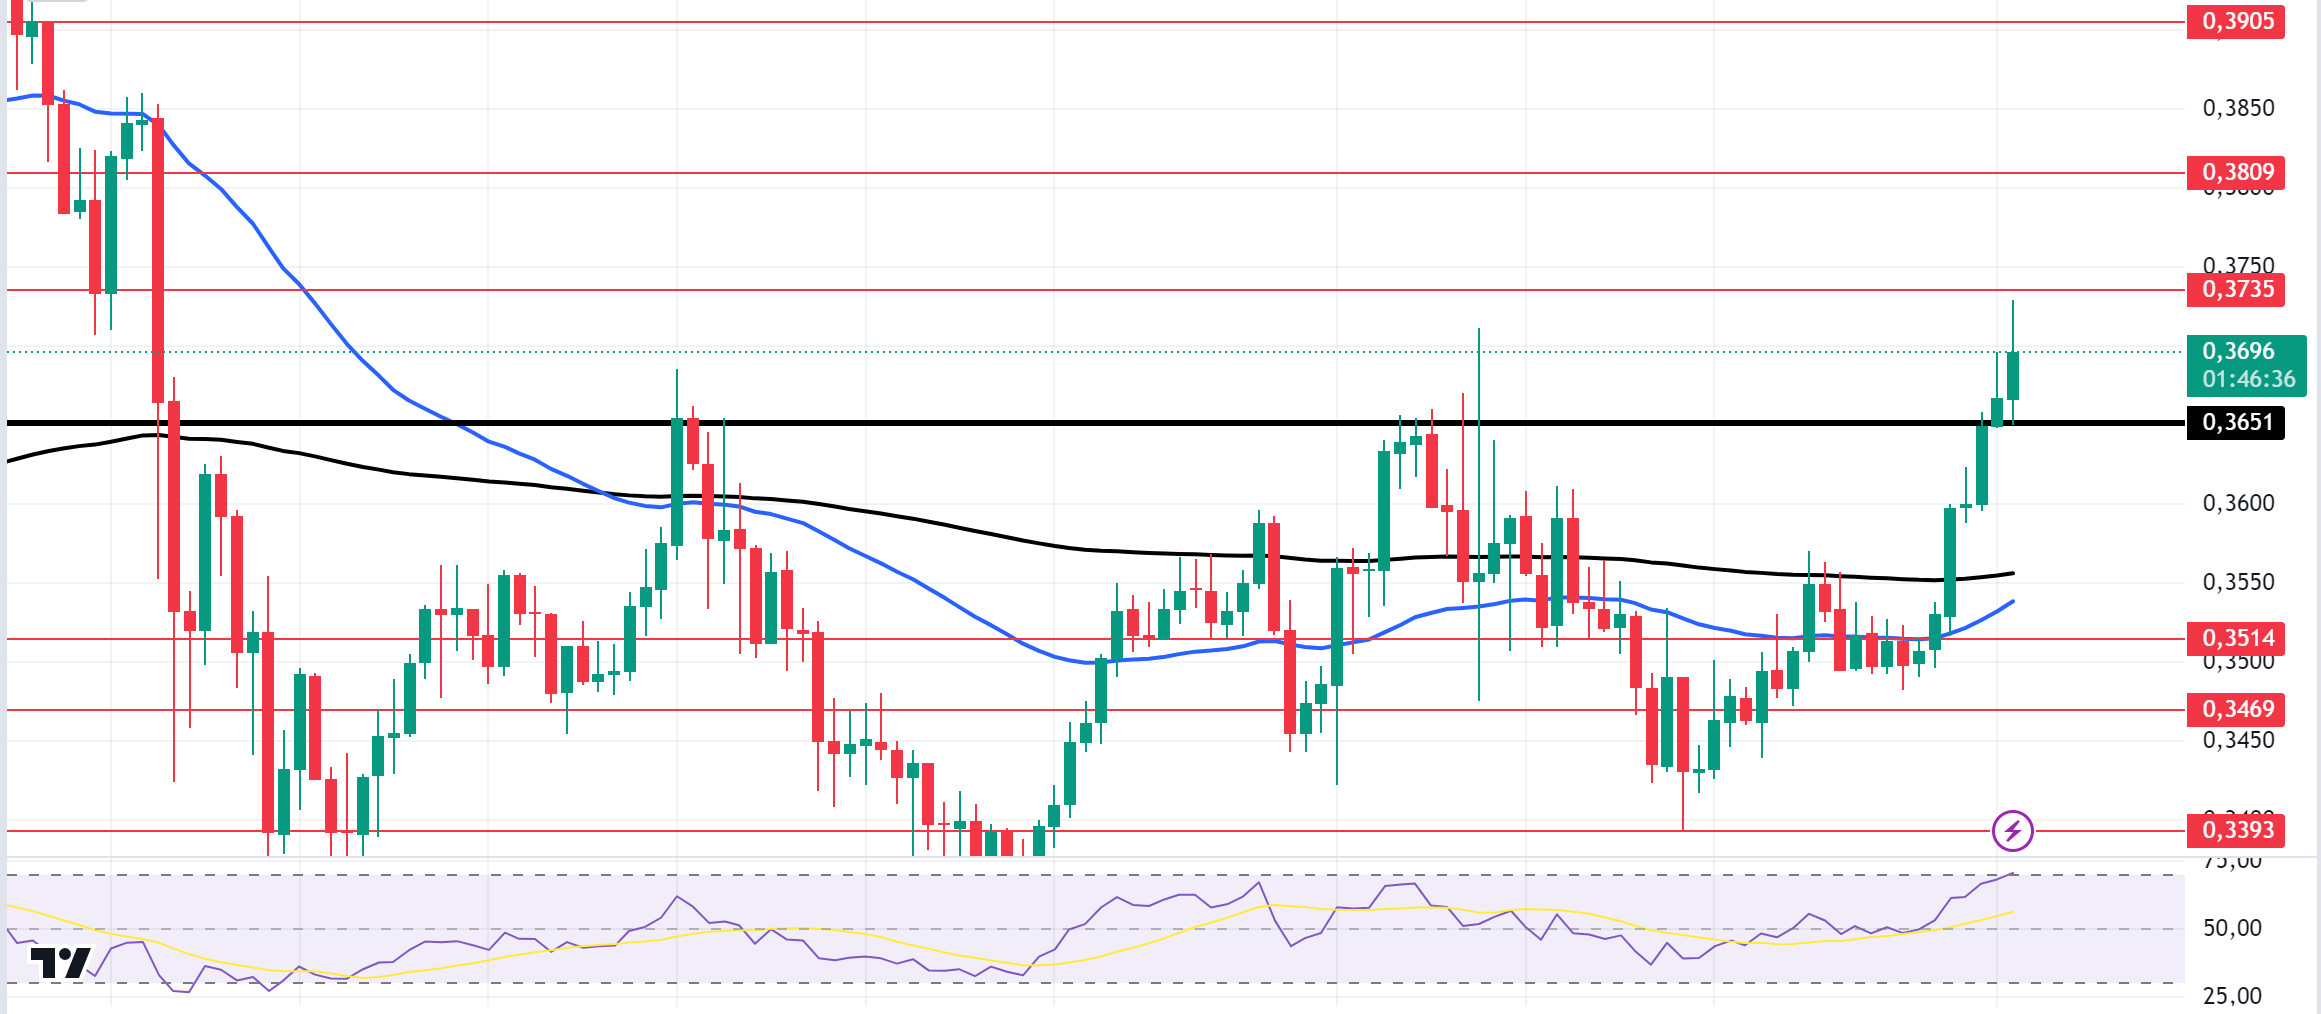
The American elections are approaching. According to data from Polymarket, Trump is ahead with 61.3%. According to data from CME, the probability of a 25 basis point rate cut is 90.2%. Last week, we witnessed a large inflow of stablecoins such as Tether (USDT) to centralized exchange platforms. Stablecoin inflows usually represent an increase in demand from retail investors. This is generally bullish for the market. On the other hand, US unemployment claims from America were highly anticipated. This met expectations with 241 thousand. Another data, retail sales data, came in better than expected. This is a development that greatly reduces the risk of recession. Cardano Founder Charles Hoskinson gave information about what the next upgrade for the network could be after the Ouroboros Peras protocol was announced. Hoskinson acknowledged that this potential upgrade was long overdue and added that it would “greatly improve” the Cardano network, hinting that the next network upgrade could revolve around changes to validation zones. Meanwhile, the 4th Annual Cardano Summit 2024 community event was held in Buenos Aires, Argentina, with Founder Charles Hoskinson in attendance. The event was attended by prominent members of the Cardano community and local crypto enthusiasts. Charles Hoskinson emphasized that cryptocurrencies emerged with a purpose. That purpose is to repair the crisis of trust that has erupted at all levels of global society. “Cryptocurrencies are not things you adopt because you trust and love the government. They are a response to the lack of trust and the economic crisis.” He points out that the failure of the system in general has led to a major crisis of trust, but he believes that blockchain will solve this problem. According to Santiment, the 30-day Market Value to Realized Value Ratio (MVRV) recently dropped below -5.72k. This indicates that most short-term investors are at a loss. This scenario usually attracts long-term buyers. Historically, when the MVRV ratio falls below -5%, it is seen as a buying opportunity by long-term investors. On the other hand, ADA’s supply in general circulation increased by 0.24% to over 35.72 billion, which accounts for an estimated 79.39% of its maximum supply of 45 billion. Among the data to follow this week, US SEC Chairman Gensler’s speech and manufacturing data are important. ADA has lost about 3.14% since last week. Since August 24, ADA, which has been accumulating since August 24, may break out of this cycle if the general market moves positively. Looking at the daily chart, the 50 EMA (Blue Line) remains below the 200 EMA (Black Line). This shows that there is still a downtrend. On the other hand, it started to rise with support from the base level of the symmetrical triangle pattern. If the uptrend continues, the 200 EMA strength appears as a place of resistance. In case of possible macroeconomic conditions and negative developments in the Cardano ecosystem and the continuation of the downtrend, it can be priced up to 0.3397.
Suppors 0.3569 – 0.3397 – 0.3206
Resistances 0.3787 – 0.3875 – 0.4190
AVAX/USDT
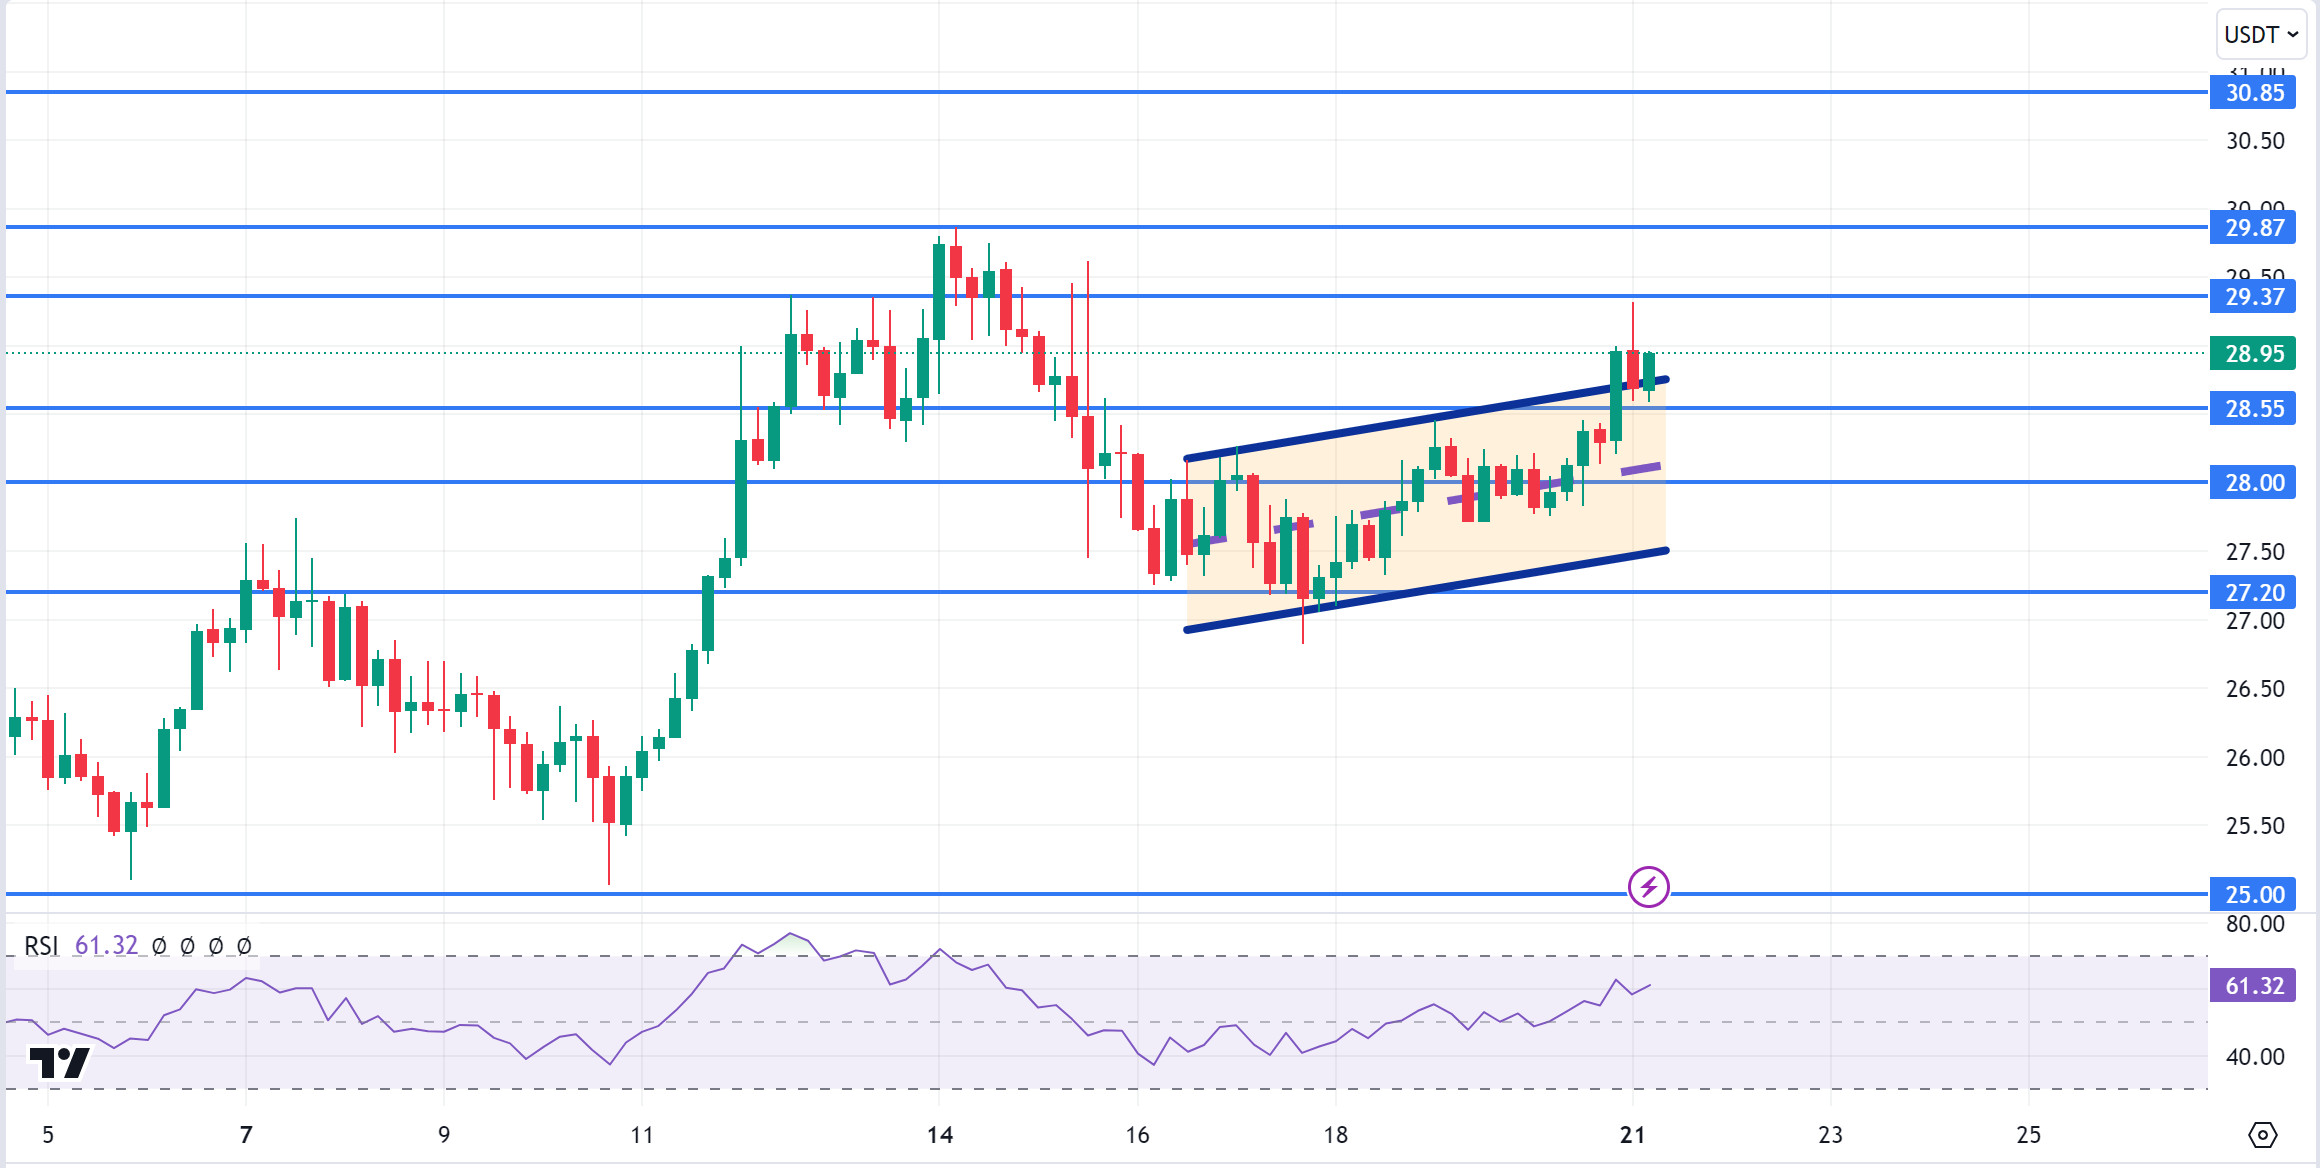
AVAX, which started the previous week at 29.07, fell slightly during the week and closed the week at 28.96. This week, data on second-hand home sales, applications for unemployment benefits, manufacturing purchasing managers index, services purchasing managers index and new home sales will be announced in the US. The market will continue to search for direction according to these data and news from the Middle East. This data will also affect the market and AVAX. High volatility may occur in the market during and after the data release.
AVAX, which is currently trading at 28.30 and continues its movement within the rising trend on the daily chart, may break the upper band of the channel upwards with the positive perception of the upcoming data by the market. In such a case, it may test the 29.51 and 30.55 resistances. Especially with the candle closure above 30.55 resistance, its rise may accelerate. With the reaction from the upper band of the channel and selling pressure, it may move towards the middle and lower band of the channel and test the supports of 27.99 and 26.29. As long as there is no candle closure below 19.79 support on the daily chart, the upward appetite may continue. The decline may deepen with the candle closure below this support.
Supports 27.99 – 26.29 – 24.83
Resistances 29.51 – 30.55 – 31.92
TRX/USDT
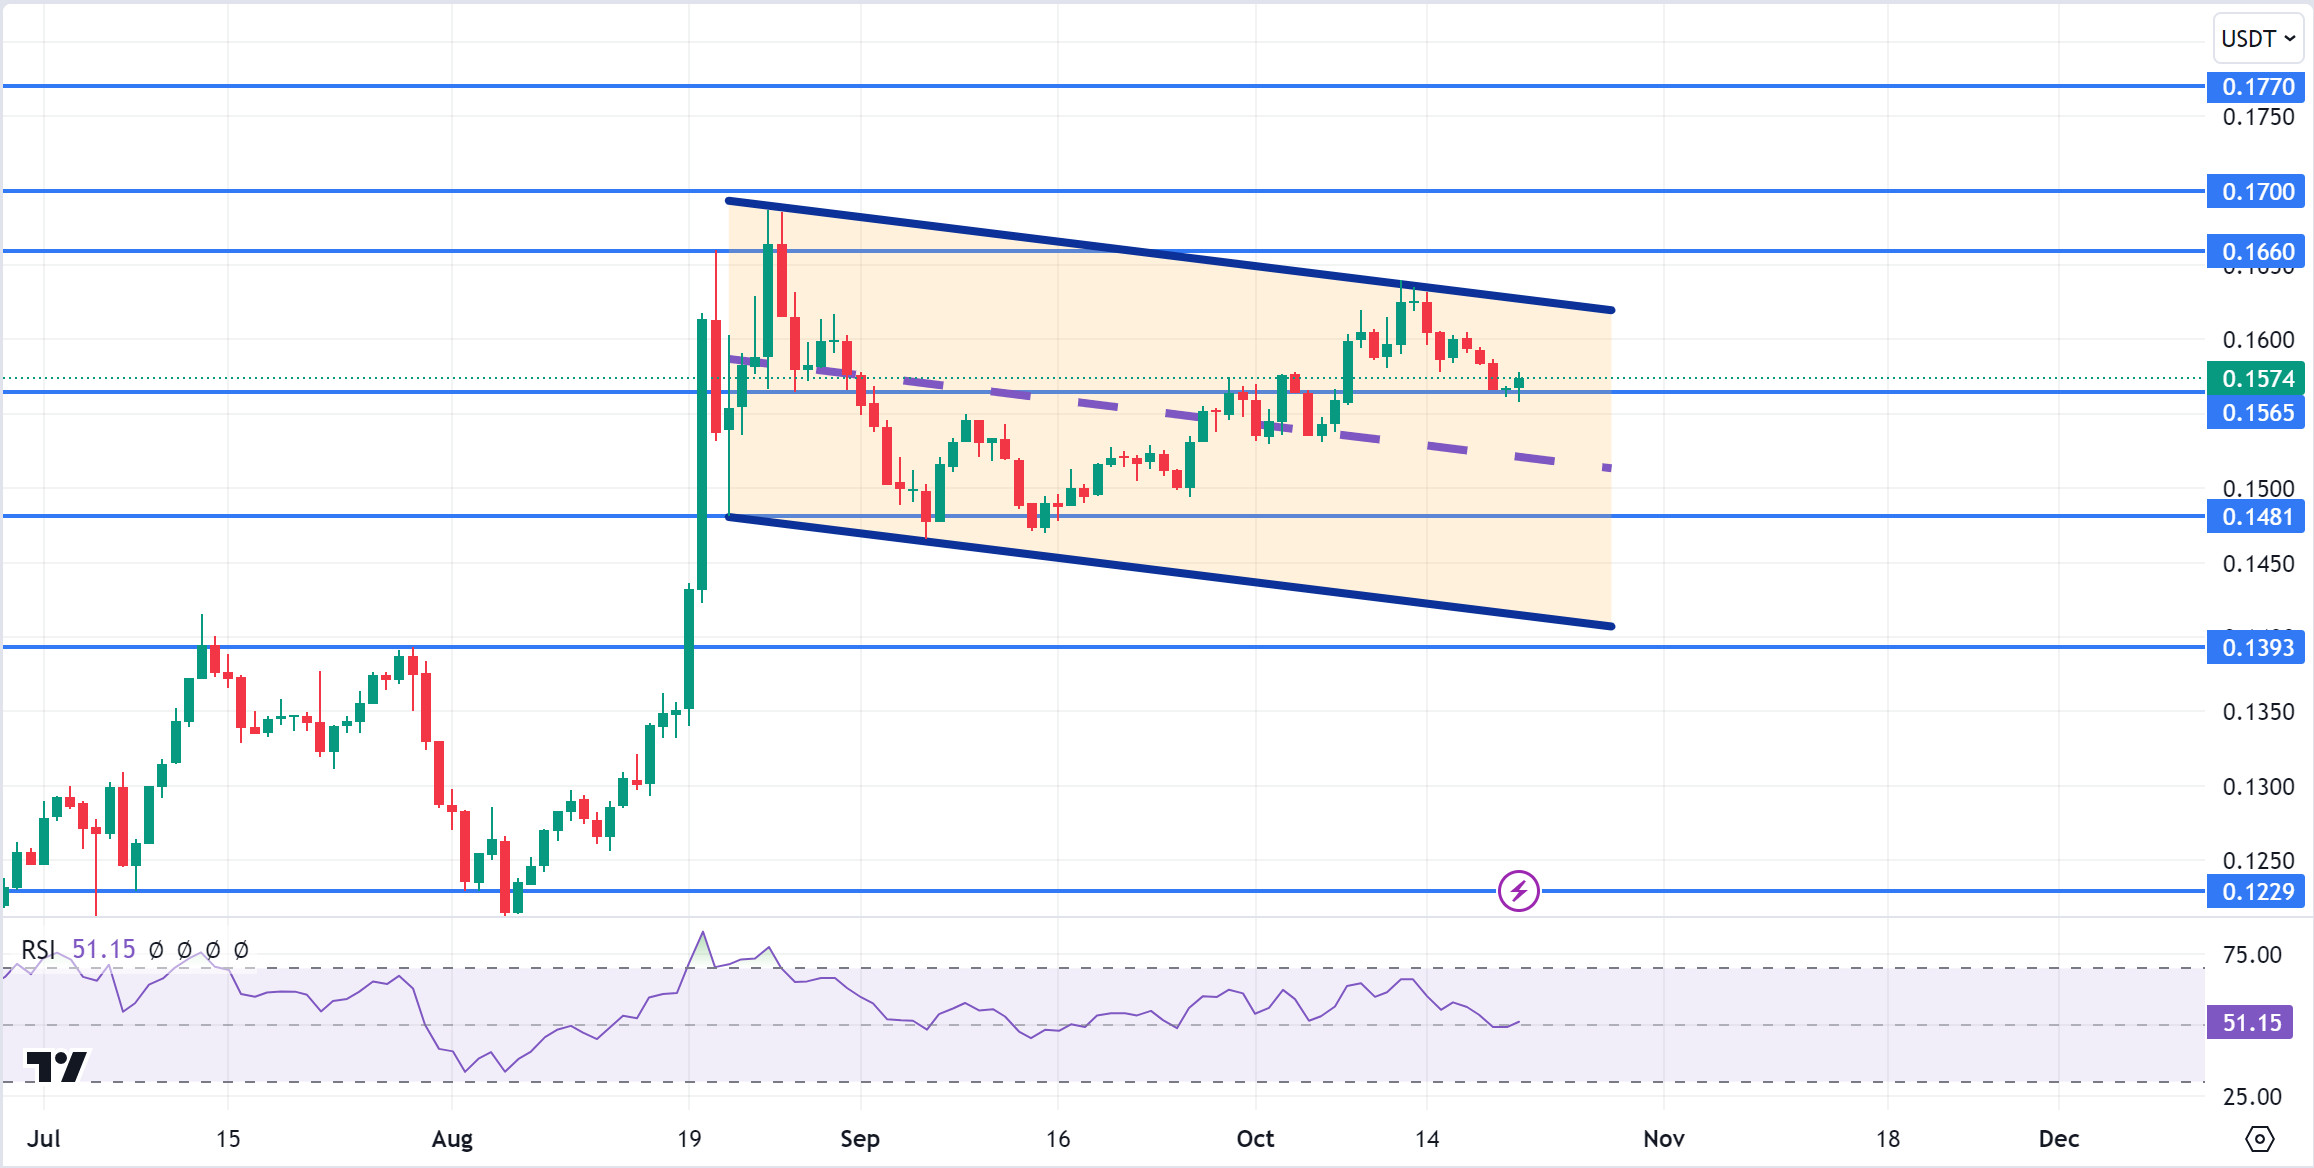
TRX, which started last week at 0.1625, fell about 3.5% during the week and closed the week at 0.1567.
This week in the US, second-hand home sales, applications for unemployment benefits, manufacturing purchasing managers index, services purchasing managers index and new home sales data will be announced. These data are important to affect the market and the data to be announced in line with expectations may have a positive impact.
TRX, which is currently trading at 0.1574 and moving in a downtrend on the daily chart, is in the upper band of the trend. With the RSI value of 51, it can be expected to decline slightly from its current level and move to the middle band of the trend. In such a case, it may test the 0.1565 support. If it cannot break the 0.1565 support and rises with the next buying reaction, it may want to test the 0.1660 resistance. On the daily chart, the bullish demand may continue as long as it stays above 0.1229 support. If this support is broken, selling pressure may increase.
Supports 0.1565 – 0.1481 – 0.1393
Resistances 0.1660 – 0.1700 – 0.1770
XRP/USDT
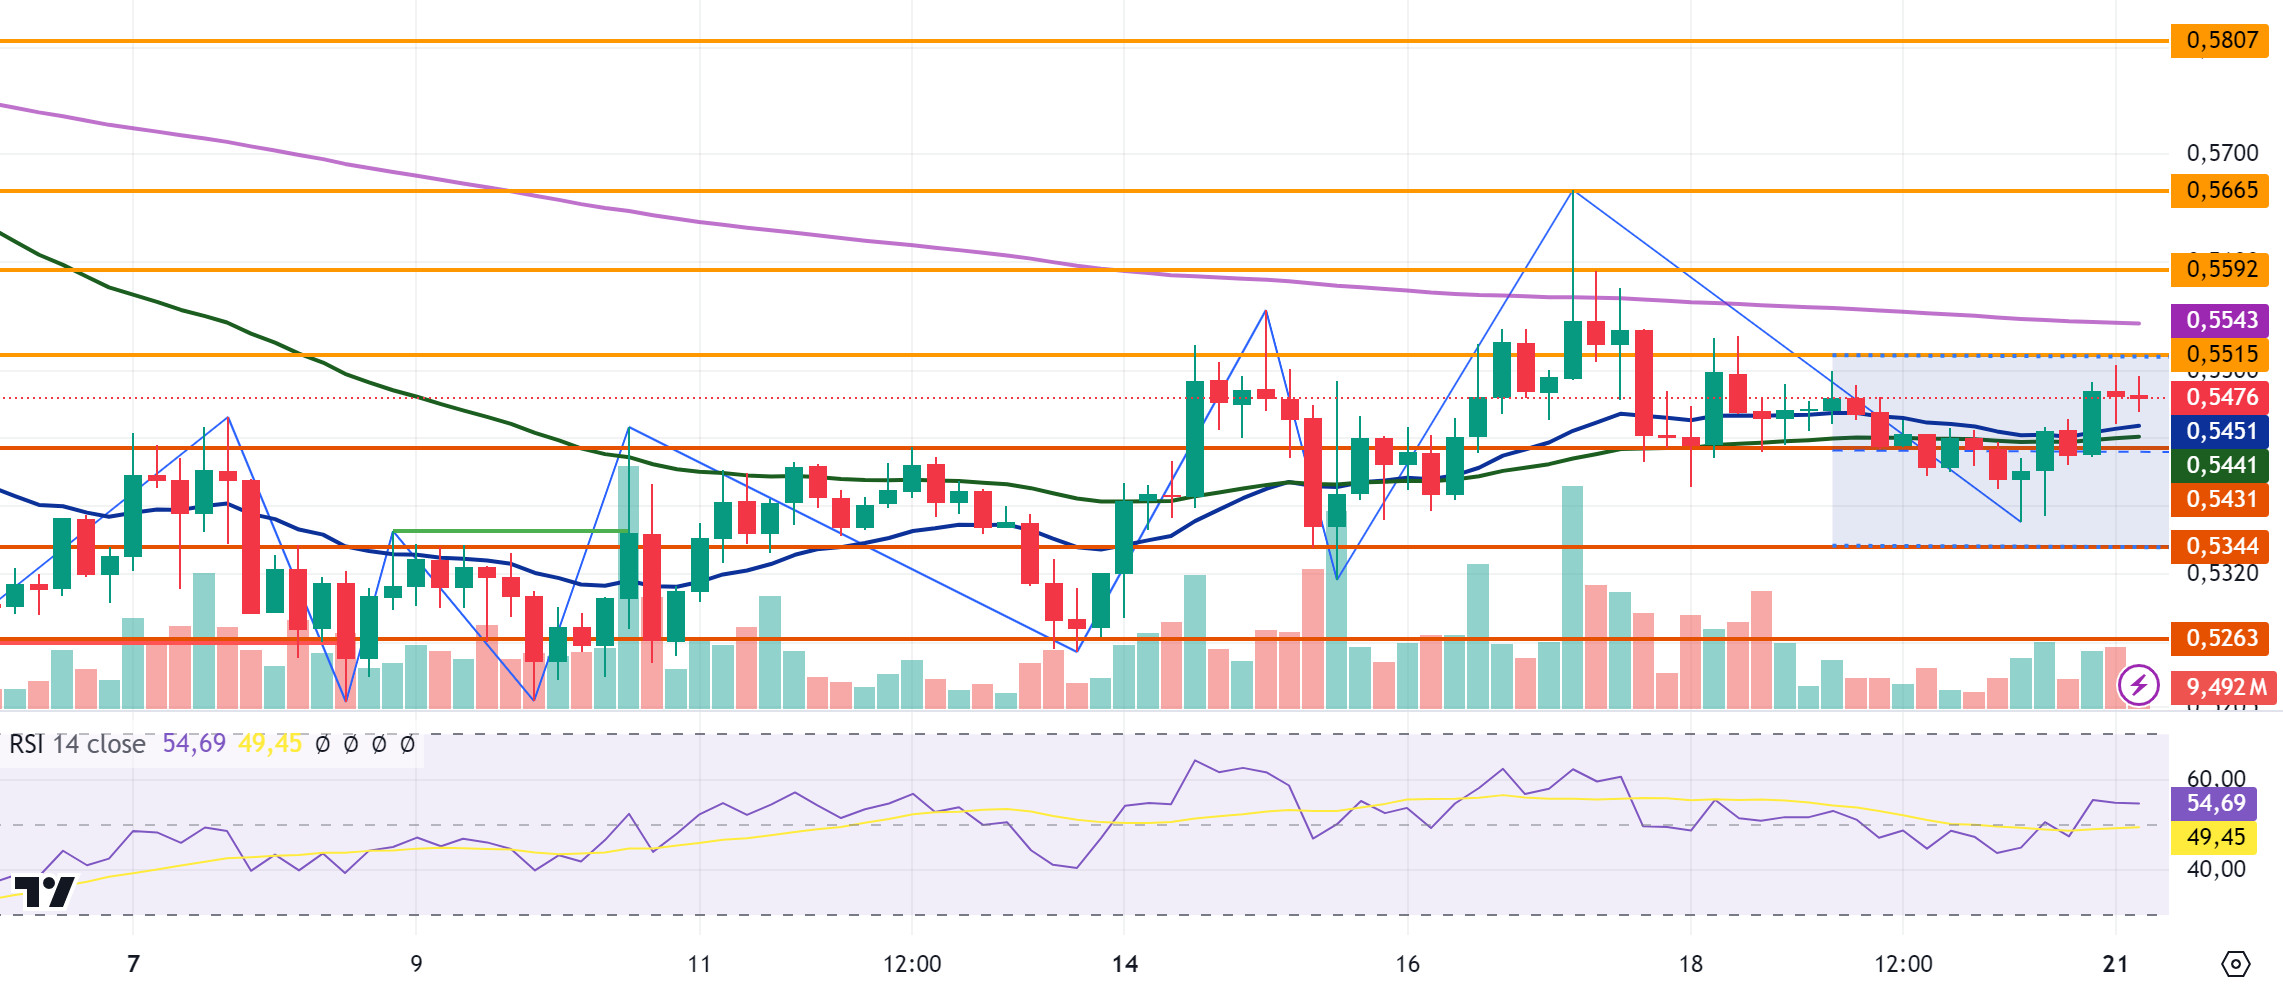
XRP, which started last week at 0.5279, continued to trade in a horizontal band after rising to 0.5484 on the opening day last week. XRP is currently trading at 0.5491. XRP, which is traded below the exponential moving average (EMA) levels in daily analysis, fell with sales at the EMA200 level in its rise. On daily analysis, the Relative Strength Index (RSI) value is in the neutral zone. XRP, which is traded in a horizontal band after falling between 0.52 and 0.55 levels after the SEC’s appeal, may rise with the effect of the crypto market in an uptrend and test the resistance levels of 0.5555-0.5790-0.6076 with its rise. New XRP ETF applications that may come in this process may also cause an increase. In case of a decline with possible negative developments, XRP may test 0.5205-0.4987-0.4751 support levels with its decline.
If XRP closes above the EMA levels with its rise, it may continue its rise and offer a long trading opportunity thanks to the positive environment that may occur. It may decline with the sales that may come at the 0.60 level and may offer a short trading opportunity. In its decline, the levels of 0.50 and 0.51 come to the fore and may rise with the purchases that may come from these levels and may offer a long trading opportunity.
EMA50 (Green Line) – EMA200 (Purple Line)
Supports 0. 5205 – 0. 4987 – 0.4751
Resistances 0.5555 – 0. 5790 – 0.6076
DOGE/USDT
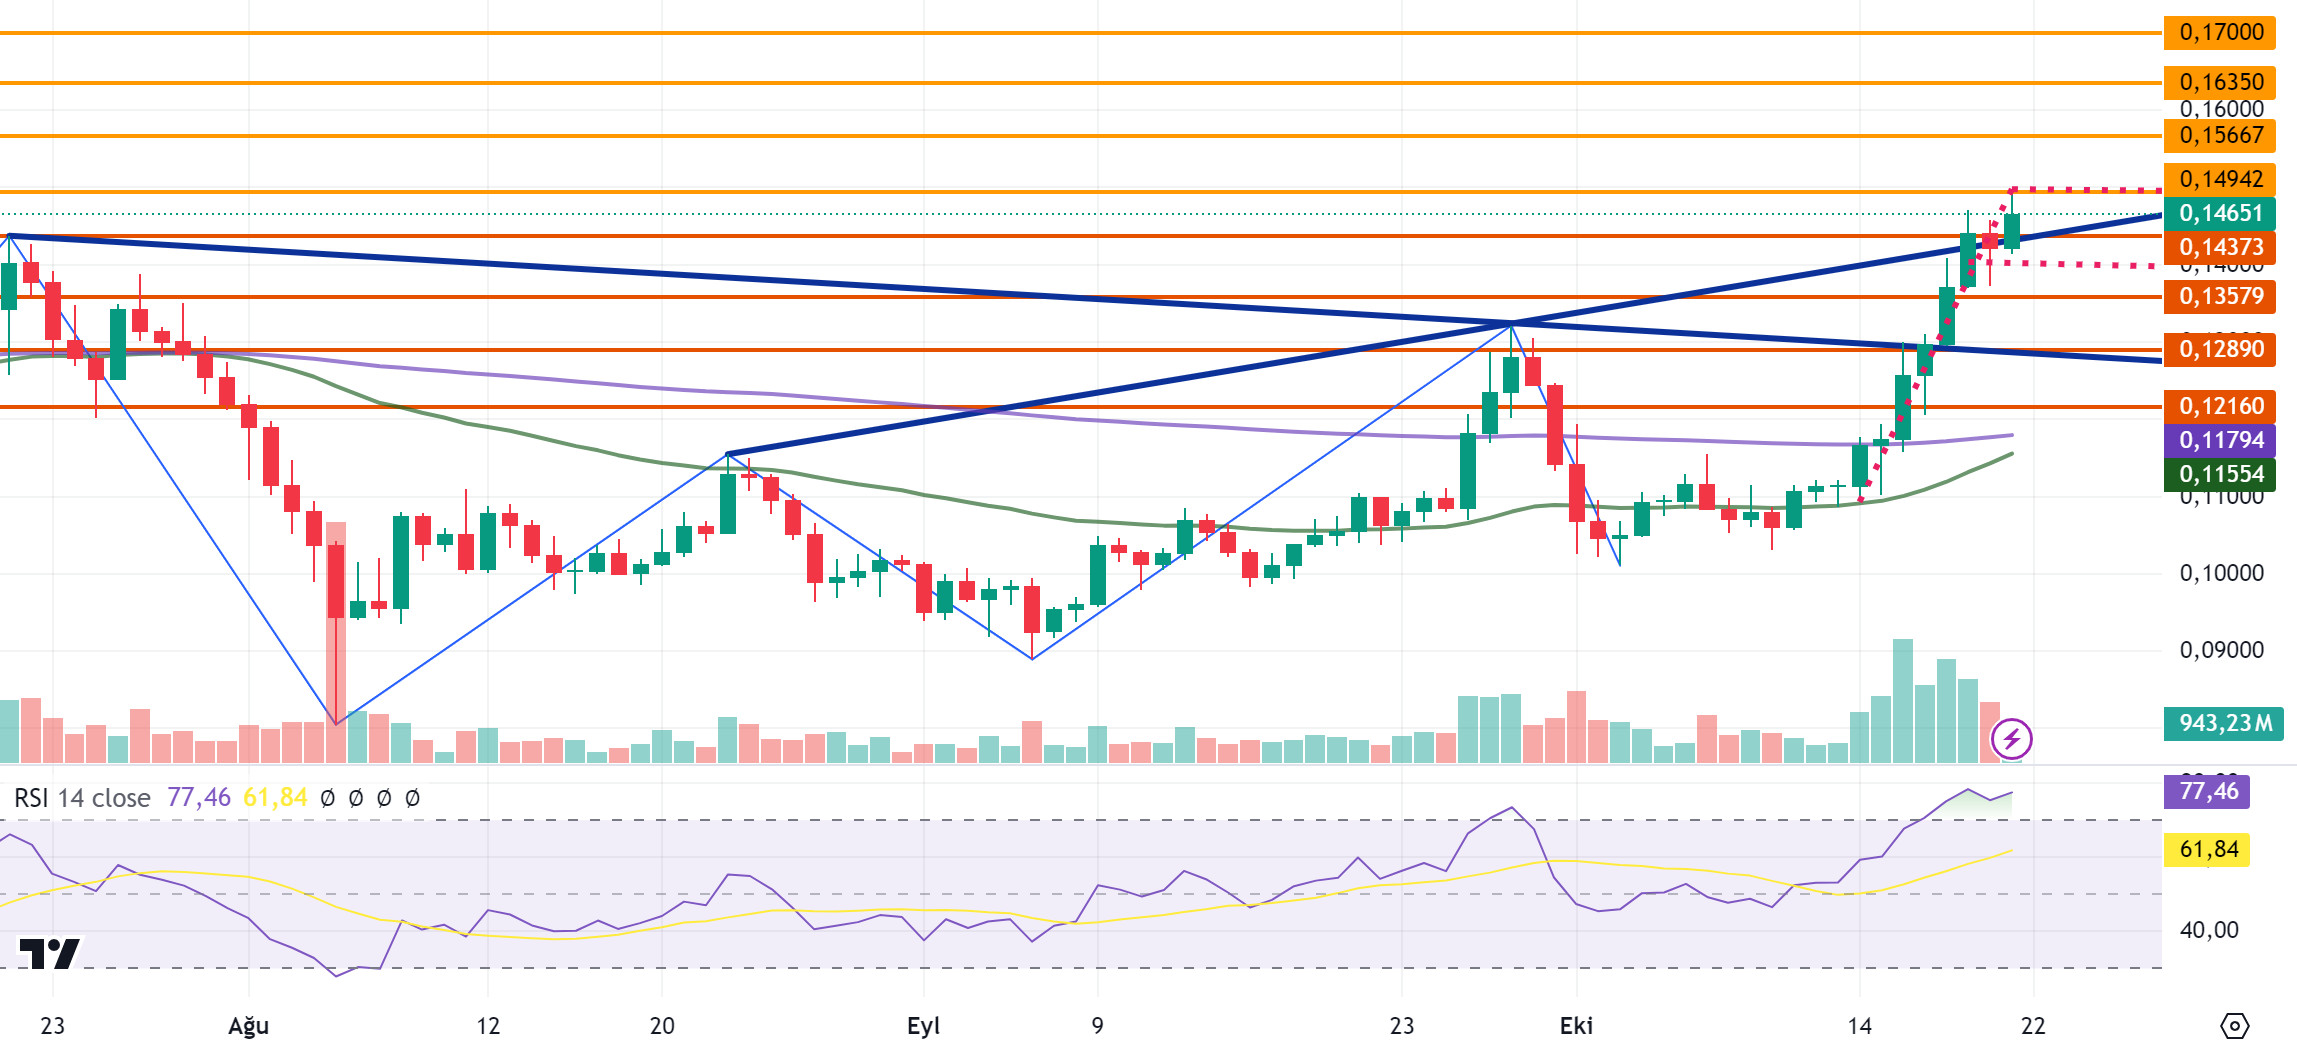
DOGE rallied last week with buying at the 50-period exponential moving average (EMA50) and closed the week at 0.1421 with an increase of about 28%. In daily analysis, DOGE, which started the new week with an increase, continues to trade at 0.1465 with an increase of approximately 3% today. The crypto market is in an uptrend and DOGE, which moves in parallel with the market, continues to rise. Large purchases occurred last week in DOGE, which was trading above the EMA levels with its rise. This created the perception in the market that the uptrend for memecoins has begun and DOGE coin is leading the way.
In the daily analysis, DOGE broke the downtrend in the 3-month period and is trading above the uptrend. In daily analysis, DOGE may realize the flag pattern. In case the flag pattern is realized upwards, DOGE can test and break the resistance levels of 0.1494-0.1566-0.1635 with its rise. The Relative Strength Index (RSI) value is 77.46 and is in the overbought zone. Sales may come based on this data. With the possible sales, DOGE may decline and if the decline deepens, it may test the support levels of 0.1437-0.1357-0.1289.
If DOGE declines, it may rise with purchases at 0.125 to 0.135 levels and may offer a long trading opportunity. In its rise, it may decline with possible sales at 0.15 and 0.155 levels and may offer a short trading opportunity.
EMA50 (Green Line) – EMA200 (Purple Line)
Supports 0.1437 – 0.1357 – 0.1289
Resistances 0.1 494 – 0.1566 – 0.1635
DOT/USDT
Polkadot spent 5.1 million DOT in the third quarter of 2024, increasing its treasury balance to $150 million. Focusing on DeFi investments and development, Polkadot aims to keep its spending at DOT 4.5 million in the future. This financial discipline has contributed to Polkadot’s positive outlook in the market. In addition, at the sub0 reset conference in Bangkok on November 9-11, 2024 in Bangkok, Web3 developers and community will come together to work on innovative projects for the Polkadot ecosystem and presentations on Substrate’s new projects.
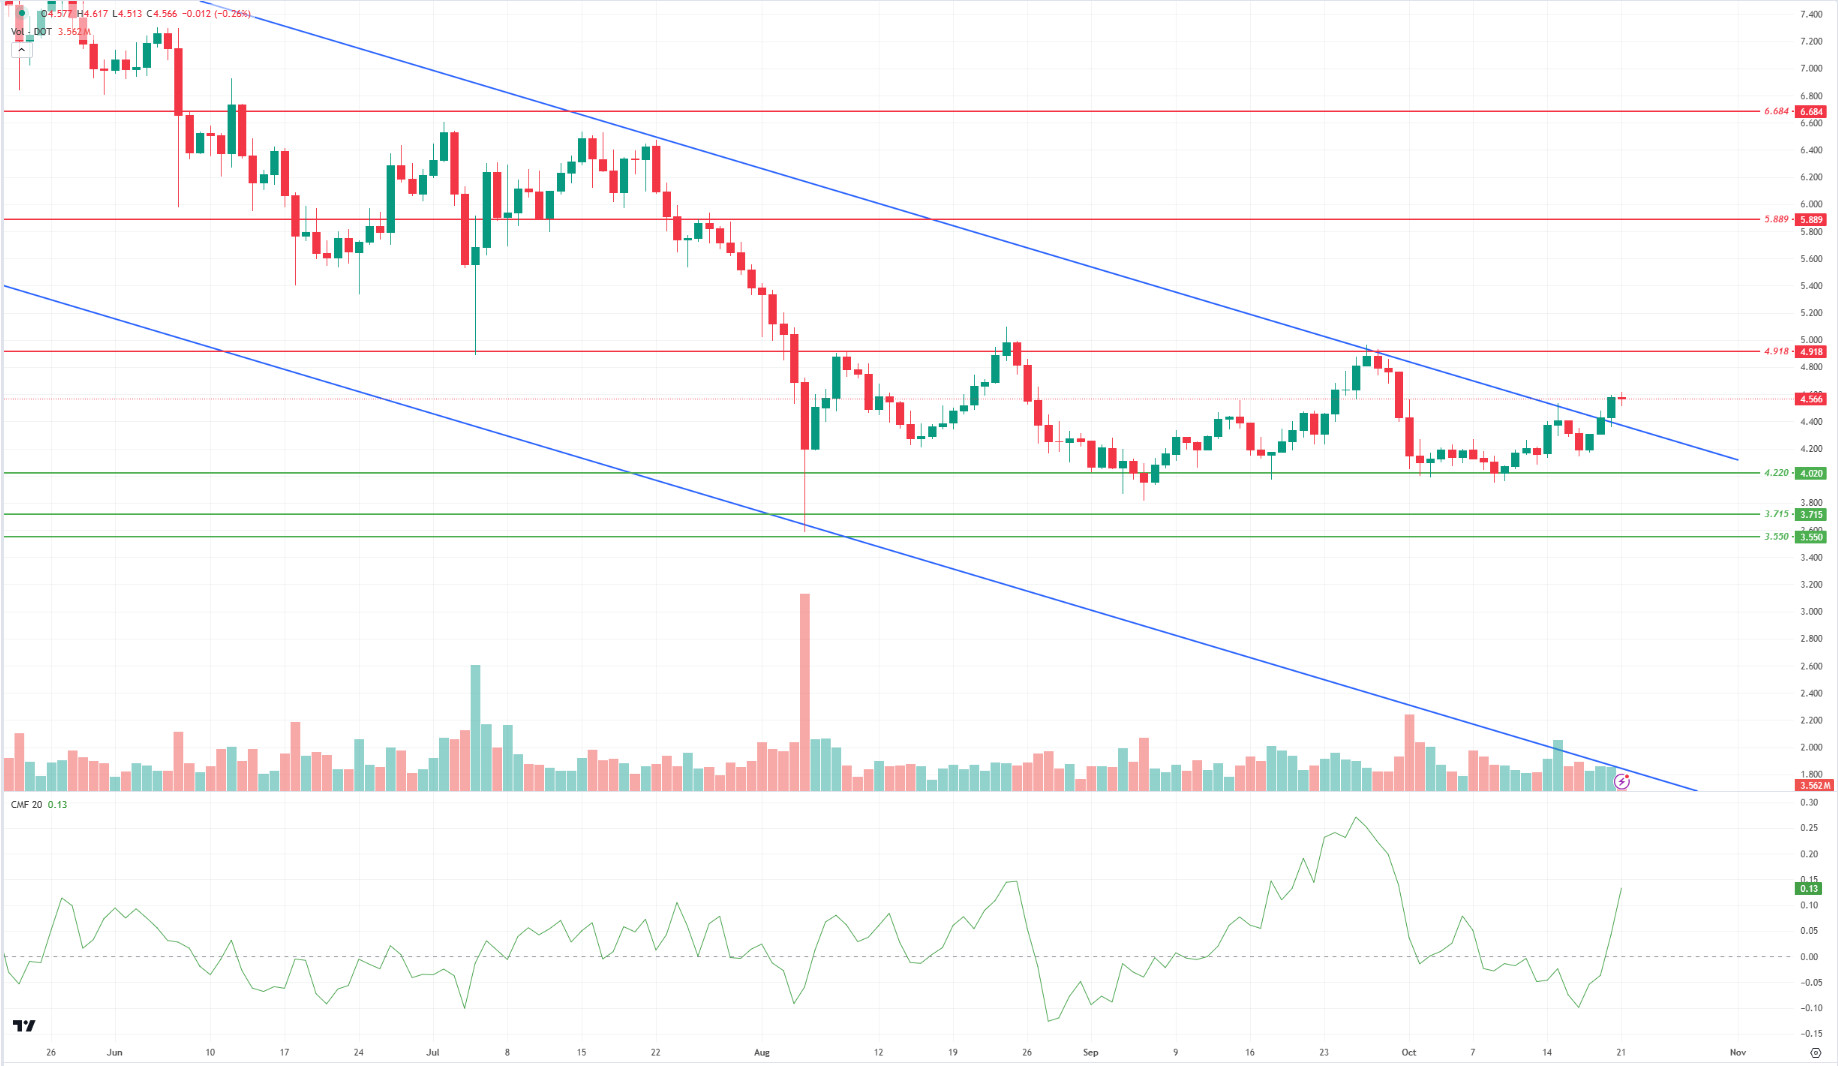
When we examine the daily chart of Polkadot (DOT), we see that the price broke the downtrend upwards. When we examine the Chaikin Money Flow (CMF) oscillator, we see that the buyer pressure is stronger. In this context, the price may want to break the selling pressure at the 4.918 resistance level. On the other hand, if the seller pressure rises, the 4.220 support level may be tested again.
Supports 4,220 – 3,715 – 3,550
Resistances 4.918 – 5.889 – 6.684
 SHIB/USDT
Shytoshi Kusama, lead developer of Shiba Inu, warned against fraud allegations against SHIB billionaire wallets and suggested that wallet holders transfer a certain amount of SHIB to verify ownership. The SHIB team announced a new partnership with Mass Build, a provider of AI-powered financial solutions. This collaboration coincided with a surge in the price of SHIB. SHIB’s burn rate increased by 14.575%, with 279 million tokens removed from circulation. Whale activity on SHIB has decreased significantly recently, while it was announced that the Shib Doggy DAO Foundation will be launched in late 2024 or 2025.
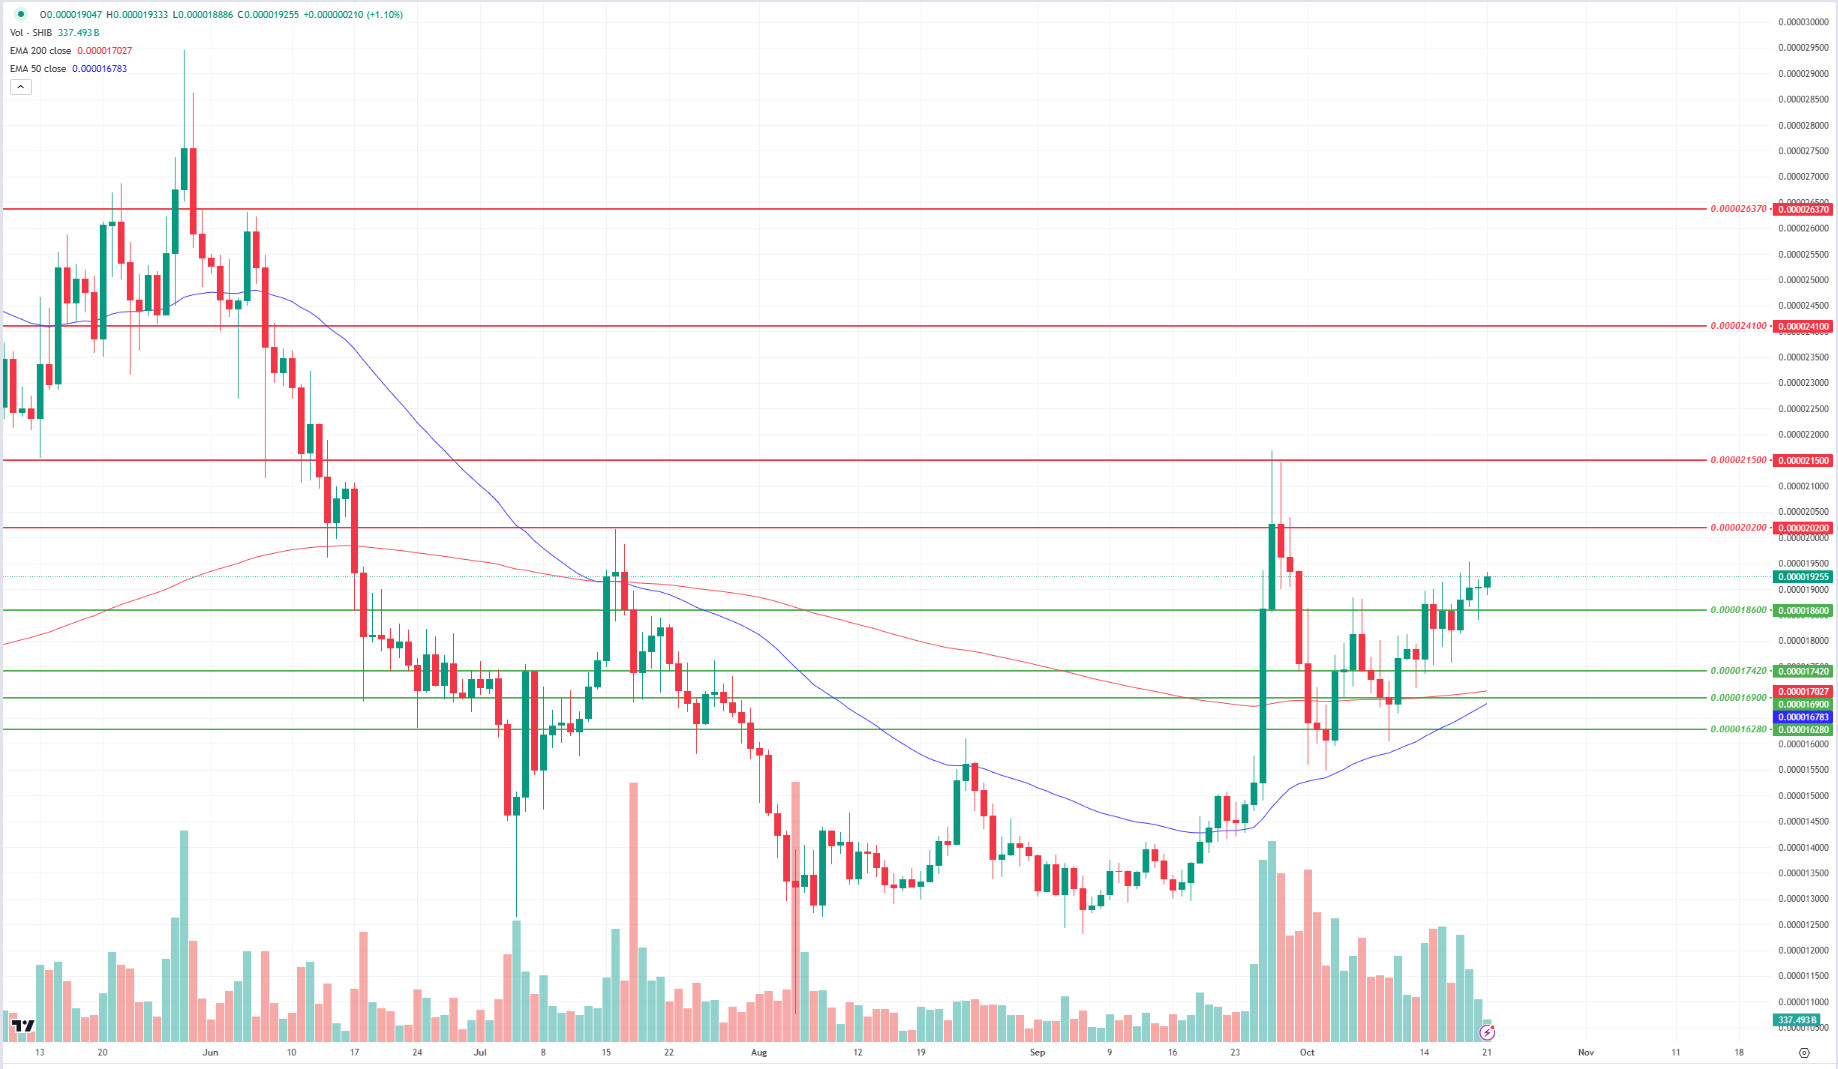
When we examine the chart of Shiba Inu (SHIB), we see that the price has achieved permanence above the 0.00001860 level with the reaction from the 0.00001742 support level. The EMA50 line (Blue Line) is preparing to break the EMA200 line (Red Line) upwards. In case of this breakout (Golden Cross), the price may move towards the 0.00002020 resistance level. On the other hand, if the price stays below the 0.00001860 level, it might want to retest the 0.00001742 support level.
Supports 0.00001860 – 0.00001742 – 0.00001690
Resistances 0.00002020 – 0.00002150 – 0.00002410
LEGAL NOTICE
The investment information, comments and recommendations contained in this document do not constitute investment advisory services. Investment advisory services are provided by authorized institutions on a personal basis, taking into account the risk and return preferences of individuals. The comments and recommendations contained in this document are of a general type. These recommendations may not be suitable for your financial situation and risk and return preferences. Therefore, making an investment decision based solely on the information contained in this document may not result in results that are in line with your expectations.


