
Weekly Bitcoin Onchain Report
Active Addresses
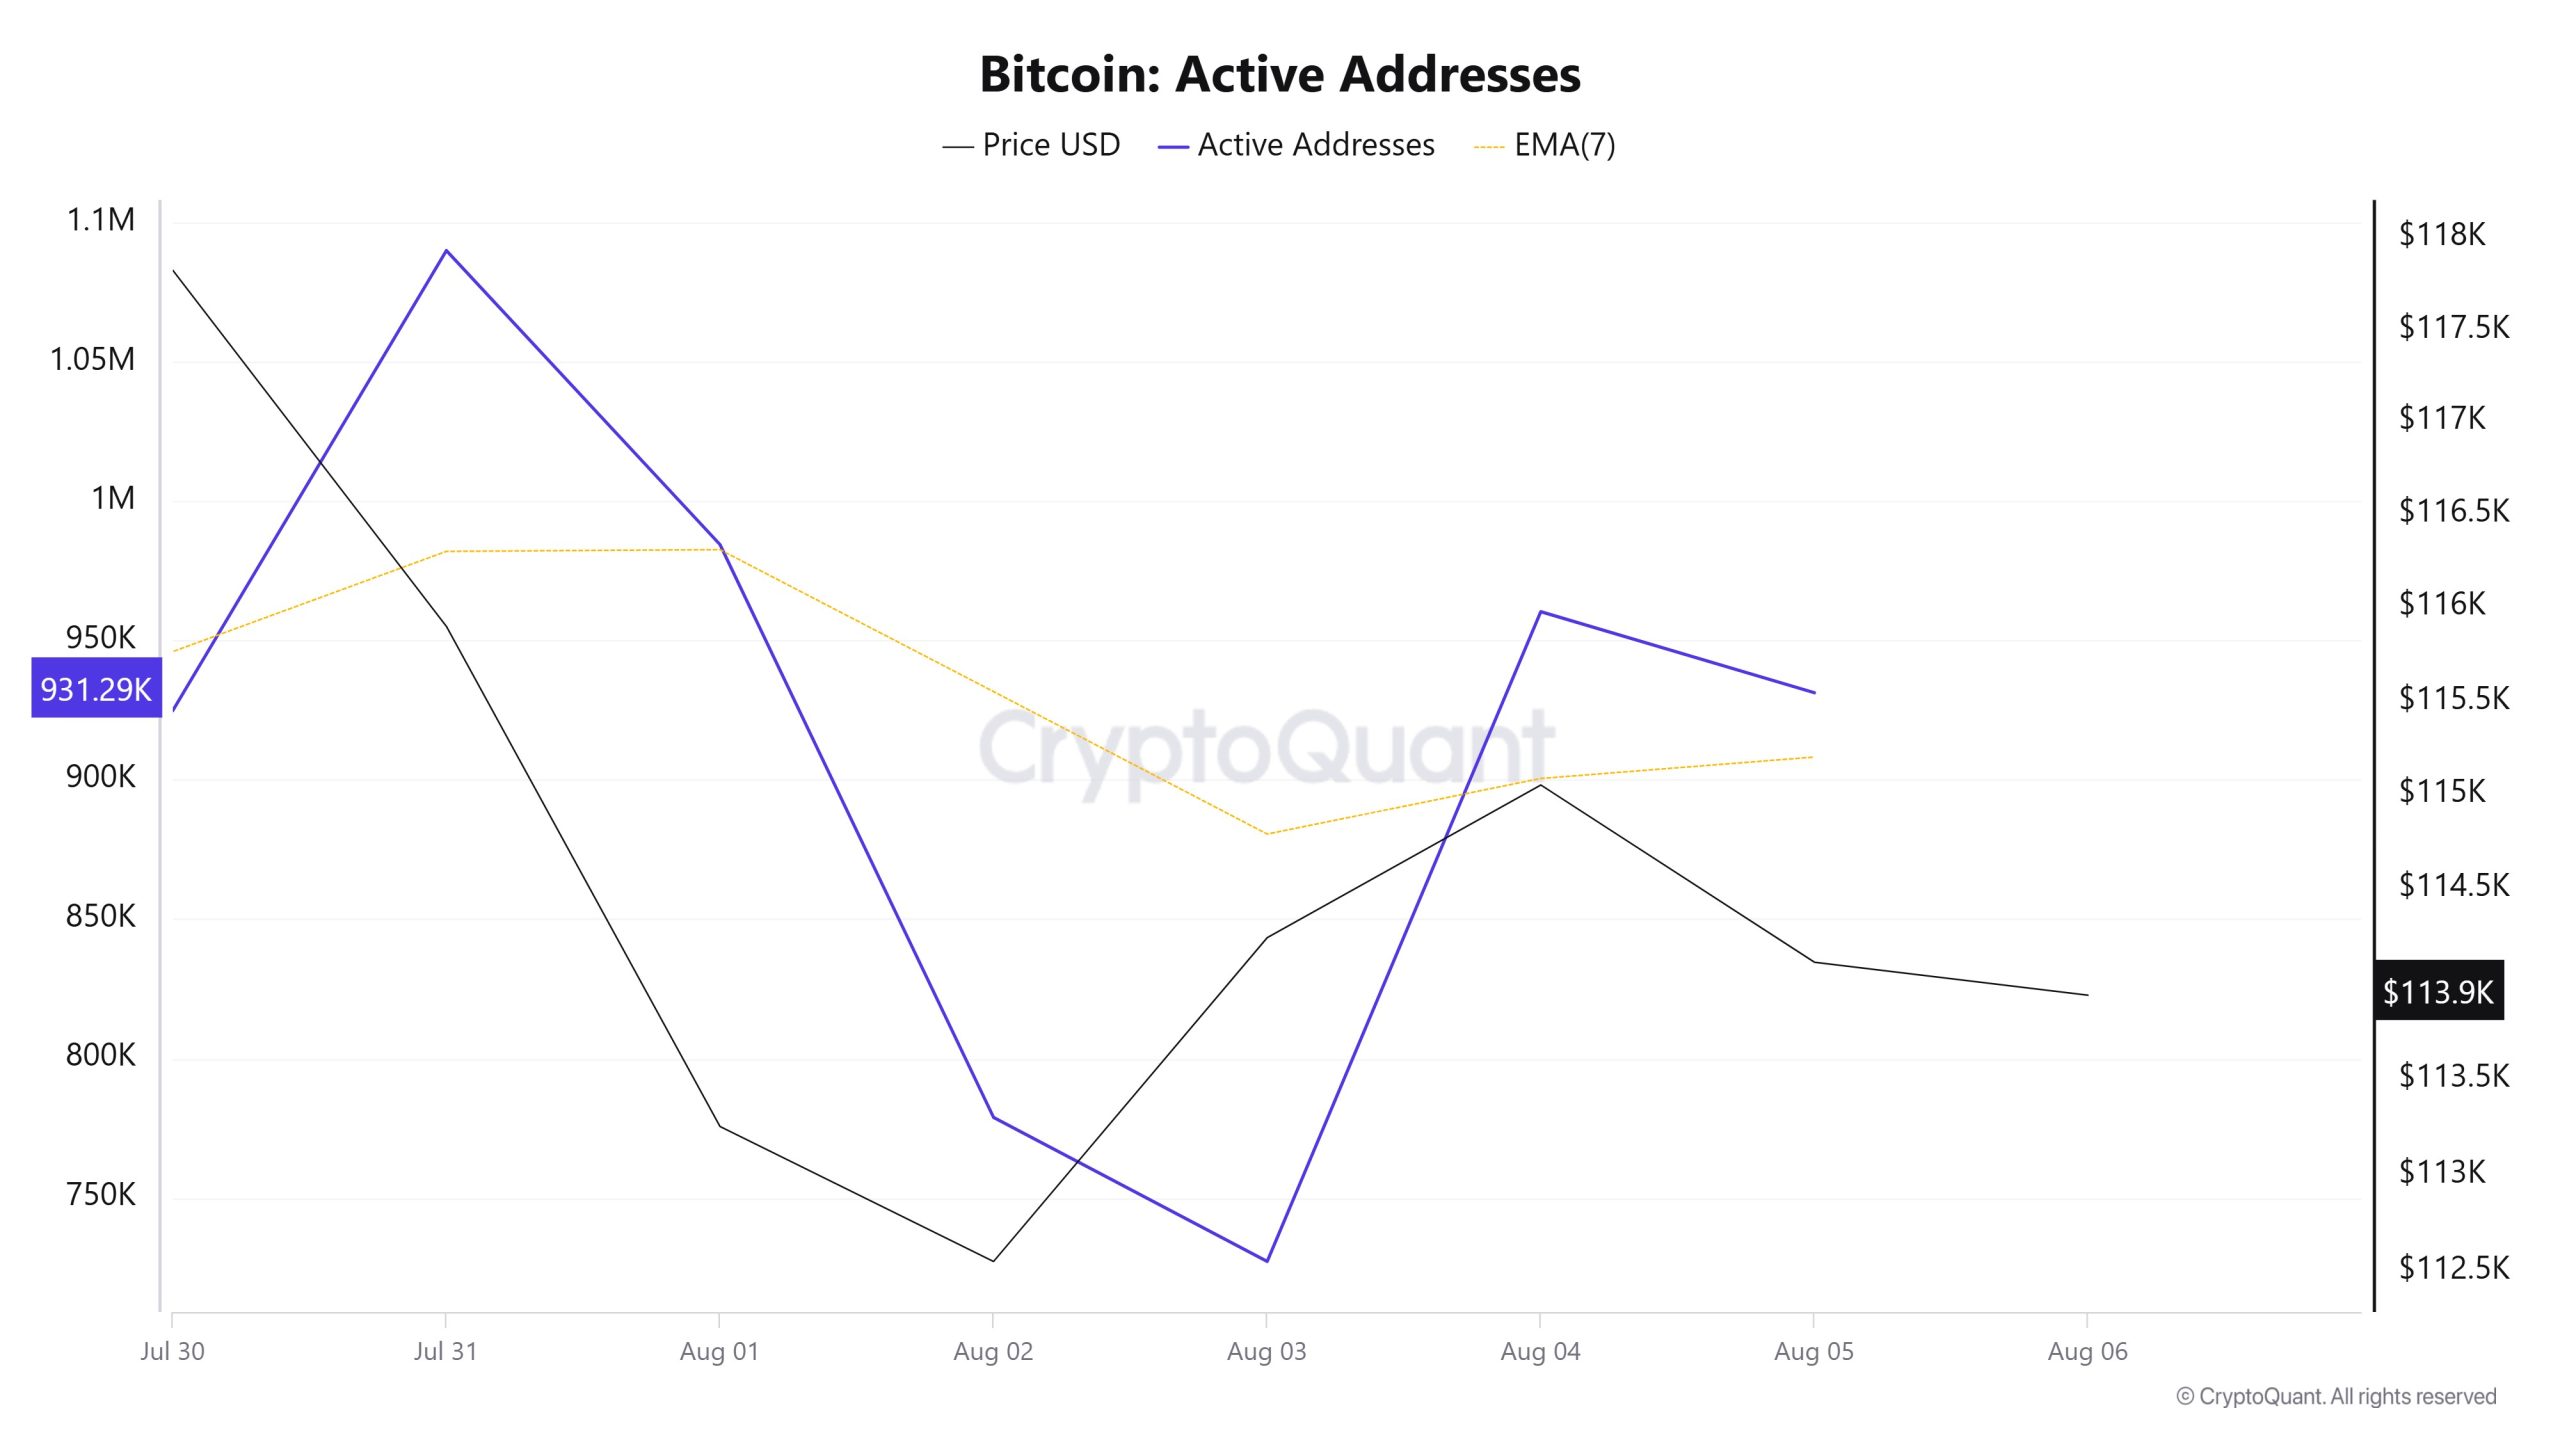
Between July 30 and August 6, 1,090,085 active addresses entered the Bitcoin network. In this process, the Bitcoin price rose up to $ 115,000. Especially on July 31, the rise in the number of active addresses was observed to move the price towards $ 115,000. From a technical perspective, it is noteworthy that downward movements were experienced at the point where the 7-day simple moving average (SMA) intersected with the price on August 1. This technical signal indicates selling pressure on the market.
Active Sending Addresses
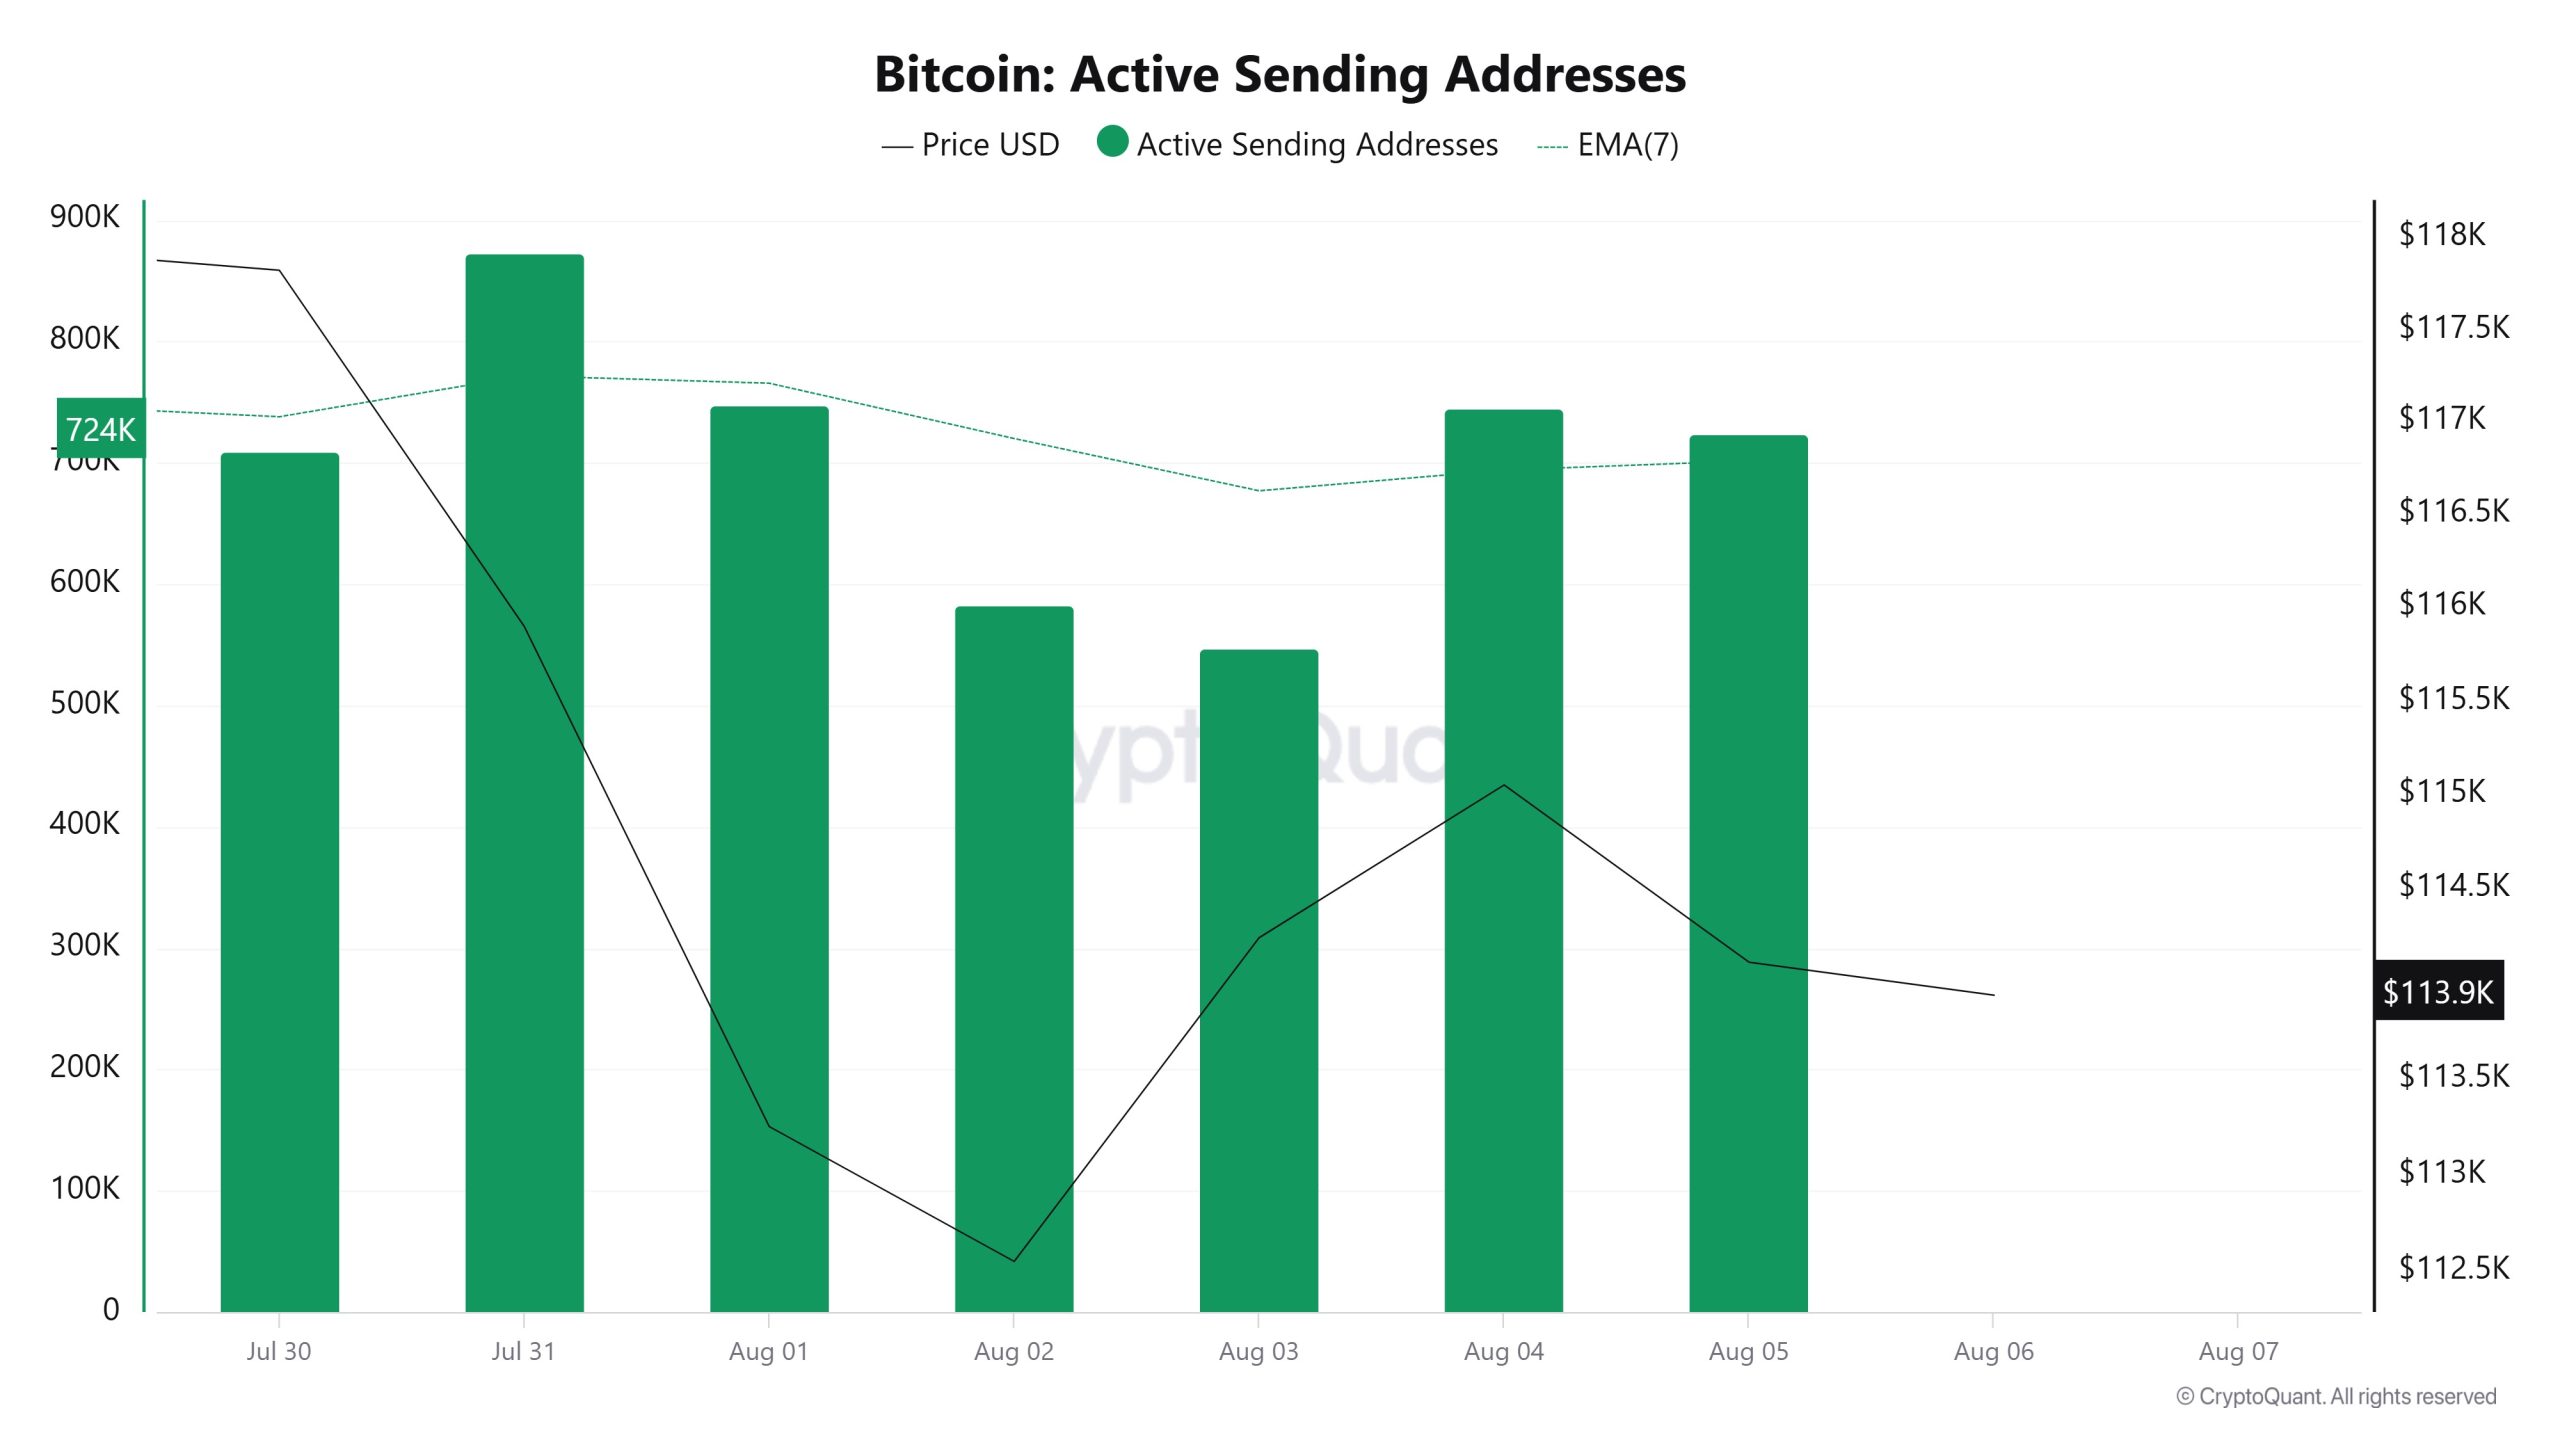
Between July 30 and August 6, an upward trend was observed in the “Active Sending Addresses” metric. On the day of the price peak, this metric rose as high as 872,903, indicating that user activity on the Bitcoin network is increasing in parallel with the price.
This data suggests that the $117,000 peak is supported not only by price, but also by on-chain address activity. Overall, the Active Sending Addresses metric has trended up and down during this period.
Active Receiving Addresses
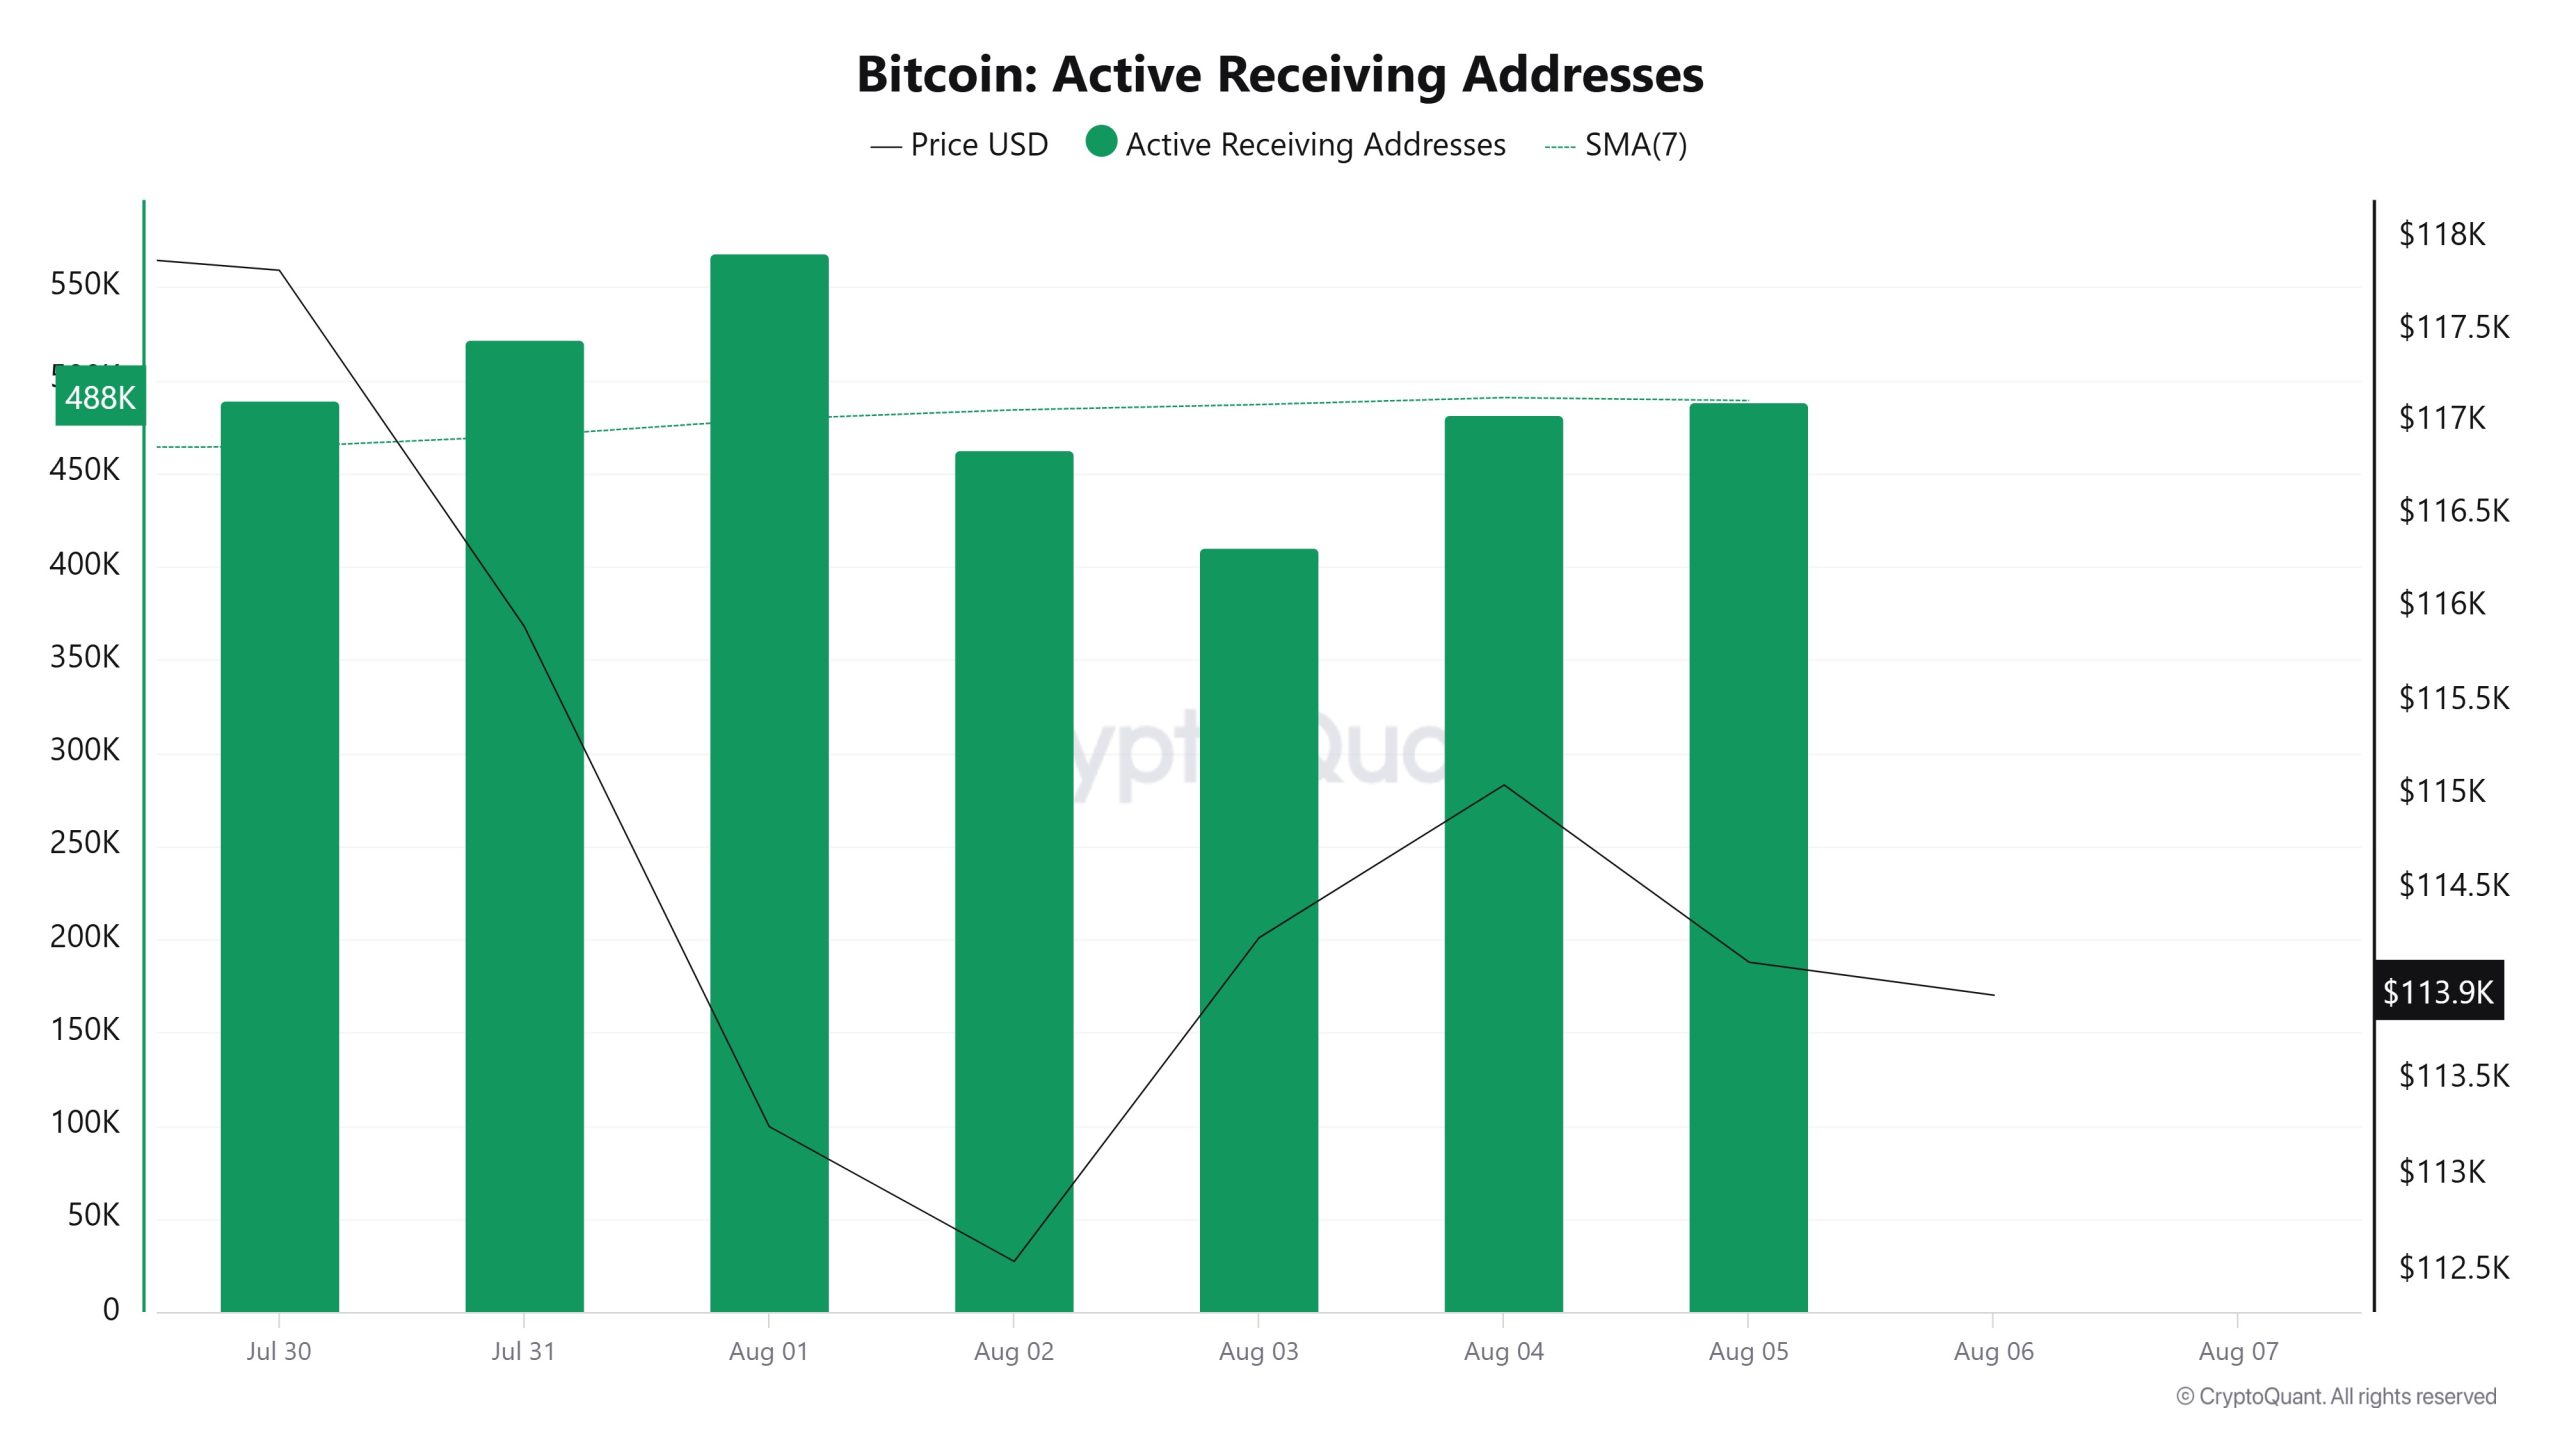
Between July 30 and August 6, a total of 493,077 active addresses entered the Ethereum network. During this period, the Ethereum price rose from $3,497 to $3,703. Especially on July 31, at the intersection of the price and the number of active addresses, there was a significant decrease in the number of active addresses while the price continued to rise. This suggests that despite the price increase in the following days, short-term participation decreased and was probably dominated by trades among existing investors. When the 7-day simple moving average (SMA) is analyzed, it is seen that a general upward trend is dominant in the Ethereum price.
Breakdowns
MRVR
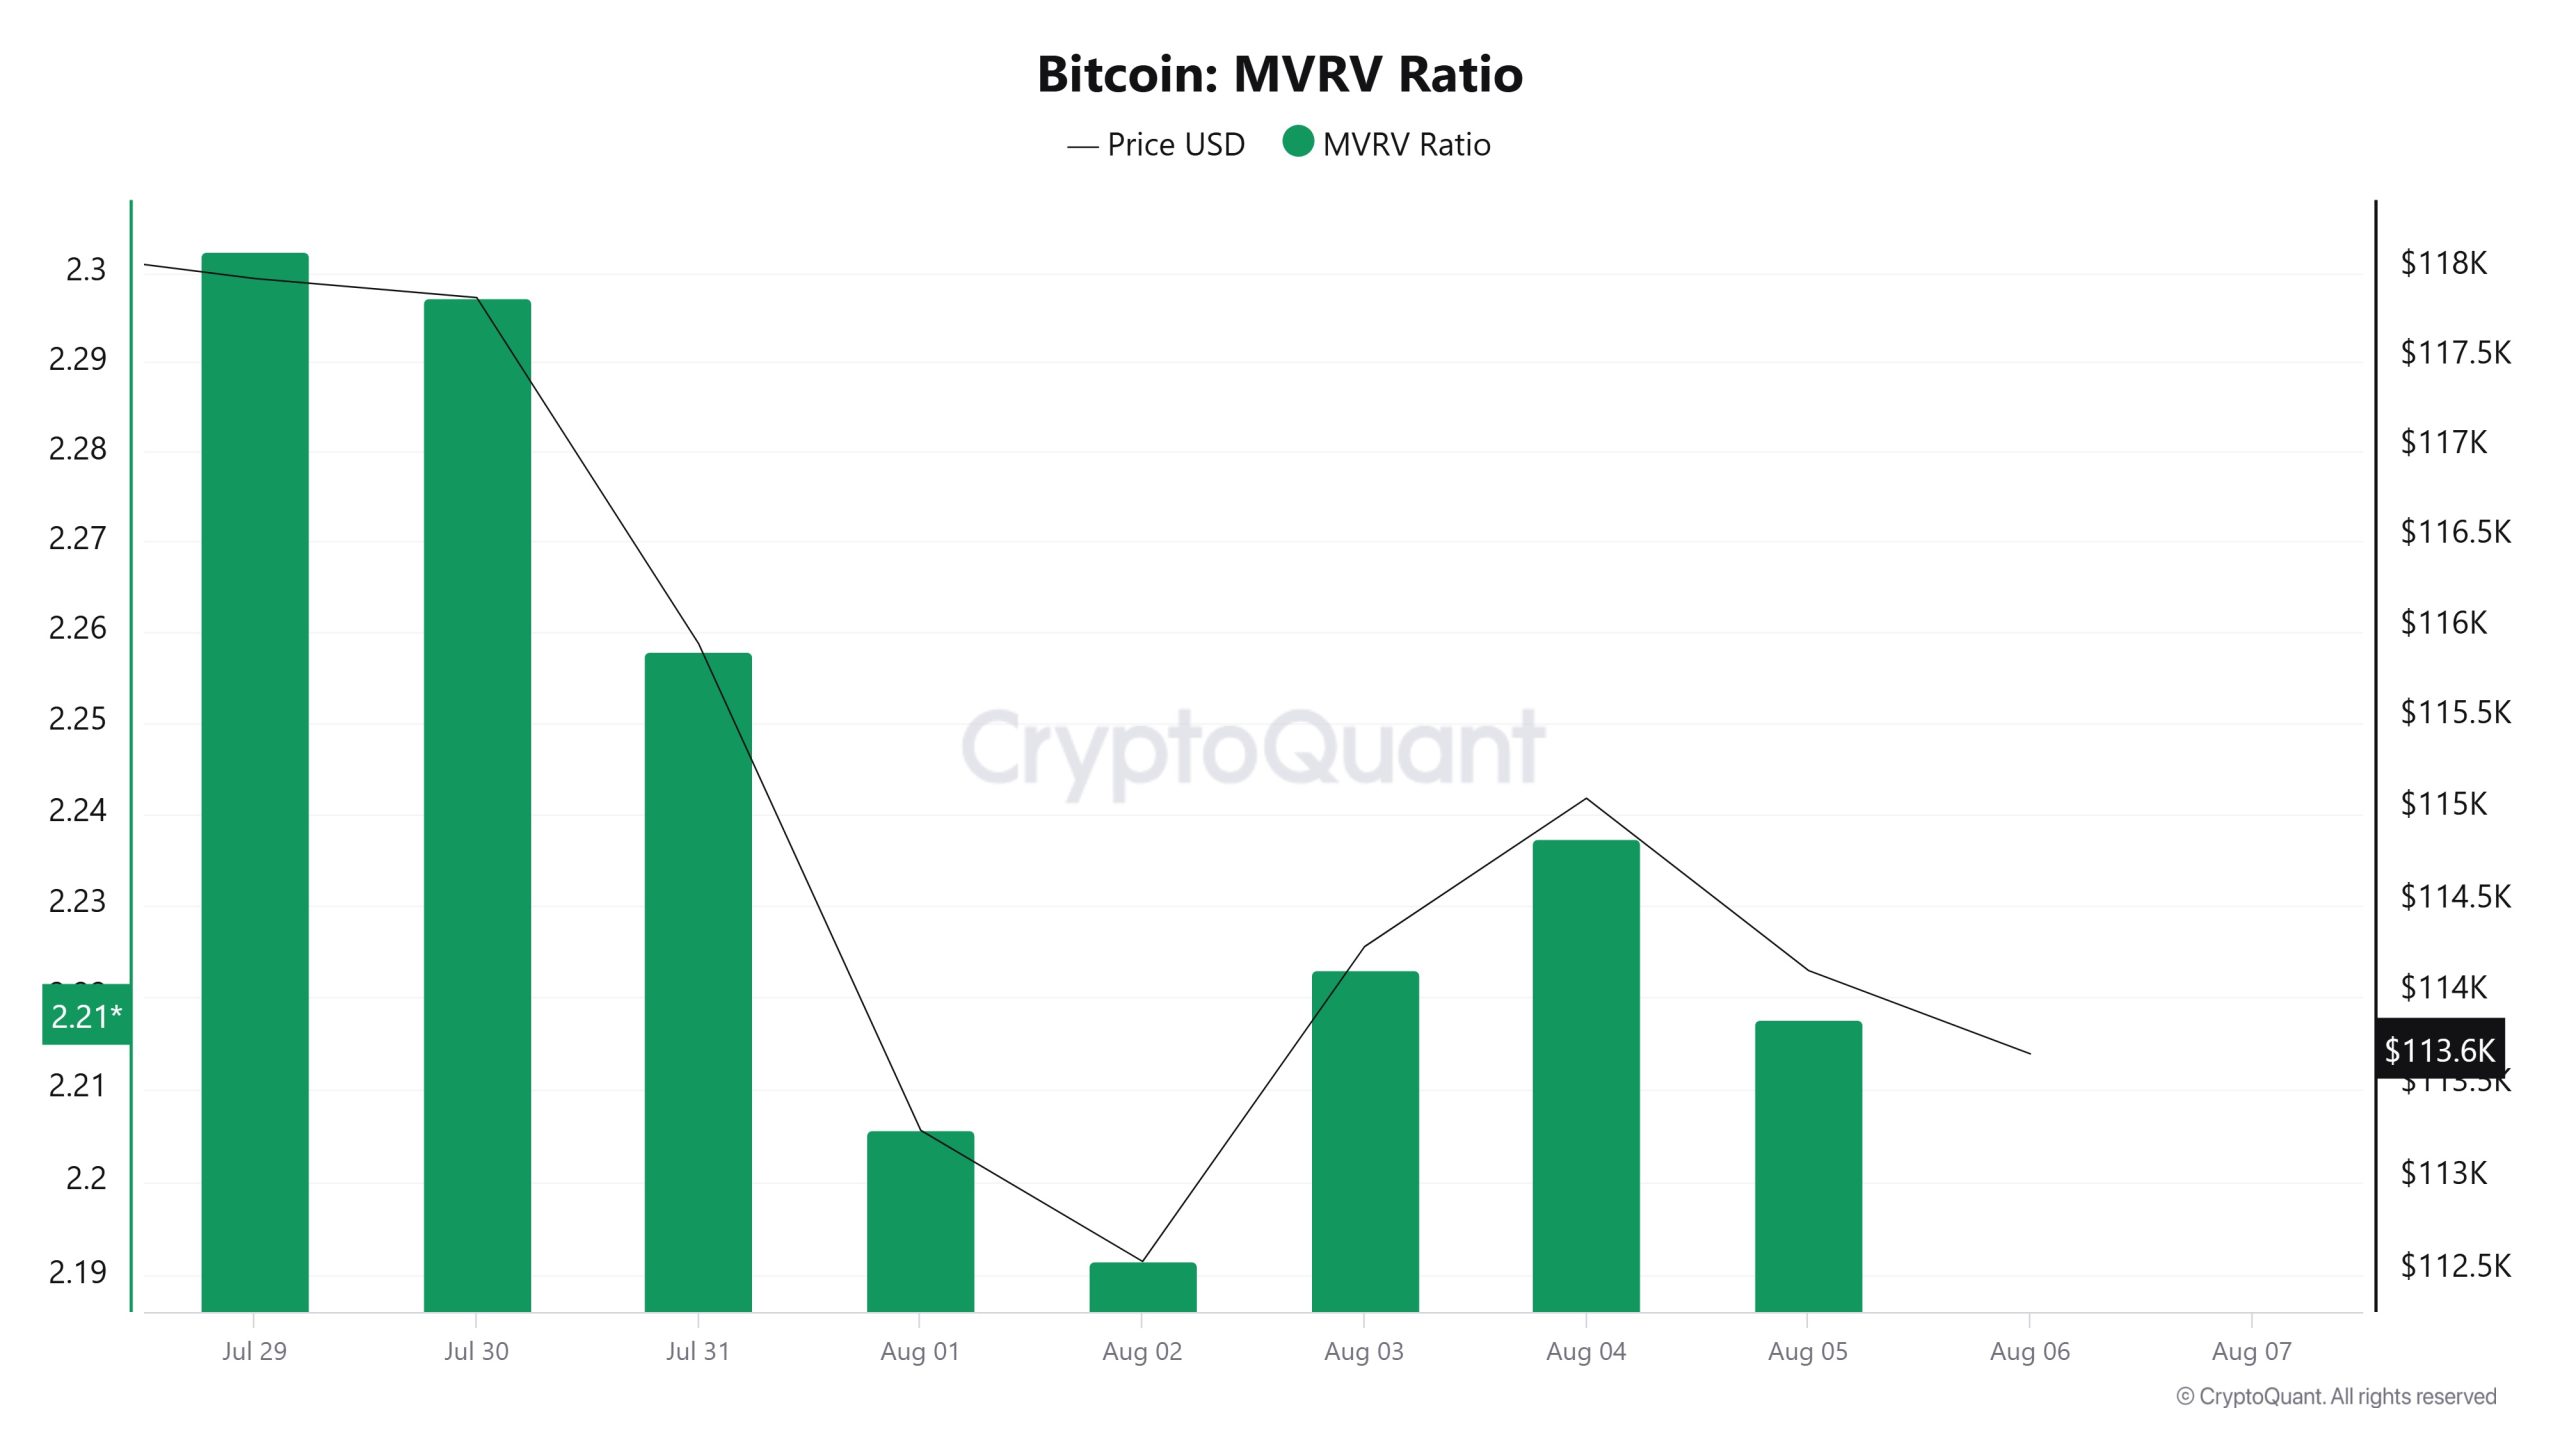
On July 30th, Bitcoin price was at 117,822 while MVRV Ratio was at 2.297. As of August 5, the Bitcoin price fell 3.15% to 114,114, while the MVRV Ratio fell 3.48% to 2,217.
Realized Price
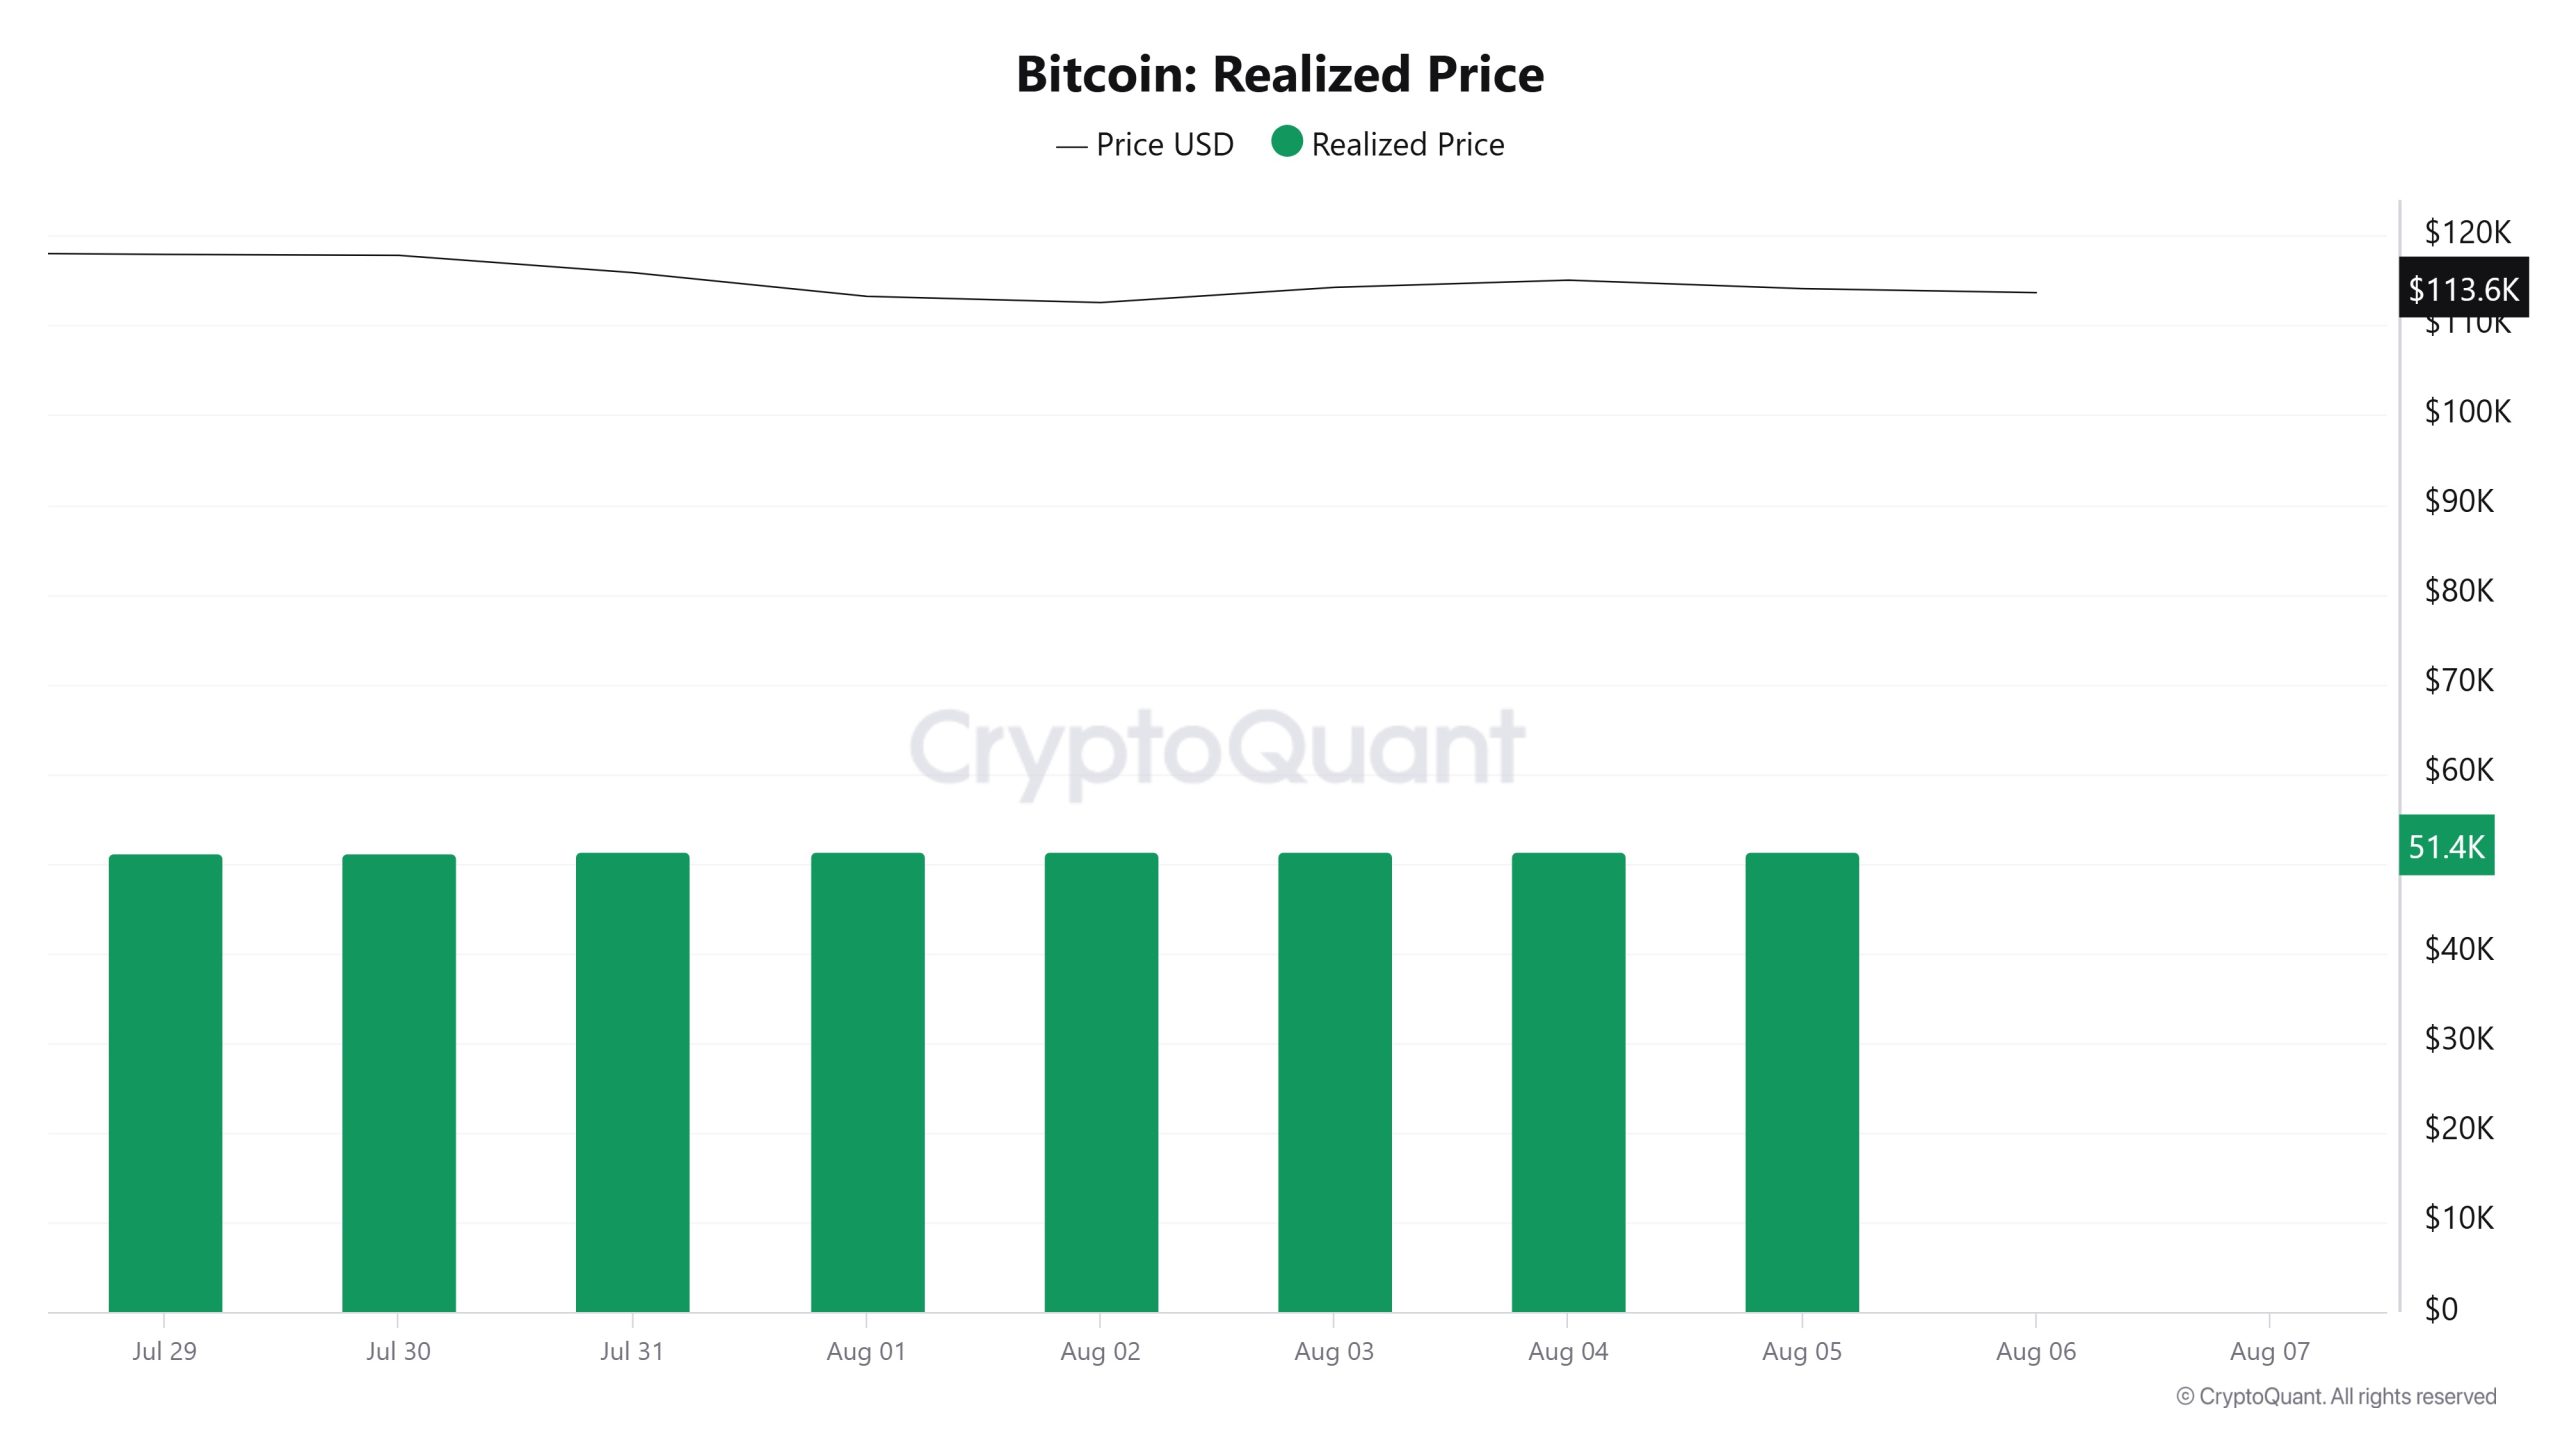
On July 30, the Bitcoin price was at 117,822 while the SOPR metric was at 1,018. As of August 5, the Bitcoin price fell to 114,114, a decline of 3.15%, while the SOPR metric fell to 1,009, a decline of 0.88%.
Spent Output Profit Ratio (SOPR)
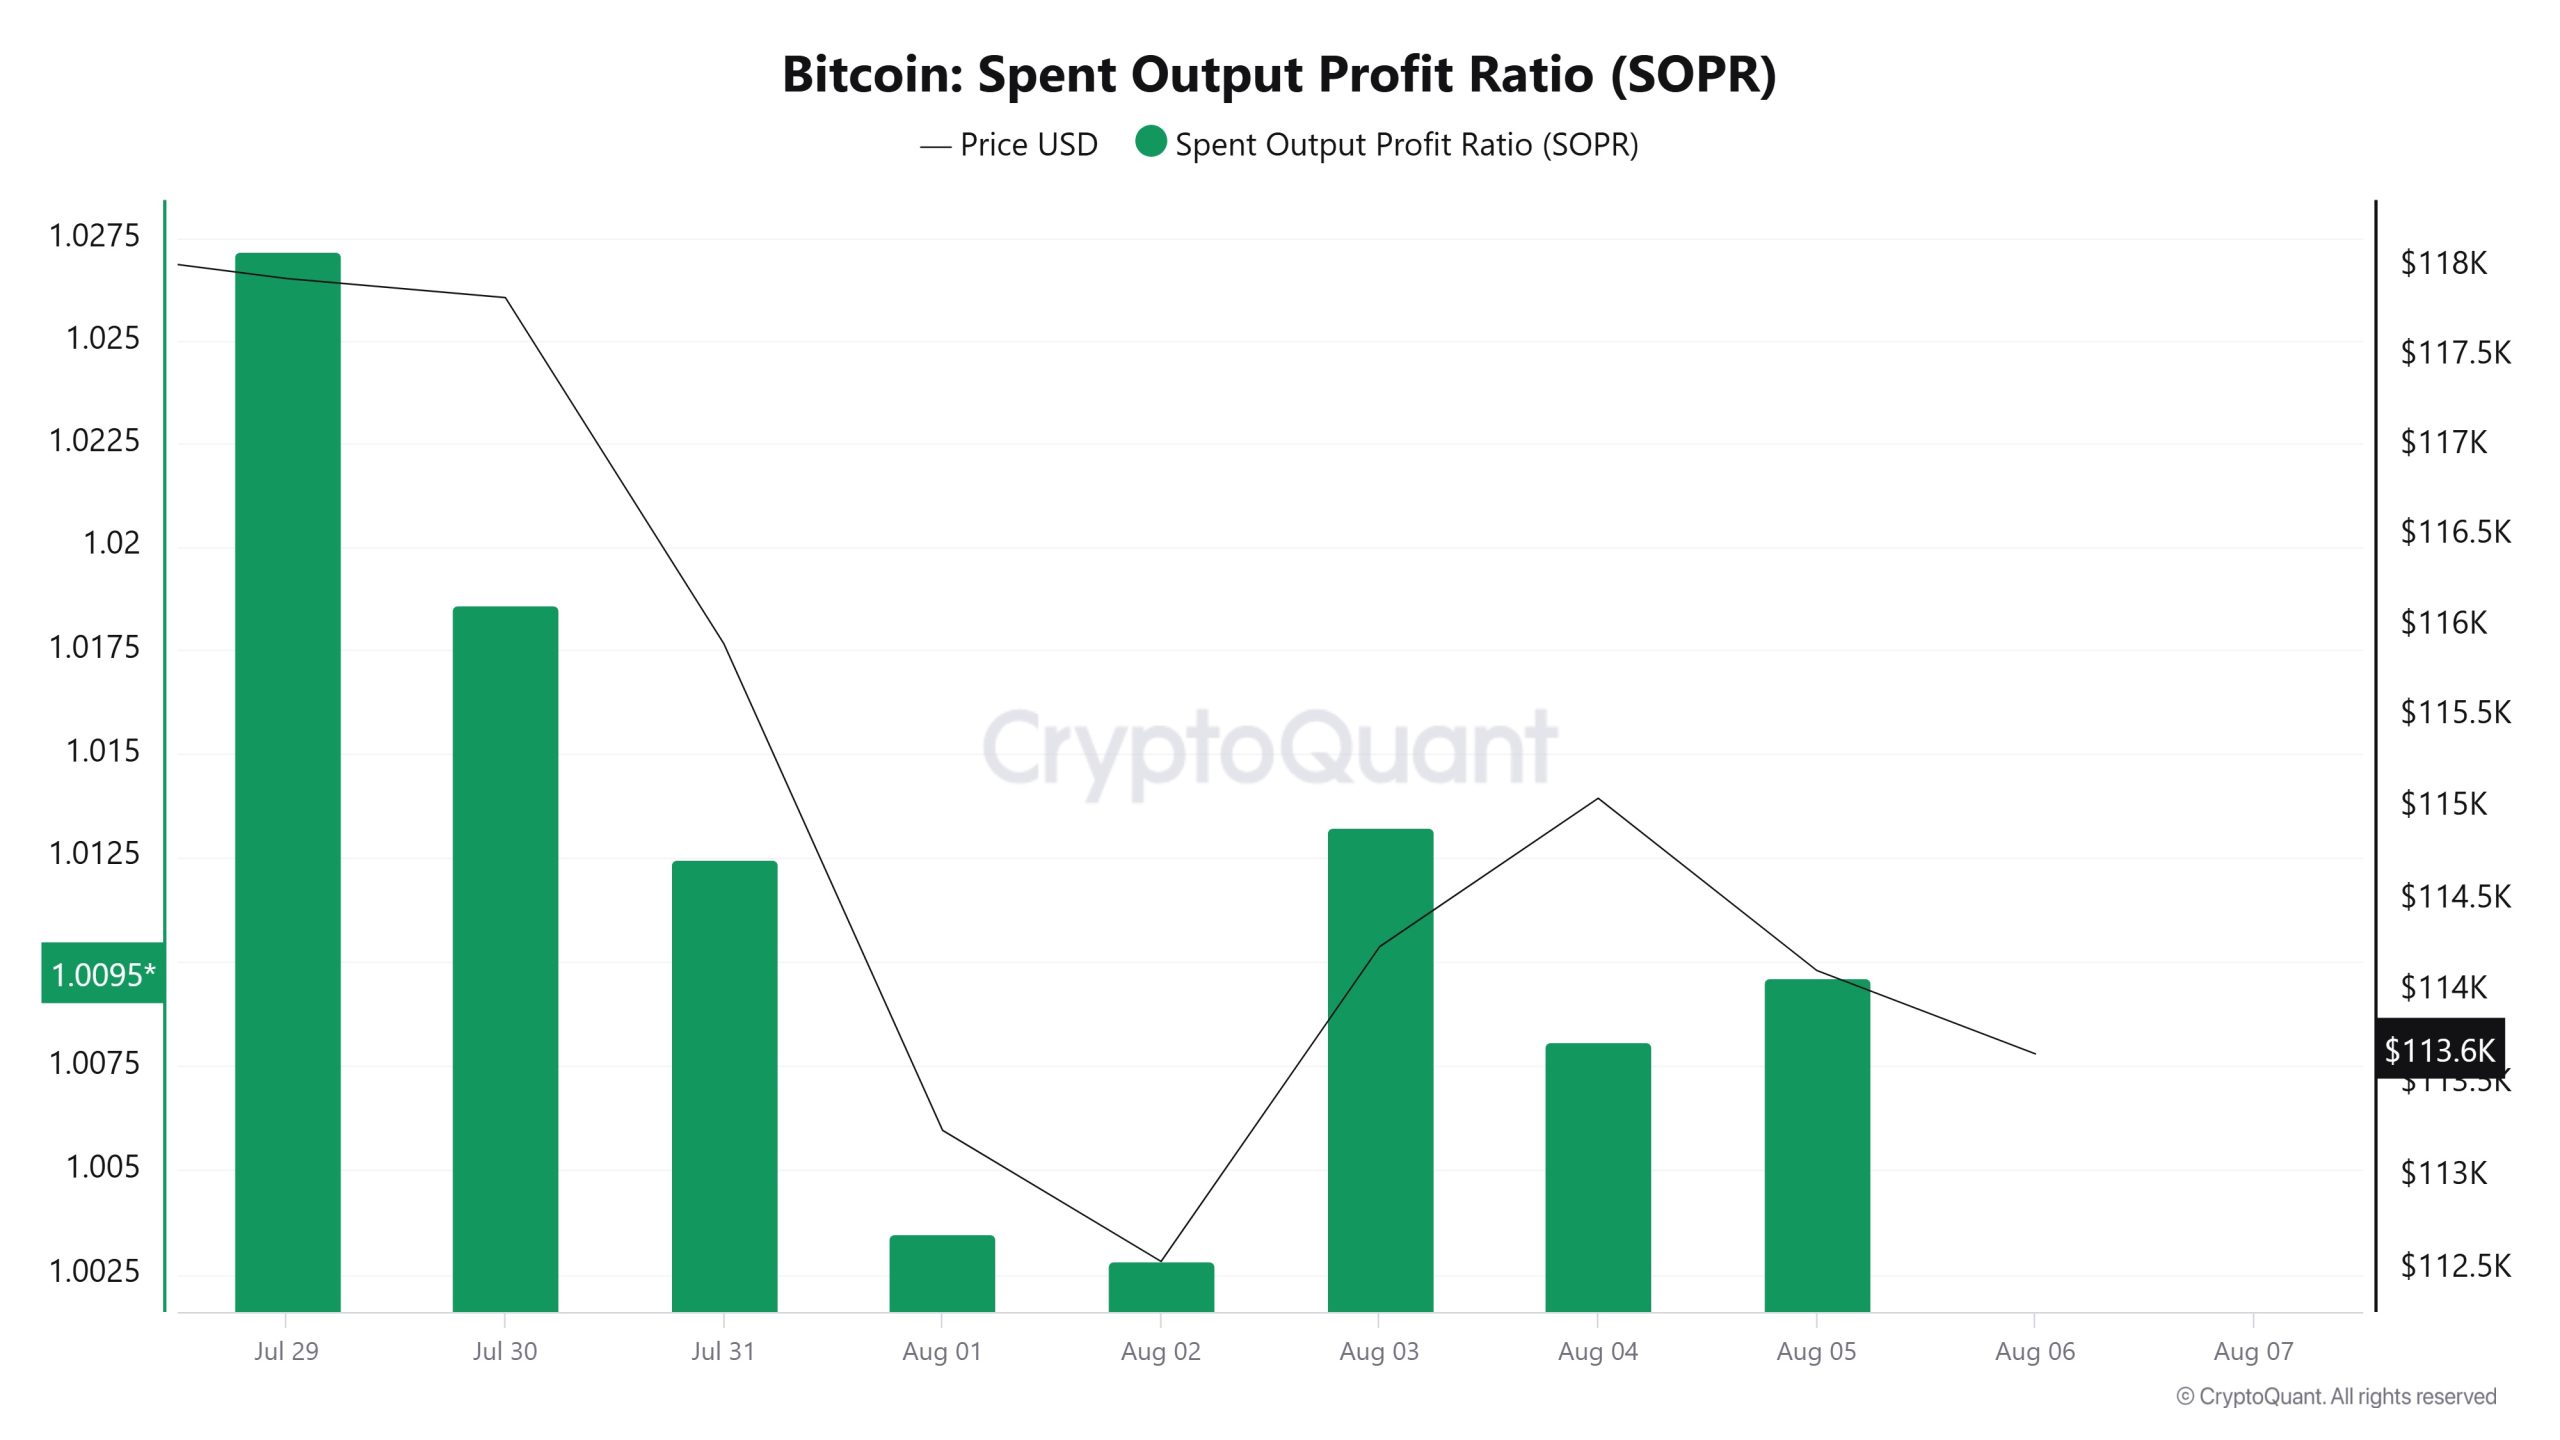
On July 30, the Bitcoin price was at 117,822 while the SOPR metric was at 1,018. As of August 5, the Bitcoin price fell to 114,114, a decline of 3.15%, while the SOPR metric fell to 1,009, a decline of 0.88%.
Derivatives
Open Interest
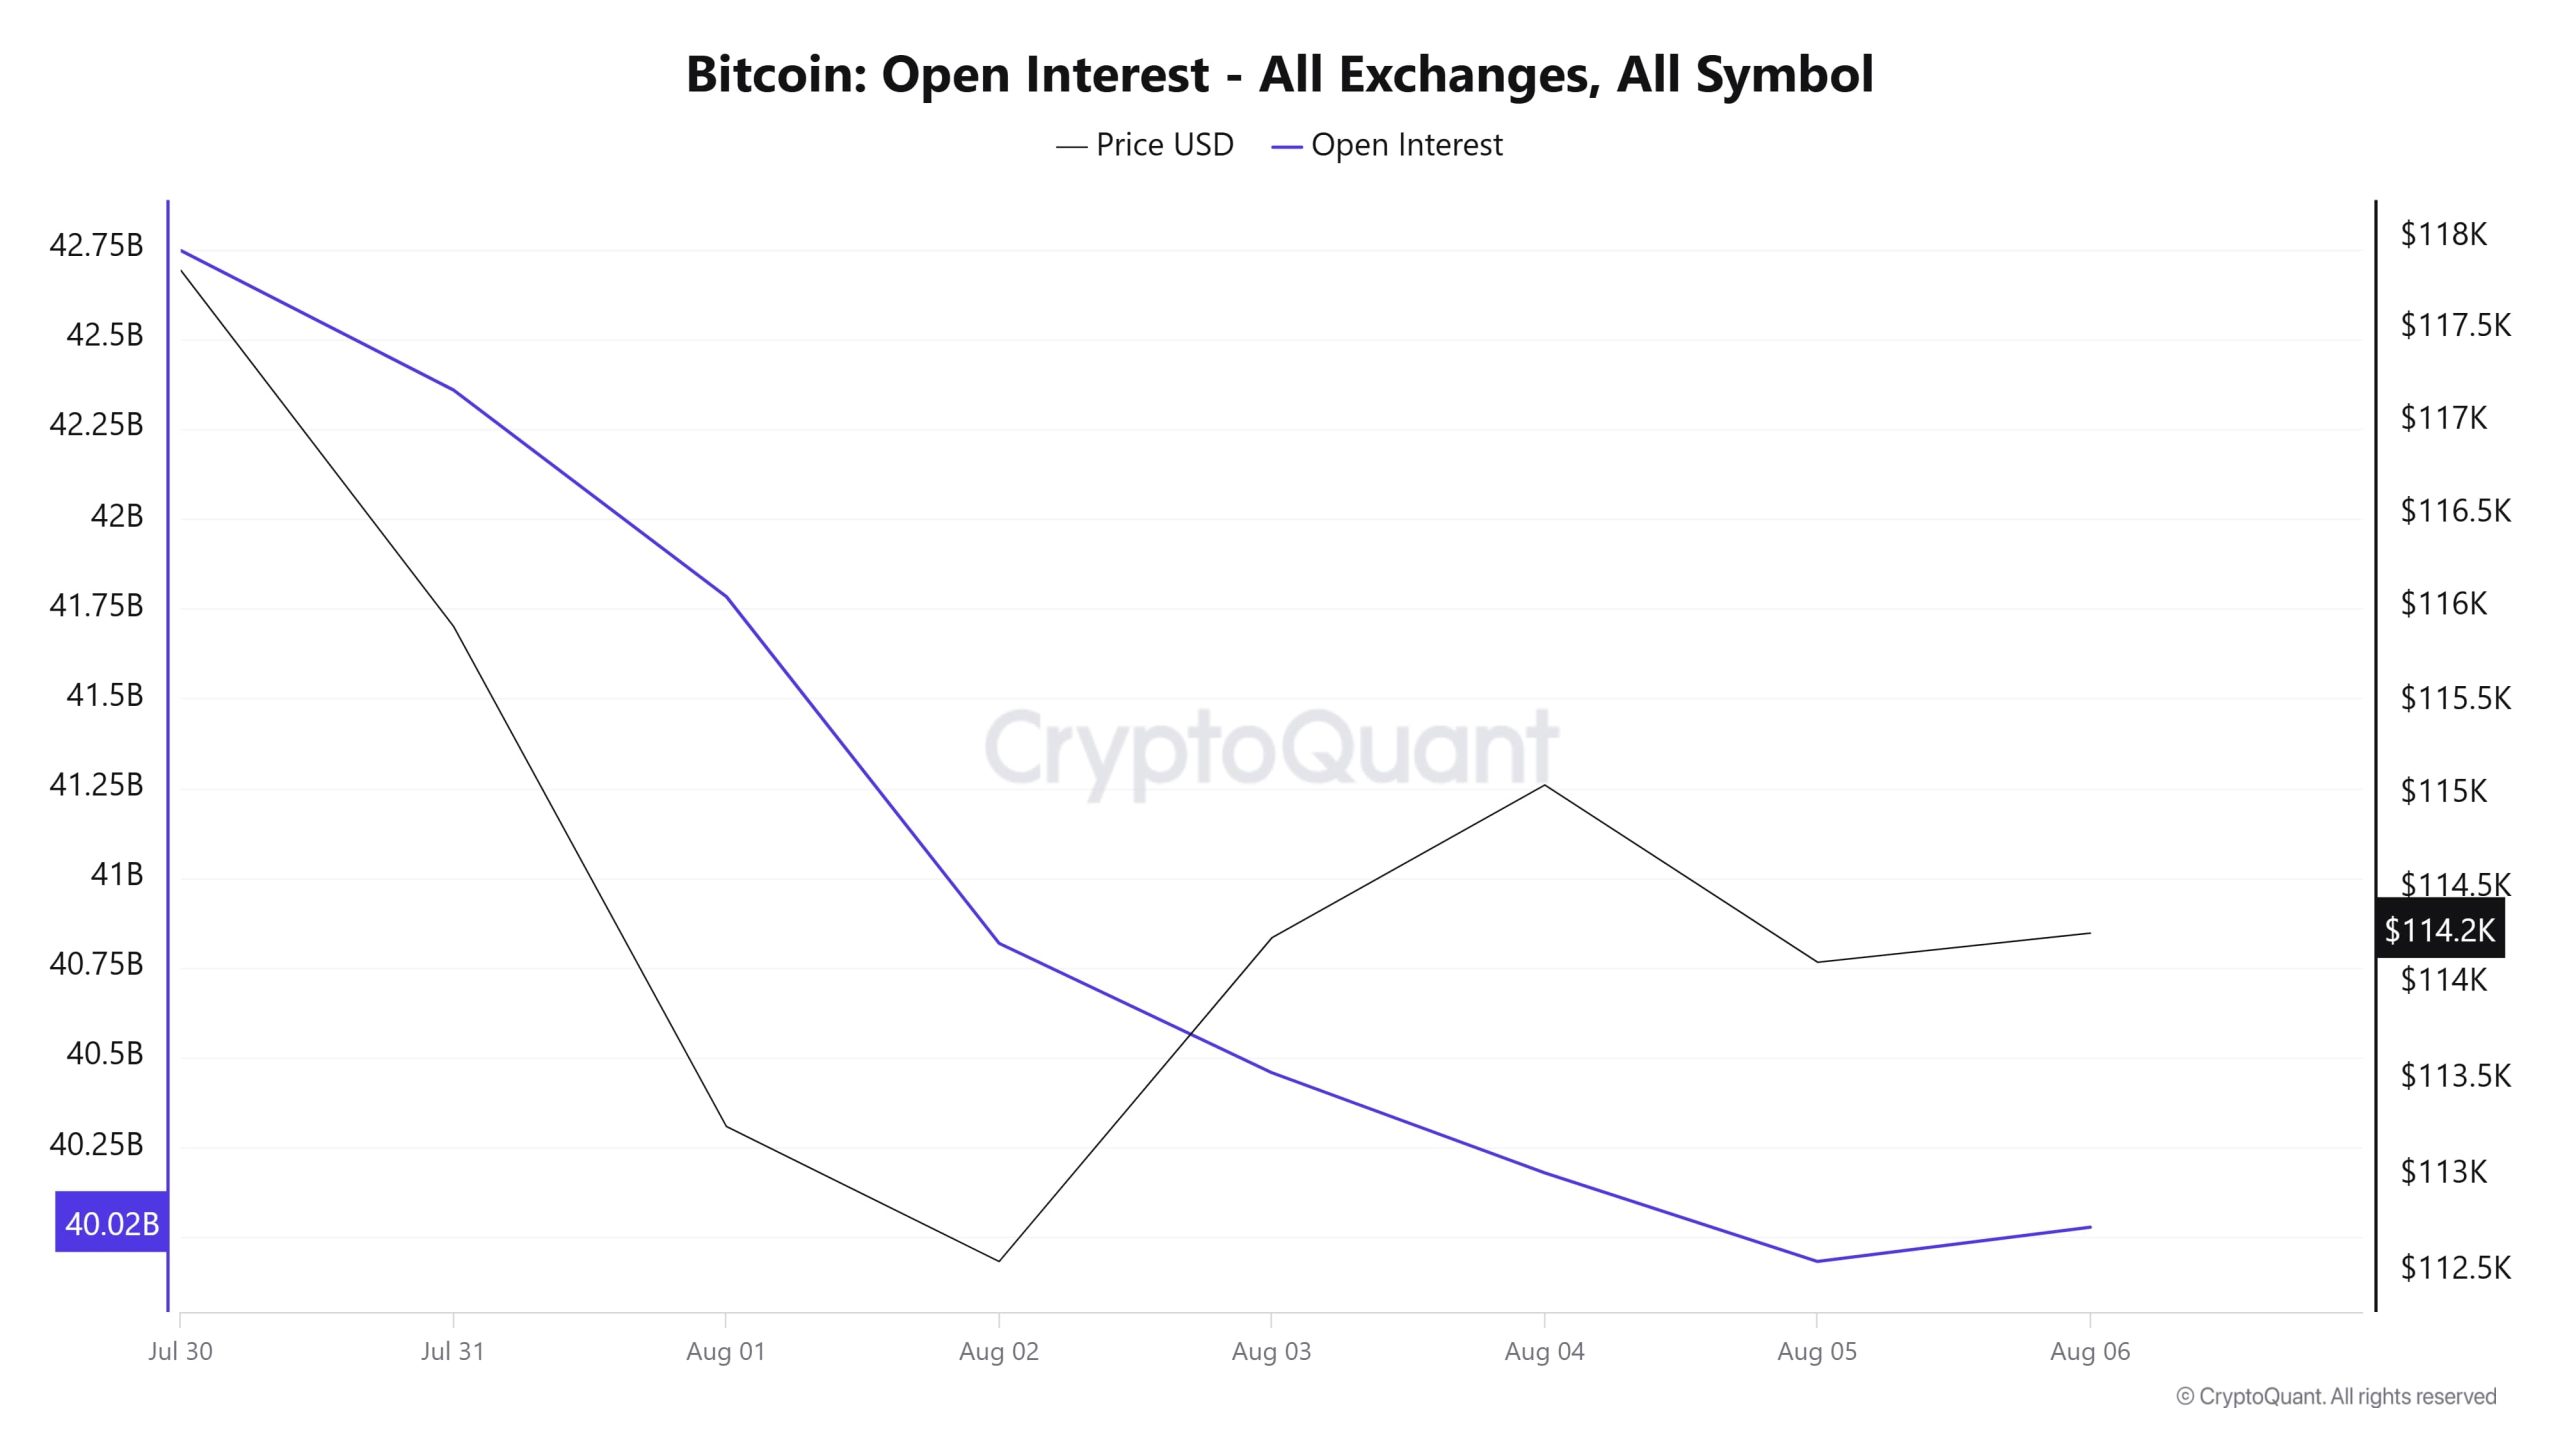
When we look at the chart, we can see a significant decline in Bitcoin’s open interest since July 30. Open positions, which started at $ 42.75 billion in the first days, fell to $ 40.02 billion as of August 6. This decline has been quite steady, with a particularly sharp break between August 1-2. There is a similar downward movement in prices during the same period, but after August 2, there is a slight recovery in prices. There is a short-term rise, especially between August 3-4, but this recovery is not permanent. The price seems to have found some balance as open interest continues to fall. By August 6, both price and open interest are somewhat flat, but the overall trend is clearly downwards. This picture suggests that risk appetite in the market has decreased, investors have reduced their positions and uncertainty prevails. Especially in leveraged transactions, caution is clearly evident.
Funding Rate
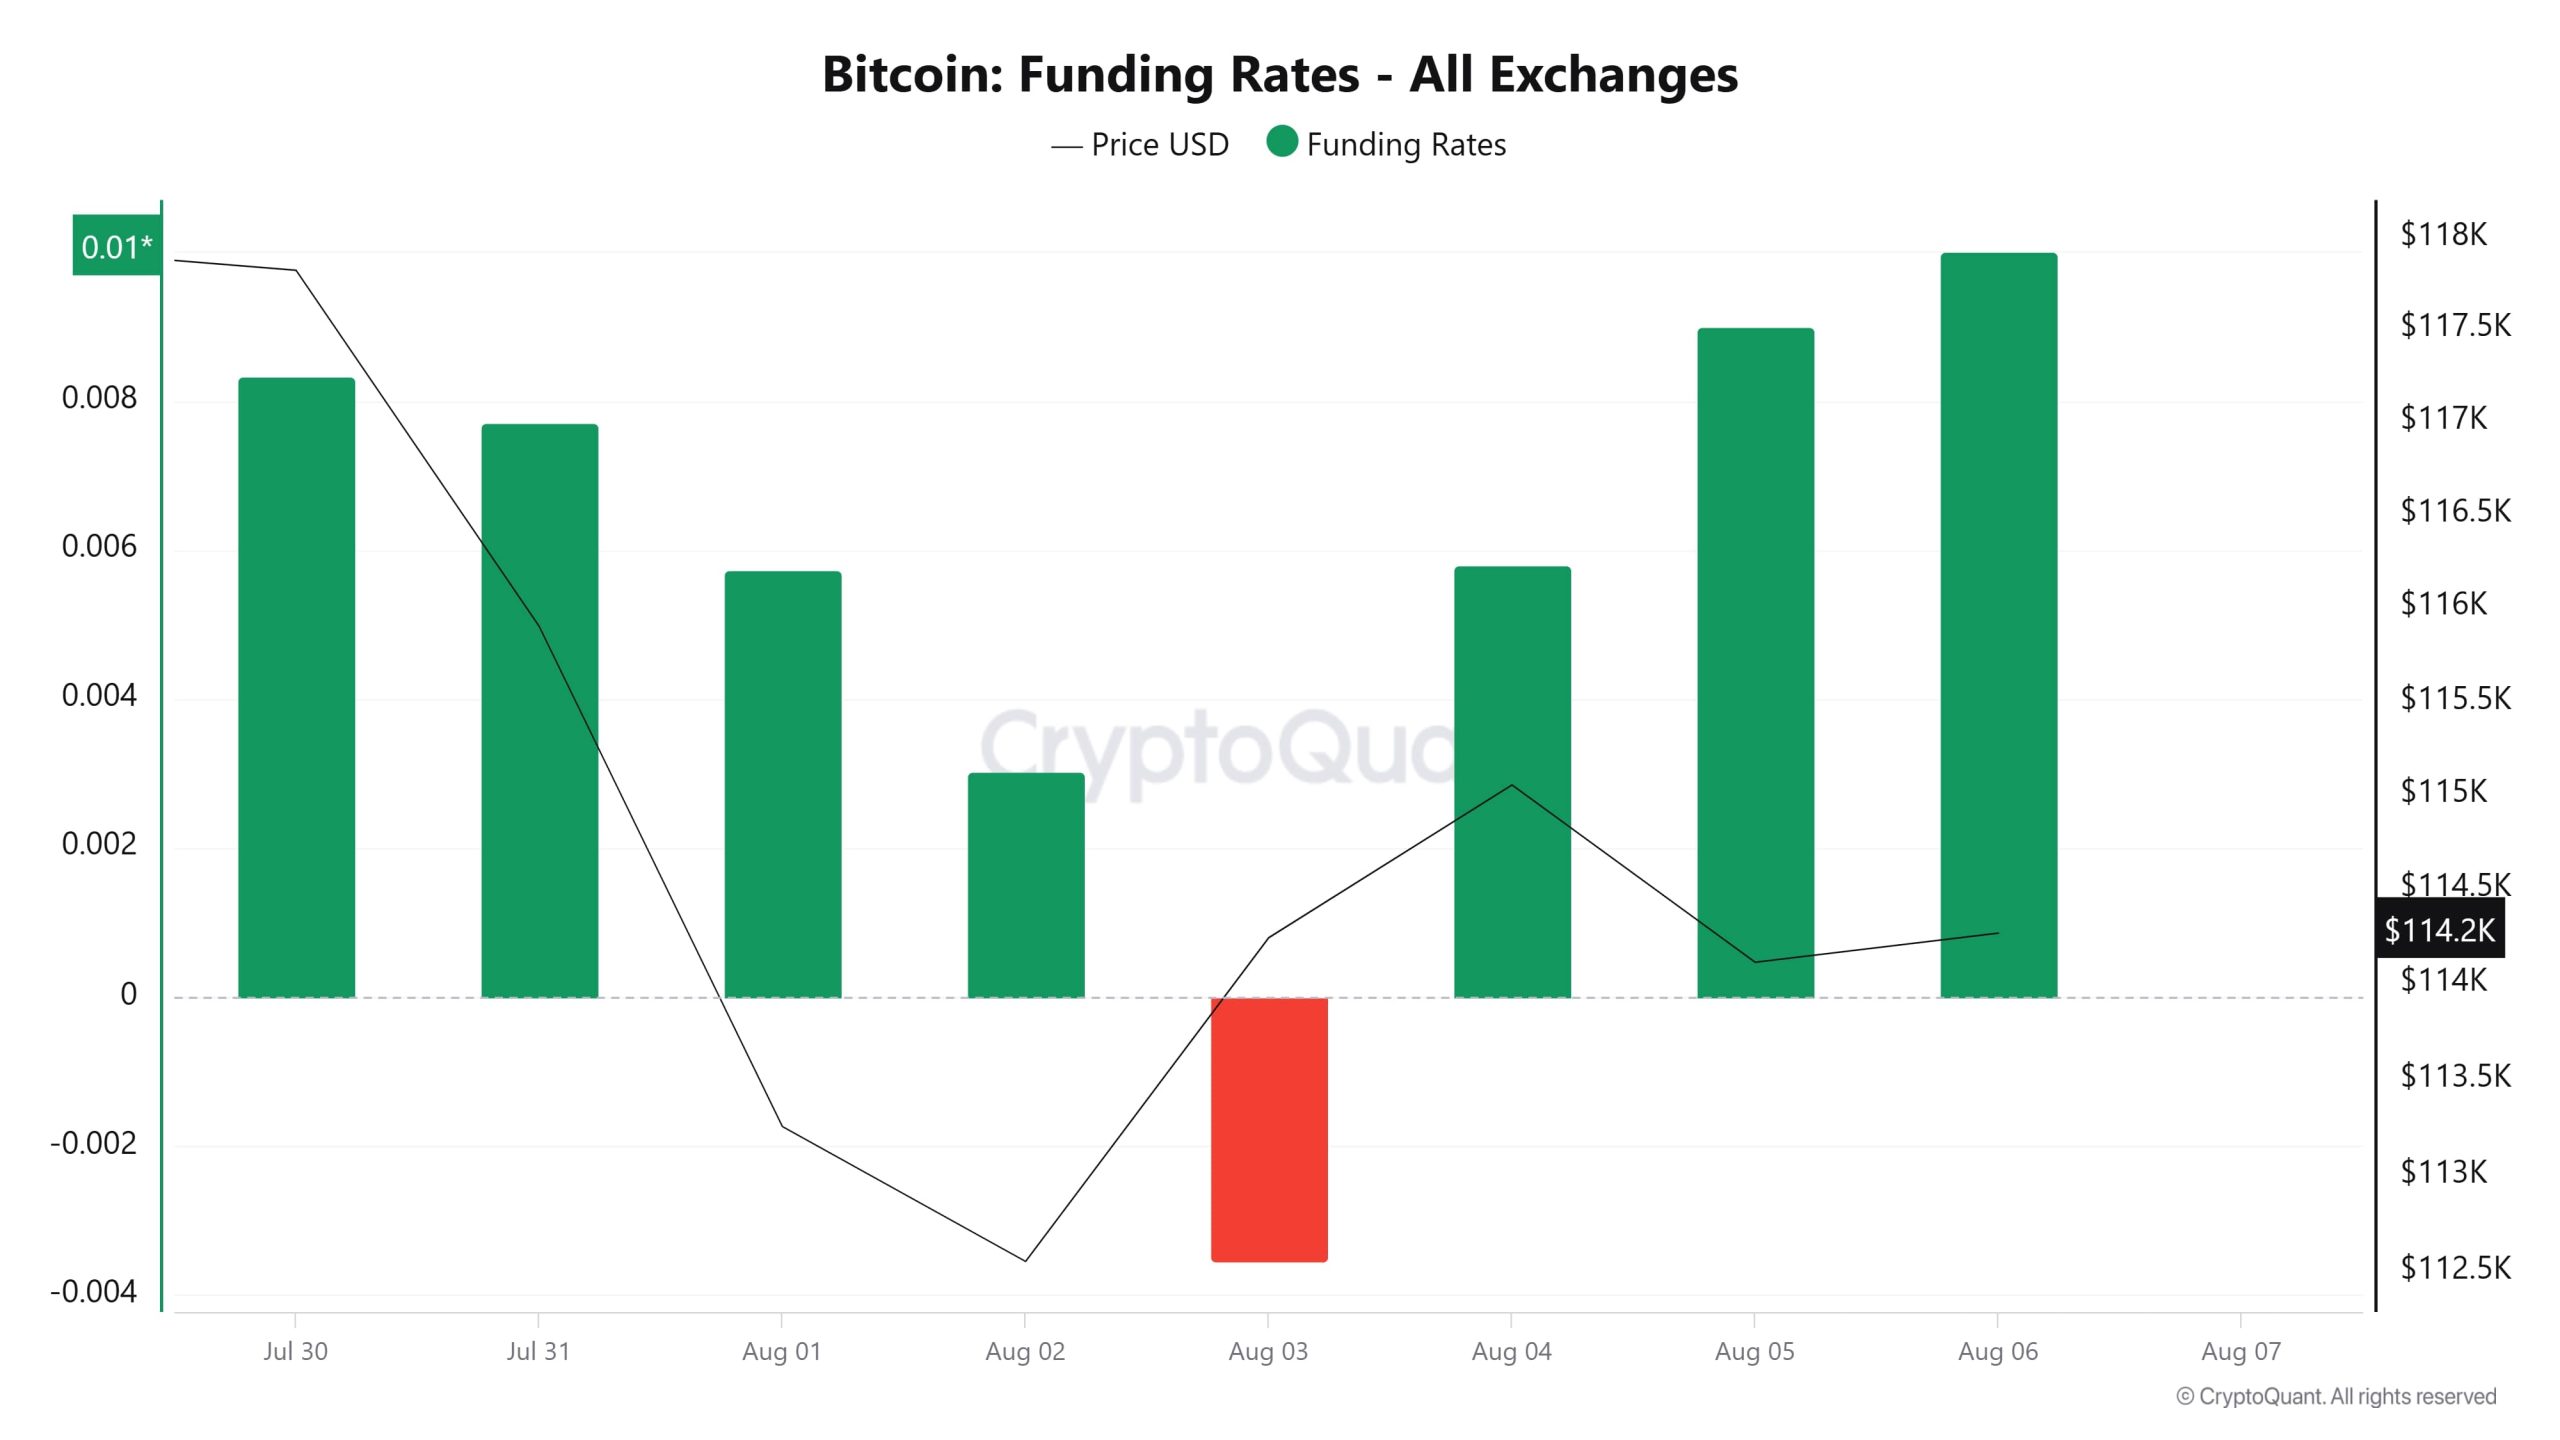
The fluctuation in Bitcoin’s funding rates in the chart clearly reflects market sentiment. At the end of July, the rates were in positive territory and strong, indicating that investors were predominantly long and bullish expectations prevailed. However, as the price started to move downwards from July 31, the funding rates also started to decline. This decline reached the negative territory on August 3, suggesting that short positions started to increase in the market or investors started to act cautiously. However, in the days that followed, rates recovered and moved back into positive territory. As of August 4, the funding rate started to rise again, and market participants turned to the long side again. Although prices did not react very strongly during this period, this recovery in funding rates implies that expectations have turned up again. In short, it seems that the market has started to show signs of recovery after a short period of unease
Long & Short Liquidations
Last week, mainly long positions were liquidated with the BTC price falling from $118,800 to near the $112,000 level. 629 million dollars of long and 86 million dollars of short transactions were liquidated.
| Date | Long Amount (Million $) | Short Amount (Million $) |
|---|---|---|
| July 30 | 69.15 | 10.37 |
| July 31 | 88.82 | 7.54 |
| August 01 | 224.56 | 14.54 |
| August 02 | 156.31 | 4.78 |
| August 03 | 29.64 | 16.28 |
| August 04 | 7.66 | 22.42 |
| August 05 | 53.71 | 10.52 |
| Total | 629.85 | 86.45 |
Supply Distribution
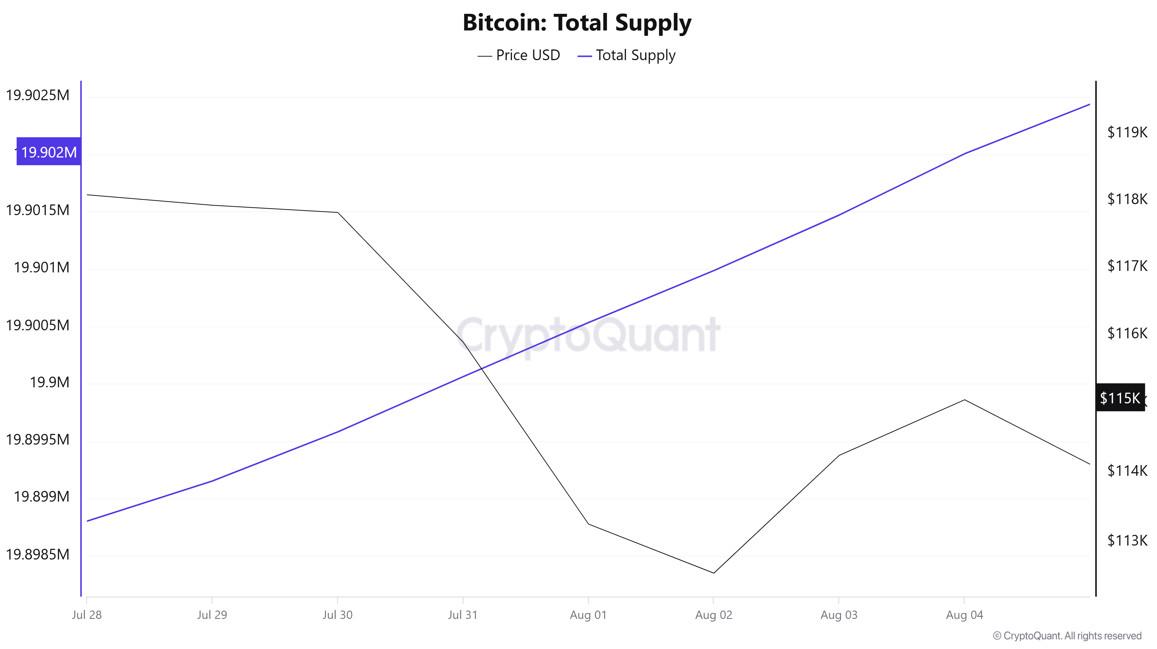
Total Supply: It reached 19,902,005 units, up about 0.0161% from last week.
New Supply: The amount of BTC produced this week amounted to 3,203.
Velocity: Velocity, which was 12.68 last week, was 12.60 as of August 4.
| Wallet Category | 28.07.2025 | 04.08.2025 | Change (%) |
|---|---|---|---|
| < 1 BTC | 8.4607% | 8.4684% | 0.091% |
| 1 – 10 BTC | 11.3815% | 11.3965% | 0.132% |
| 10 – 100 BTC | 24.6862% | 24.6801% | -0.025% |
| 100 – 1k BTC | 29.4613% | 29.4256% | -0.121% |
| 1k – 10k BTC | 18.2799% | 18.1981% | -0.447% |
| 10k+ BTC | 7.7299% | 7.8372% | 1.387% |
According to the latest weekly data, there is a mixed outlook in Bitcoin wallet distribution. Wallets holding less than 1 BTC saw a limited increase of 0.091%, while wallets in the 1-10 BTC range saw a slight increase of 0.132%. The 10-100 BTC category, which represents larger investors, saw a limited decline of 0.025%, while the 100-1,000 BTC range saw a downward trend of 0.121%. In contrast, wallets in the 1,000-10,000 BTC group experienced a 0.447% decrease . Wallets over 10,000 BTC, which represent the largest investor group, recorded a remarkable increase of 1,387%.
Exchange Supply Ratio
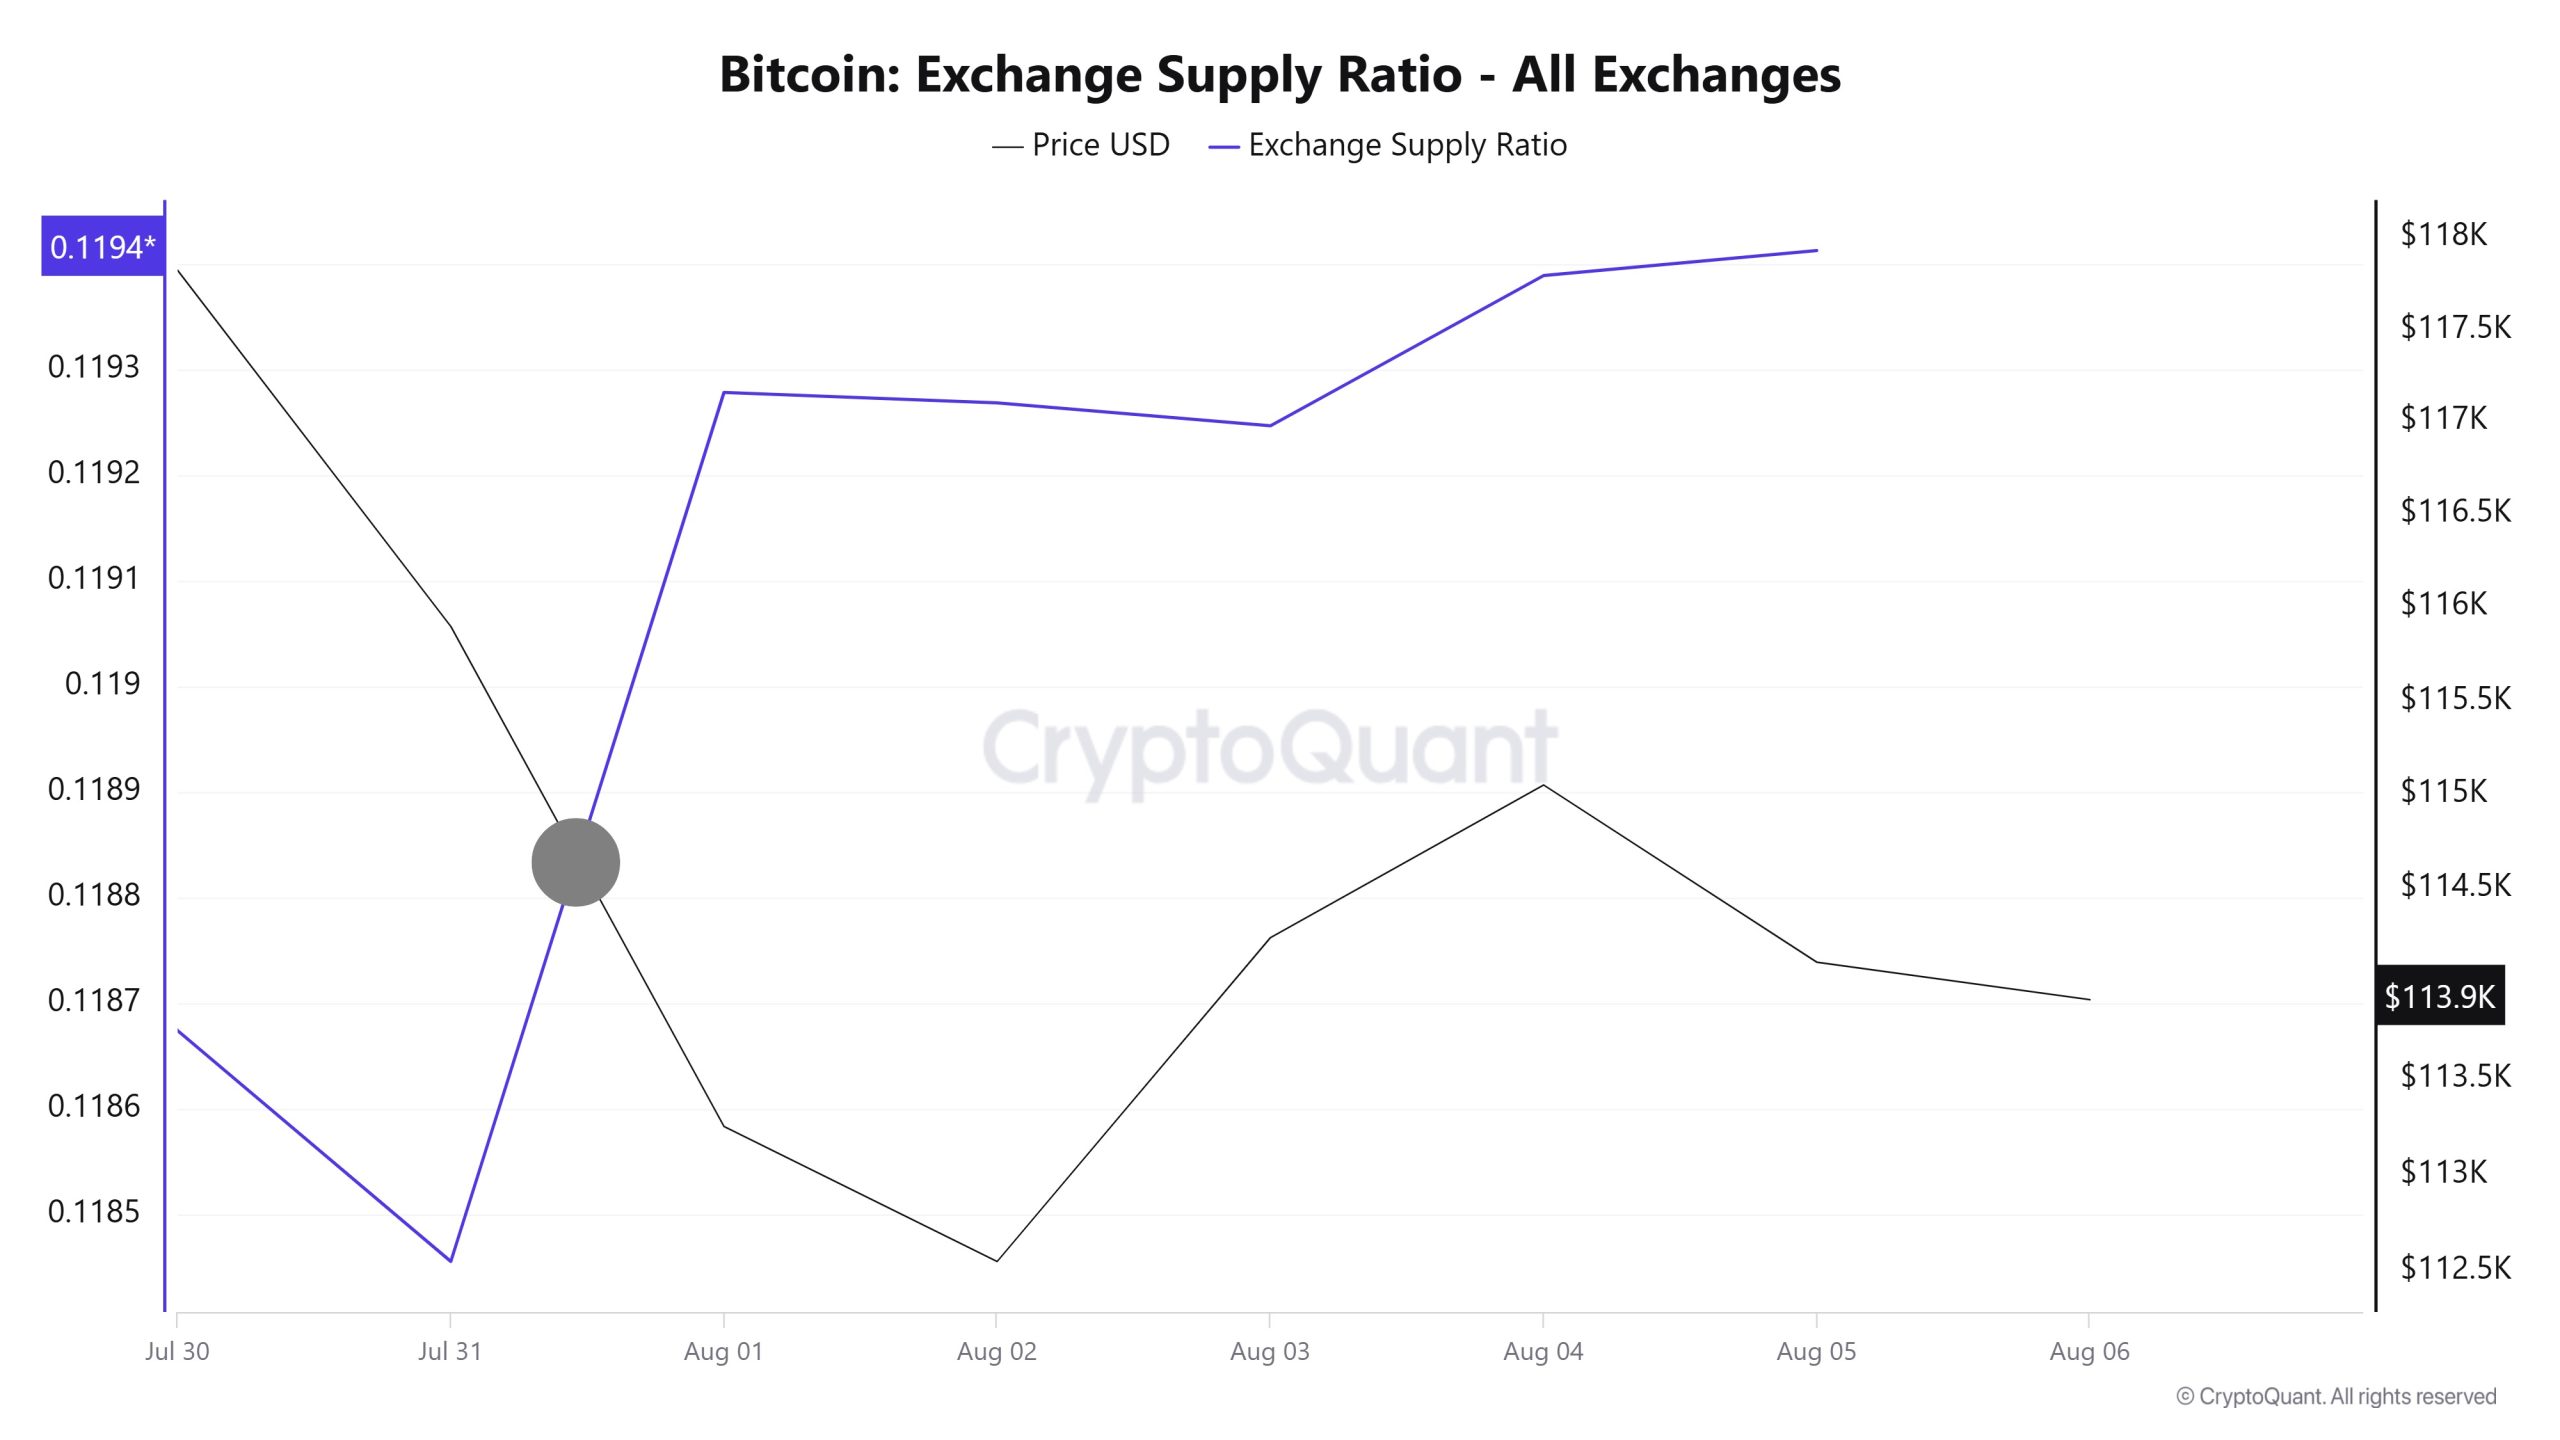
Data from the Bitcoin Exchange Supply Ratio table, which shows how much of Bitcoins are held on exchanges compared to the total supply of Bitcoins, showed low rates this week. This week’s data reveals that the general trend is for a negative correlation between the price of Bitcoin and the rate of supply entering exchanges. It shows that most Bitcoins are held in wallets and are not readily available to sell or buy quickly in the market.
Between August 29 and August 5, the Bitcoin Exchange Supply Ratio increased from 0.11927829 to 0.11941259. During this period, the Bitcoin price dropped from $115,114 to $113,251. Notably, between July 31 and August 1, at the intersection of the price and the Exchange Supply Ratio, there was a significant increase in the Exchange Supply Ratio as the price continued to fall. This suggests that despite the price decline, the amount of Bitcoin being supplied to exchanges has increased, possibly indicating that long-term investors have stopped holding their holdings. Bitcoin price is generally on a downward trend.
Exchange Reserve
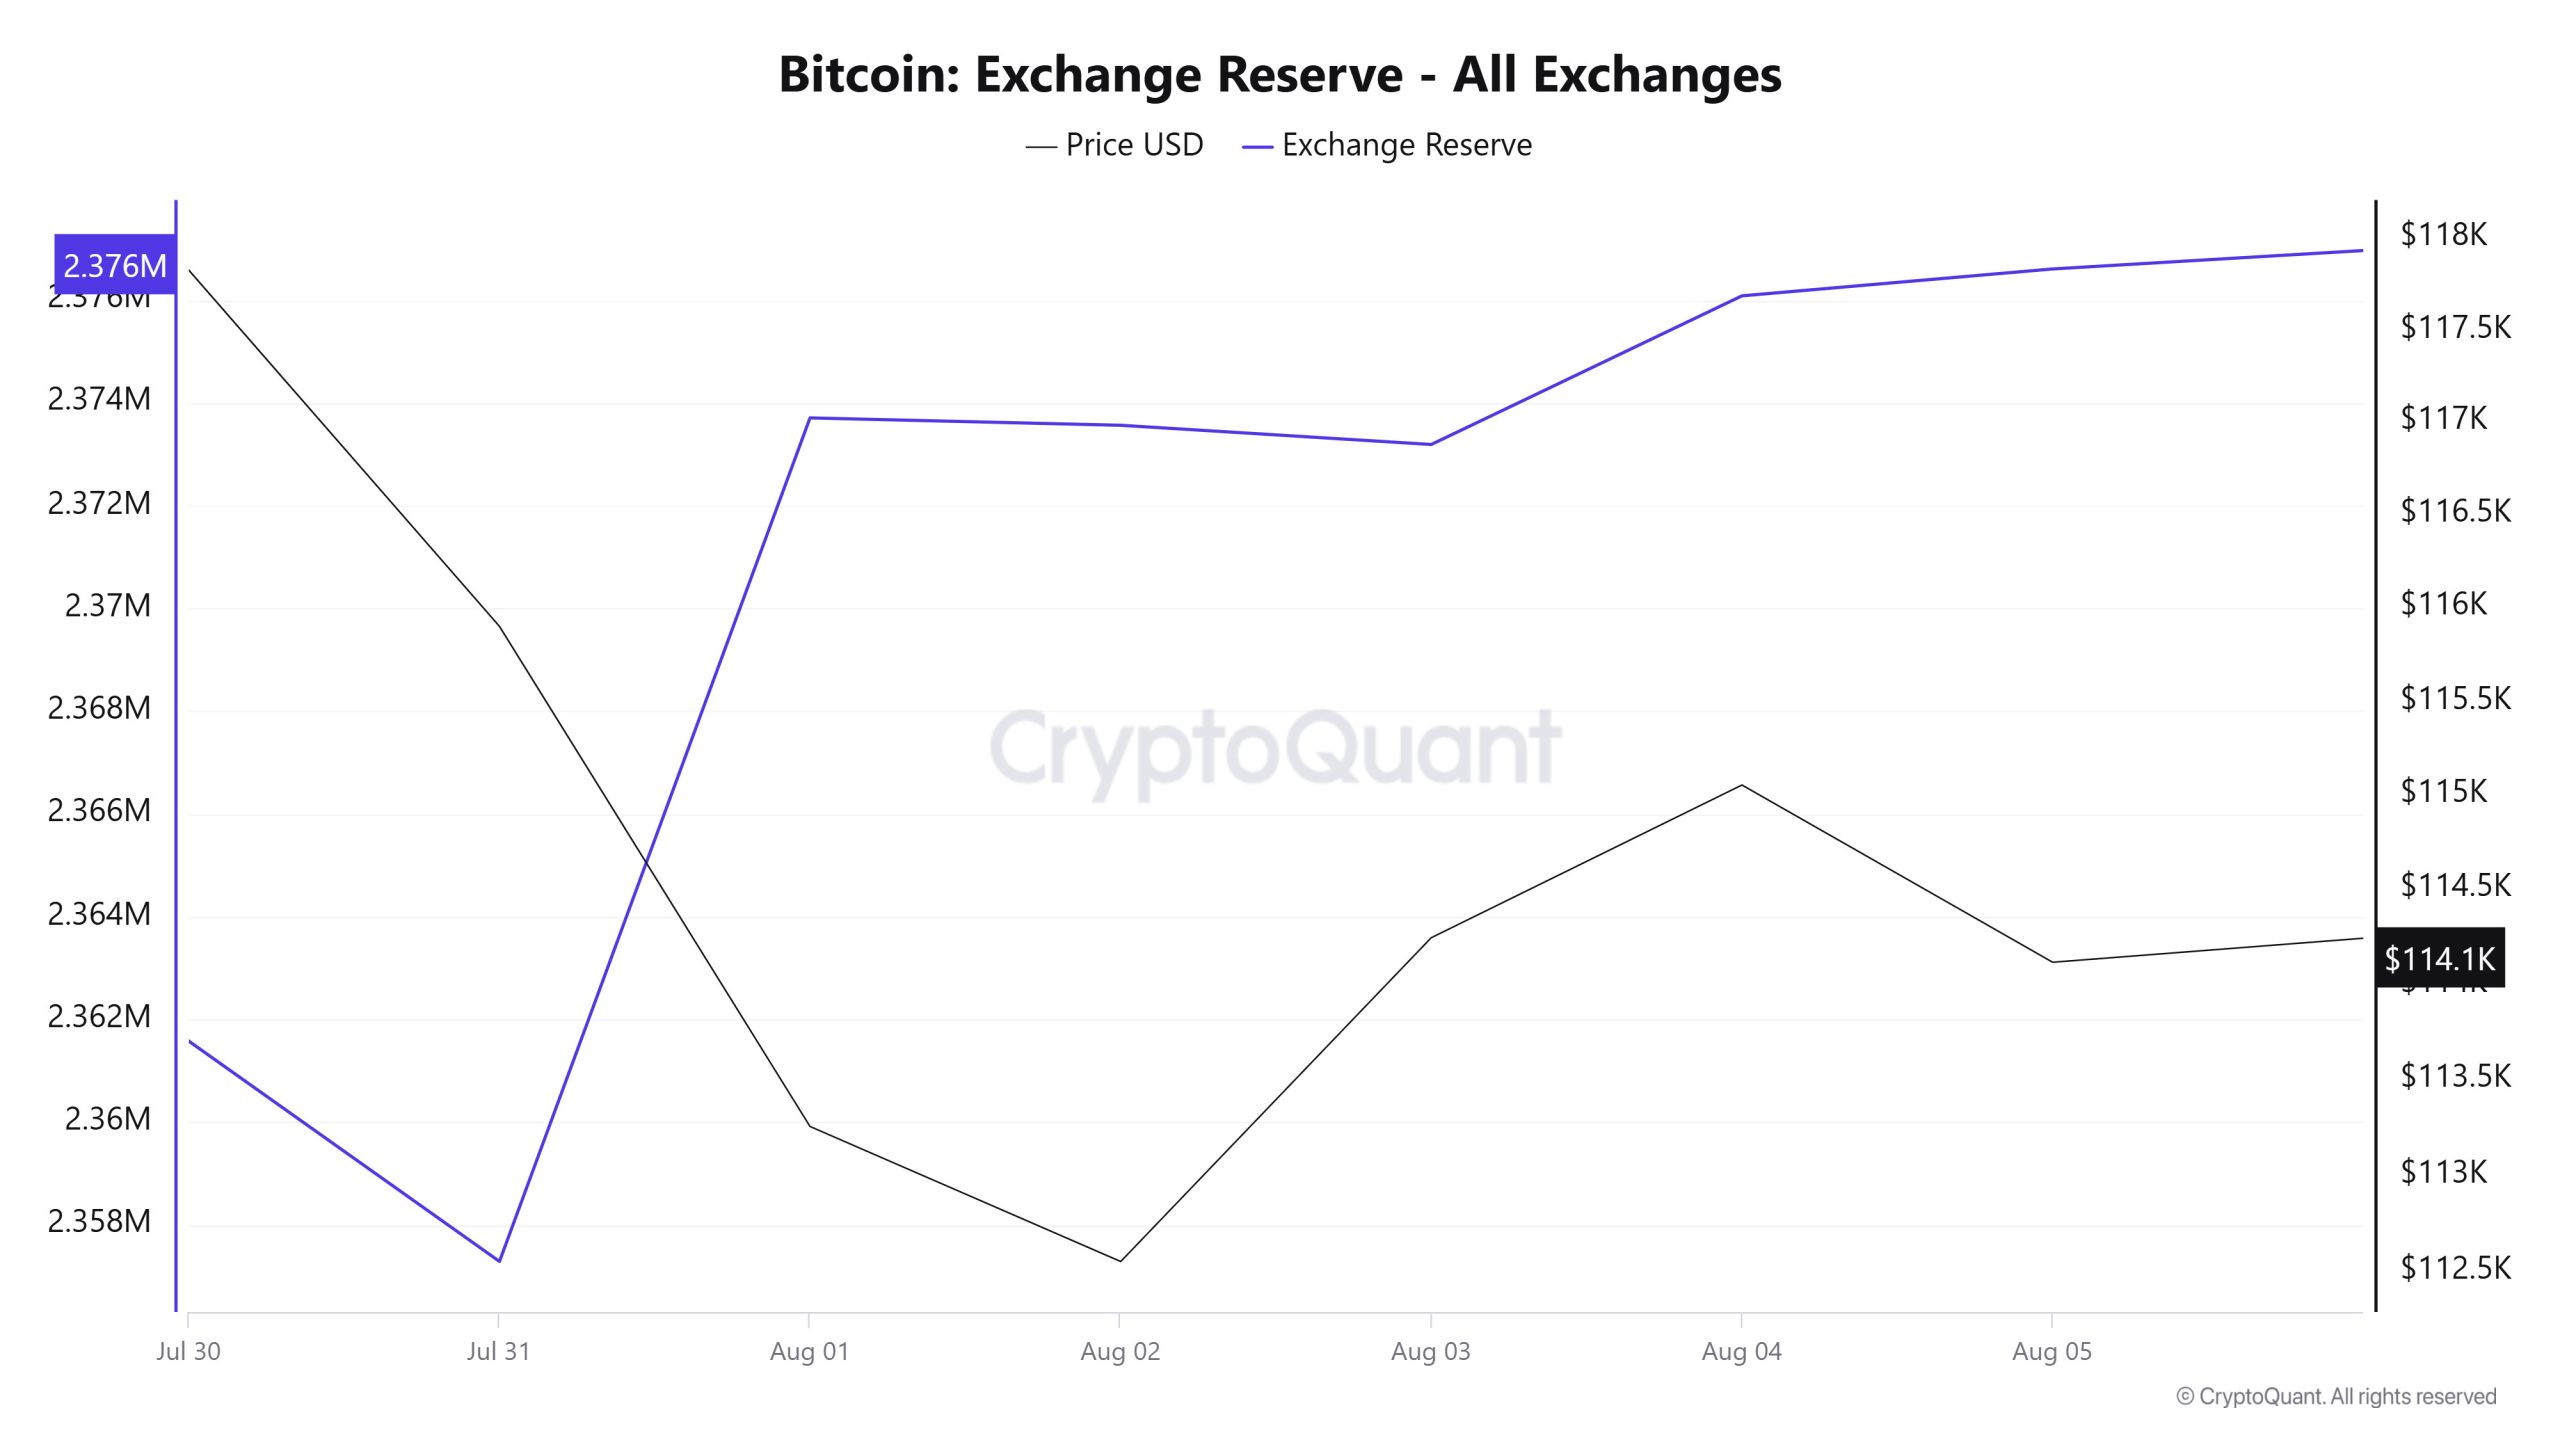
Between July 30 and August 5, 2025, Bitcoin reserves on exchanges increased from 2,361,576 BTC to 2,376,605 BTC. During this period, there was a total net inflow of 15,029 BTC and an increase in reserves of about 0.64%. In the same period, the Bitcoin price fell 3.15%, from $117,822 to $114,115. In the short term, the increase in inflows to exchanges along with the price decline indicates that investors’ selling tendency is strengthening. Continued increase in reserves may cause selling pressure to continue.
| Date | 30-Jul | 31-Jul | 1-Aug | 2-Aug | 3-Aug | 4-Aug | 5-Aug |
|---|---|---|---|---|---|---|---|
| Exchange Inflow | 26,121 | 20,406 | 68,164 | 12,338 | 11,732 | 35,021 | 26,125 |
| Exchange Outflow | 31,974 | 24,695 | 51,746 | 12,481 | 12,105 | 32,128 | 25,602 |
| Exchange Netflow | -5,853 | -4,289 | 16,418 | -143 | -373 | 2,892 | 523 |
| Exchange Reserve | 2,361,576 | 2,357,288 | 2,373,707 | 2,373,563 | 2,373,190 | 2,376,082 | 2,376,605 |
| BTC Price | 117,822 | 115,899 | 113,251 | 112,548 | 114,244 | 115,053 | 114,115 |
Fees and Revenues
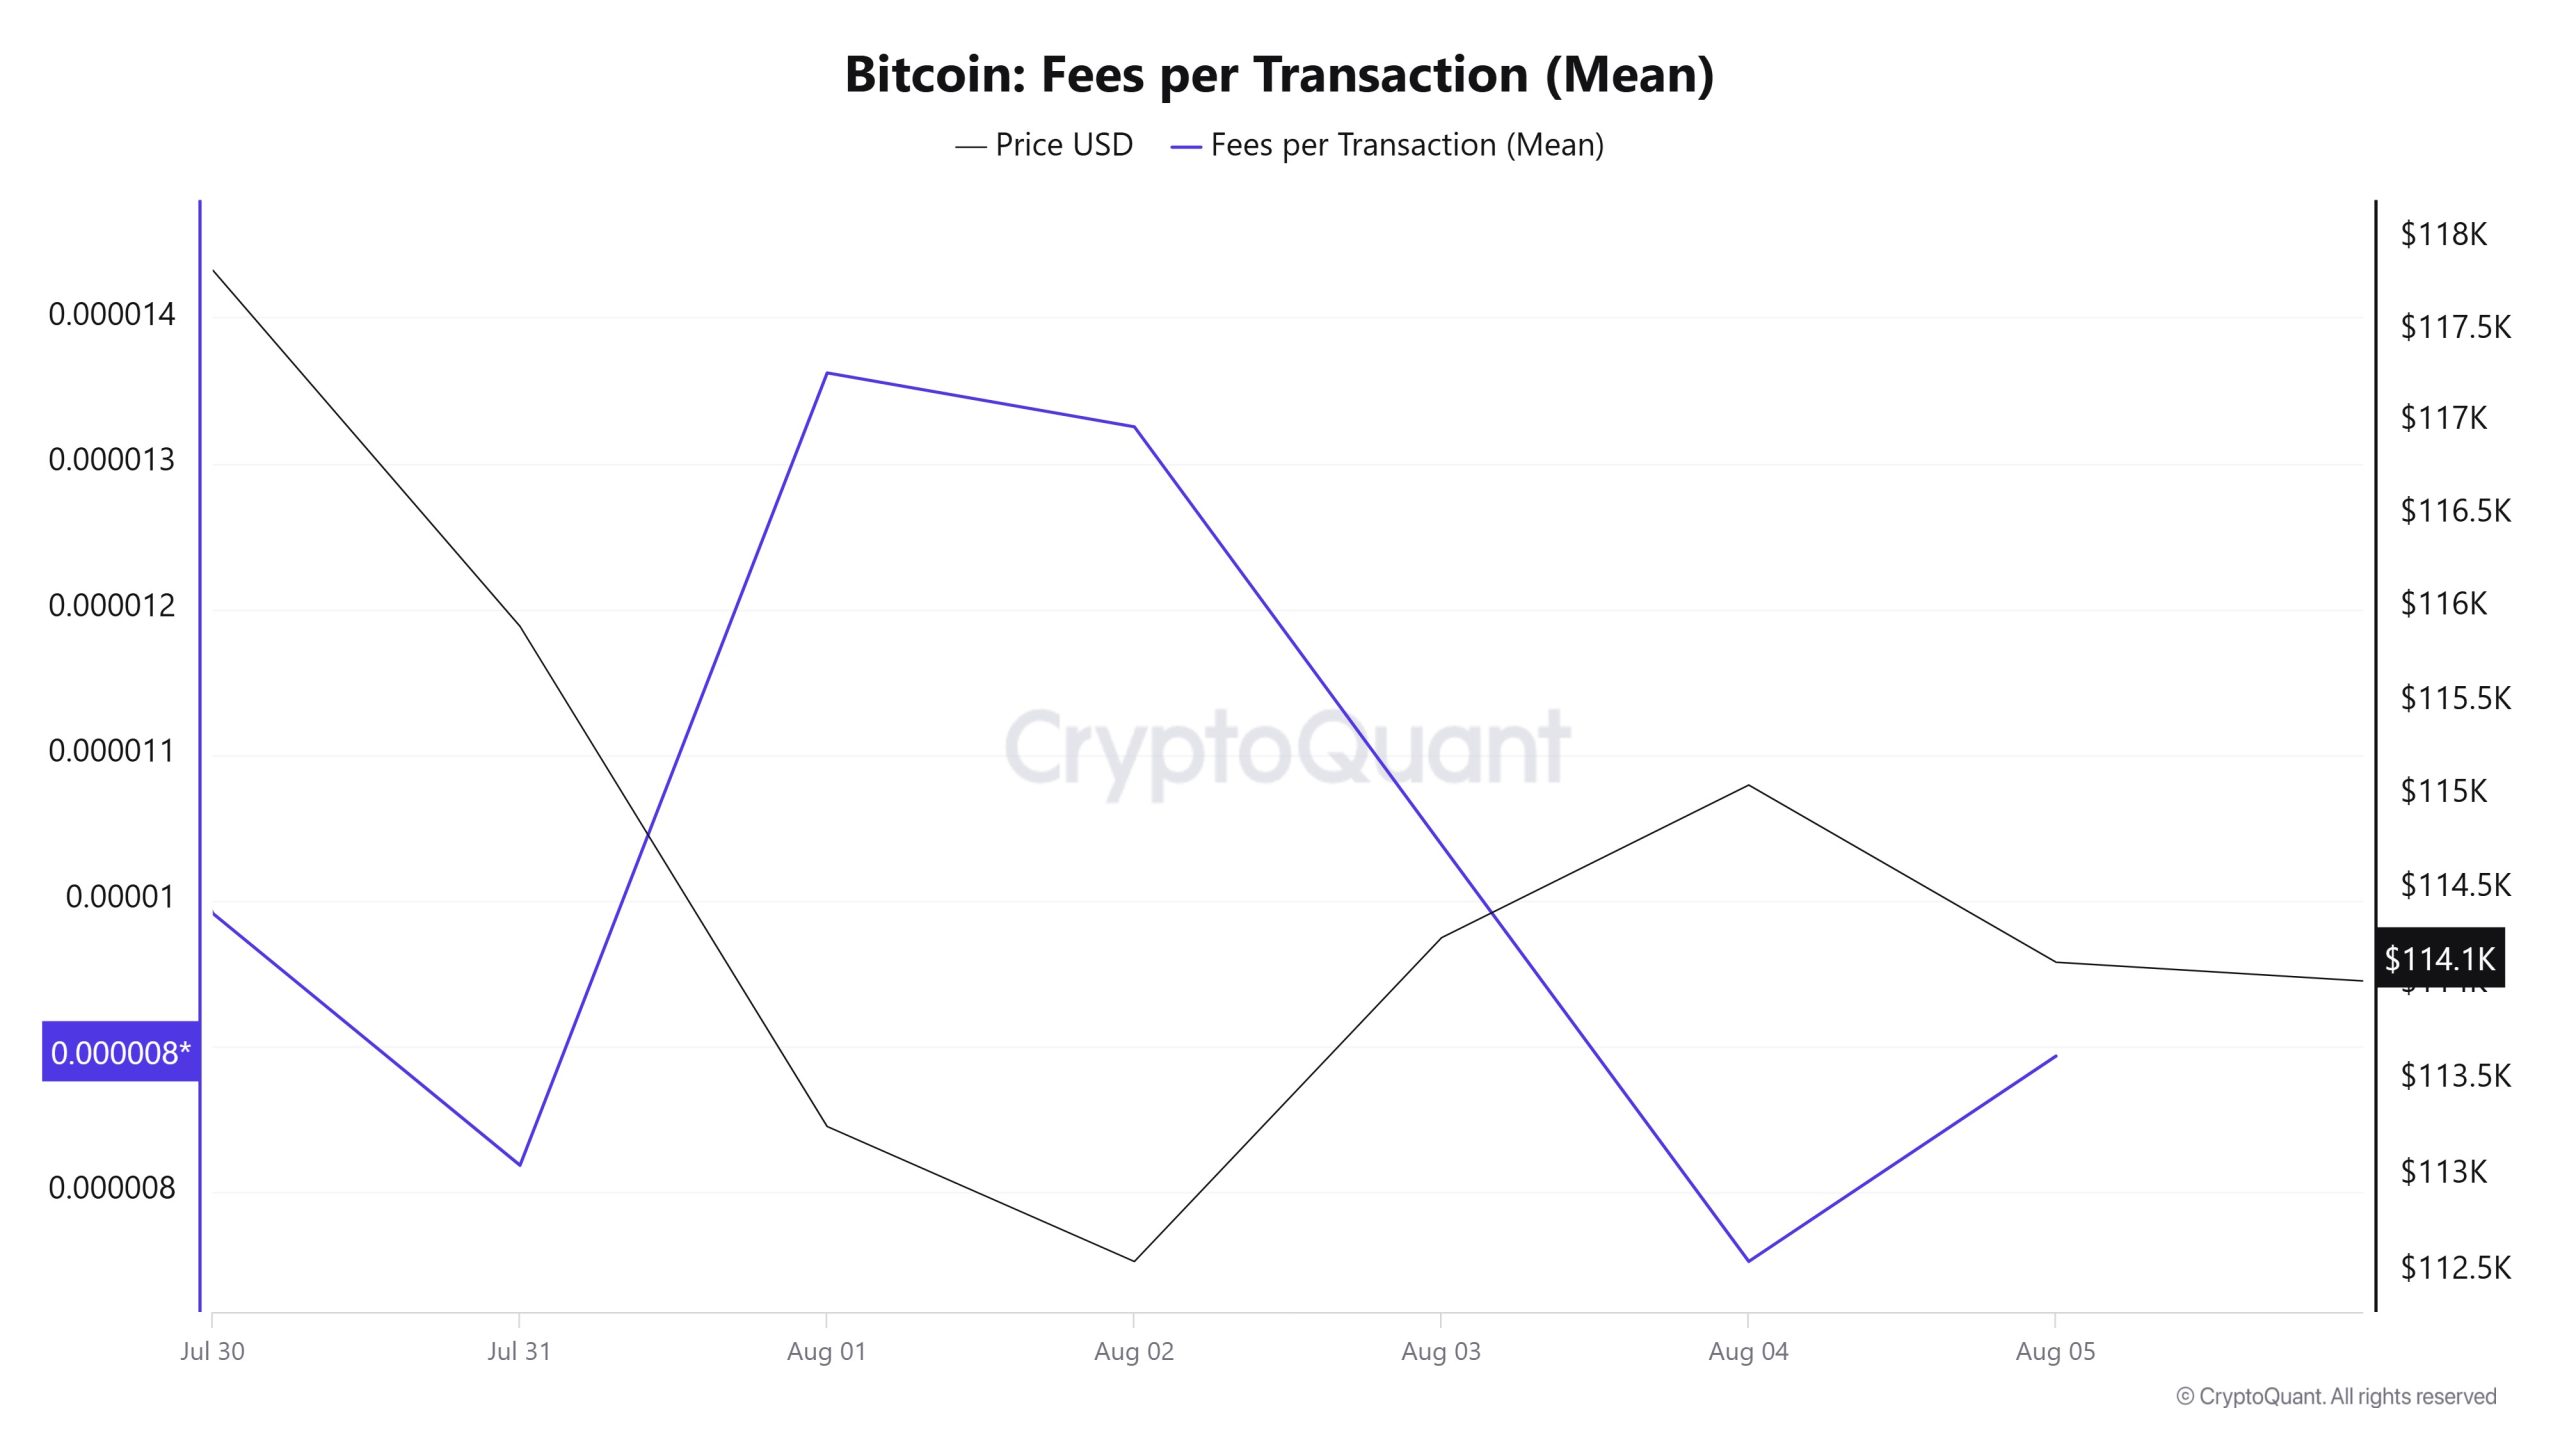
An analysis of Bitcoin Fees per Transaction (Mean) data between July 30 and August 5 shows that this indicator was at 0.00000991 on July 30, the first day of the week.
As of August 1, the value reached its peak level; after this date, a fluctuating course was observed due to the volatile movements in the Bitcoin price; As of August 4, it reached 0.00000752, reaching the lowest level of the week.
In the following days, Bitcoin Fees per Transaction (Mean) started to rise again and closed at 0.00000893 on August 5, the last day of the week.
Bitcoin: Fees (Total)
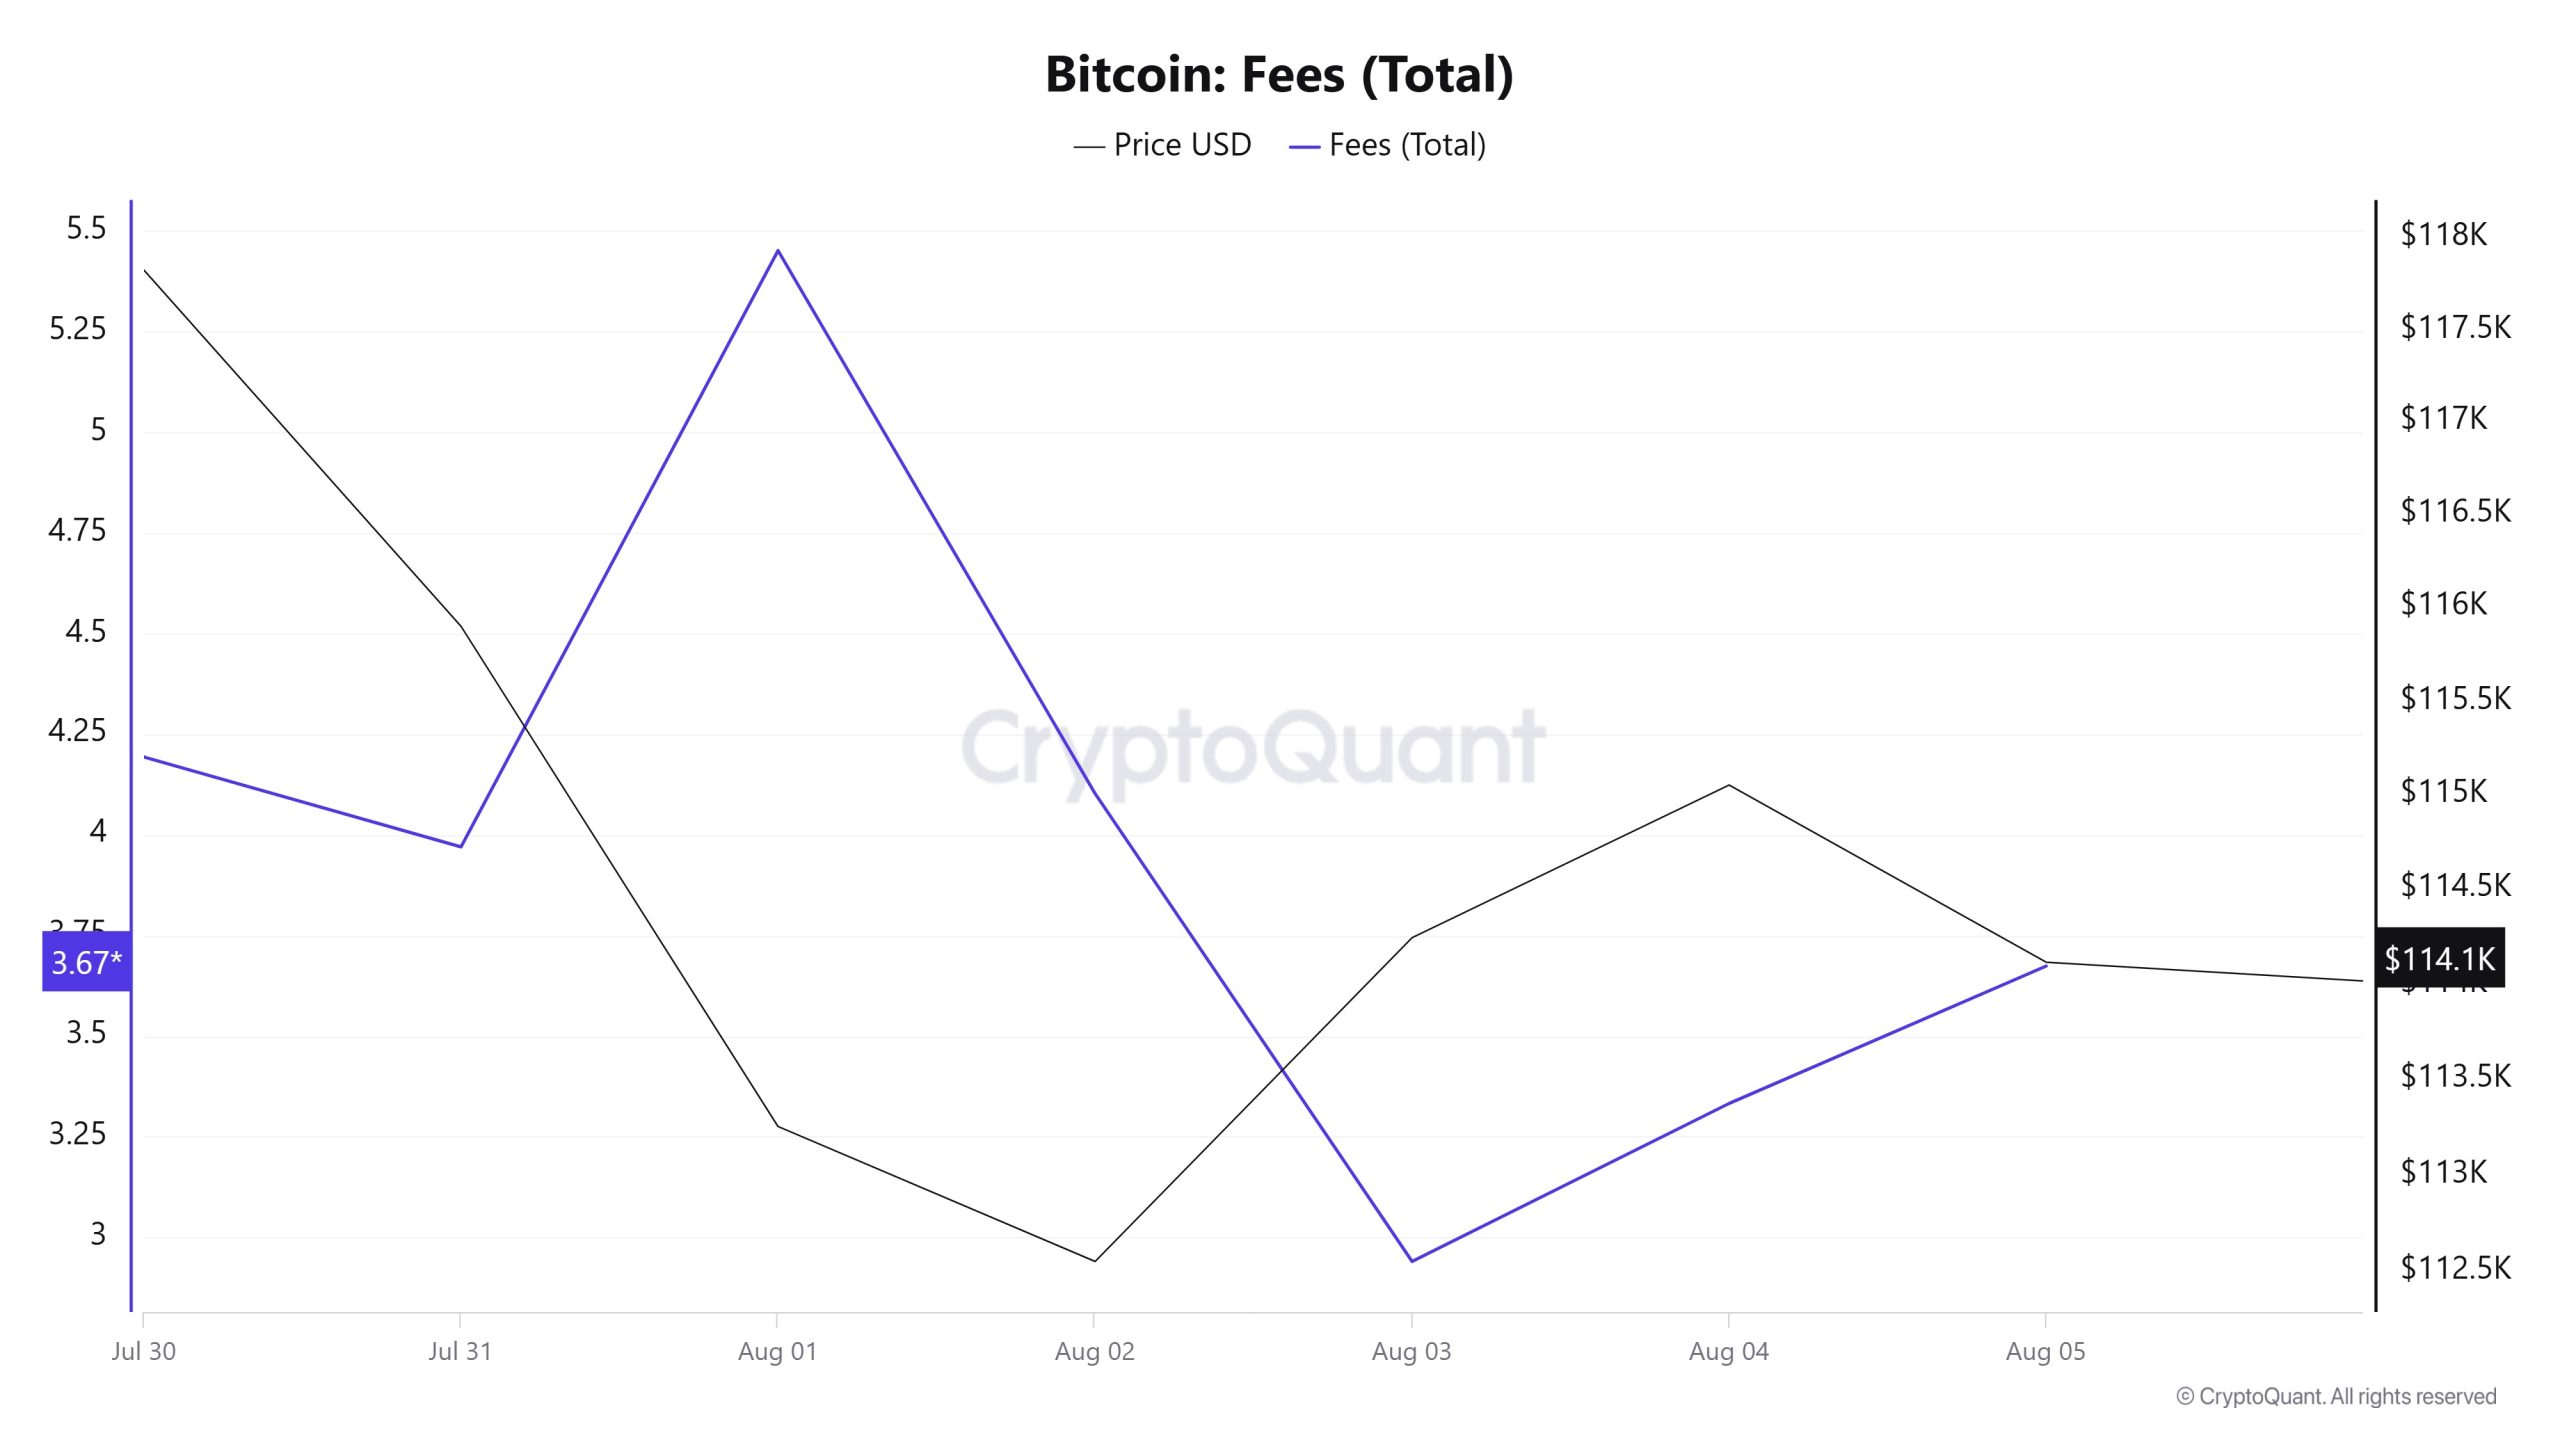
Similarly, when Bitcoin Fees (Total) data between July 30 and August 5 is analyzed, it is seen that this indicator was at 4.19322894 on July 30, the first day of the week.
As of August 1, the value reached its peak level, and after this date, a fluctuating course was observed due to the volatile movements in the Bitcoin price; As of August 3, it reached 2.9403954, reaching the lowest level of the week.
In the following days, Bitcoin Fees (Total) started to rise again and closed at 3.67403291 on August 5, the last day of the week.
Miner Flows
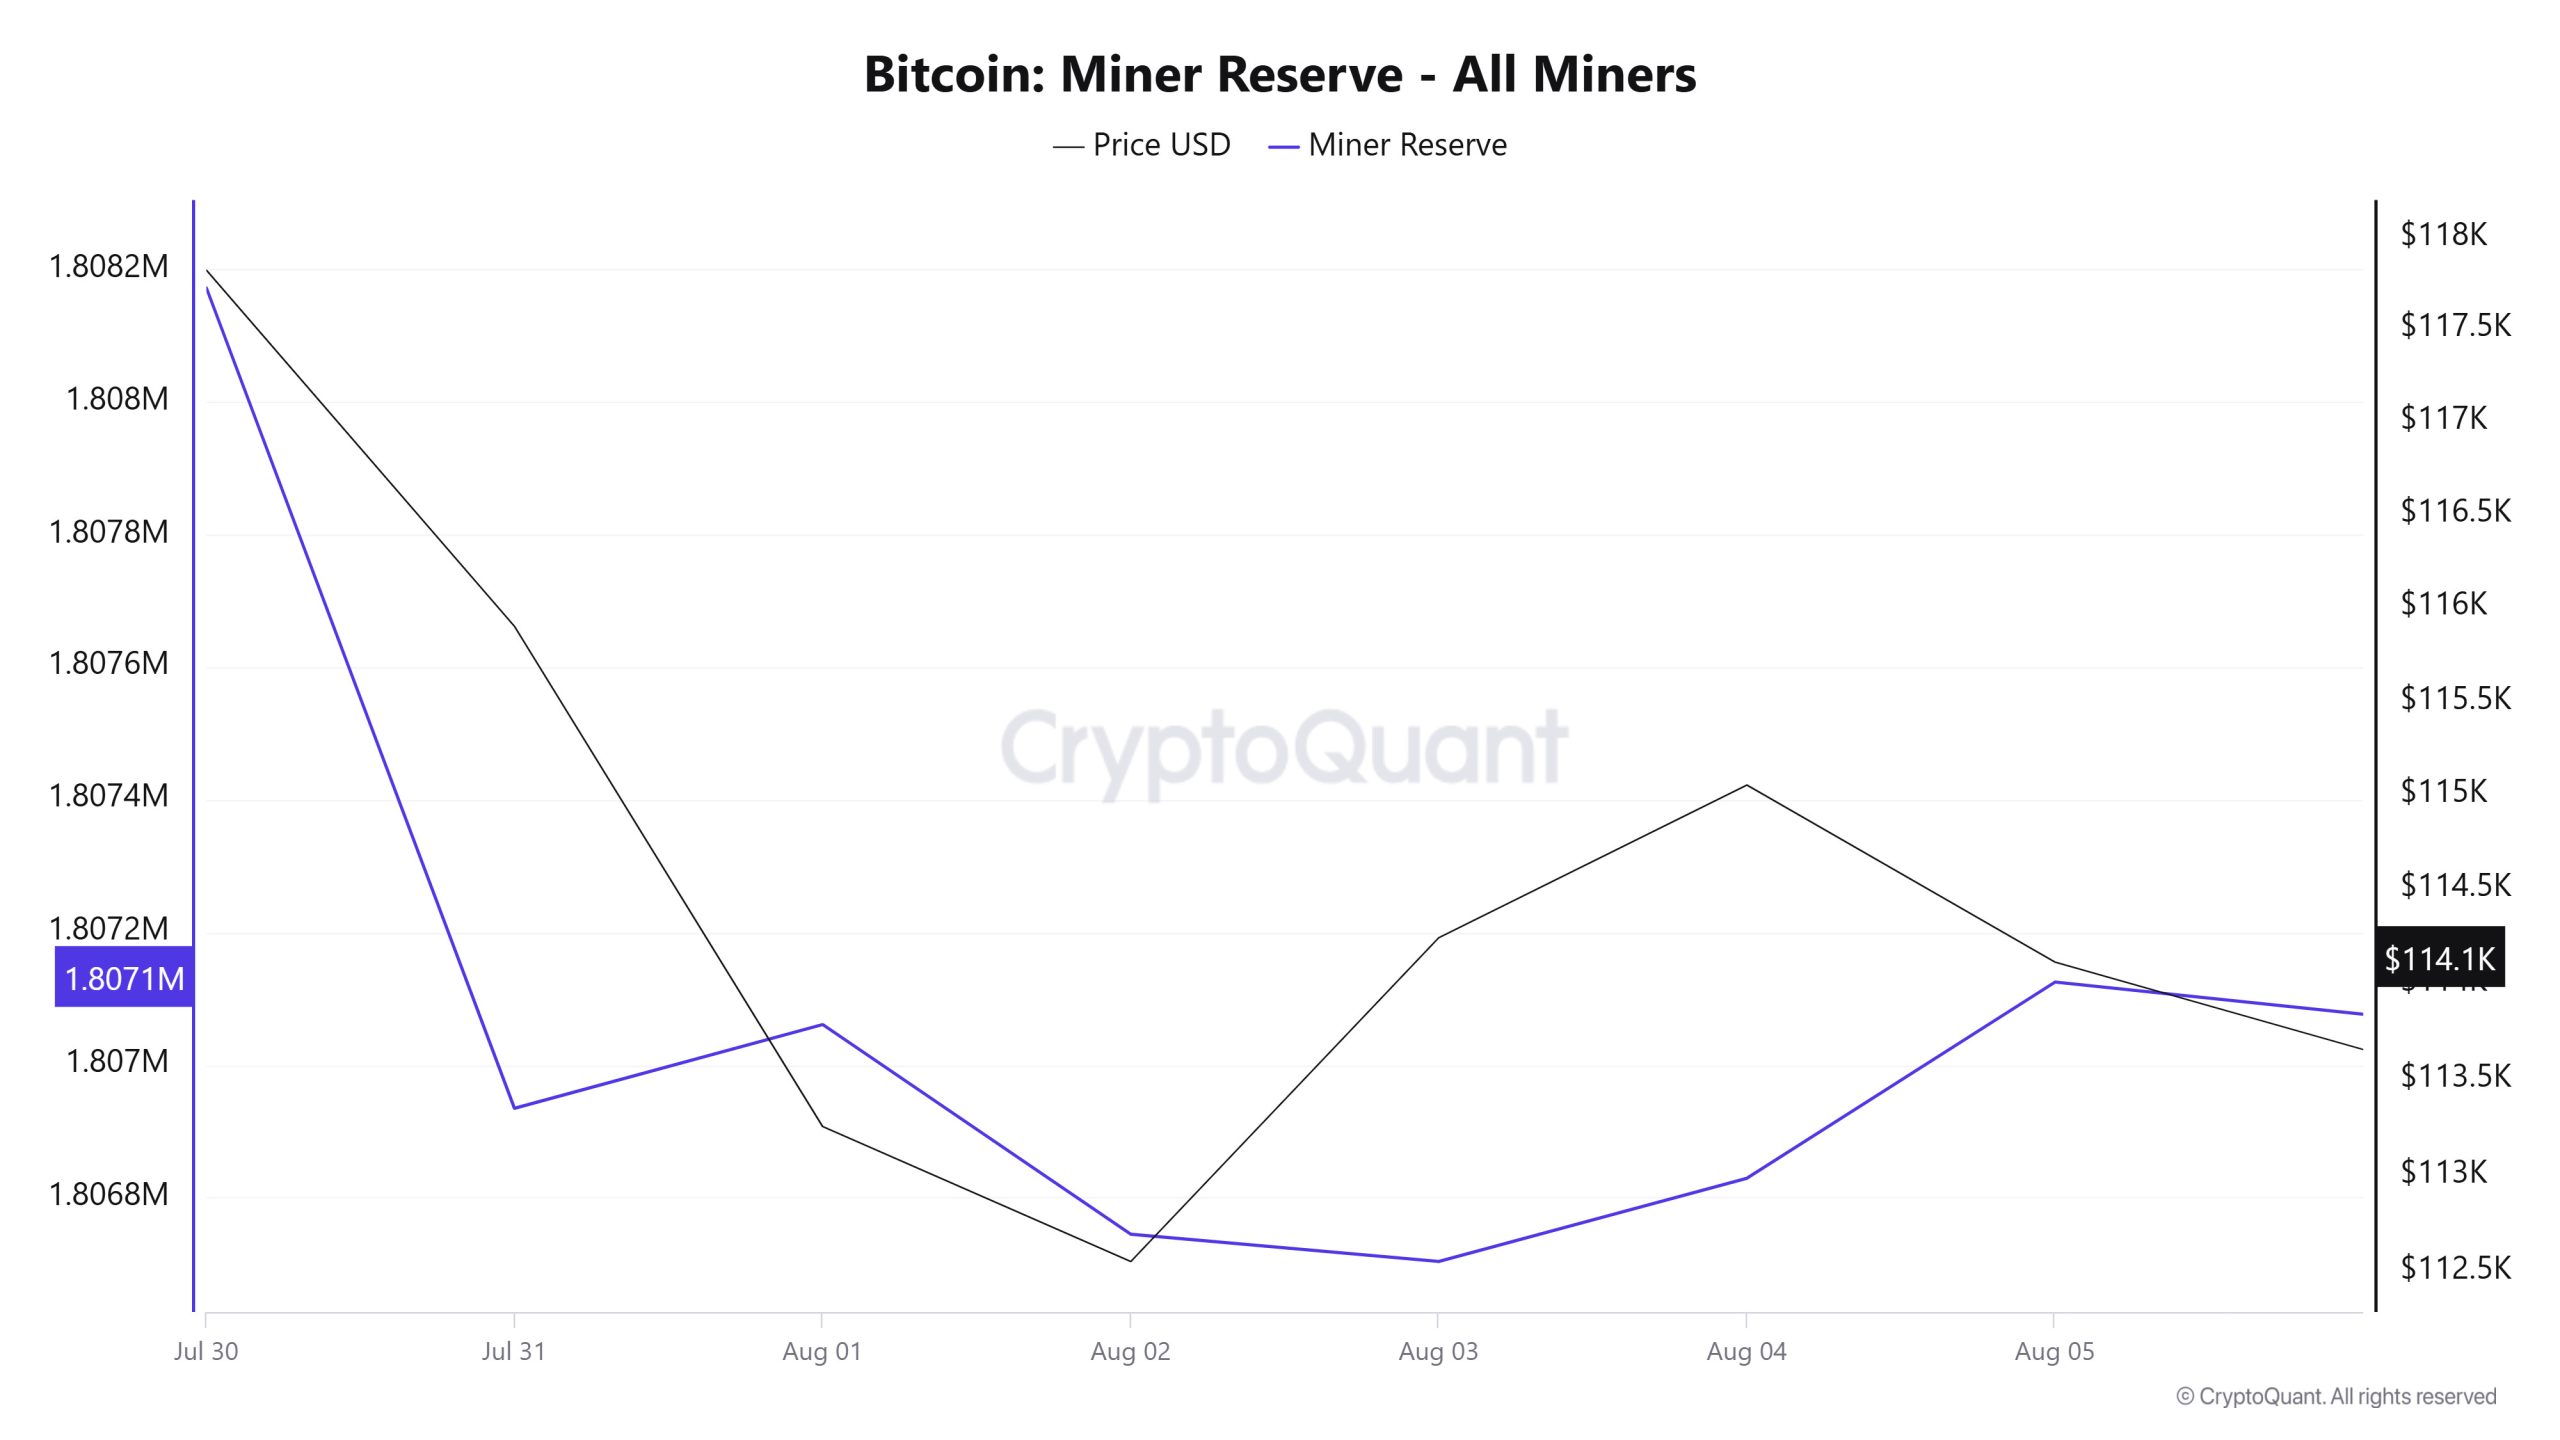
According to the data obtained from the Miner Reserve table, there has been a decrease in Bitcoin reserves held in miners’ wallets this week. A time-varying correlation structure was observed between Bitcoin price and miner reserve over the time period analyzed. However, the general trend reveals that a positive correlation between these two variables is dominant.
Miner Inflow, Outflow and NetFlow
Between July 30th and August 5th, 38,933 Bitcoins exited miners’ wallets, and 37,830 Bitcoins entered miners’ wallets between the same dates. The Miner Netflow for this week was -1,103 Bitcoin. Meanwhile, the Bitcoin price was $117,822 on July 30 and $114,114 on August 5.
For the week, the net flow (Miner Netflow) was negative as Bitcoin inflow into miner wallets (Miner Inflow) was less than Bitcoin outflow from miner wallets (Miner Outflow).
| Metric | July 30 | July 31 | Aug. 1 | Aug. 2 | Aug. 3 | Aug. 4 | Aug. 5 |
|---|---|---|---|---|---|---|---|
| Miner Inflow | 6803.90 | 4756.84 | 7486.68 | 2741.56 | 2654.64 | 7278.86 | 6107.76 |
| Miner Outflow | 6860.35 | 5994.18 | 7360.27 | 3057.89 | 2695.68 | 7153.32 | 5811.93 |
| Miner Netflow | -56.44 | -1237.35 | 126.42 | -316.34 | -41.04 | 125.54 | 295.82 |
Transaction
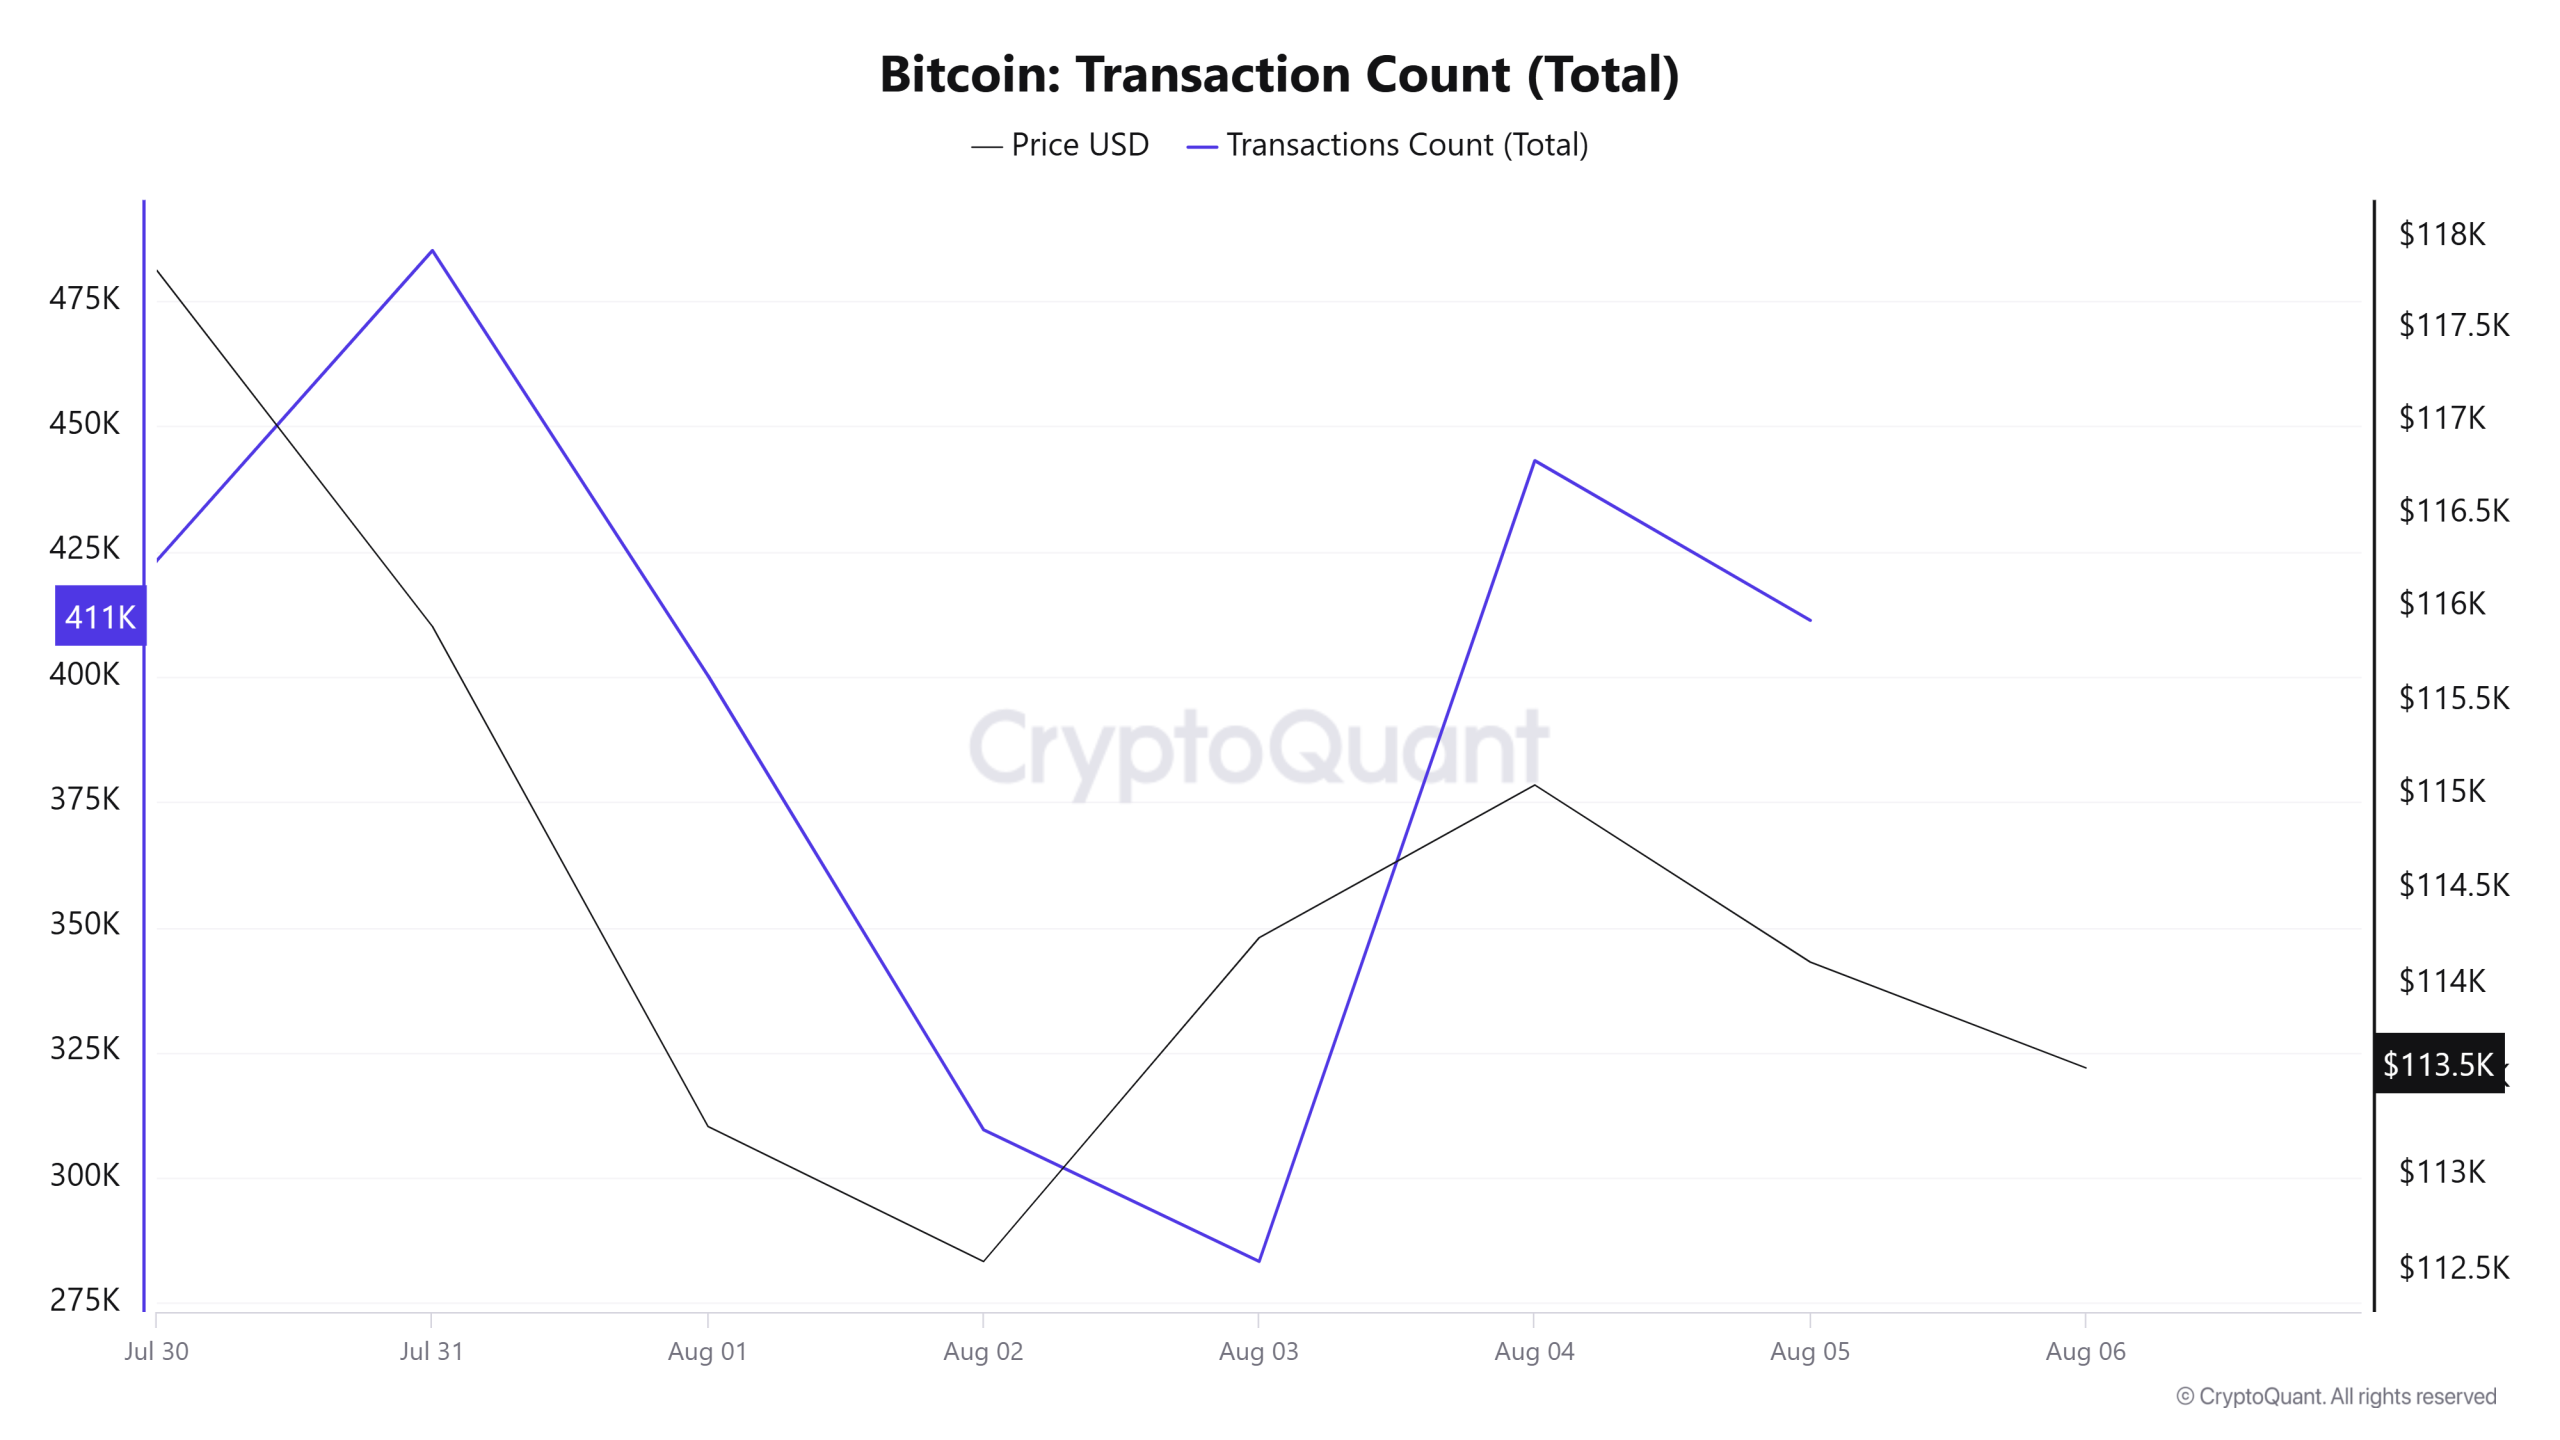
Last week, there were 3,102,662 transactions on the Bitcoin network, while this week it decreased by about 11.16% to 2,755,804. The 485,061 transactions recorded on July 31 marked the highest transaction volume of the week, while the lowest number of transactions was 283,324 on August 3.
Throughout the week, the correlation between the BTC price and the number of transactions was mixed, changing direction from time to time, but the overall trend was weighted in the positive direction. This suggests that price-based movements on the network are supported by sales.
On the other hand, there was a significant decrease in the total number of transactions compared to the previous week, suggesting that the overall activity on the network is relatively negative. This type of network behavior strengthens the likelihood that the BTC price will fall in the coming short term.
Tokens Transferred
While 4,439,050 BTC was transferred last week, this week this figure decreased by approximately 5.43% to 4,198,224 BTC. August 1 saw the highest transfer volume of the week with 764,543 BTC, while August 3 saw the lowest volume of the week with 464,773 BTC. Throughout the week, stable correlations were observed between the volume of transfers on the network and the BTC price. This suggests that transfers on the network are trying to maintain a balance of buying and selling.
Whale Activities
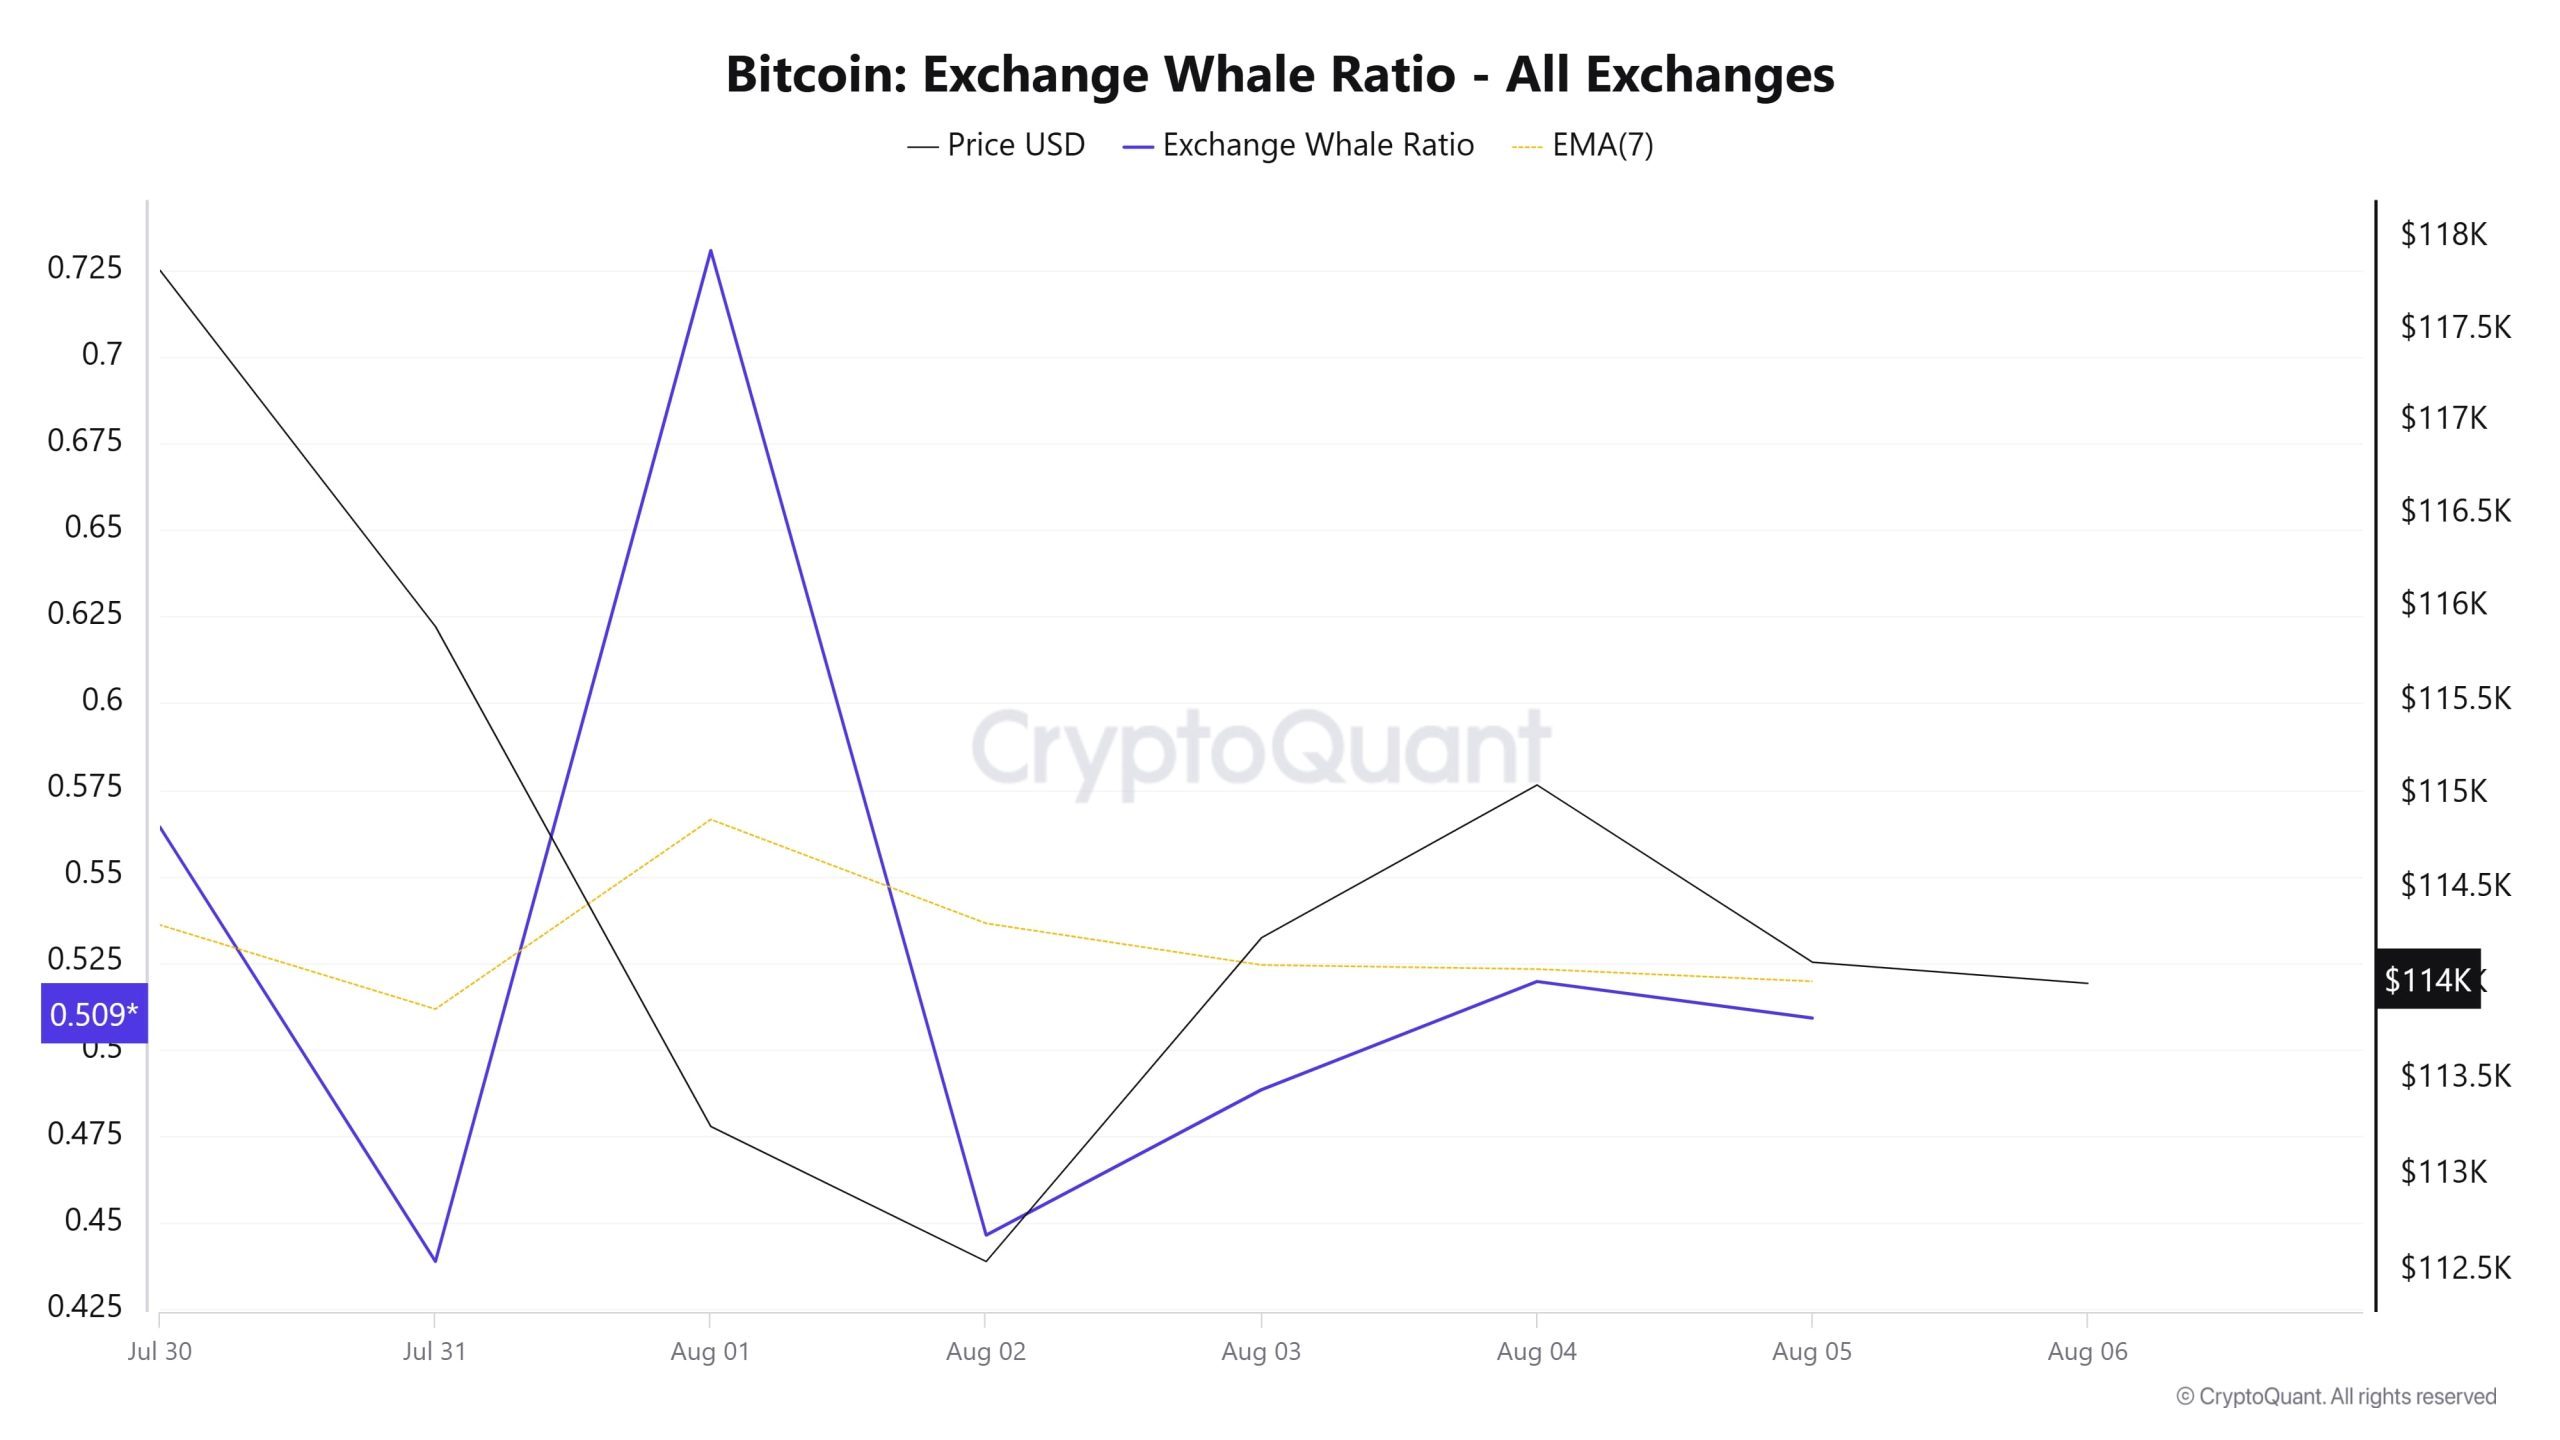
Whales Data
Over the last 7 days, according to data from the cryptocurrency market, whale activity on the central exchange fluctuated at the beginning and middle of the period. Towards the end of the process, these activities declined. When we look at the Exchange Whale Ratio metric, the rate of whales using central exchanges was 0.564 on July 30, the first day of the 7-day period. The lowest point of the process took place on July 31 and the value was 0.438. When this ratio is above 0.35, it usually means that whales use central exchanges frequently. On August 1, it reached a high of 0.730 and BTC fell as low as $113,000. The metric, which currently has a value of 0.509, remained in the middle of the process. BTC has been stuck between 119,000 and 112,000 during this period. This shows that whales or institutions are using centralized exchanges to set direction, but a narrow band of competition continues to consolidate the price. At the same time, it is seen that 4,198,224 BTC moved in total BTC transfer, showing a decrease of about 6% compared to last week. When we look at the data, the addresses of collectors holding 100 to 1,000 BTC in their wallets continued to grow compared to last week and reached a record high. At 15,812, it stands out as the highest number of addresses ever. This shows that lower actors are also in play, except for whales and institutions. As a result, it shows us that there is a balanced struggle in the collision of bulls and bears, BTC is priced in a narrow band and can remain in this band unless the balance changes.
BTC Onchain Overall
| Metric | Positive 📈 | Negative 📉 | Neutral ➖ |
|---|---|---|---|
| Active Addresses | ✓ | ||
| Breakdowns | ✓ | ||
| Derivatives | ✓ | ||
| Supply Distribution | ✓ | ||
| Exchange Supply Ratio | ✓ | ||
| Exchange Reserve | ✓ | ||
| Fees and Revenues | ✓ | ||
| Miner Flows | ✓ | ||
| Transaction | ✓ | ||
| Whale Activities | ✓ |
*The metrics and guidance in the table do not, in and of themselves, describe or imply an expectation of future price changes for any asset. The prices of digital assets may vary depending on many different variables. The onchain analysis and related guidance are intended to assist investors in their decision-making process, and making financial investments based solely on the results of this analysis may result in harmful transactions. Even if all metrics produce a positive, negative or neutral result at the same time, the expected results may not be seen according to market conditions. Investors reviewing the report would be well advised to heed these caveats.
Legal Notice
The investment information, comments and recommendations contained in this document do not constitute investment advisory services. Investment advisory services are provided by authorized institutions on a personal basis, taking into account the risk and return preferences of individuals. The comments and recommendations contained in this document are of a general type. These recommendations may not be suitable for your financial situation and risk and return preferences. Therefore, making an investment decision based solely on the information contained in this document may not result in results that are in line with your expectations.
NOTE: All data used in Bitcoin onchain analysis is based on Cryptoqaunt.
