Weekly Ethereum Onchain Report – September 10
Active Addresses
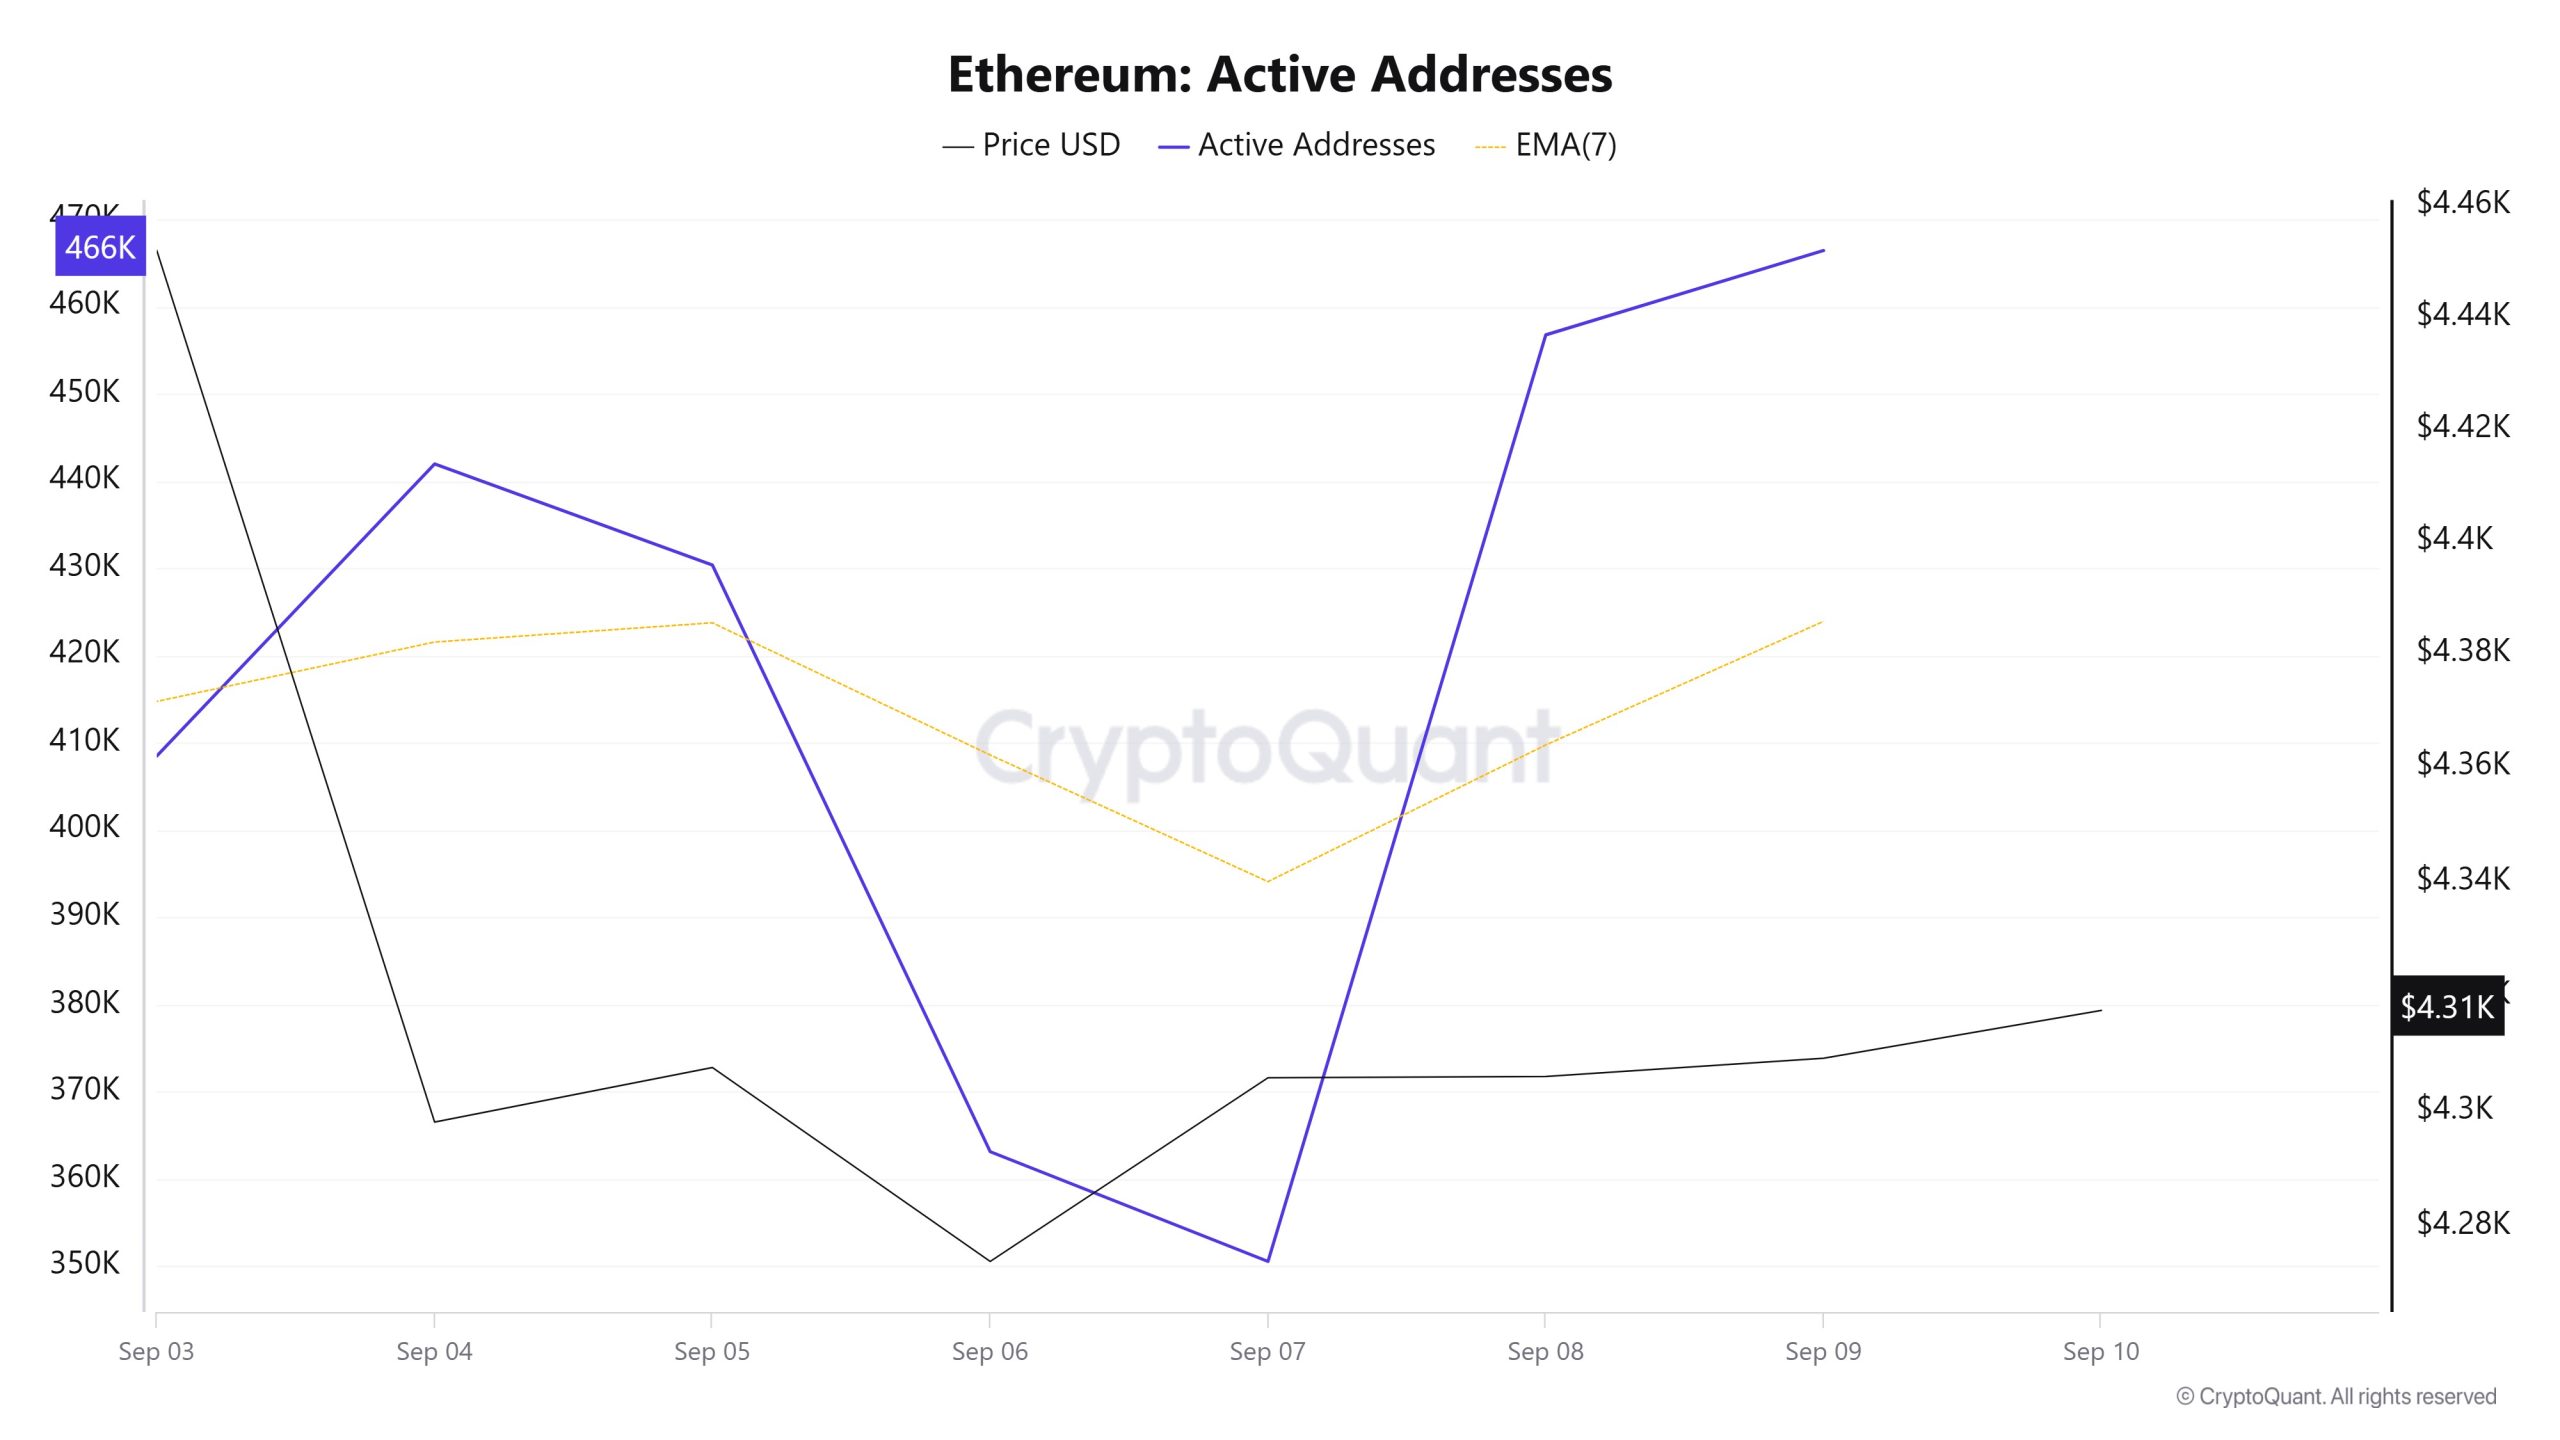
Between September 3 and September 10, a total of 466,408 active addresses entered the Ethereum network. During this period, the Ethereum price dropped from $4,451 to $4,273. Especially on September 5, at the intersection of the price and the number of active addresses, the number of active addresses continued to fall while the price point remained flat. When the 7-day simple moving average (SMA) is analyzed, it is seen that the Ethereum price is generally consolidating horizontally.
Active Sending Addresses
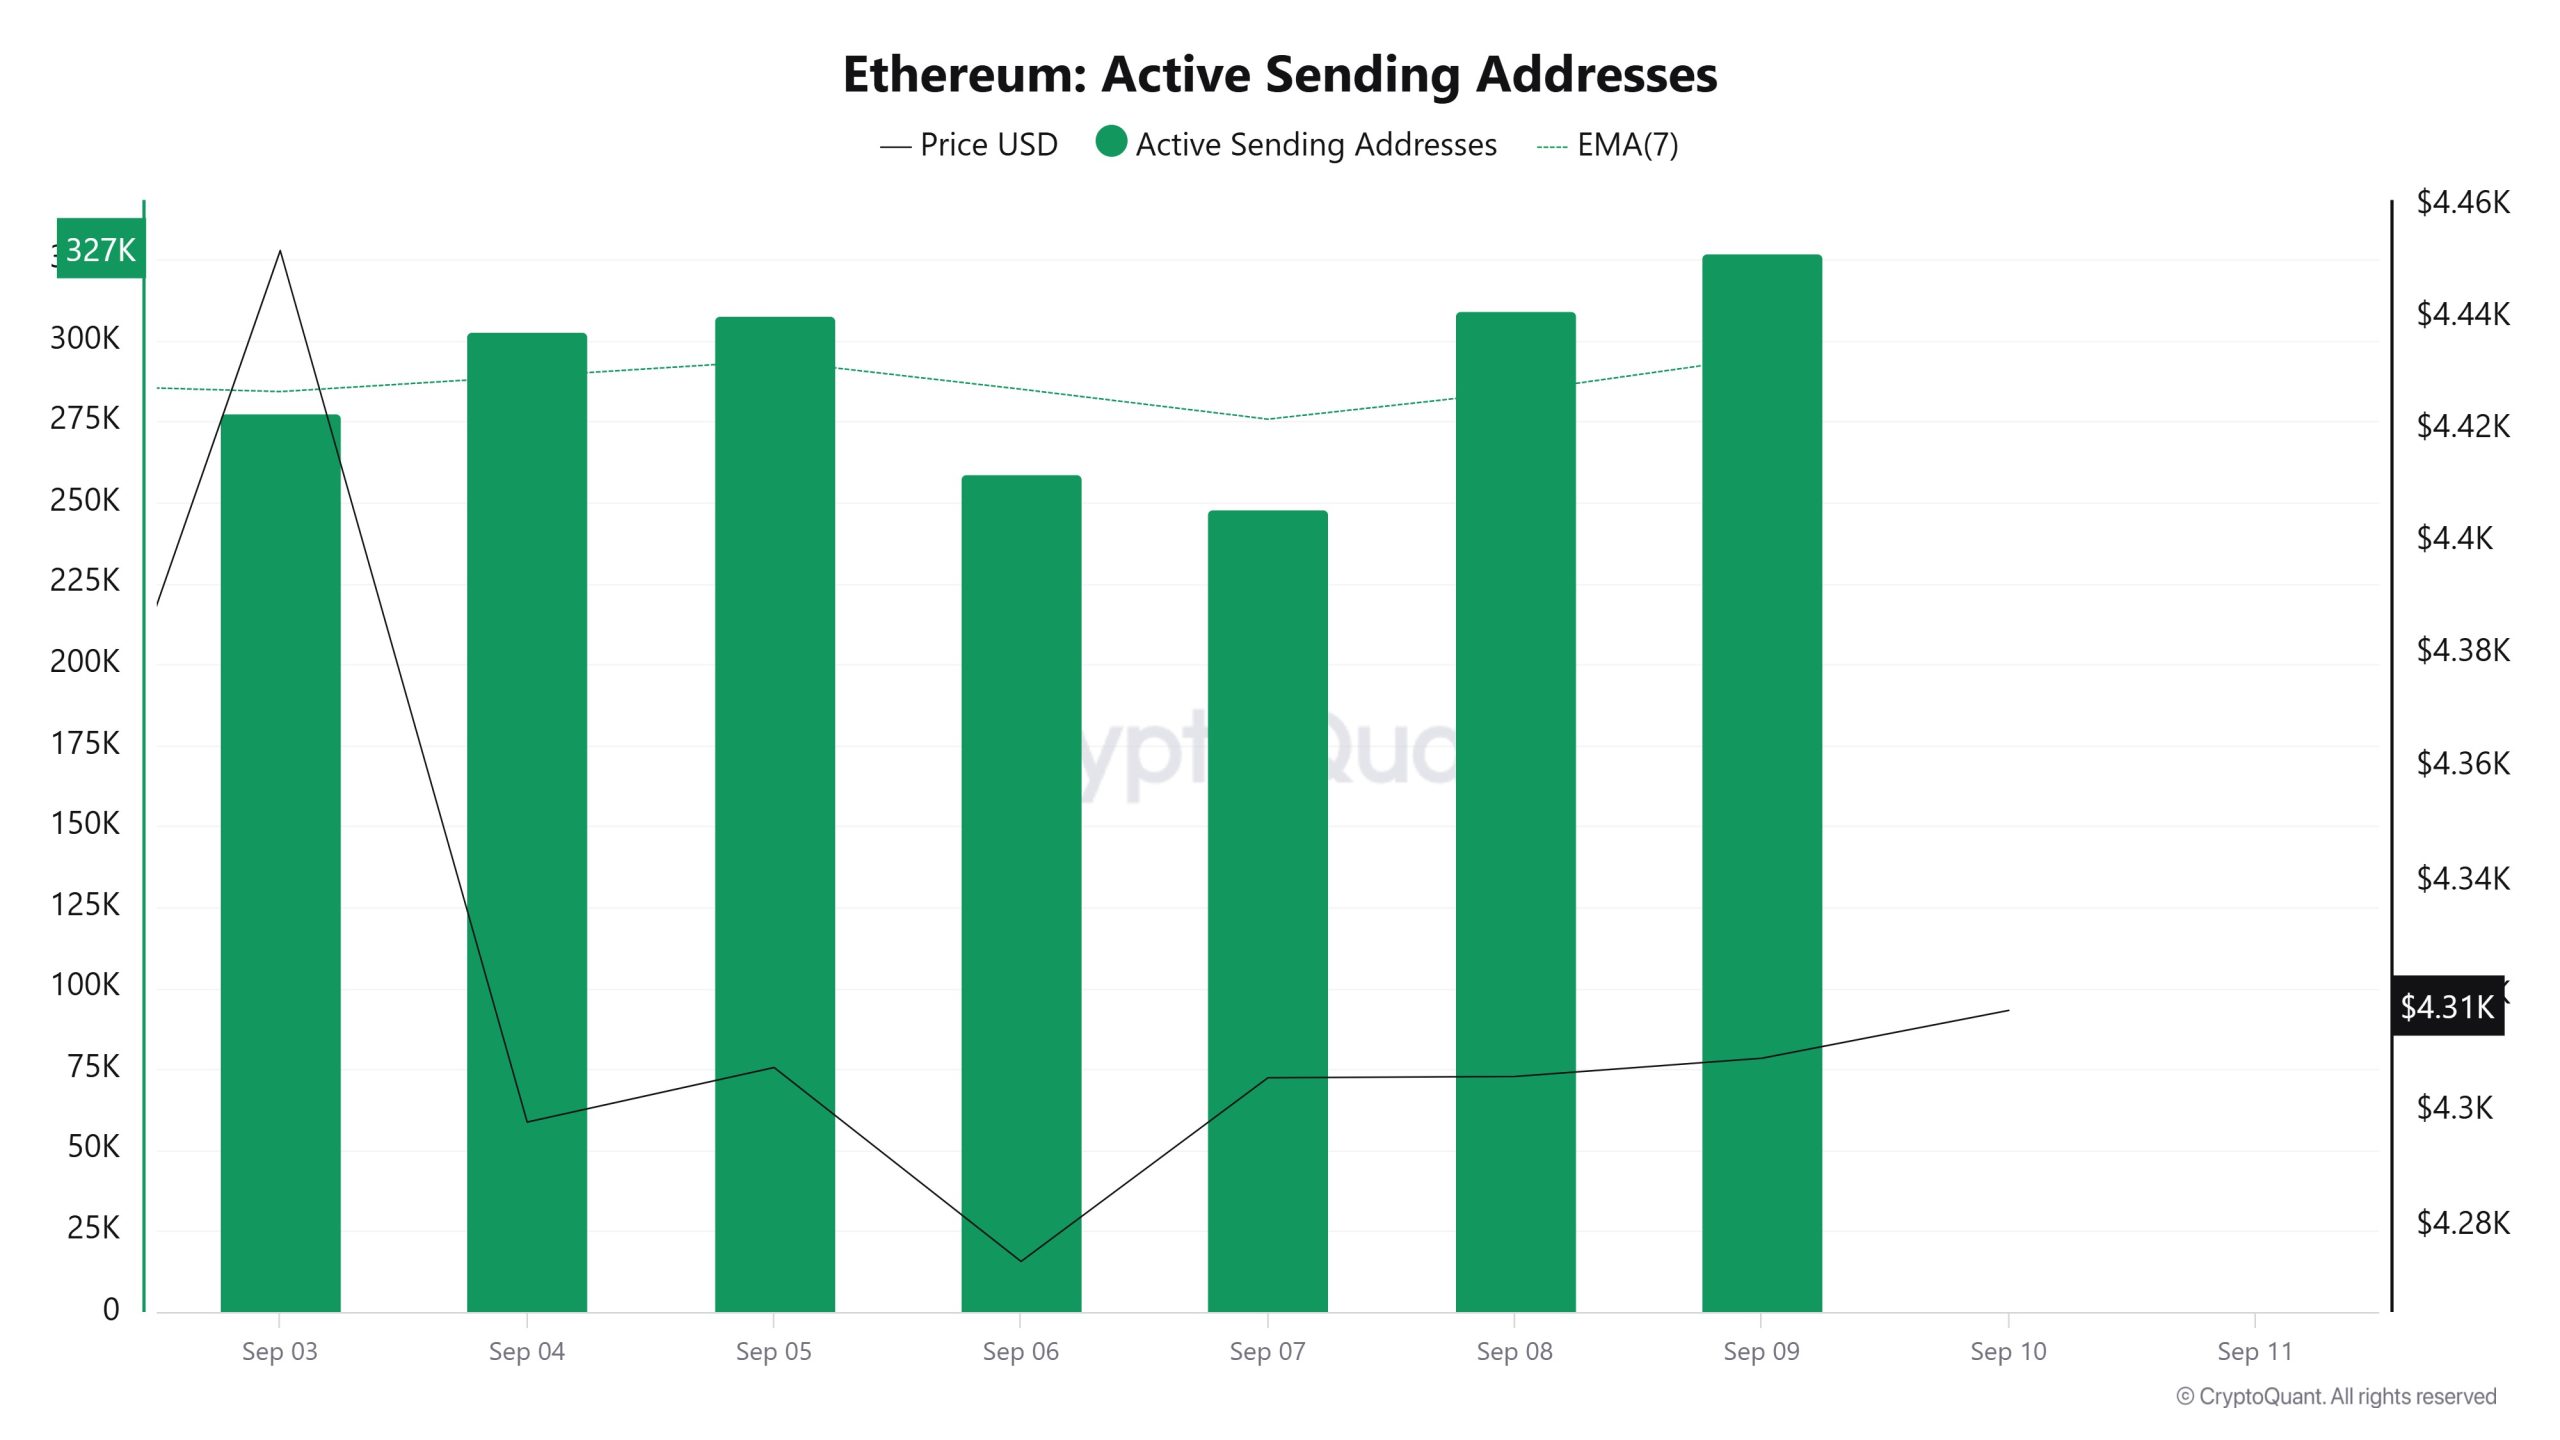
Between September 3 and September 10, a sideways movement was observed in active shipping addresses along with the Black Line (price line). On the day when the price reached a weekly high, active shipping addresses were observed at 327,078.
Active Receiving Addresses
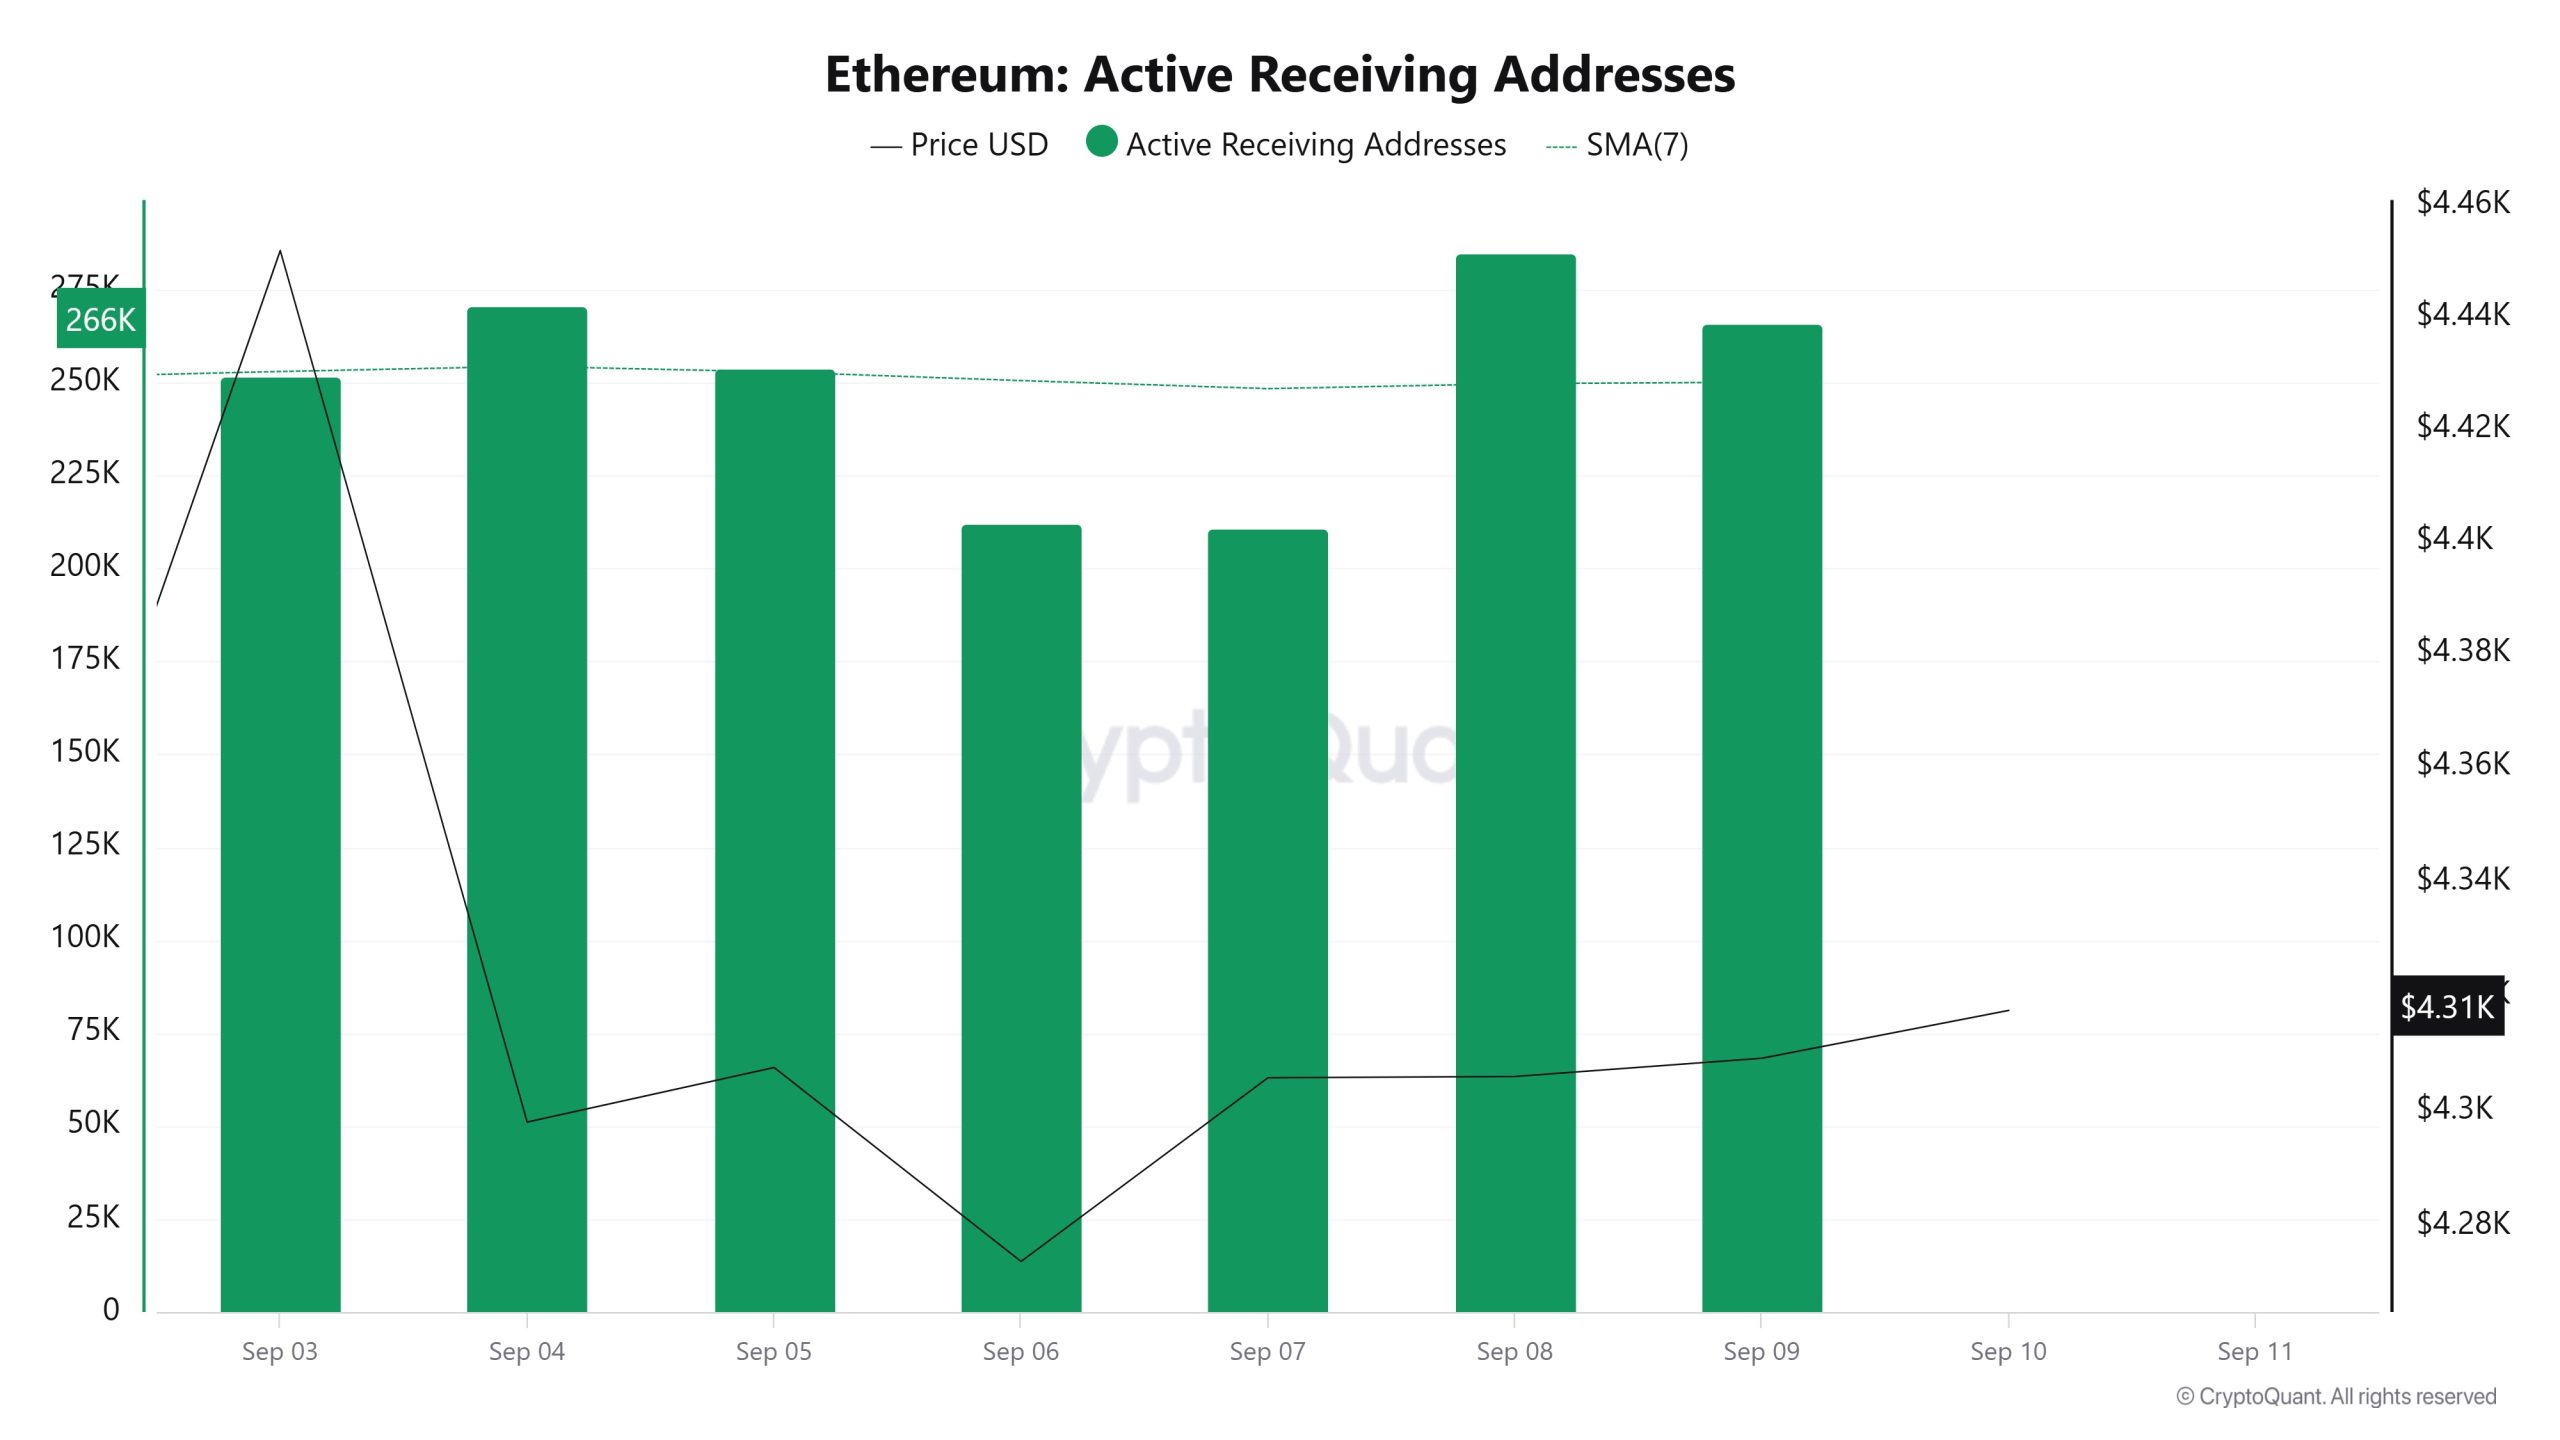
Between September 3 and September 10, the price consolidated horizontally while the active buying addresses increased. On the day when the price reached its highest level, the active receiving addresses reached up to 284,856 levels, indicating that sales were predominant.
Total Value Staked
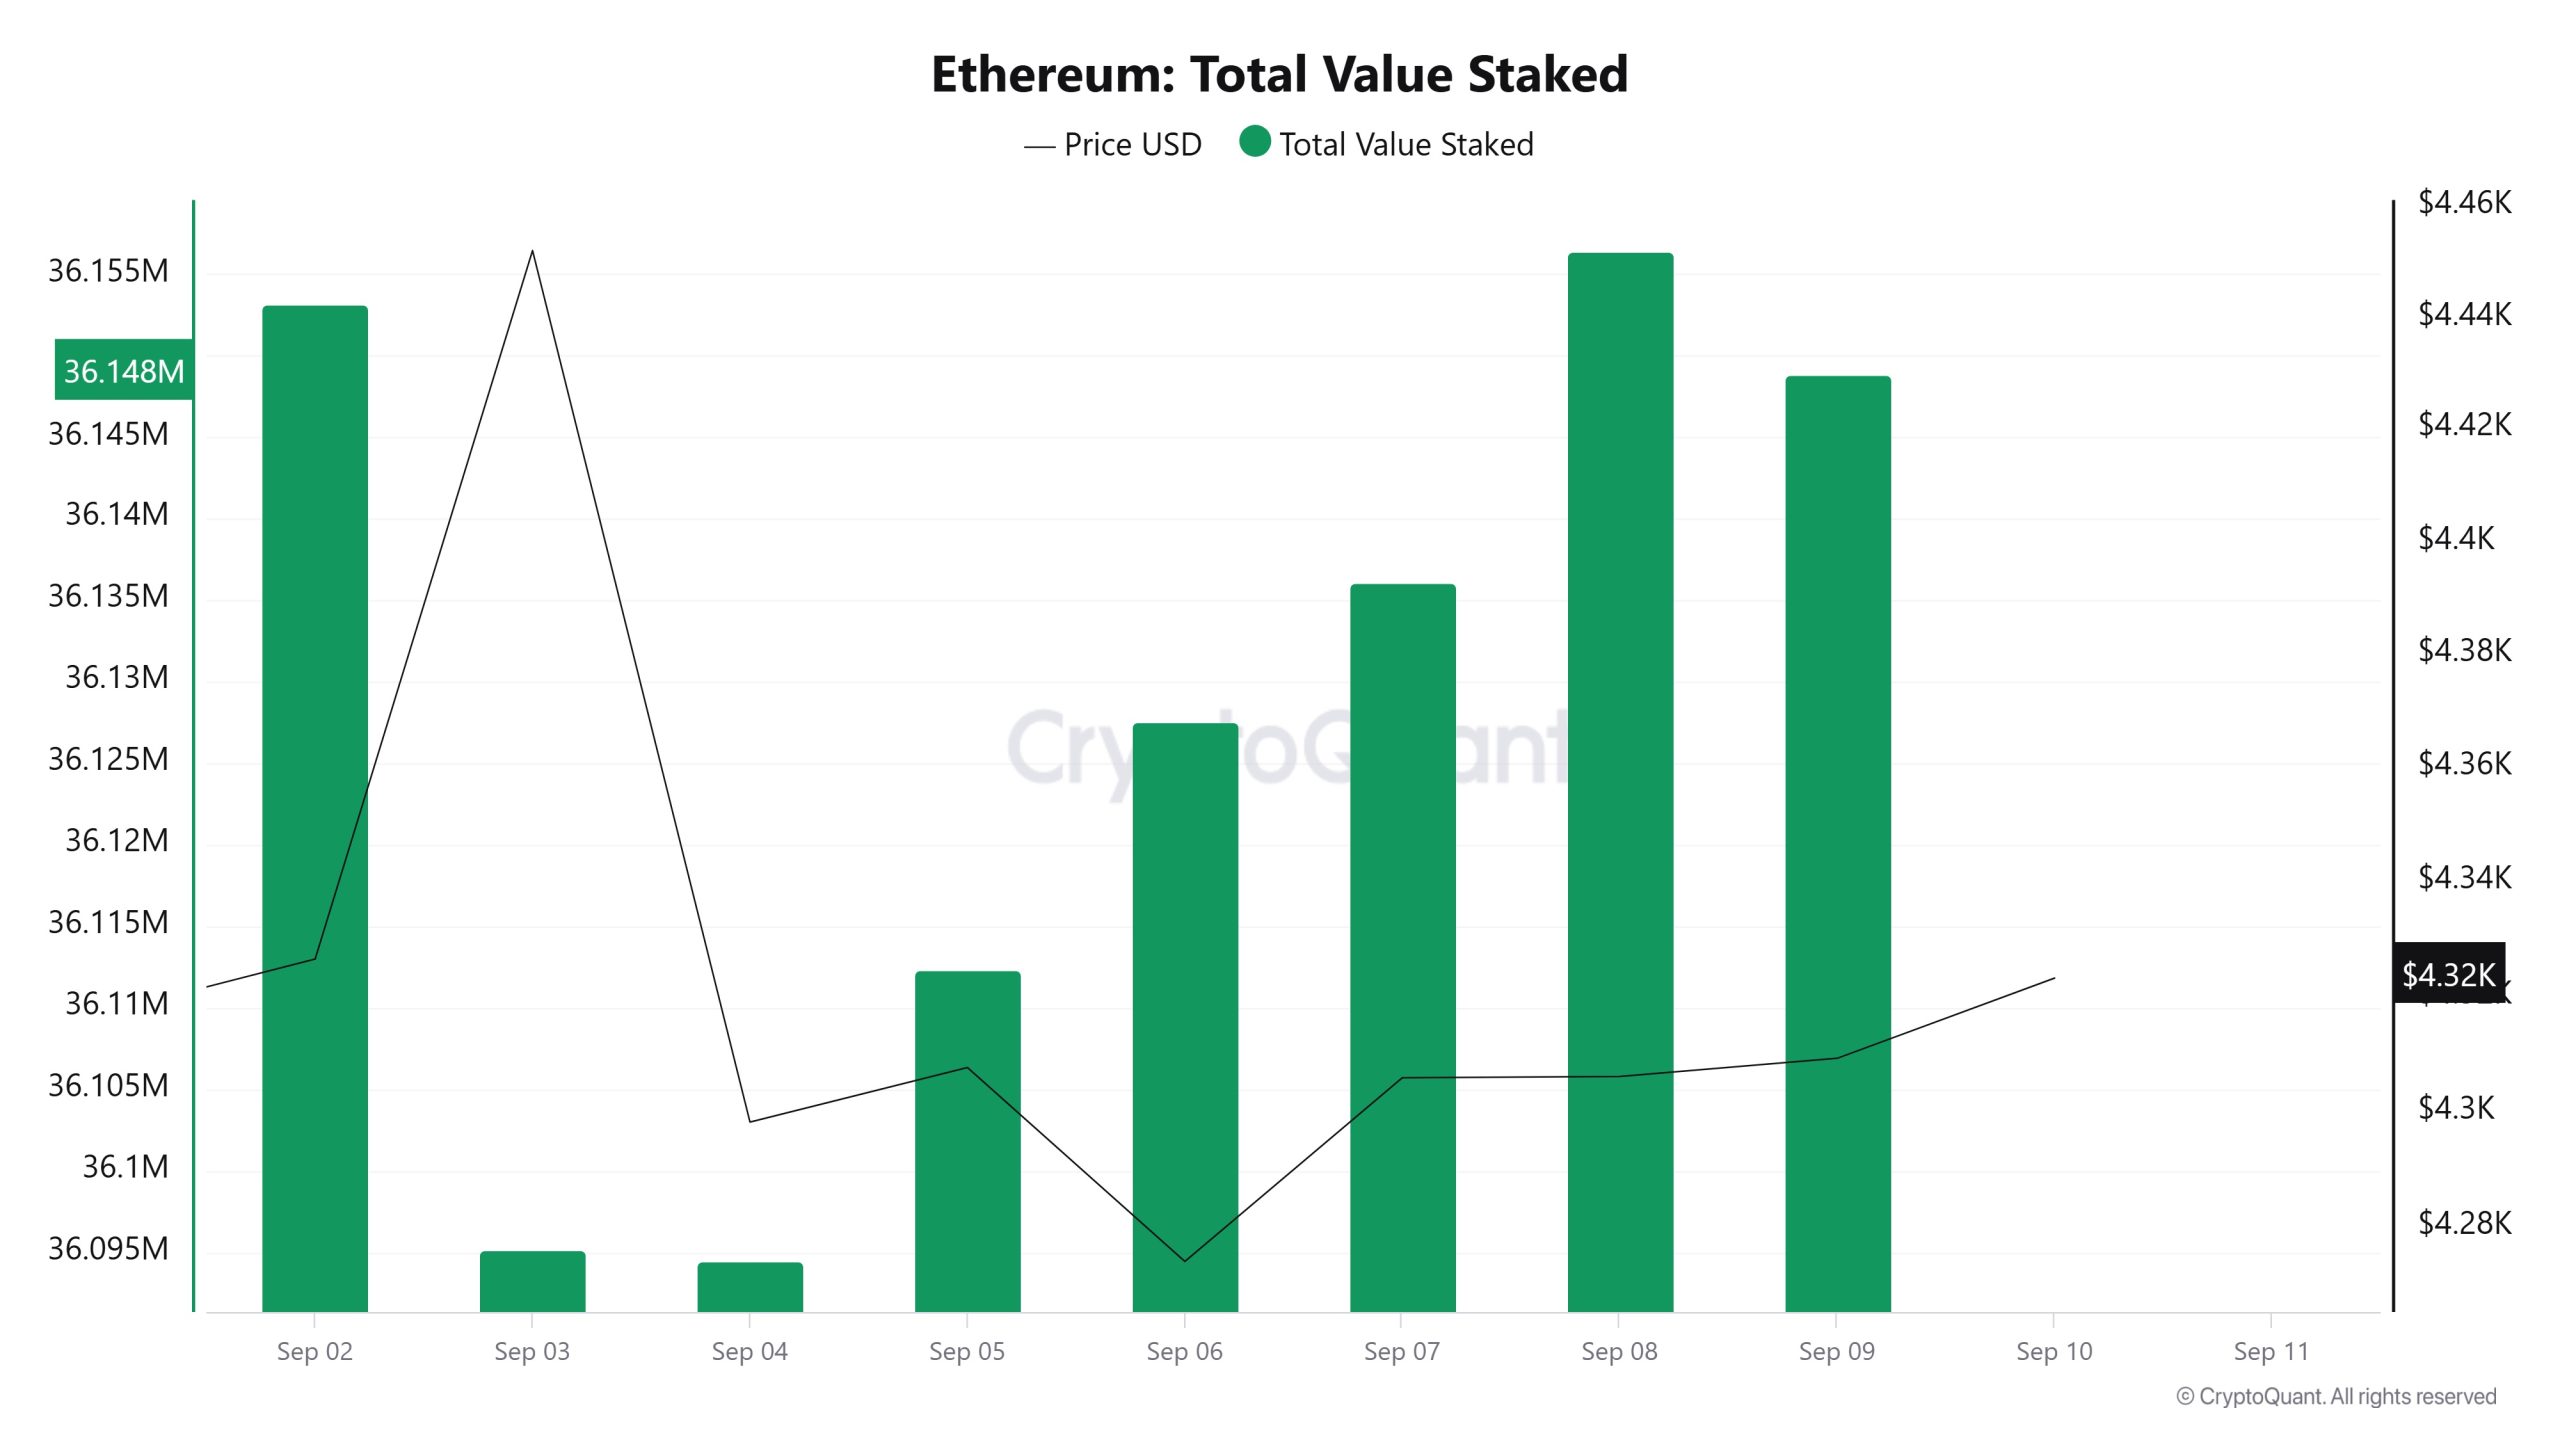
On September 3, ETH price was at $4.451 while Total Value Staked was at 36,095,162.
As of September 9, the ETH price fell to $4,309, a decrease of 3.19%, while Total Value Staked rose to 36,148,793, an increase of 0.15%.
Staking Inflows
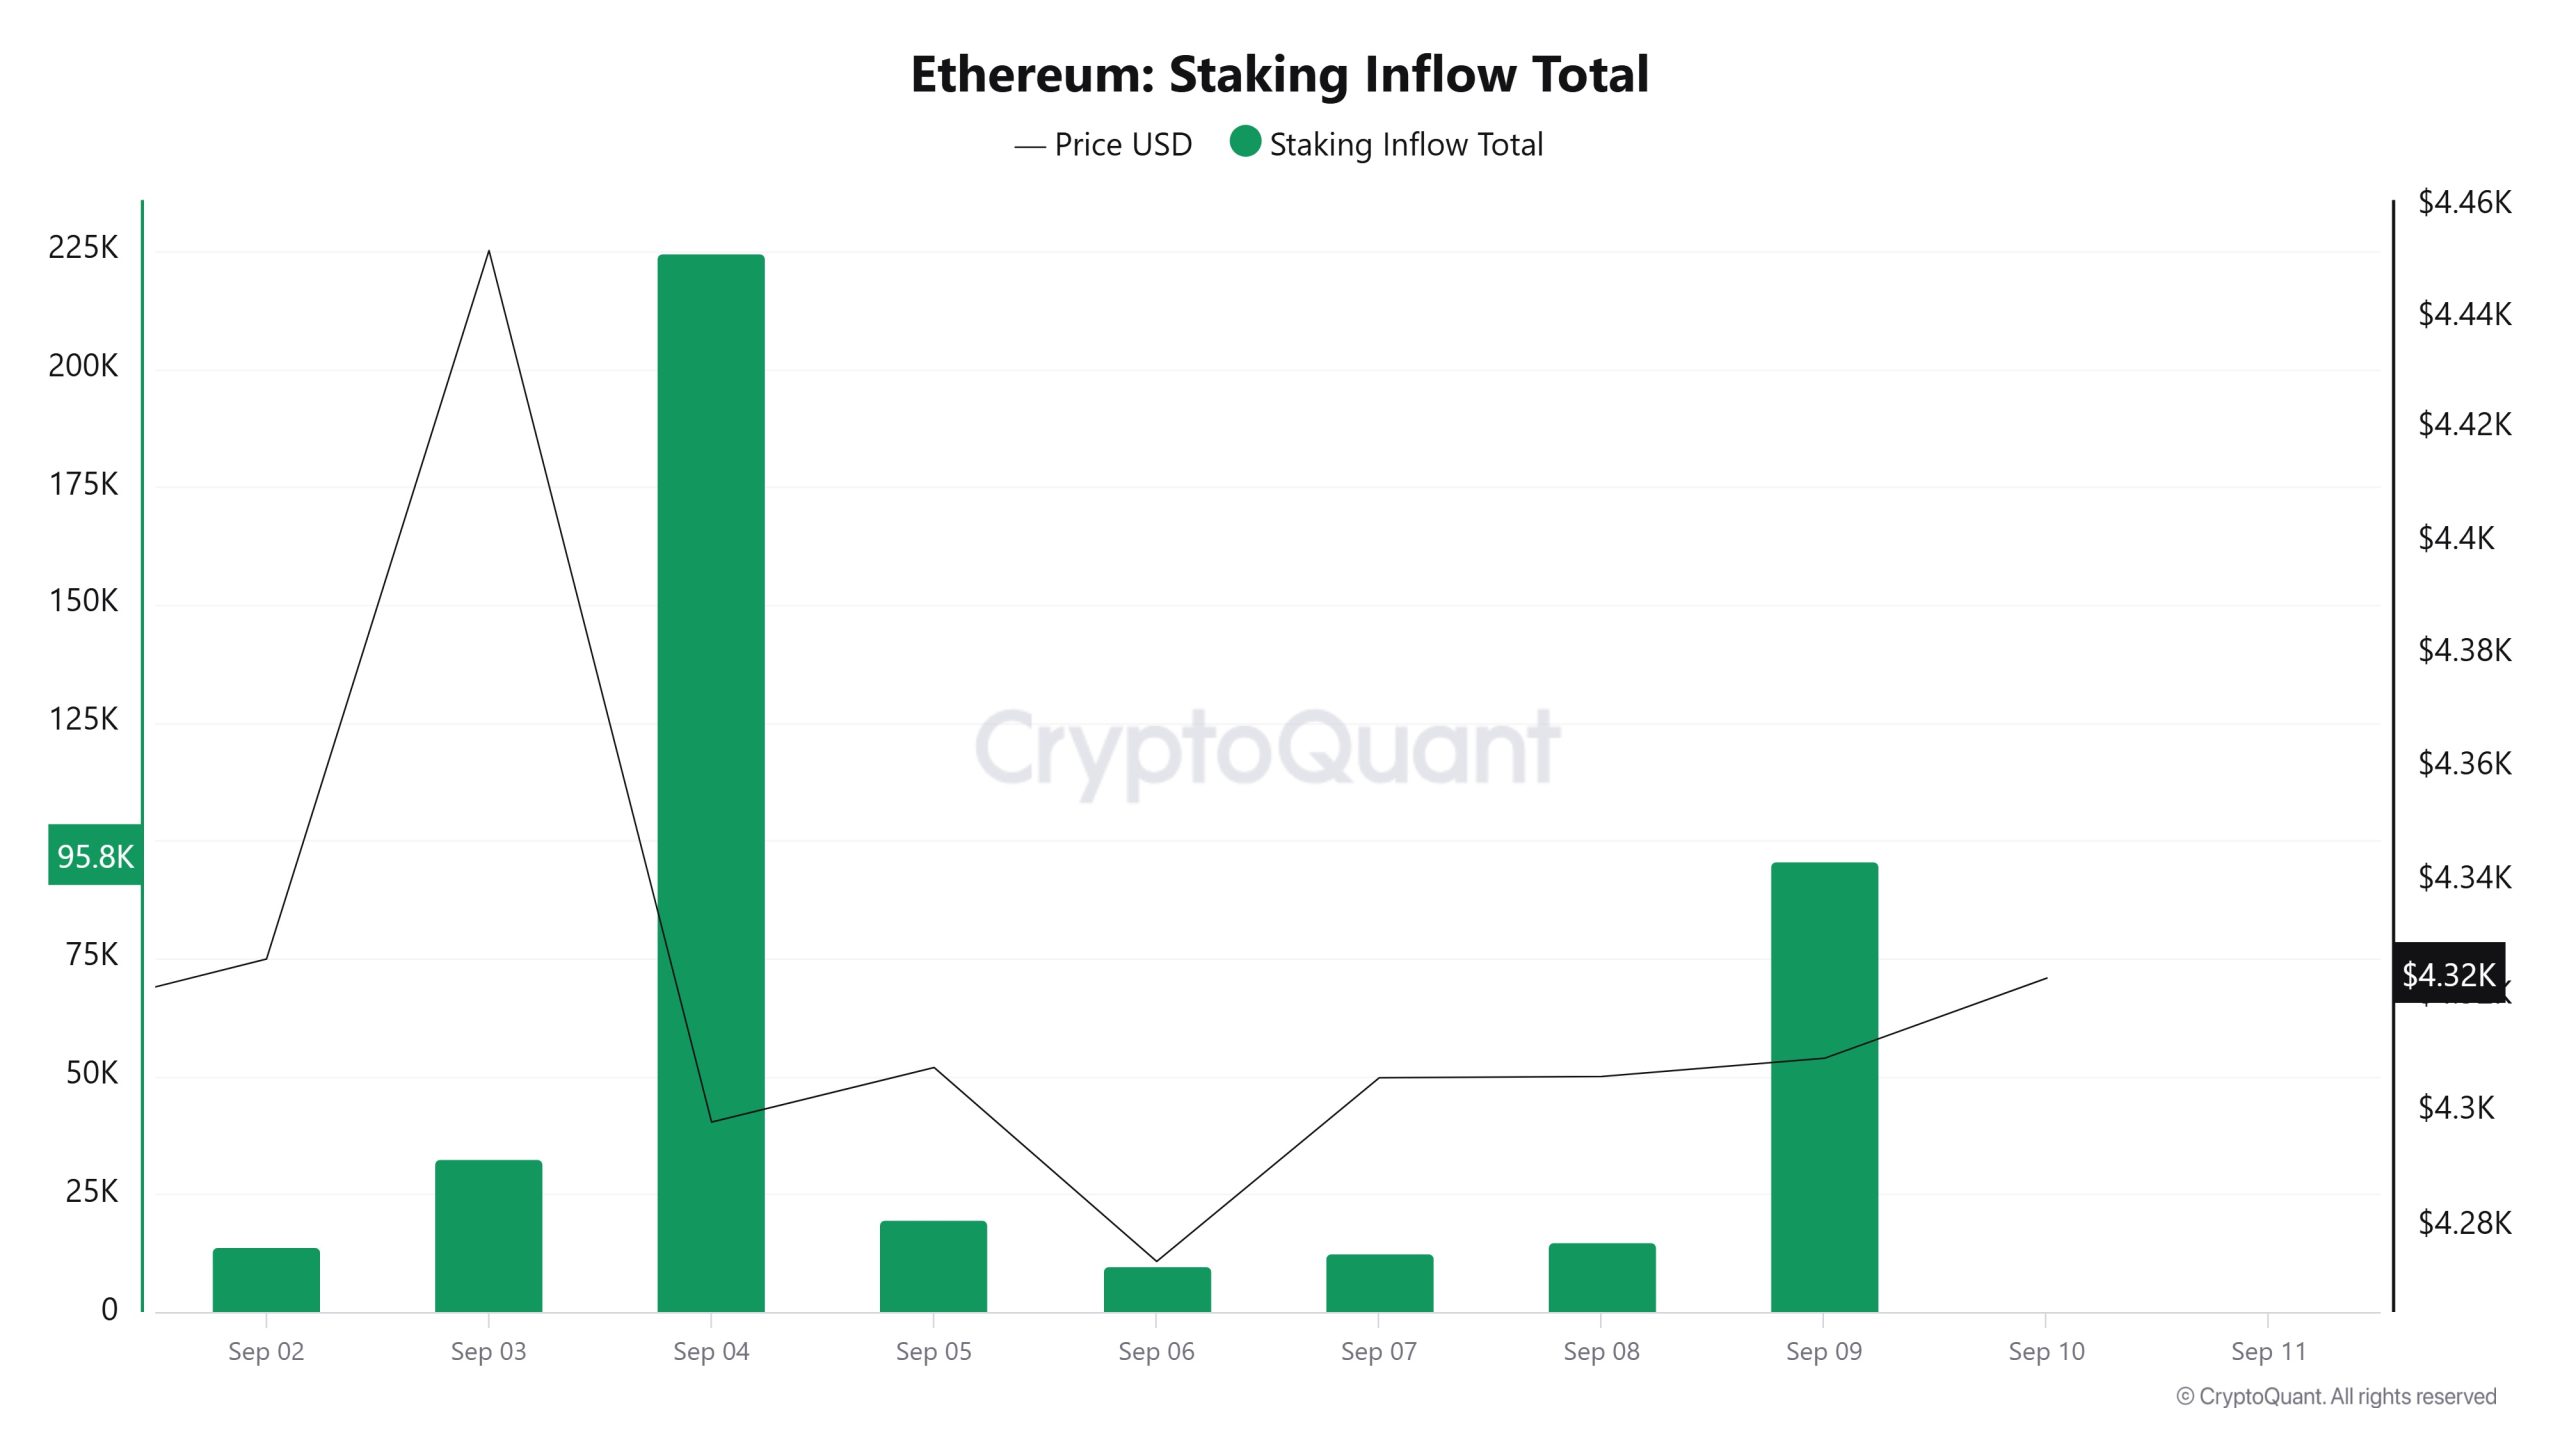
On September 3, ETH price was at $4,451 while Staking Inflow was 32,525.
As of September 9, ETH price fell to $4,309, down 3.19%, while Staking Inflow rose to 95,831, an increase of 194.6%.
Supply Distribution
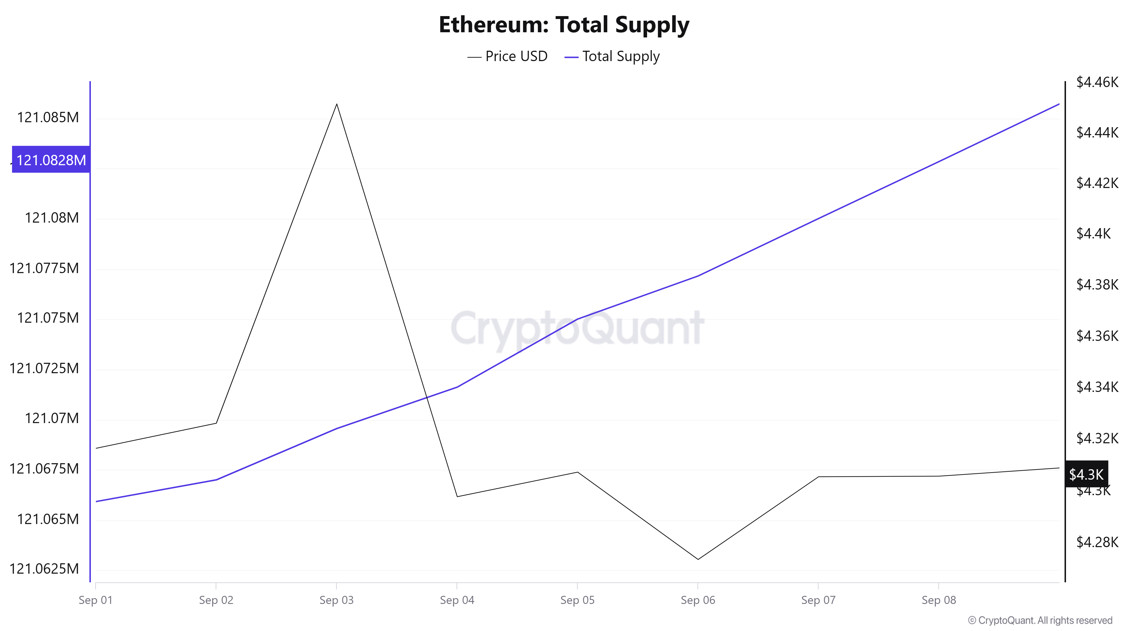
Total Supply: 121,082,854 units, up about 0.014% from last week.
New Supply: The amount of ETH produced this week amounted to 16,929.
Velocity: Velocity was 9.50 as of September 8, down from 9.43 last week.
| Wallet Category | 01.10.2025 | 08.10.2025 | Change (%) |
|---|---|---|---|
| 100 – 1k ETH | 8.5714M | 8.4581M | -1.32% 📉 |
| 1k – 10k ETH | 13.4557M | 13.0032M | -3.36% 📉 |
| 10k – 100k ETH | 20.0817M | 20.5498M | +2.33% 📈 |
| 100k+ ETH | 4.0297M | 4.1494M | +2.97% 📈 |
According to the latest weekly data, Ethereum wallet distribution is fluctuating. There was a limited decline of 1.32% in the 100-1k ETH range, while the 1k-10k ETH segment experienced a more pronounced decline of 3.36%. In contrast, a 2.33% increase in the 10k-100k ETH group and a 2.97% increase in the 100k+ ETH category were noteworthy.
Exchange Supply Ratio
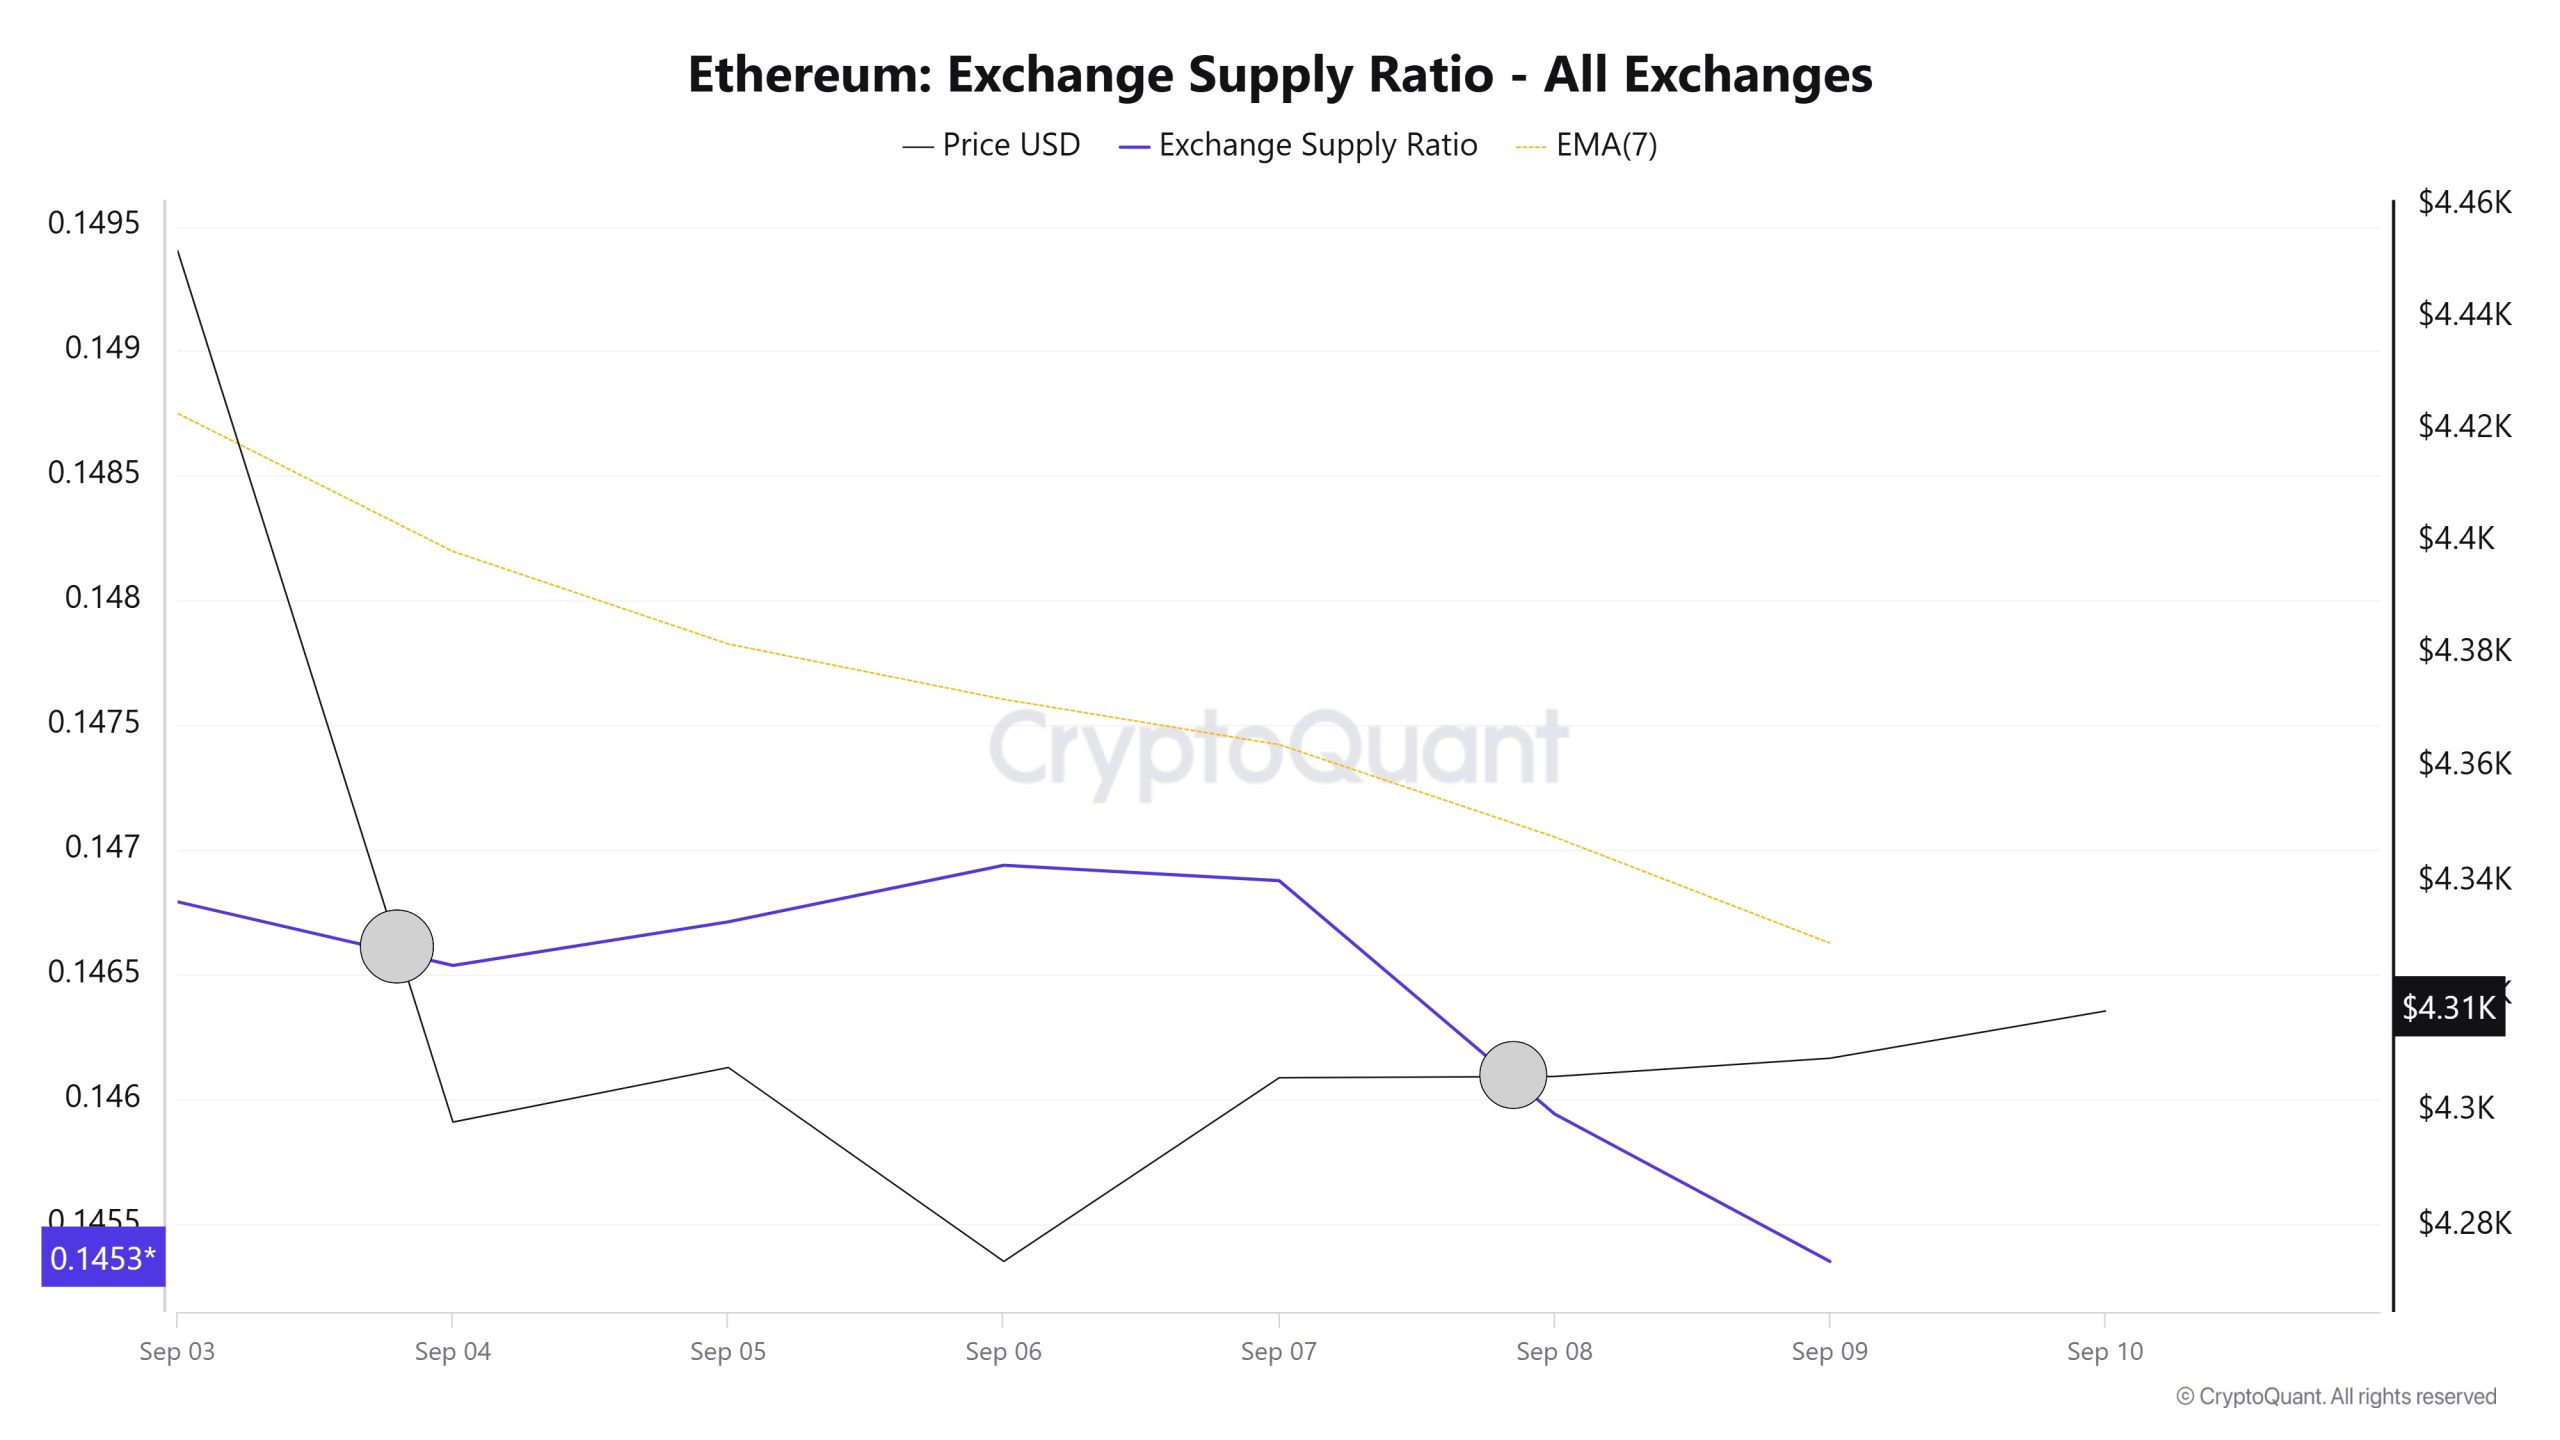
Between September 3 and September 10, Ethereum Exchange Supply Ratio decreased from 0.14819761 to 0.14693982. During this period, the Ethereum price dropped from $4,298 to $4,273. At the intersection of the price and the Exchange Supply Ratio, there was a significant increase in the Exchange Supply Ratio while the price continued to fall, especially between September 4 and 8. This suggests that despite the price decline, the amount of Ethereum supplied to exchanges has increased, possibly indicating that long-term investors have stopped holding their holdings. It is seen that the Ethereum price is generally declining.
Exchange Reserve
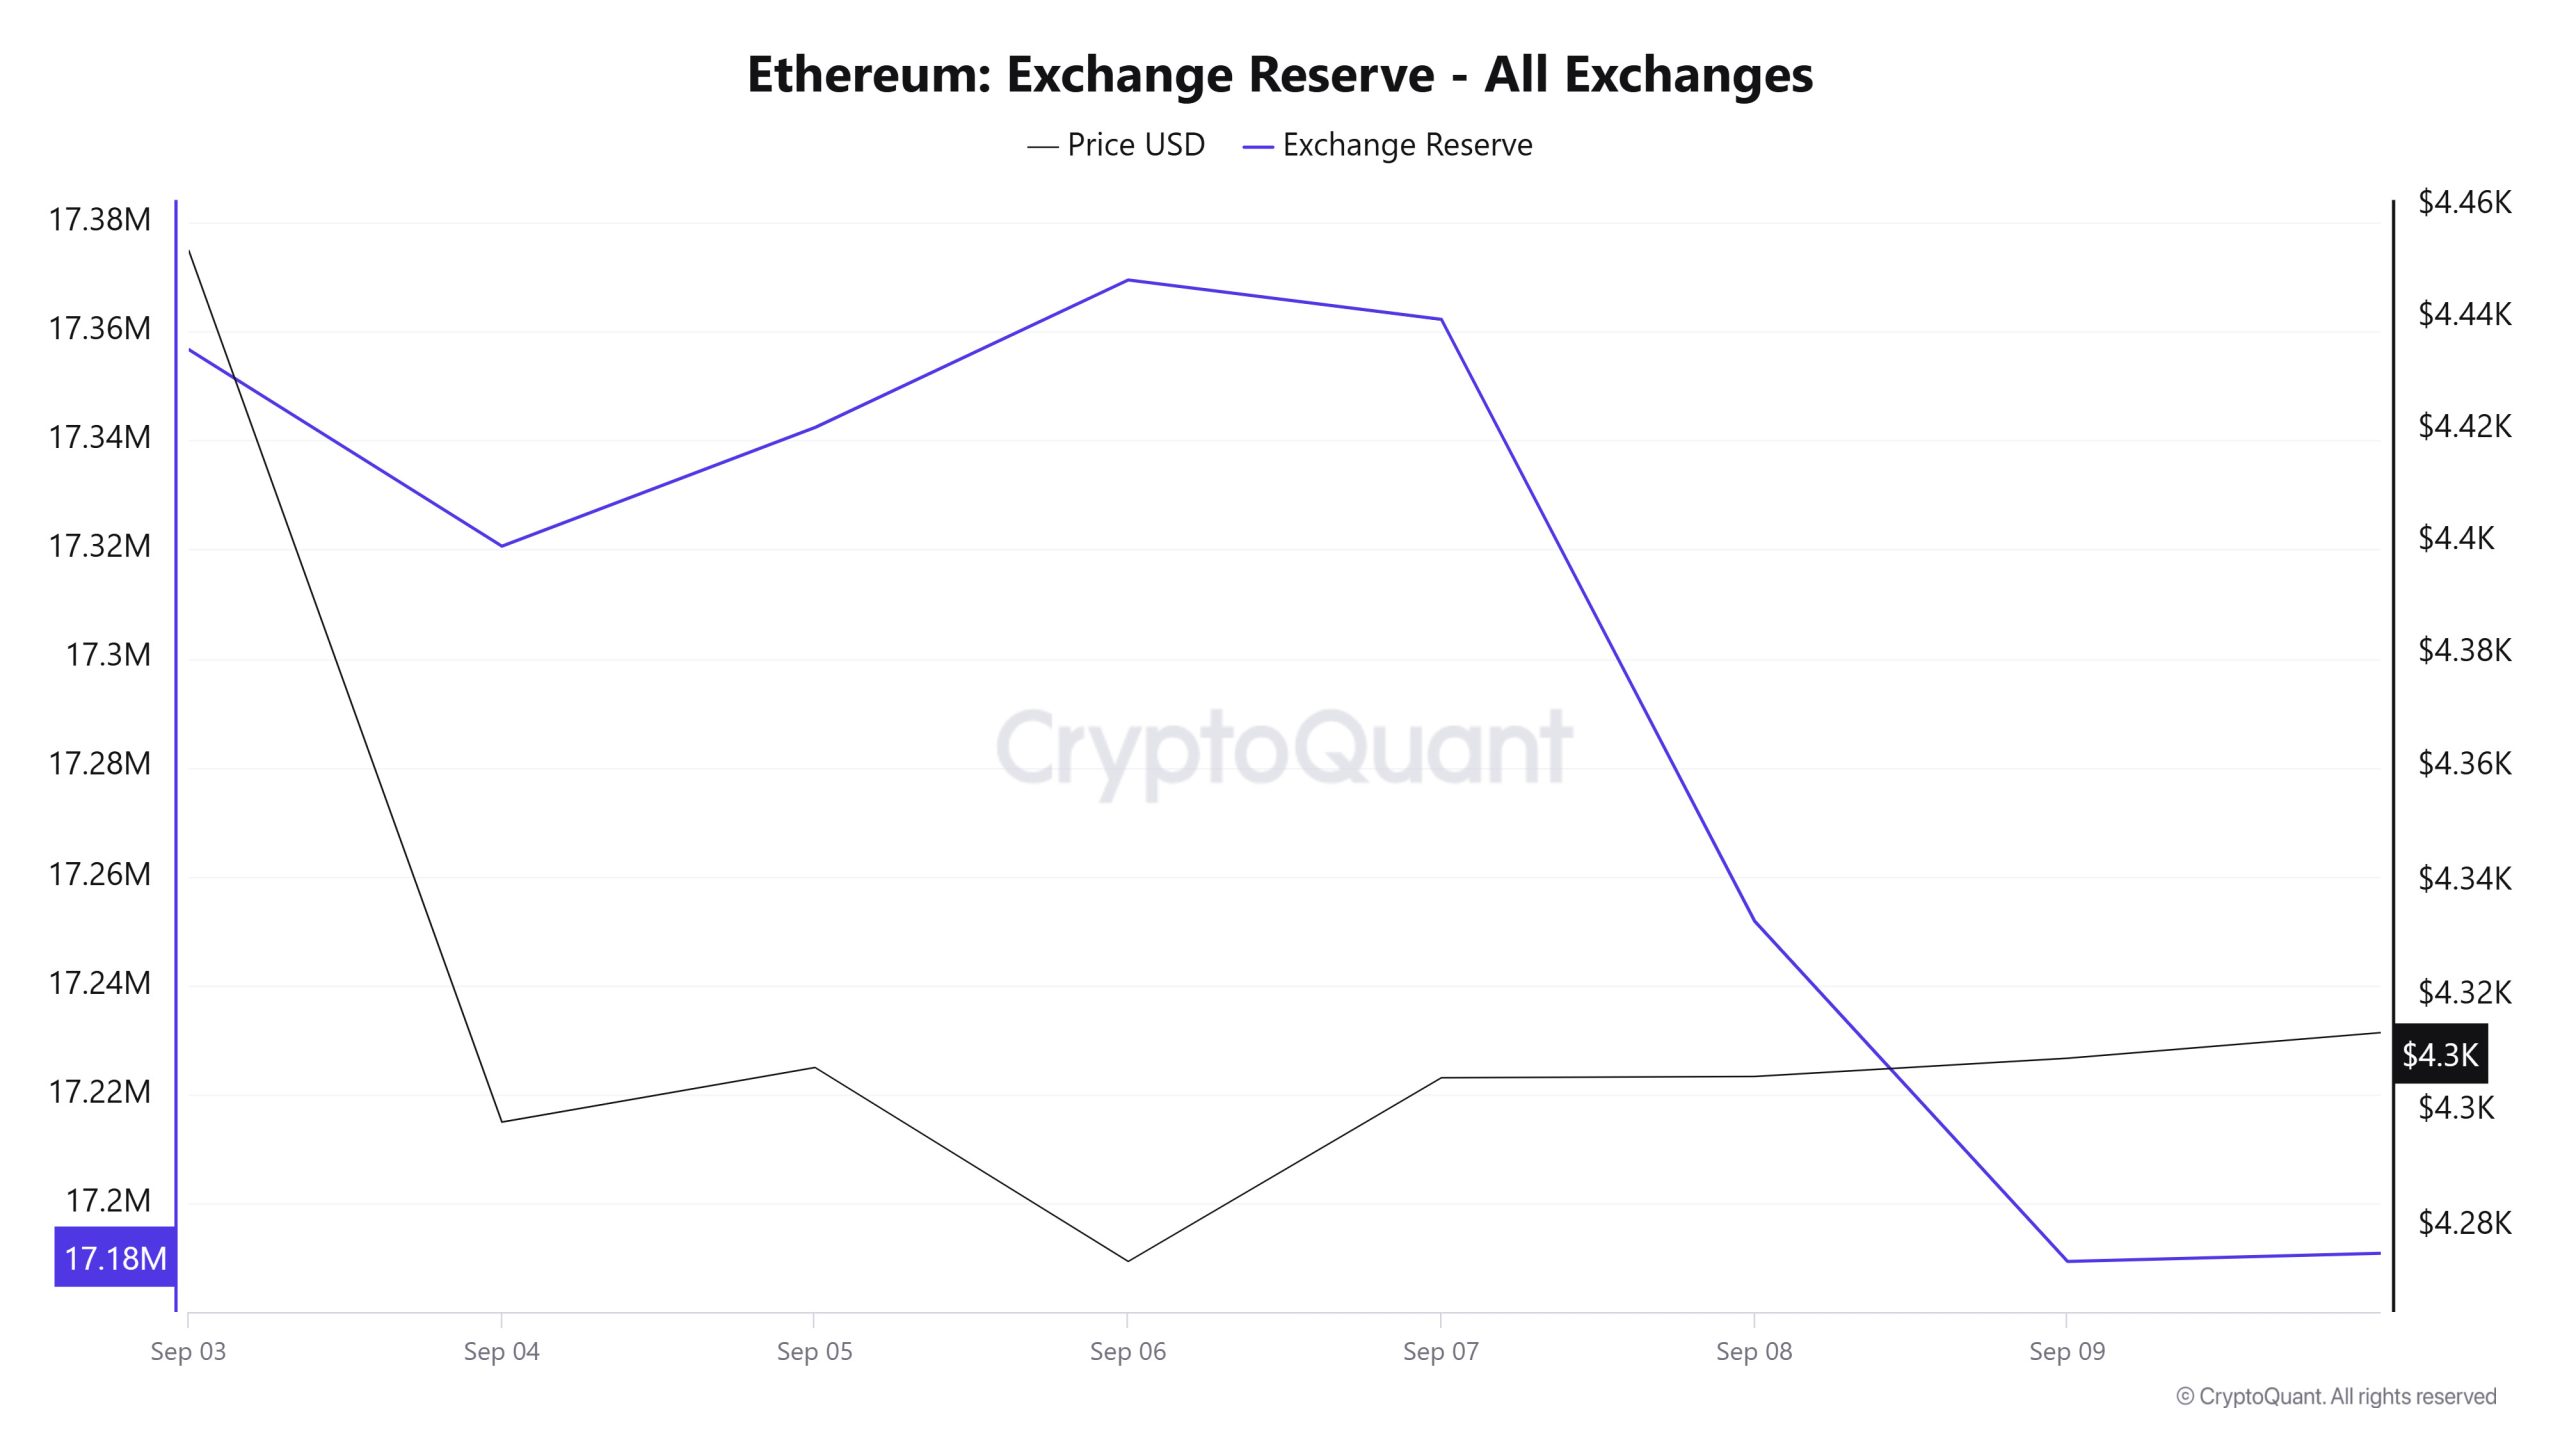
Between September 03-09, 2025, Ethereum reserves on exchanges decreased from 17,356,691 ETH to 17,189,406 ETH, with a total net outflow of 167,285 ETH. During this period, reserves decreased by approximately 0.96%. In the same period, the Ethereum price fell from $4,328 to $4,309, depreciating by about 0.44%. Despite the pullback in the price, the decline in stock market reserves suggests that investors prefer to hold rather than sell and that the market is still cautious.
| Date | Exchange Inflow | Exchange Outflow | Exchange Netflow | Exchange Reserve | ETH Price |
|---|---|---|---|---|---|
| 03-Sep | 1,351,731 | 1,369,876 | -18,144 | 17,356,691 | 4,328 |
| 04-Sep | 1,134,913 | 1,171,003 | -36,090 | 17,320,601 | 4,298 |
| 05-Sep | 983,417 | 961,639 | 21,778 | 17,342,379 | 4,308 |
| 06-Sep | 343,018 | 315,954 | 27,065 | 17,369,444 | 4,274 |
| 07-Sep | 266,061 | 273,289 | -7,228 | 17,362,216 | 4,306 |
| 08-Sep | 1,172,822 | 1,283,175 | -110,353 | 17,251,863 | 4,306 |
| 09-Sep | 847,546 | 910,004 | -62,457 | 17,189,406 | 4,309 |
Fees and Revenues
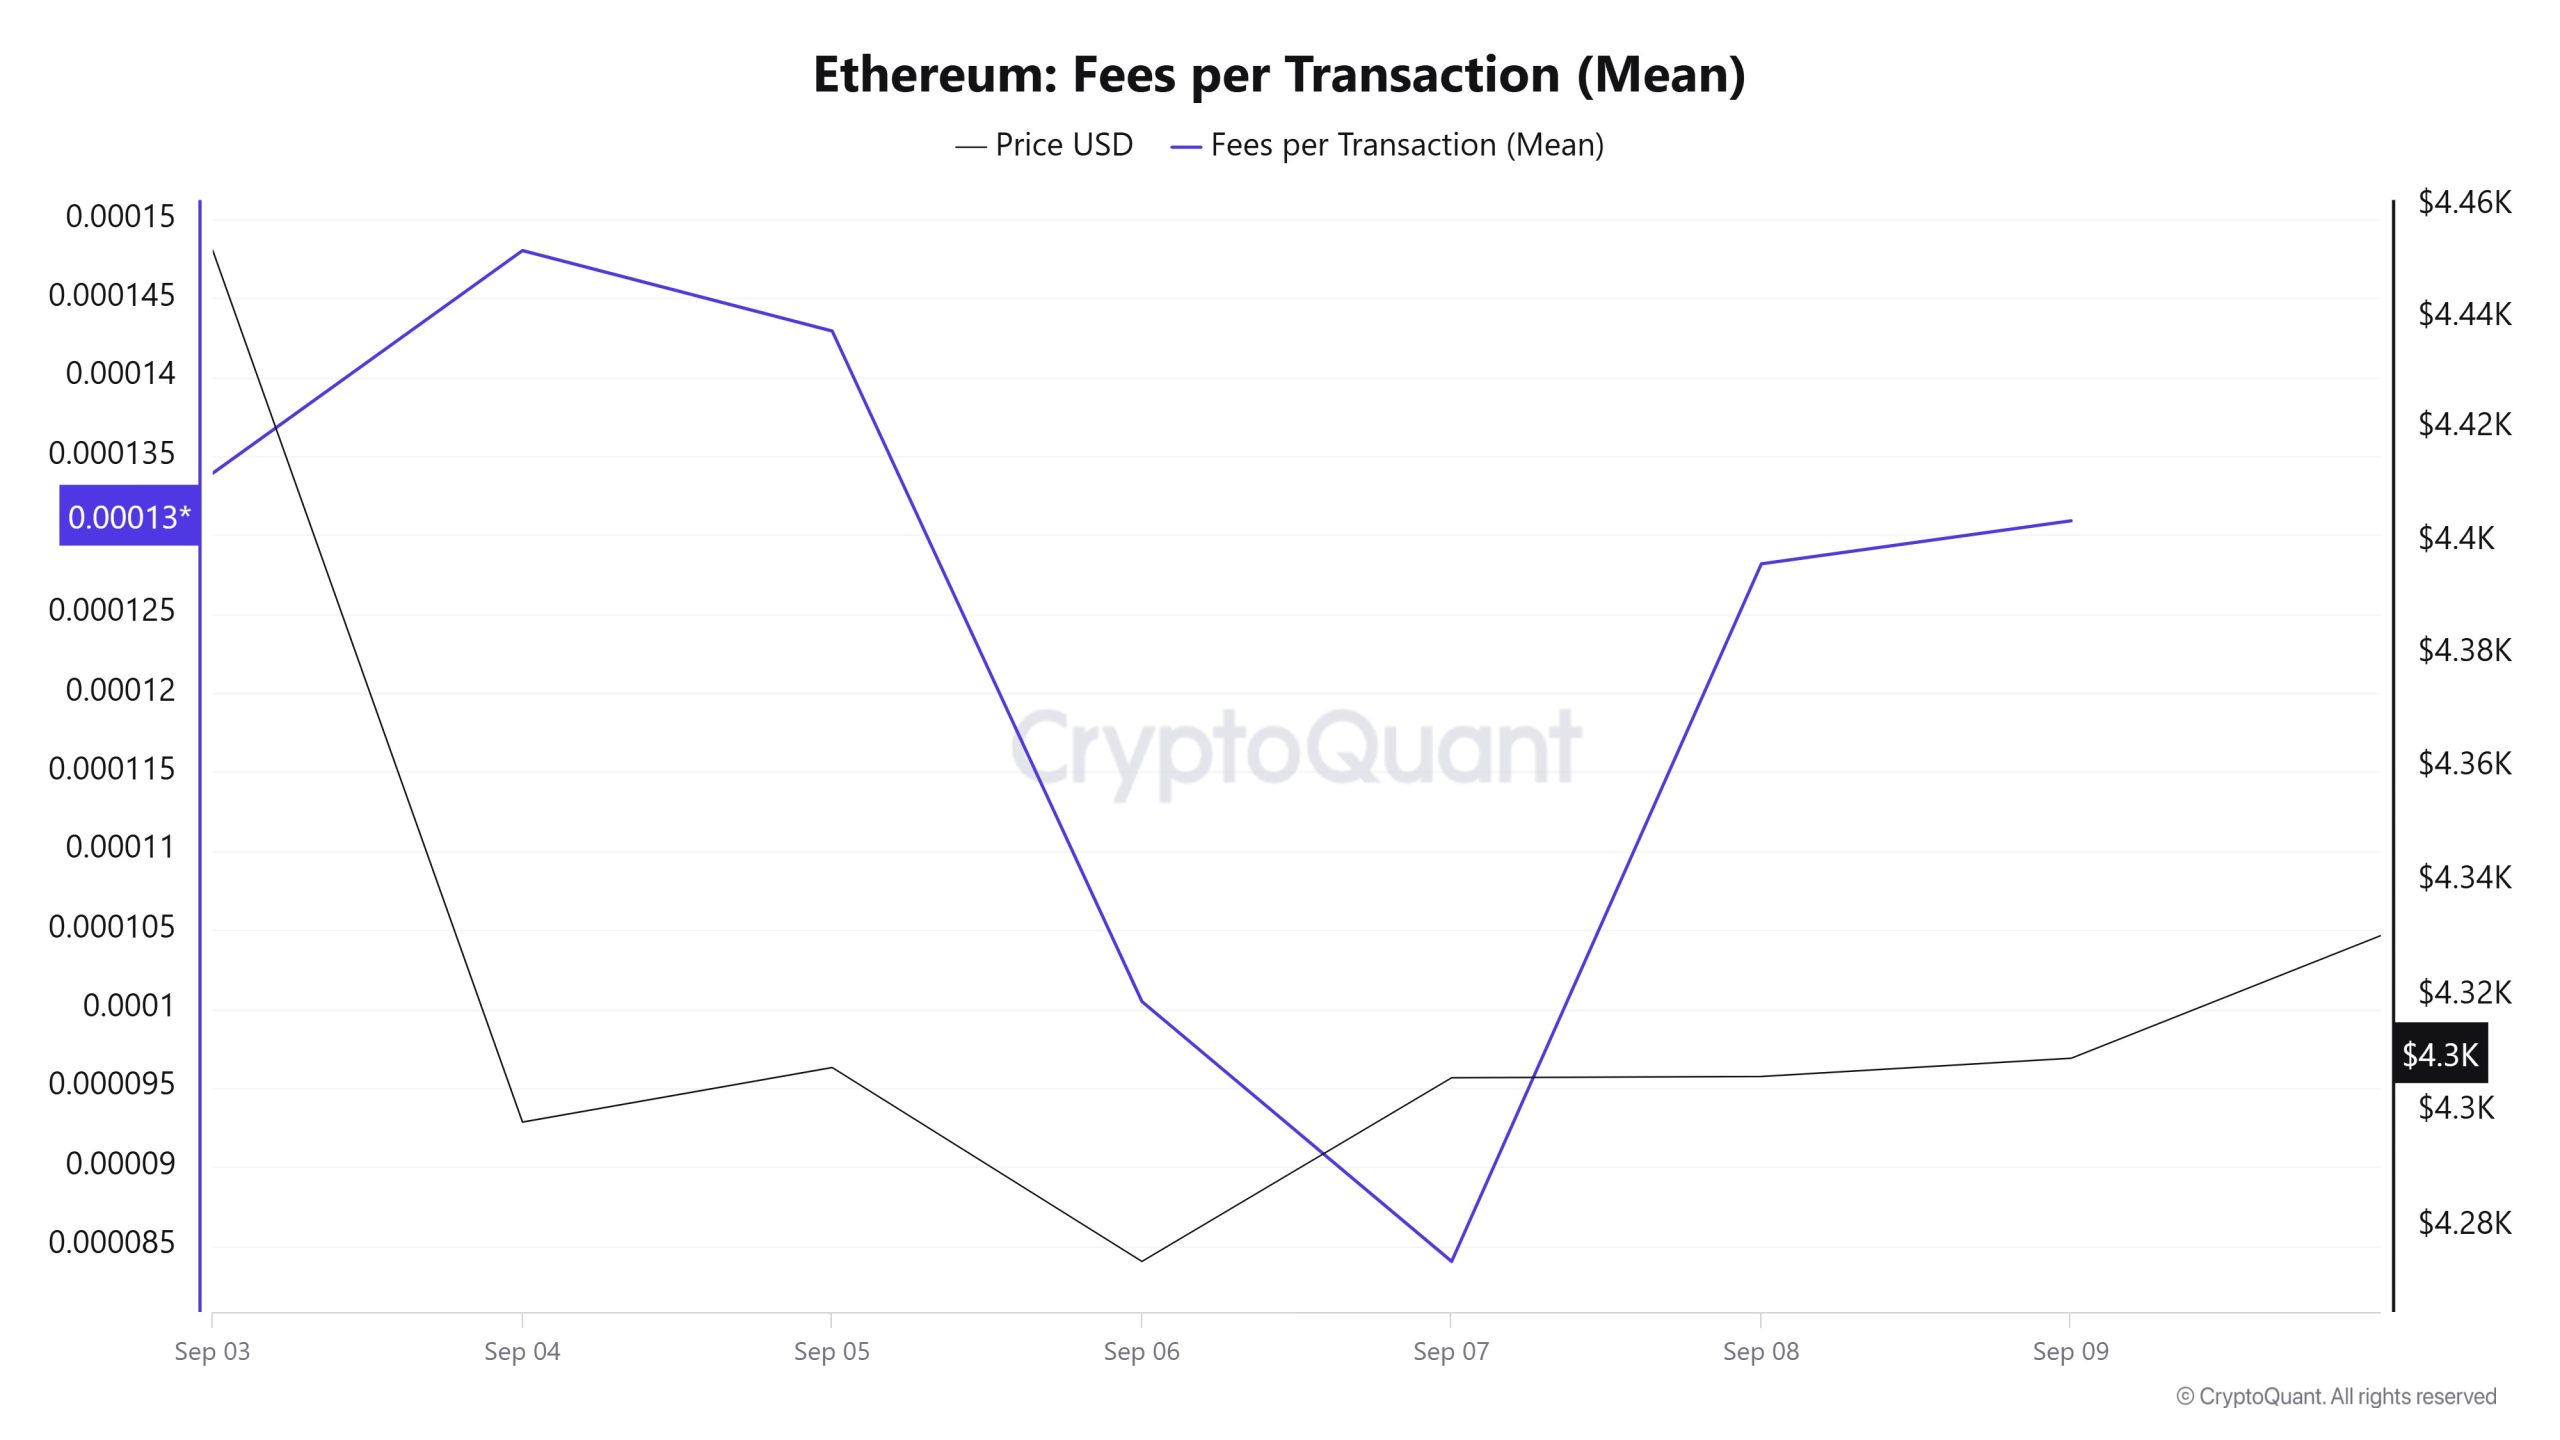
Analysing the Ethereum Fees per Transaction (Mean) data between September 3- 9, it is seen that the indicator was realized at 0.000133915948559034 on September 3, the first day of the week.
As of September 4, the value peaked and fluctuated after this date due to the volatility in Ethereum price. On September 7, it fell to 0.00008400566111038, recording the lowest value of the week.
In the following days, the Ethereum Fees per Transaction (Mean) indicator resumed its upward trend and closed at 0.000130903524480839 on September 9, the last day of the week.
Ethereum: Fees (Total)
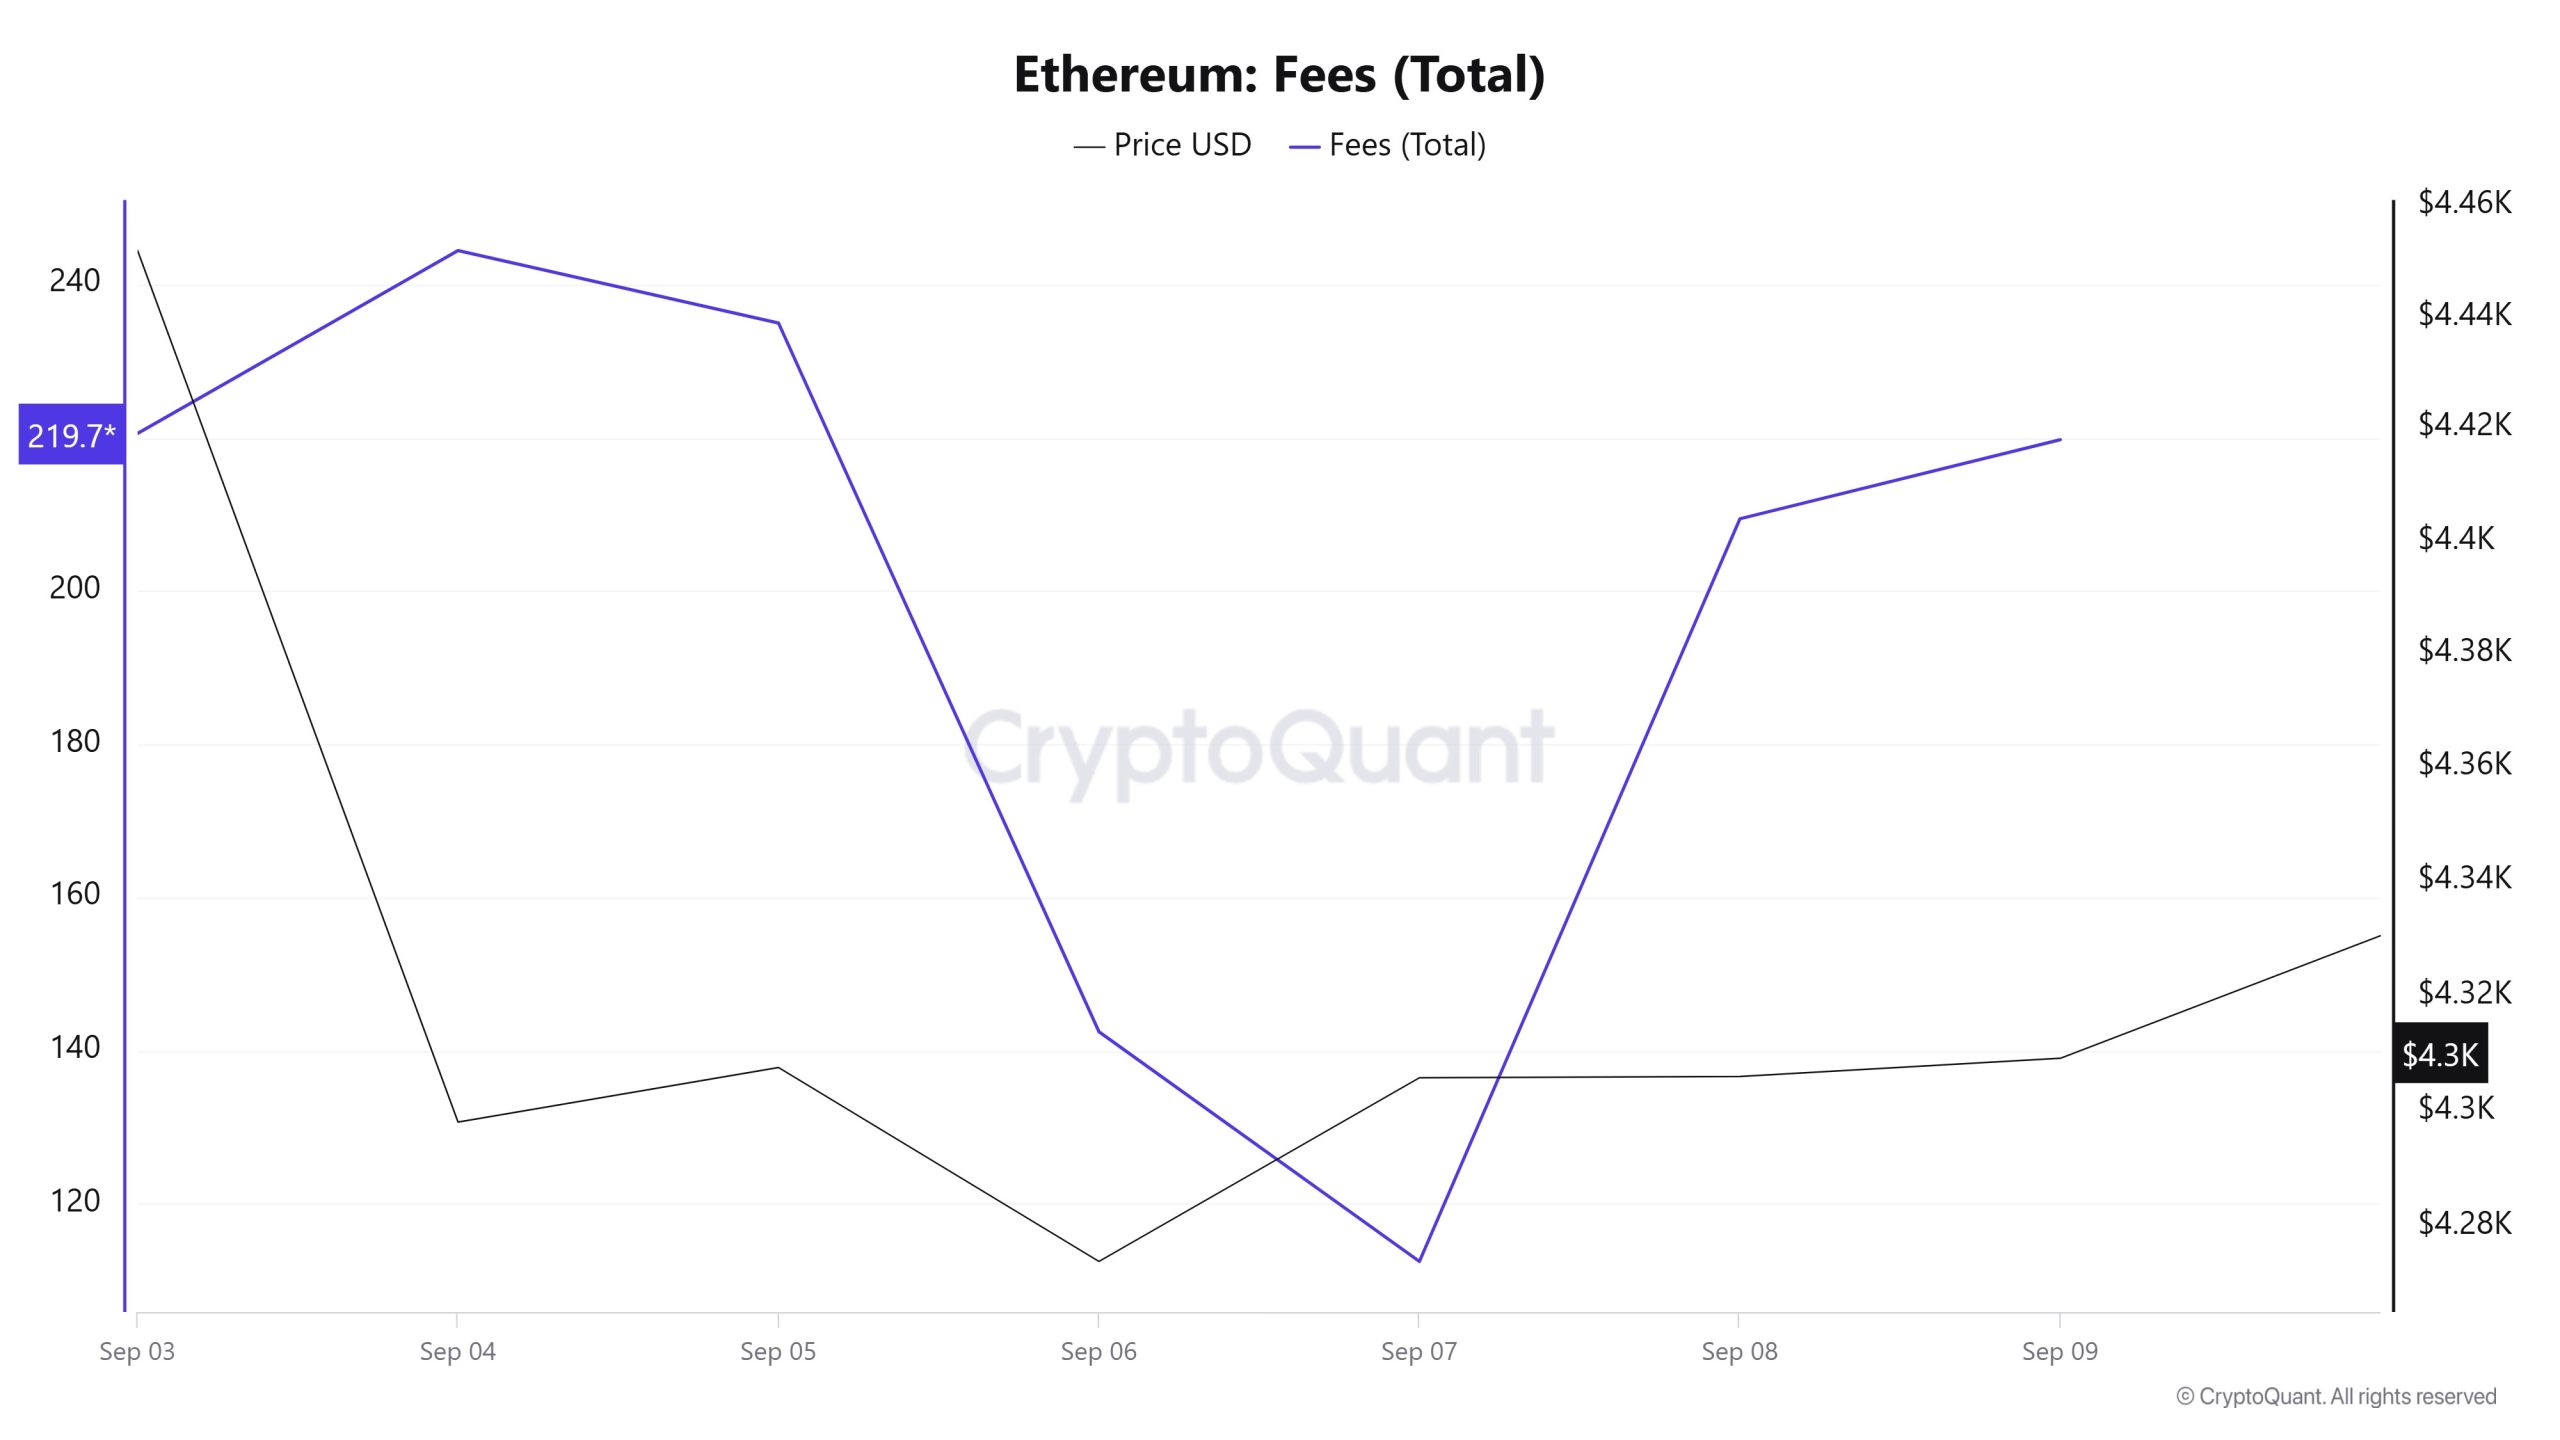
Similarly, an analysis of Ethereum Fees (Total) data between September 3 and 9 shows that the indicator was at 220,54925574868935 on September 3, the first day of the week.
This value, which peaked on the first day of the week, followed a fluctuating course after this date due to the volatility in Ethereum price. On September 7, it fell to 112.49206479857135, recording the lowest value of the week.
In the following days, the Ethereum Fees (Total) indicator resumed its upward trend and closed at 219.73936872041764 on September 9, the last day of the week.
Blocks Mined
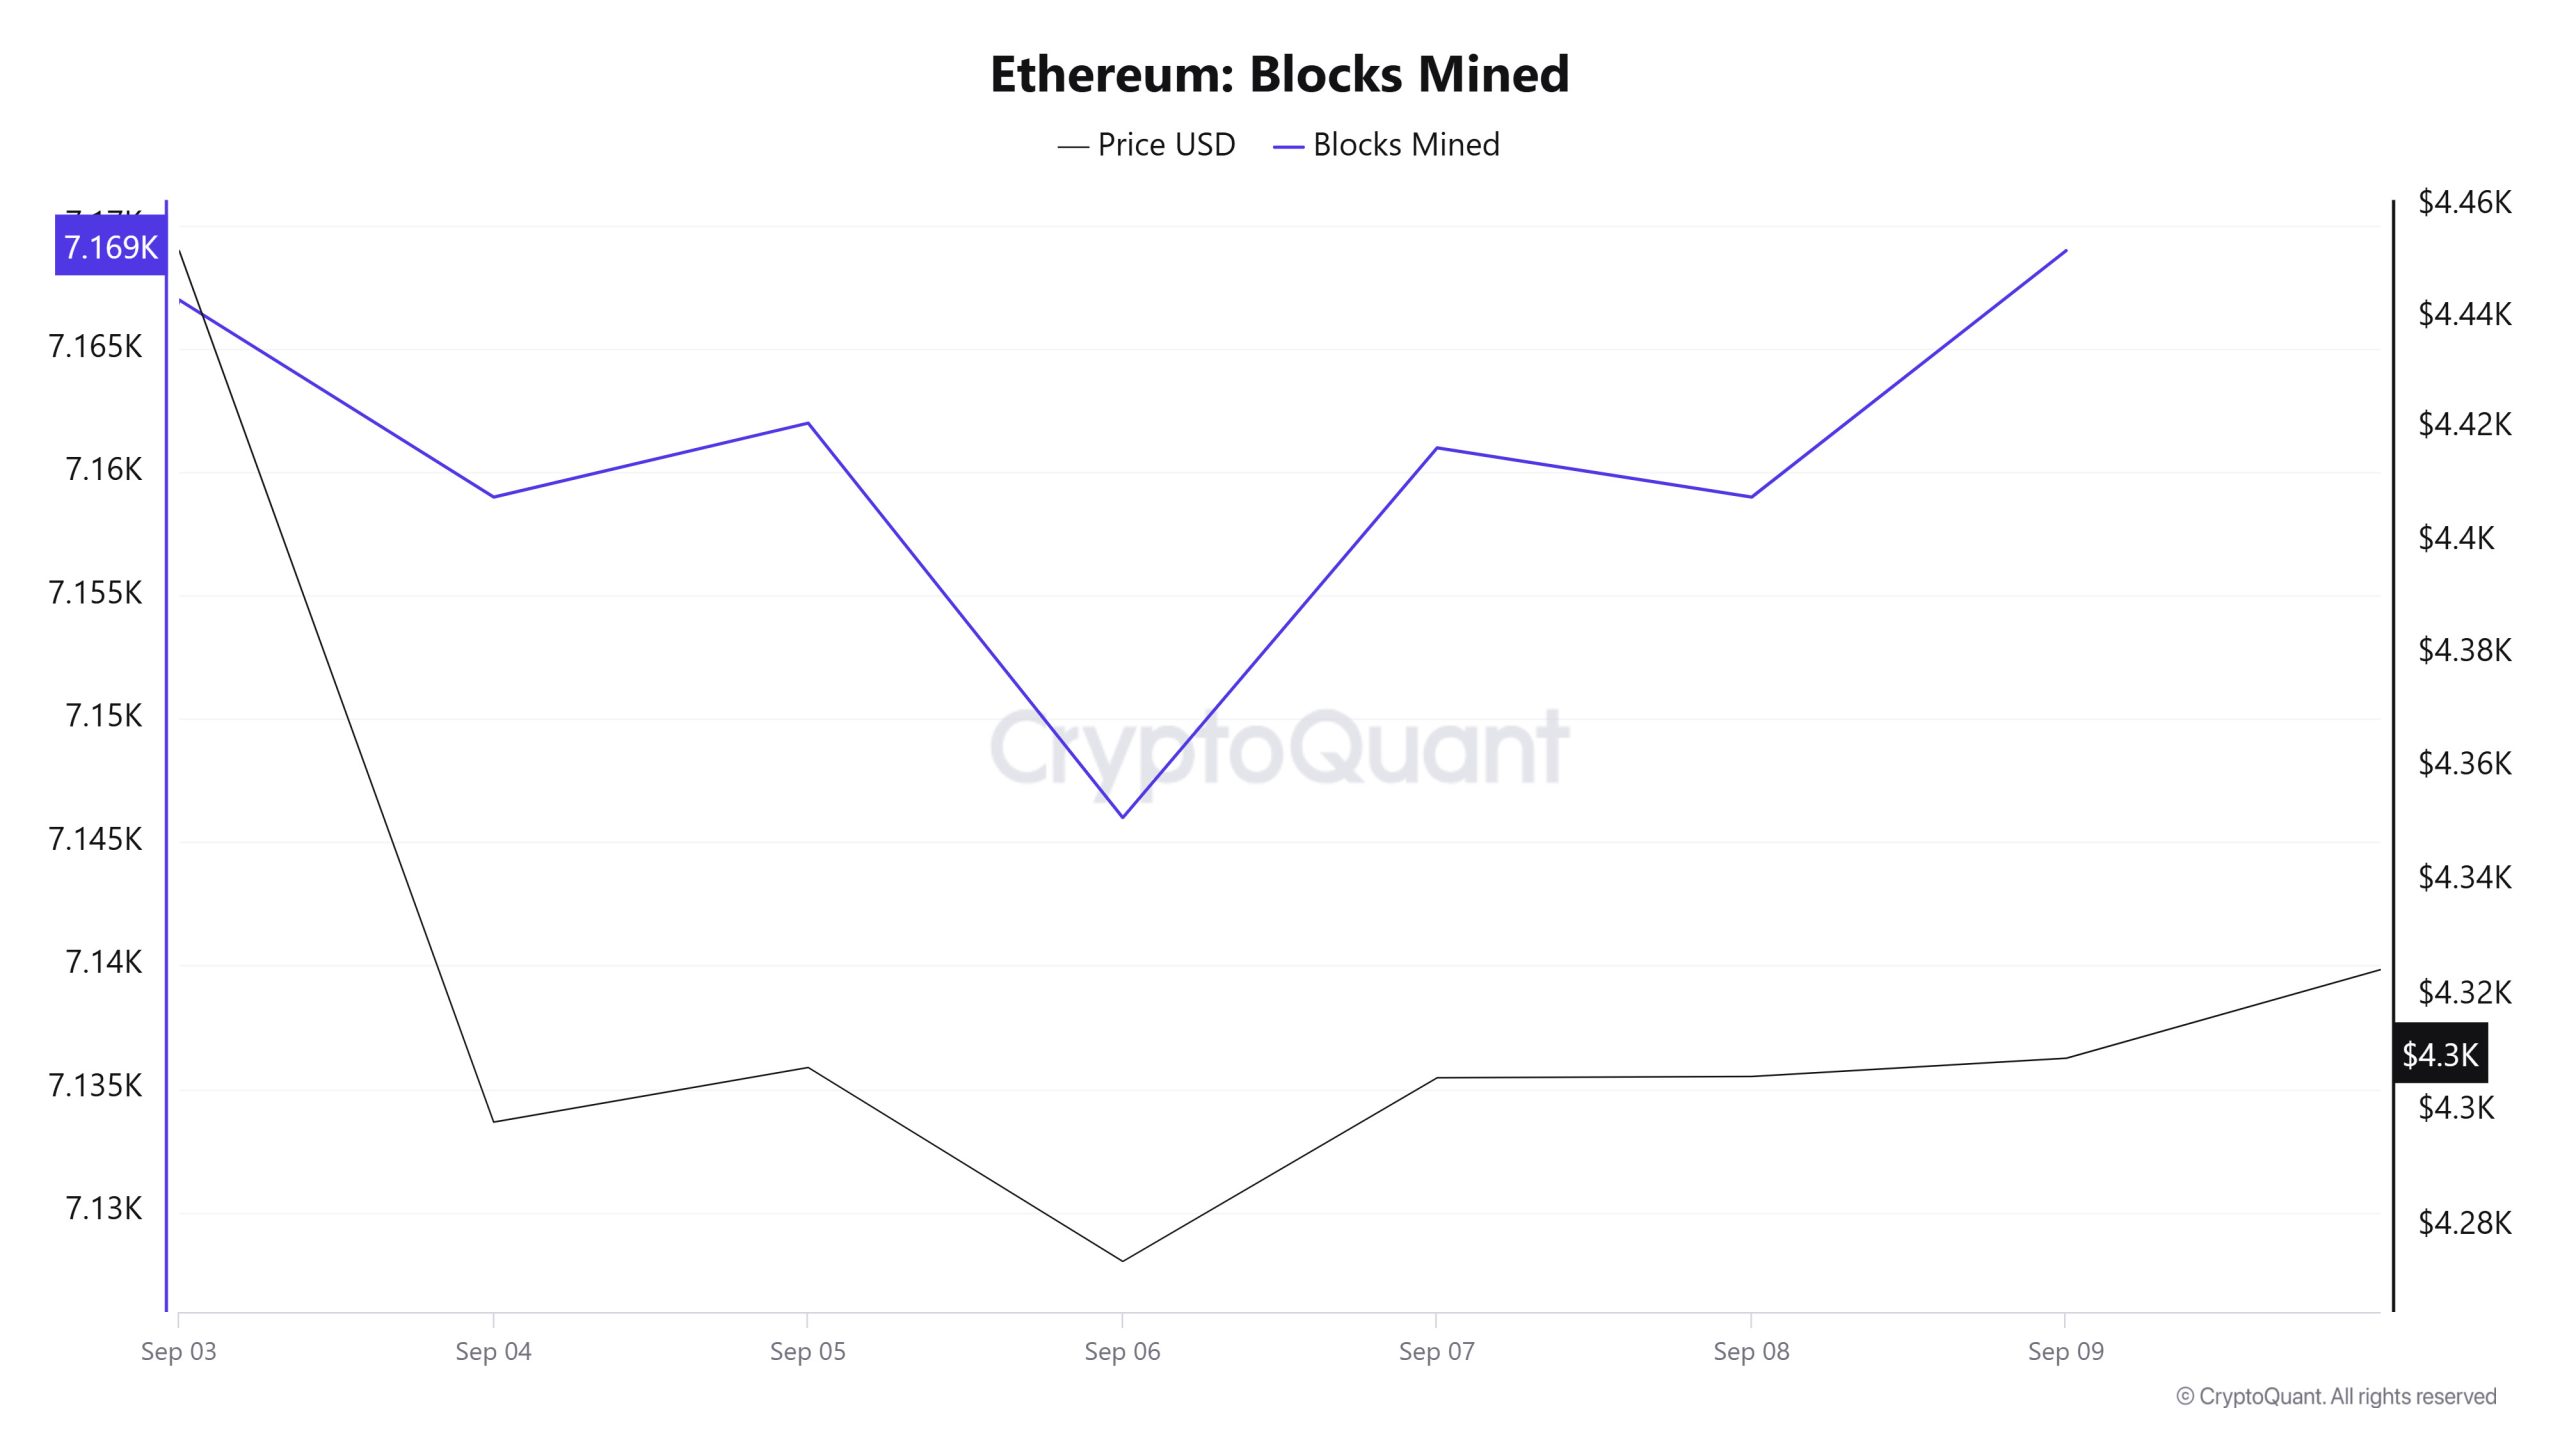
Between September 3 and September 9, Ethereum block production data showed an increase throughout the week. While 7,167 blocks were produced on September 3, this number increased to 7,169 as of September 9. There was a positive correlation between the Ethereum price and the number of block production throughout the week.
Block Size
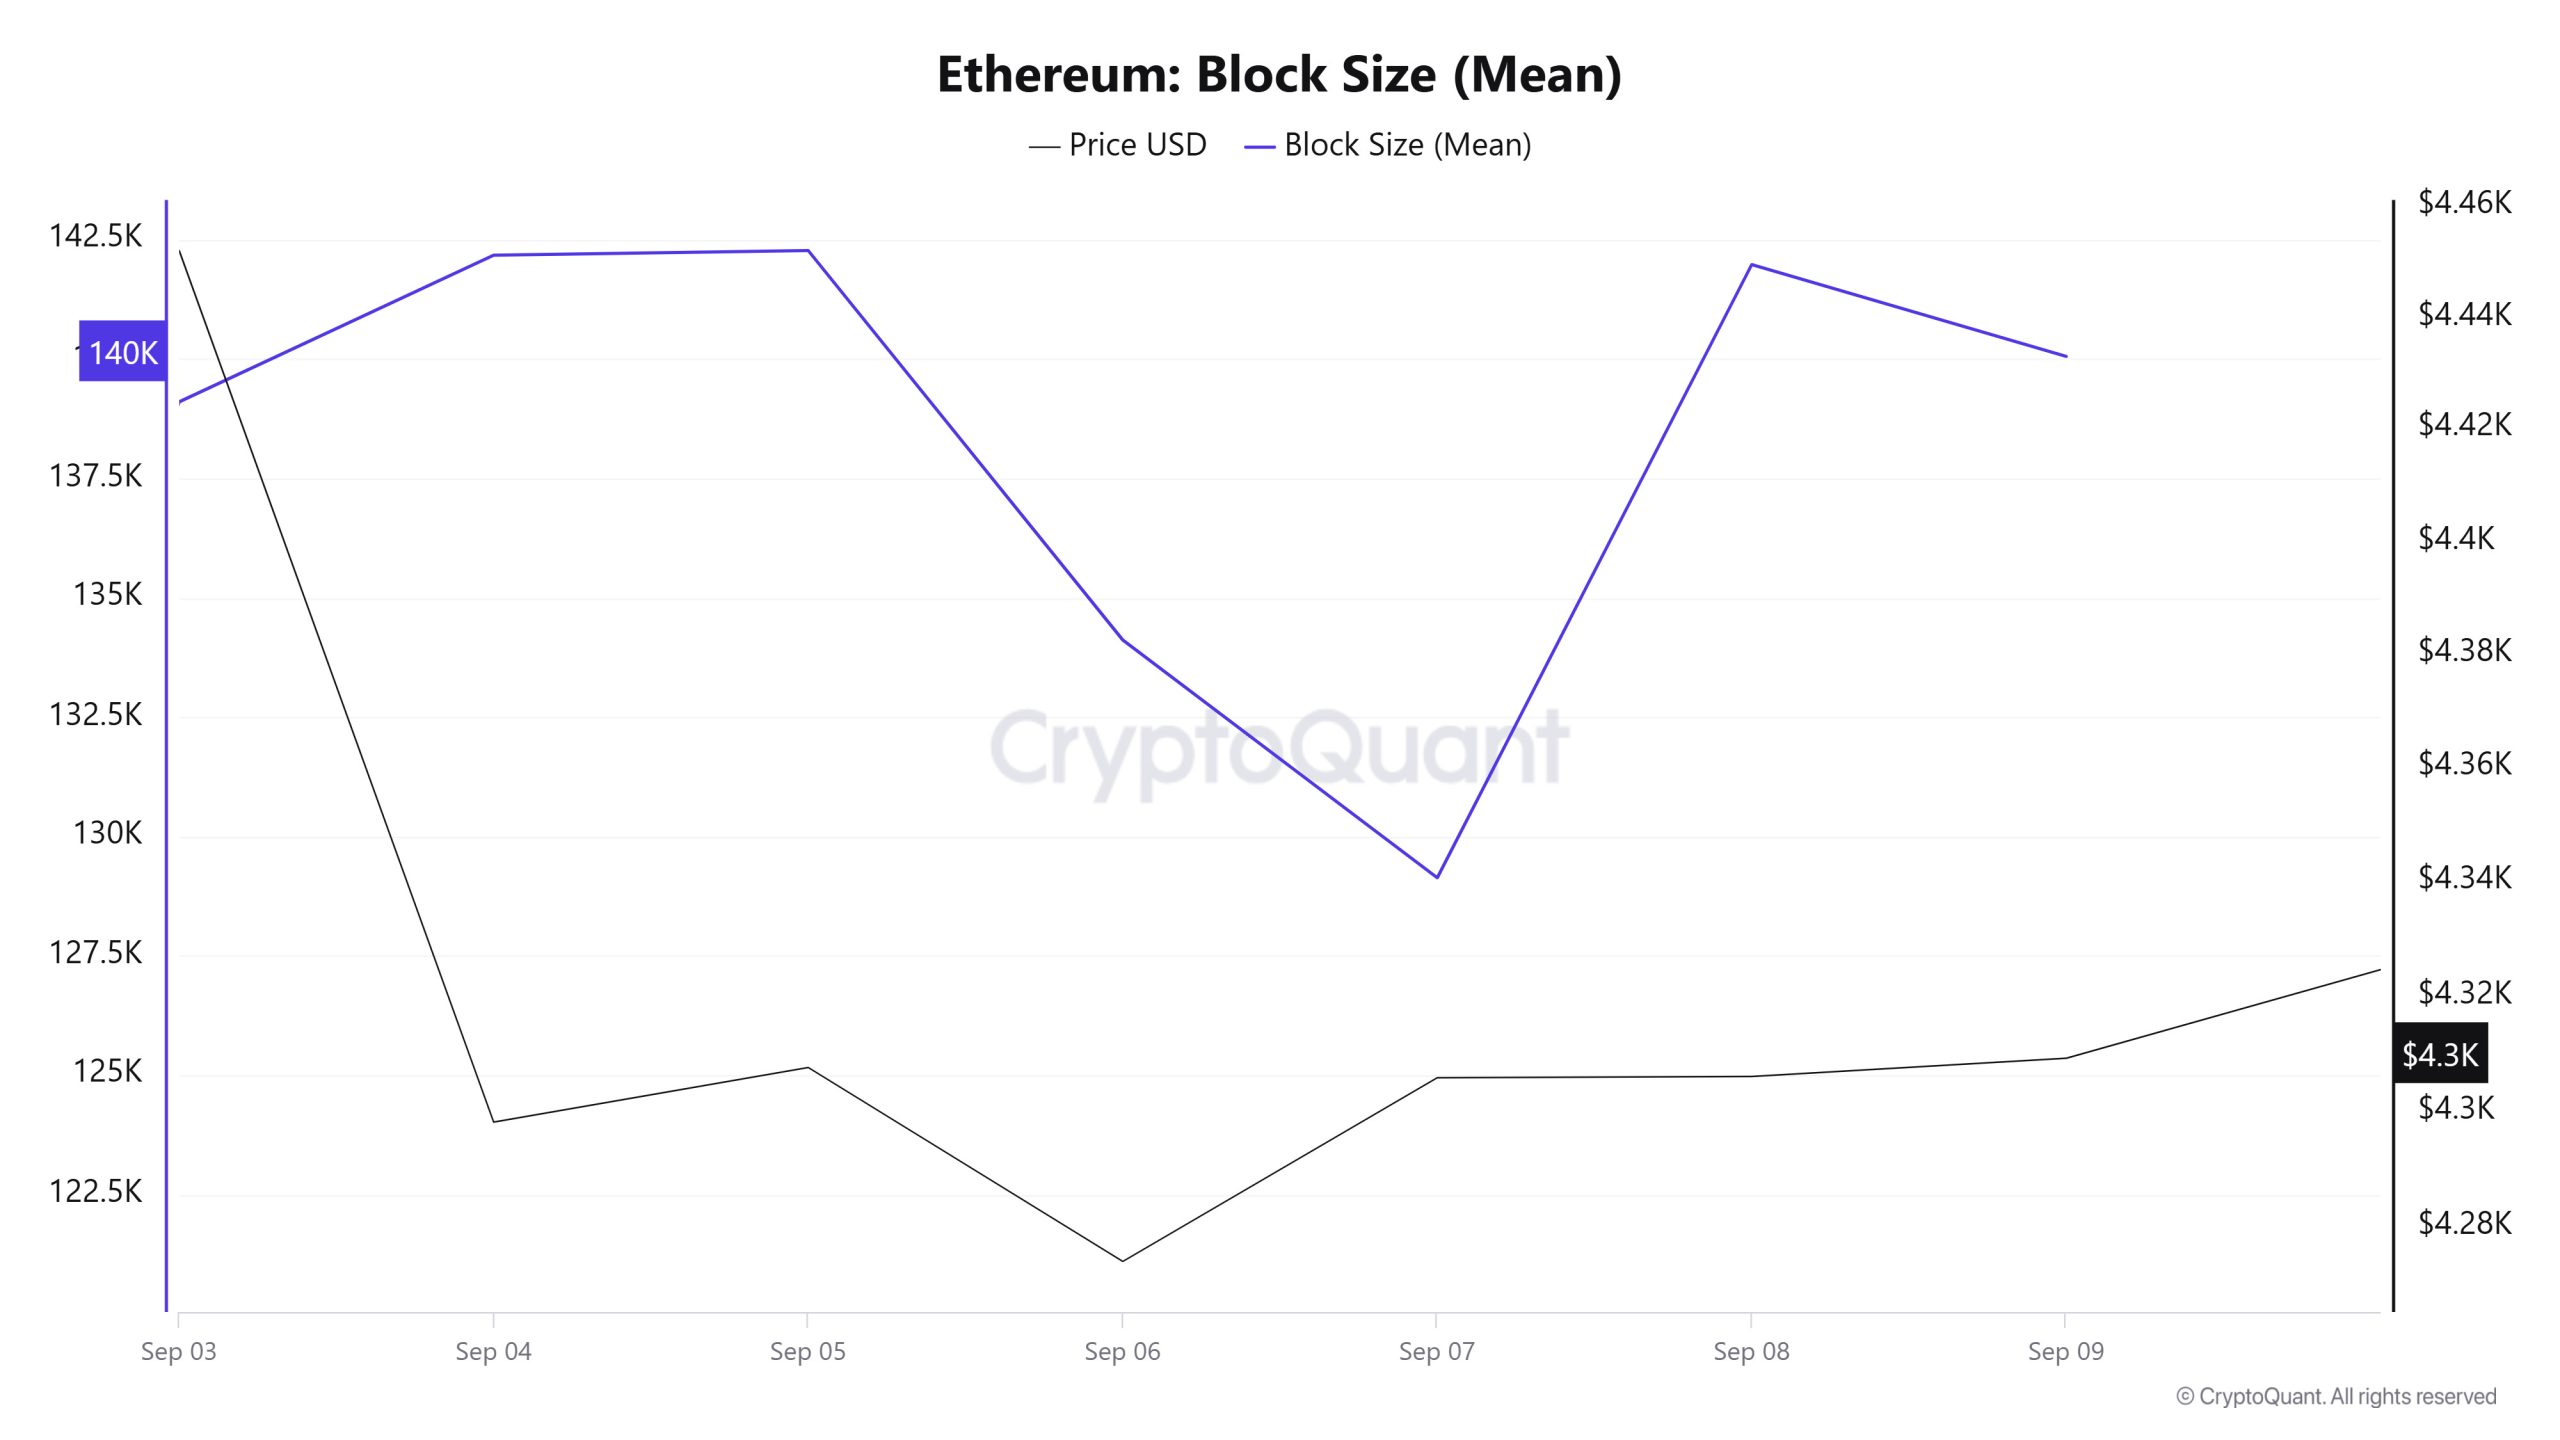
Between September 3 and September 9, Ethereum block size data shows that there has been an increase throughout the week. On September 3, the average block size was 139,105 bytes, while this value increased to 140,056 bytes as of September 9. There was a positive correlation between block size and Ethereum price during the week.
Block Interval
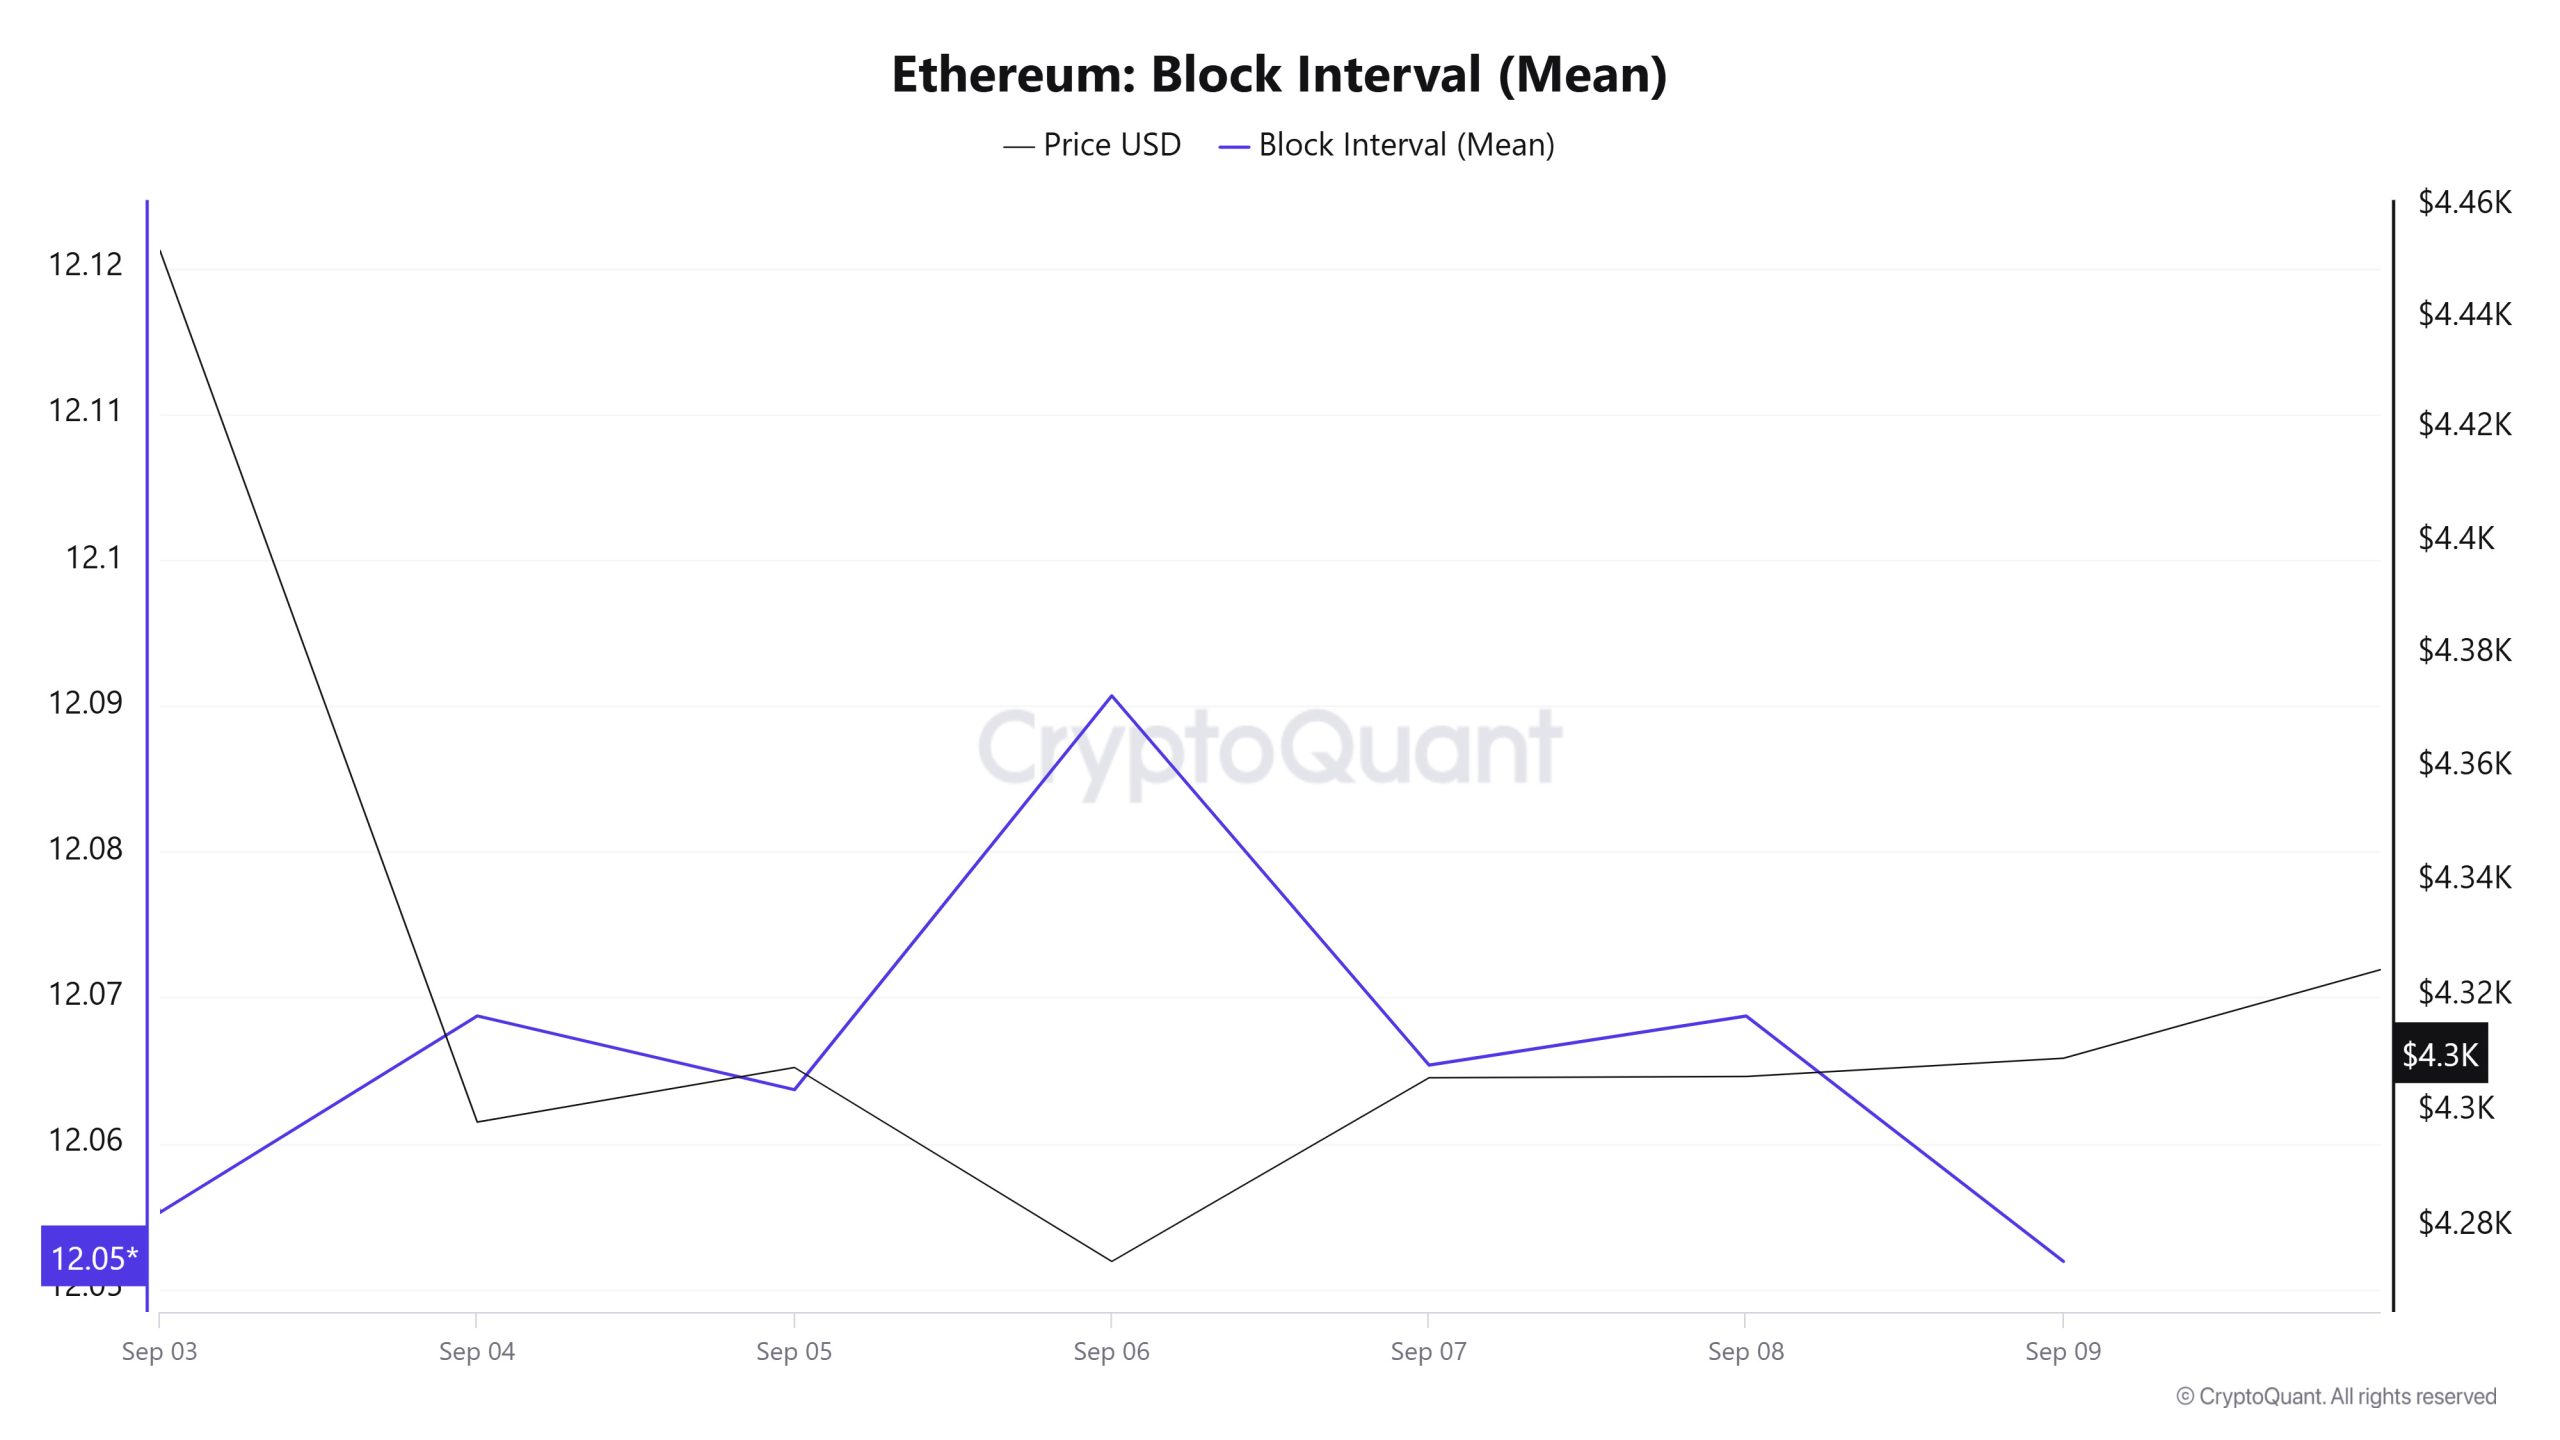
Between September 3 and September 9, Ethereum block data showed a slight decrease throughout the week. On September 3, the average block duration was recorded as 12,055 seconds, while it decreased to 12,051 seconds as of September 9. During the period in question, Ethereum block duration and price movement were negatively correlated throughout the week.
Transaction
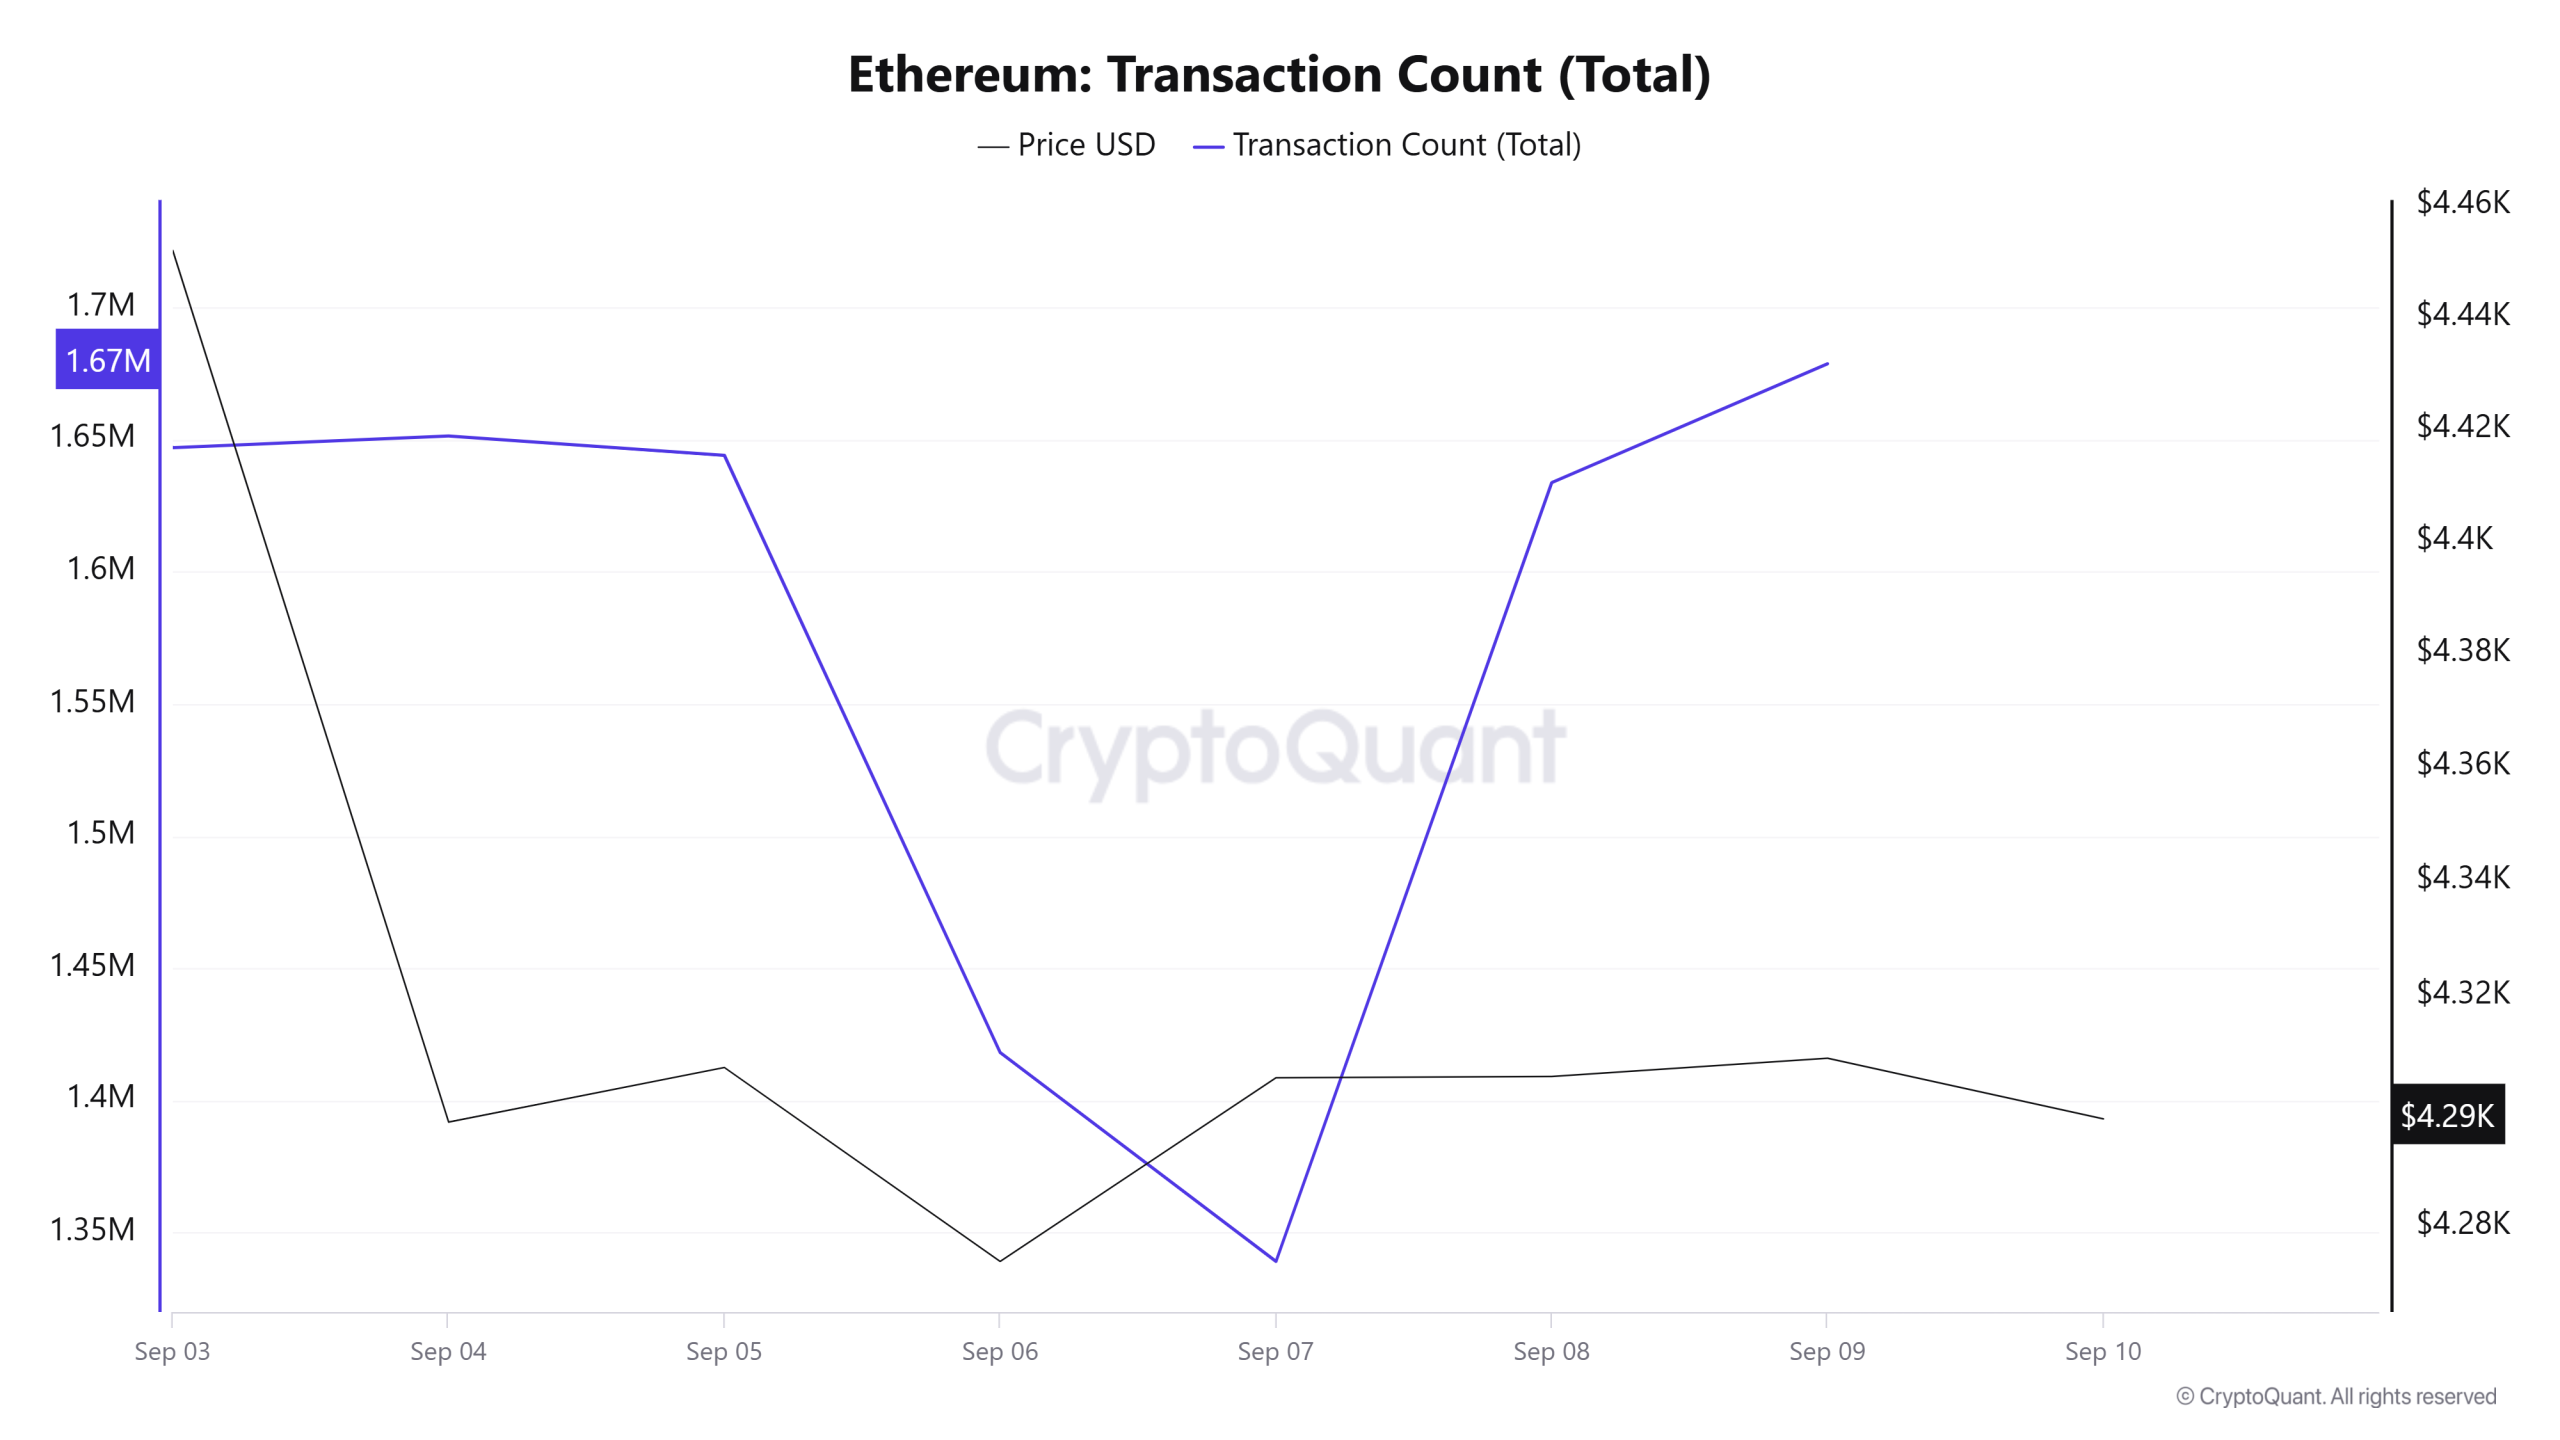
While a total of 11,345,430 transactions were made on the Ethereum network last week, the number of transactions this week decreased by approximately 2.94% to 11,011,806. The weekly high was 1,678,636 on September 9 and the low was 1,339,101 on September 7. The correlation between the number of trades and the price was generally negatively weighted. While there was a decline in the number of transactions compared to last week, this combined with the negative correlation gave more negative signals. However, the fact that there was no significant drop in trading volume shows that Ethereum burns remain strong and continue to be beneficial for the network. This contributes to the healthy functioning of the Ethereum ecosystem.
Tokens Transferred
The total amount of ETH transferred between last week and this week increased by about 6.6%, from 12,727,480 to 13,567,738. The highest weekly transfer was 2,695,633 ETH on September 4, while the lowest was 582,834 ETH on September 7. This big difference can be explained by Friday volatility and Saturday market lull. However, it also shows that volatility is still evident on a daily basis and market movements are choppy. The relationship between price and transfer amount showed a clear negative correlation this week. This can be interpreted as large transfer movements pressuring the price to sell. In other words, heavy token movement on the network has often coincided with downward price action.
The fact that the increase in the amount of tokens transferred, despite the decrease in the number of transactions, shows a decrease in the price, may indicate that it is not due to manipulation, but as a result of large investors selling their tokens, which leads to a decrease in the price.
Estimated Leverage Ratio
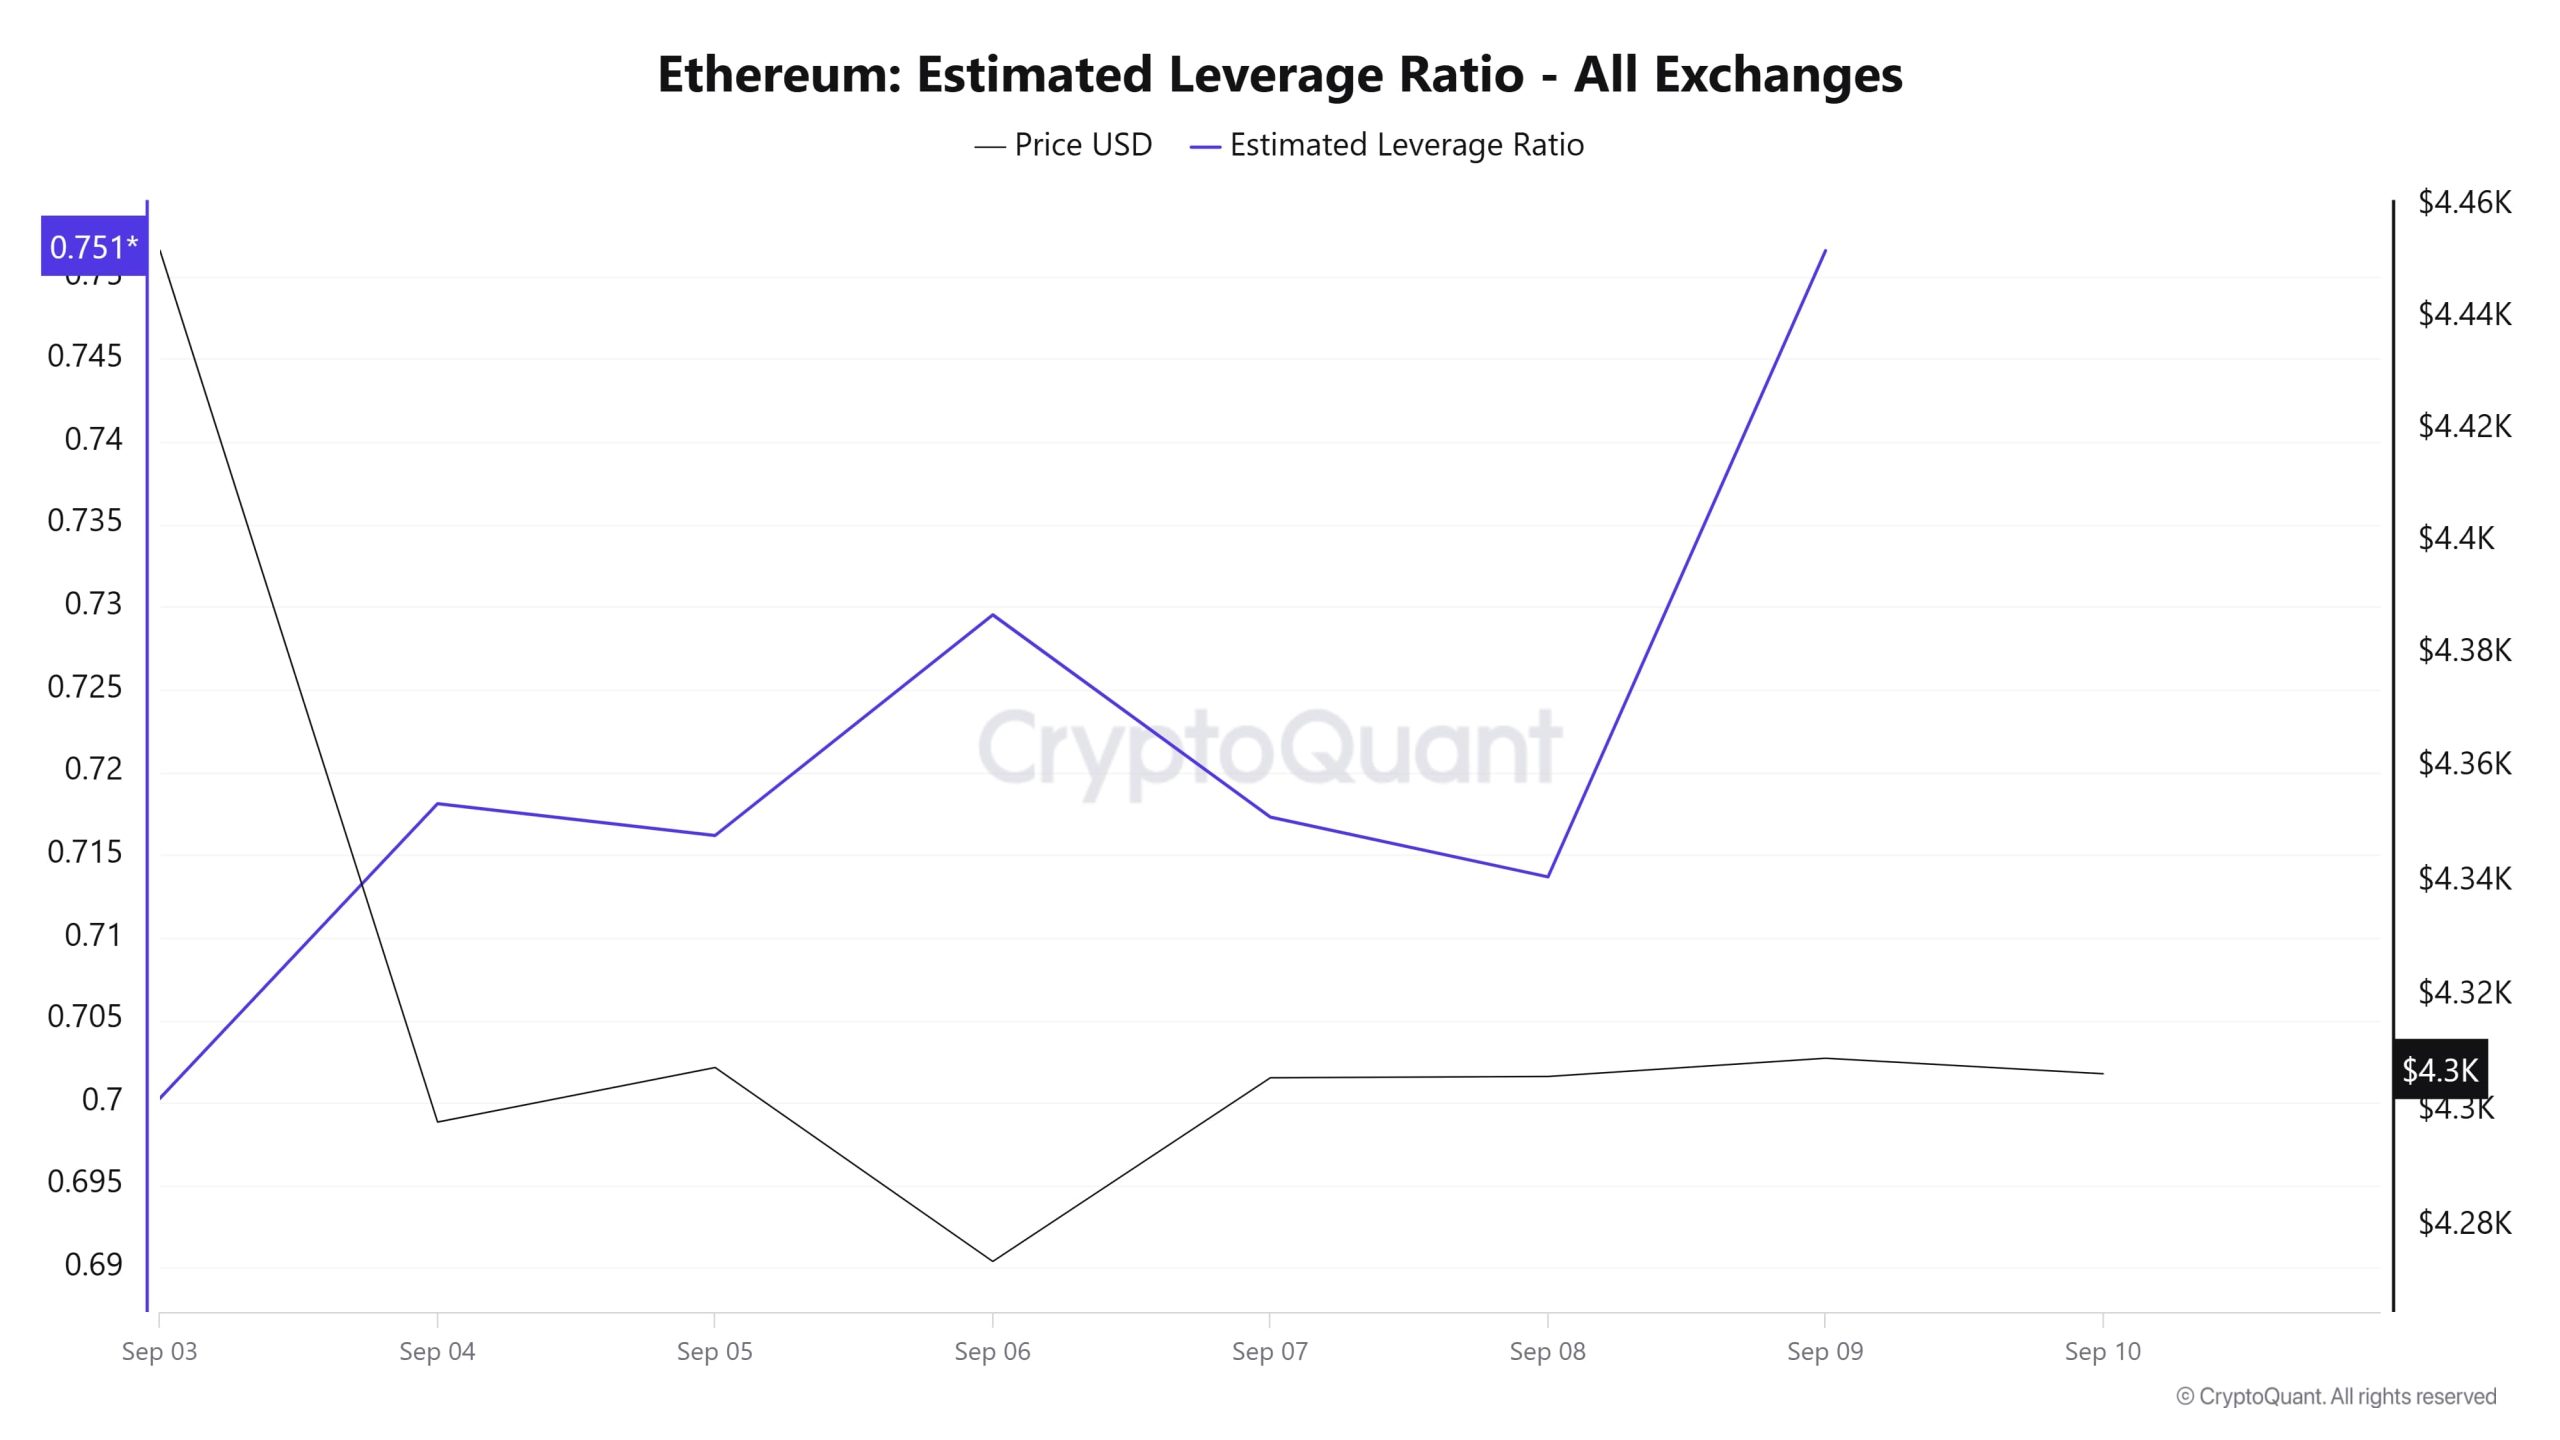 During the 7-day period, the metric displayed a steady rise throughout the entire process. ELR (Estimated Leverage Ratio), which had a value of 0.700 at the beginning of the process, also formed the lowest point of the process. Continuing to rise for the rest of the process, the metric has risen to 0.751 as of the writing of this article, forming the highest point of the process. A higher ELR means that participants are willing to take on more risk and generally indicates bullish conditions or expectations. It should be noted that these rises can also be caused by a decrease in reserves. When we look at Ethereum reserves, there were 17.35 million reserves at the beginning of the process, while this figure generally decreased during the rest of the process and is currently seen at 17.18 million. At the same time, Ethereum’s Open Interest is seen as 58.50 billion dollars at the beginning of the process. As of now, the volume increased slightly in the process and the open interest value stood out as 60.93 billion dollars. With all this data, the ELR metric increased throughout the process. The price of the asset was valued in a narrow band between $4,280 and $4,430 with all this data. At the moment, the risk appetite of investors and traders continues to be in balance and this is reflected in the price. The increase in the open interest data, which appears throughout the process, and the decrease in reserves pointed to an increase in the ELR ratio, signaling us that there was an artificial rise. As a result, the reserves decreased too much and the open interest increased, which caused an increase in the ELR metric. We can predict that the market is pessimistic and that the process may continue with a horizontal movement at the moment.
ETH Onchain Overall
| Metrics | Positive 📈 | Negative 📉 | Neutral ➖ |
|---|---|---|---|
| Active Addresses | ✓ | ||
| Total Value Staked | ✓ | ||
| Supply Distribution | ✓ | ||
| Exchange Supply Ratio | ✓ | ||
| Exchange Reserve | ✓ | ||
| Fees and Revenues | ✓ | ||
| Bloks Mined | ✓ | ||
| Transaction | ✓ | ||
| Estimated Leverage Ratio | ✓ |
*The metrics and guidance in the table do not, in and of themselves, describe or imply an expectation of future price changes for any asset. The prices of digital assets may vary depending on many different variables. The onchain analysis and related guidance are intended to assist investors in their decision-making process, and making financial investments based solely on the results of this analysis may result in harmful transactions. Even if all metrics produce a positive, negative or neutral result at the same time, the expected results may not be seen according to market conditions. Investors reviewing the report would be well advised to heed these caveats.
Legal Notice
The investment information, comments and recommendations contained in this document do not constitute investment advisory services. Investment advisory services are provided by authorized institutions on a personal basis, taking into account the risk and return preferences of individuals. The comments and recommendations contained in this document are of a general type. These recommendations may not be suitable for your financial situation and risk and return preferences. Therefore, making an investment decision based solely on the information contained in this document may not result in results that are in line with your expectations.
NOTE: All data used in Ethereum onchain analysis is based on Cryptoqaunt.