Active Addresses
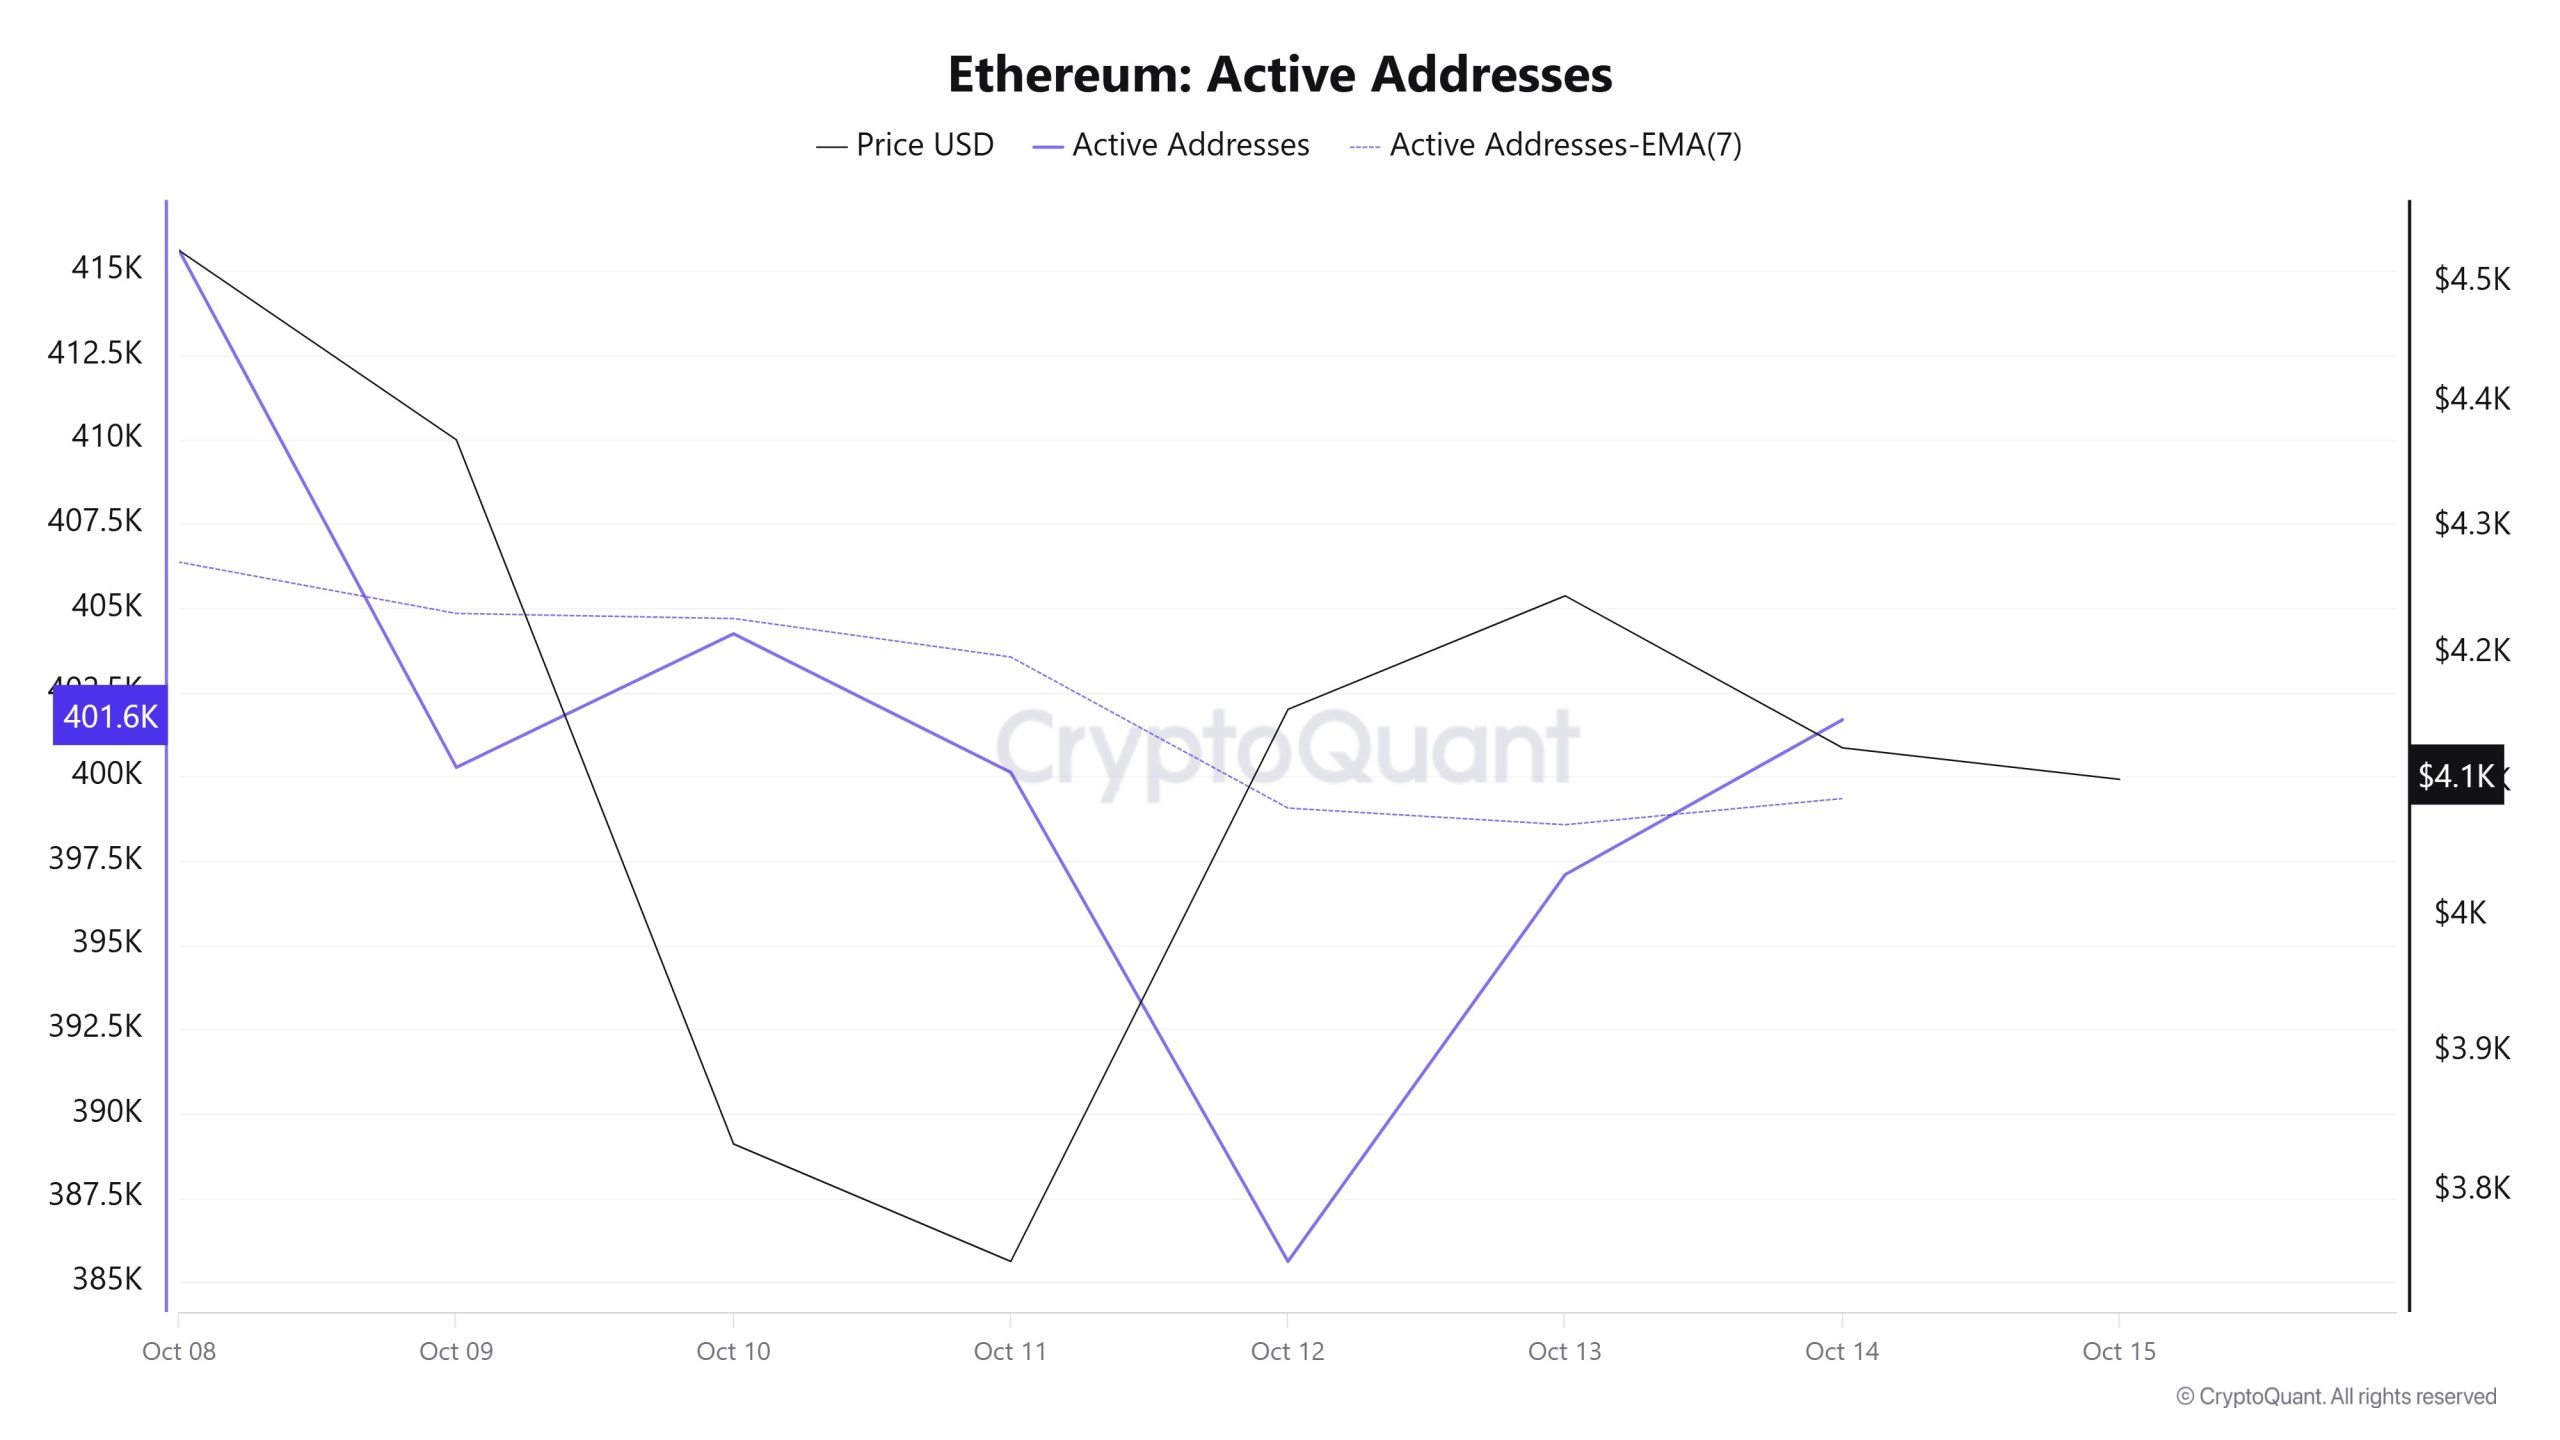
Between October 8 and October 15, a total of 415,596 active addresses were added to the Ethereum network. During this period, the Ethereum price fell from $4,526 to $4,156. Notably, on October 9, when the price reached the active address level, the price began to decline along with the number of active addresses. When examining the 7-day simple moving average (SMA), it is observed that the Ethereum price is generally trending downward.
Active Sending Addresses
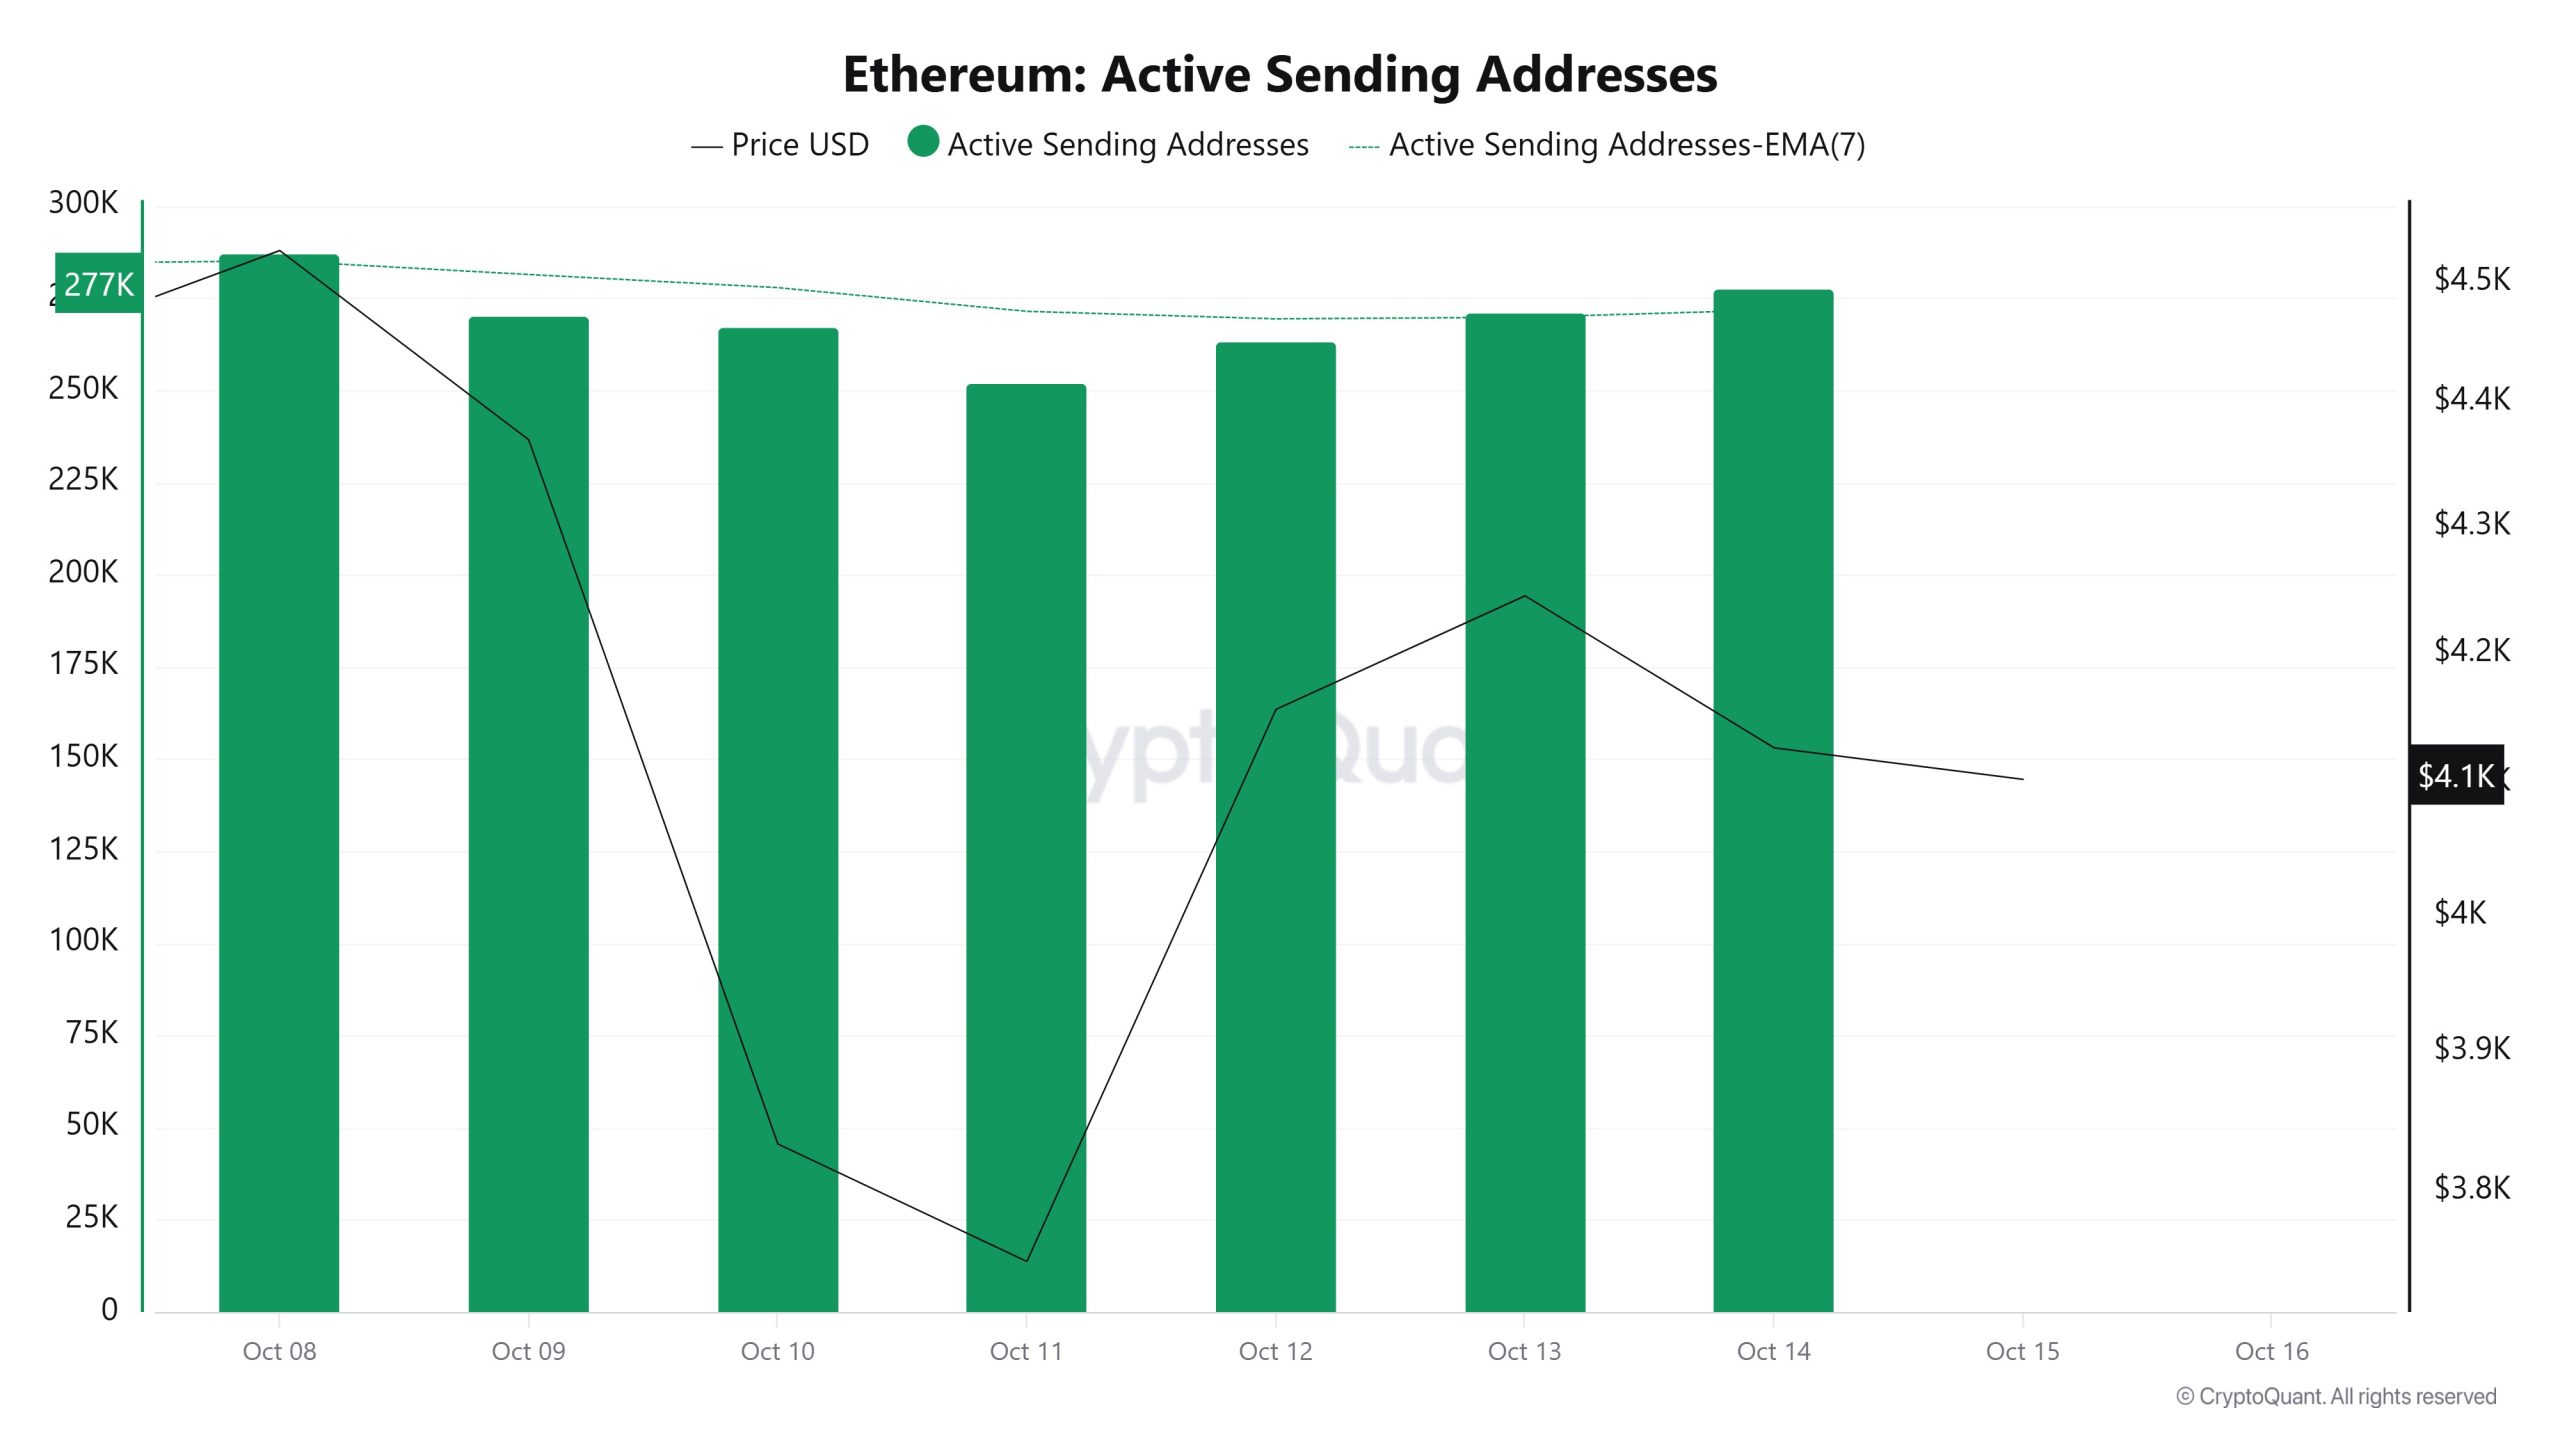 Between October 8 and October 15, high levels of active transfer activity were observed at active transfer addresses along with the Black Line (price line). On the day the price reached its highest level on a weekly basis, active transfer addresses reached 287,272.
Active Receiving Addresses
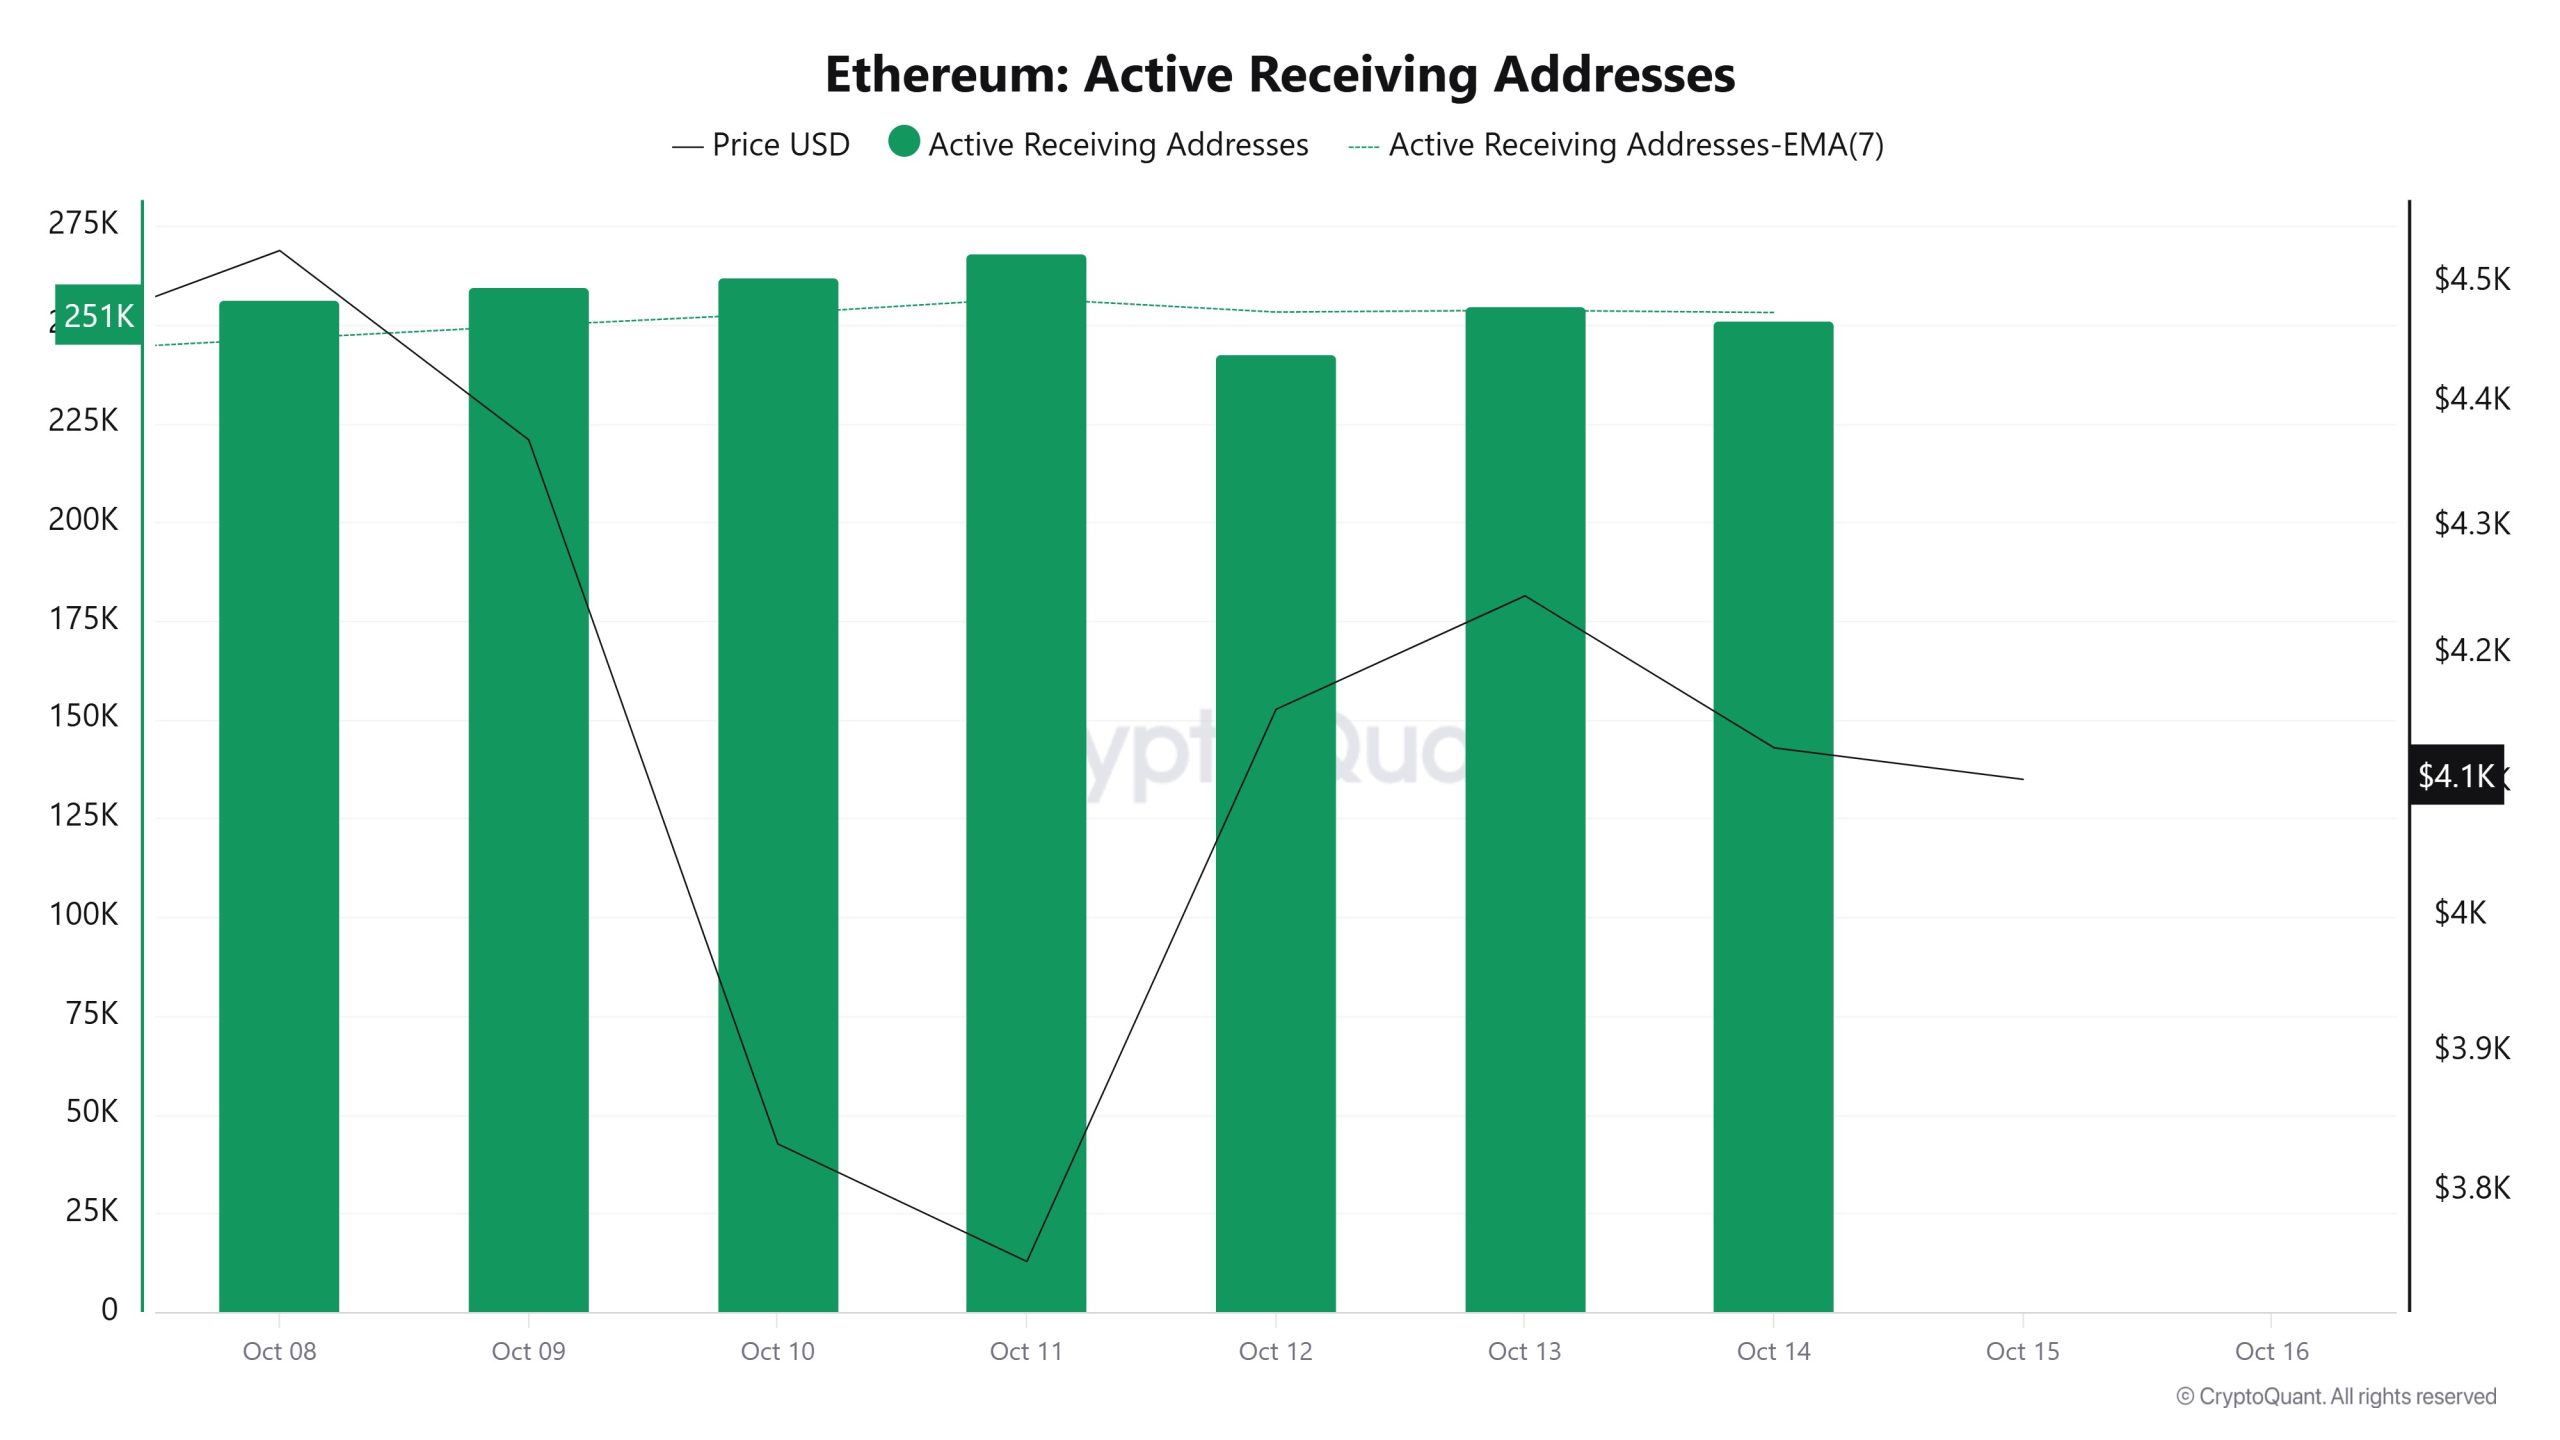 Between October 8 and October 15, while there was no significant increase in active receiving addresses, the price consolidated downward. On the day the price reached its highest level, active receiving addresses reached 268,143, indicating an increase in purchases.
Total Value Staked
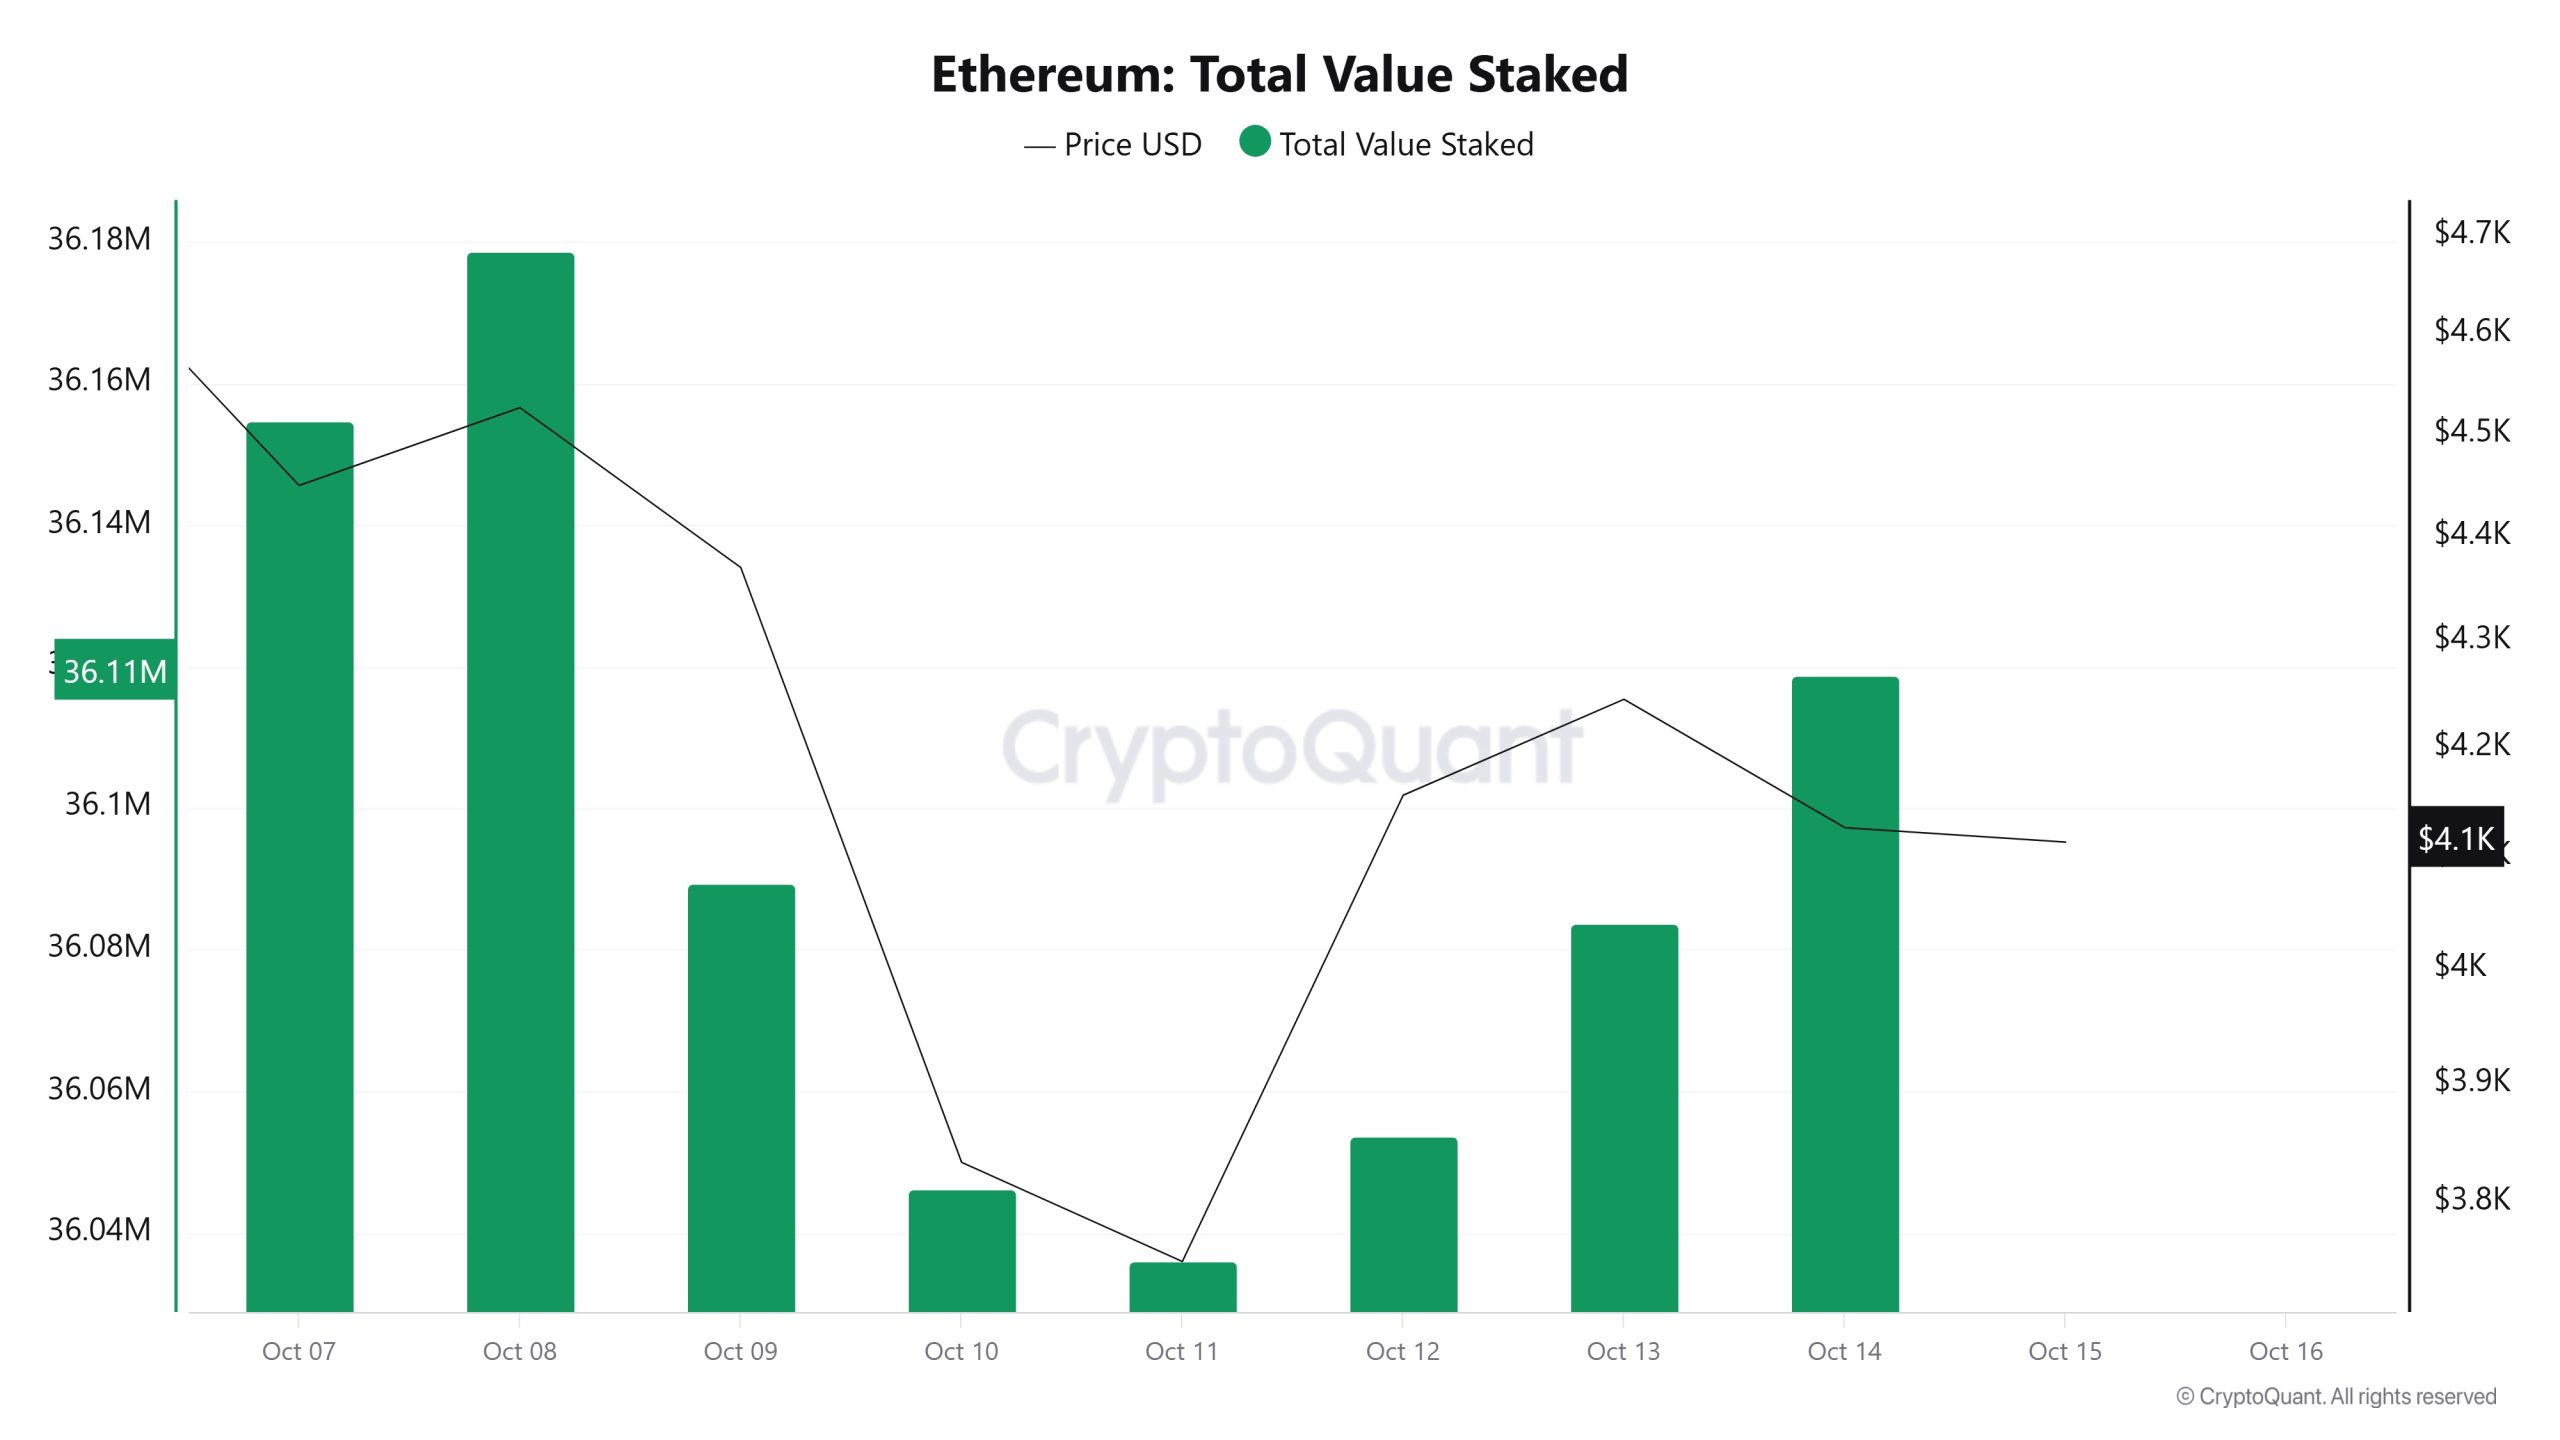 On October 8, when the ETH price was $4,526, the Total Value Staked was at 36,178,827. As of October 14, the ETH price fell to $4,126, recording an 8.84% decline, while the Total Value Staked dropped to 36,118,804, recording a 0.17% decline.
2.1. Staking Inflows
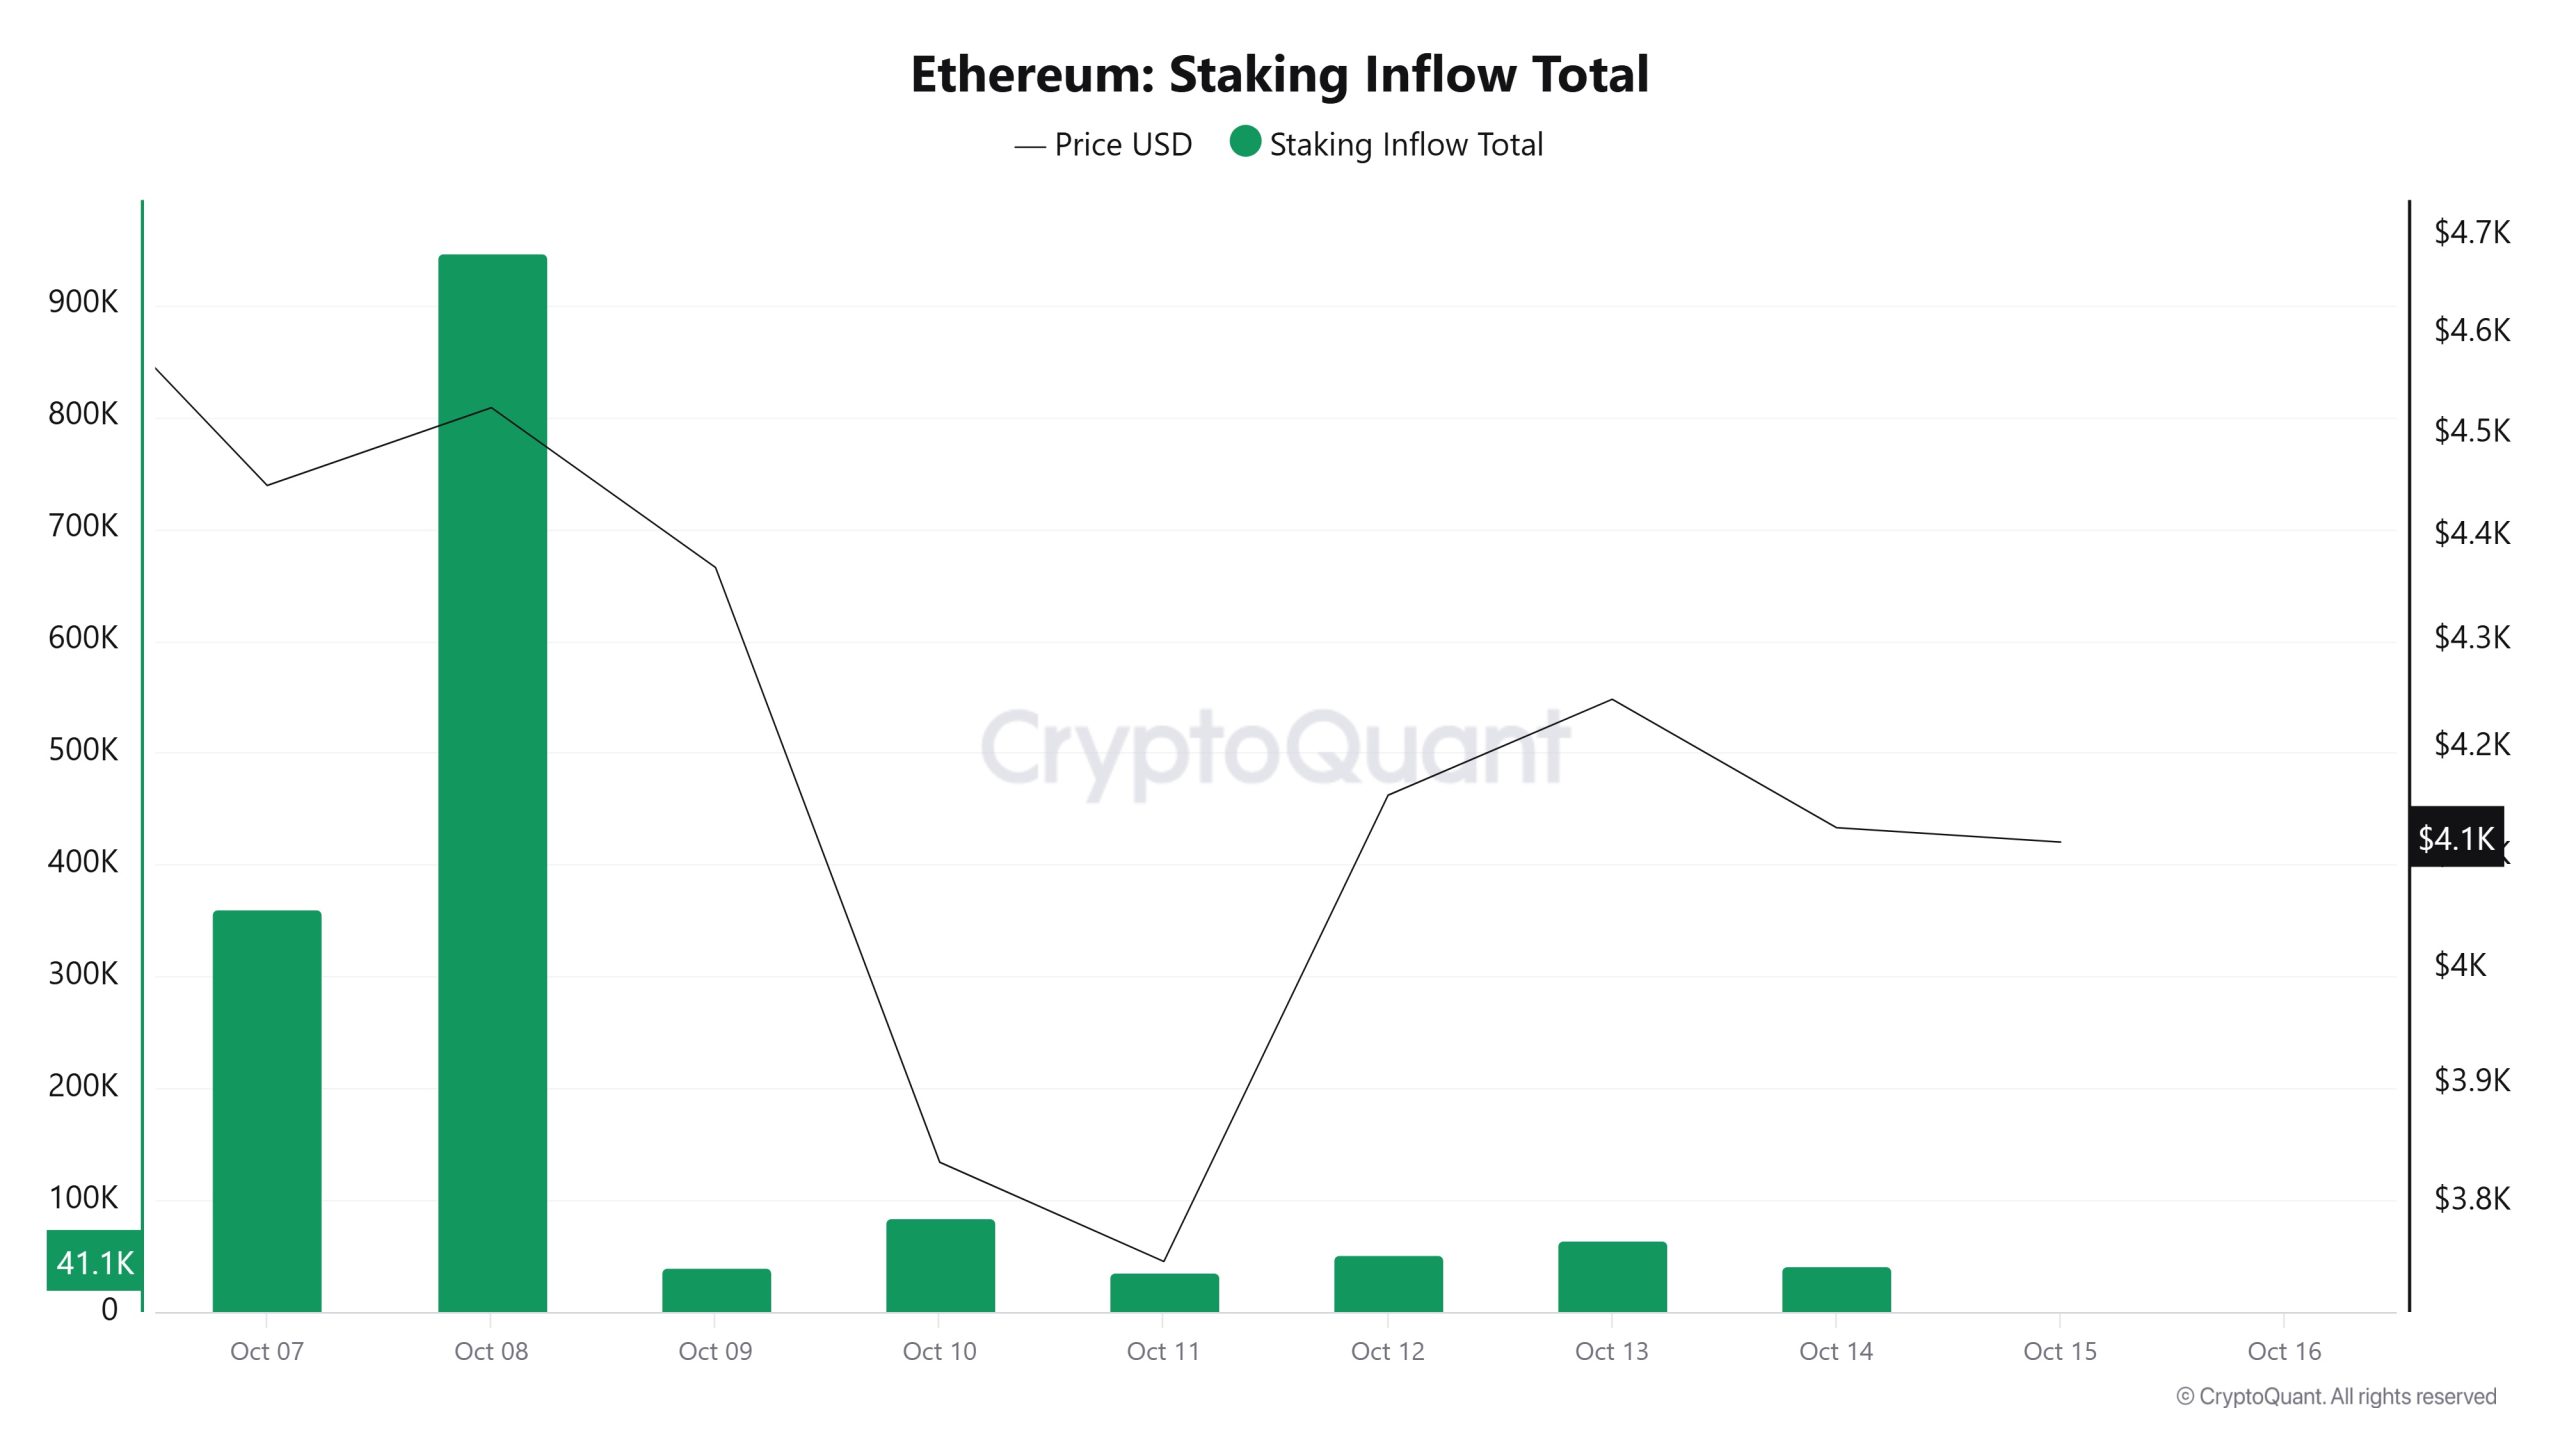 On October 8, when the ETH price was $4,526, Staking Inflow was at 946,848. As of October 14, the ETH price fell to $4,126, while Staking Inflow dropped to 41,143, recording a 95.65% decrease.
Derivatives
Open Interest
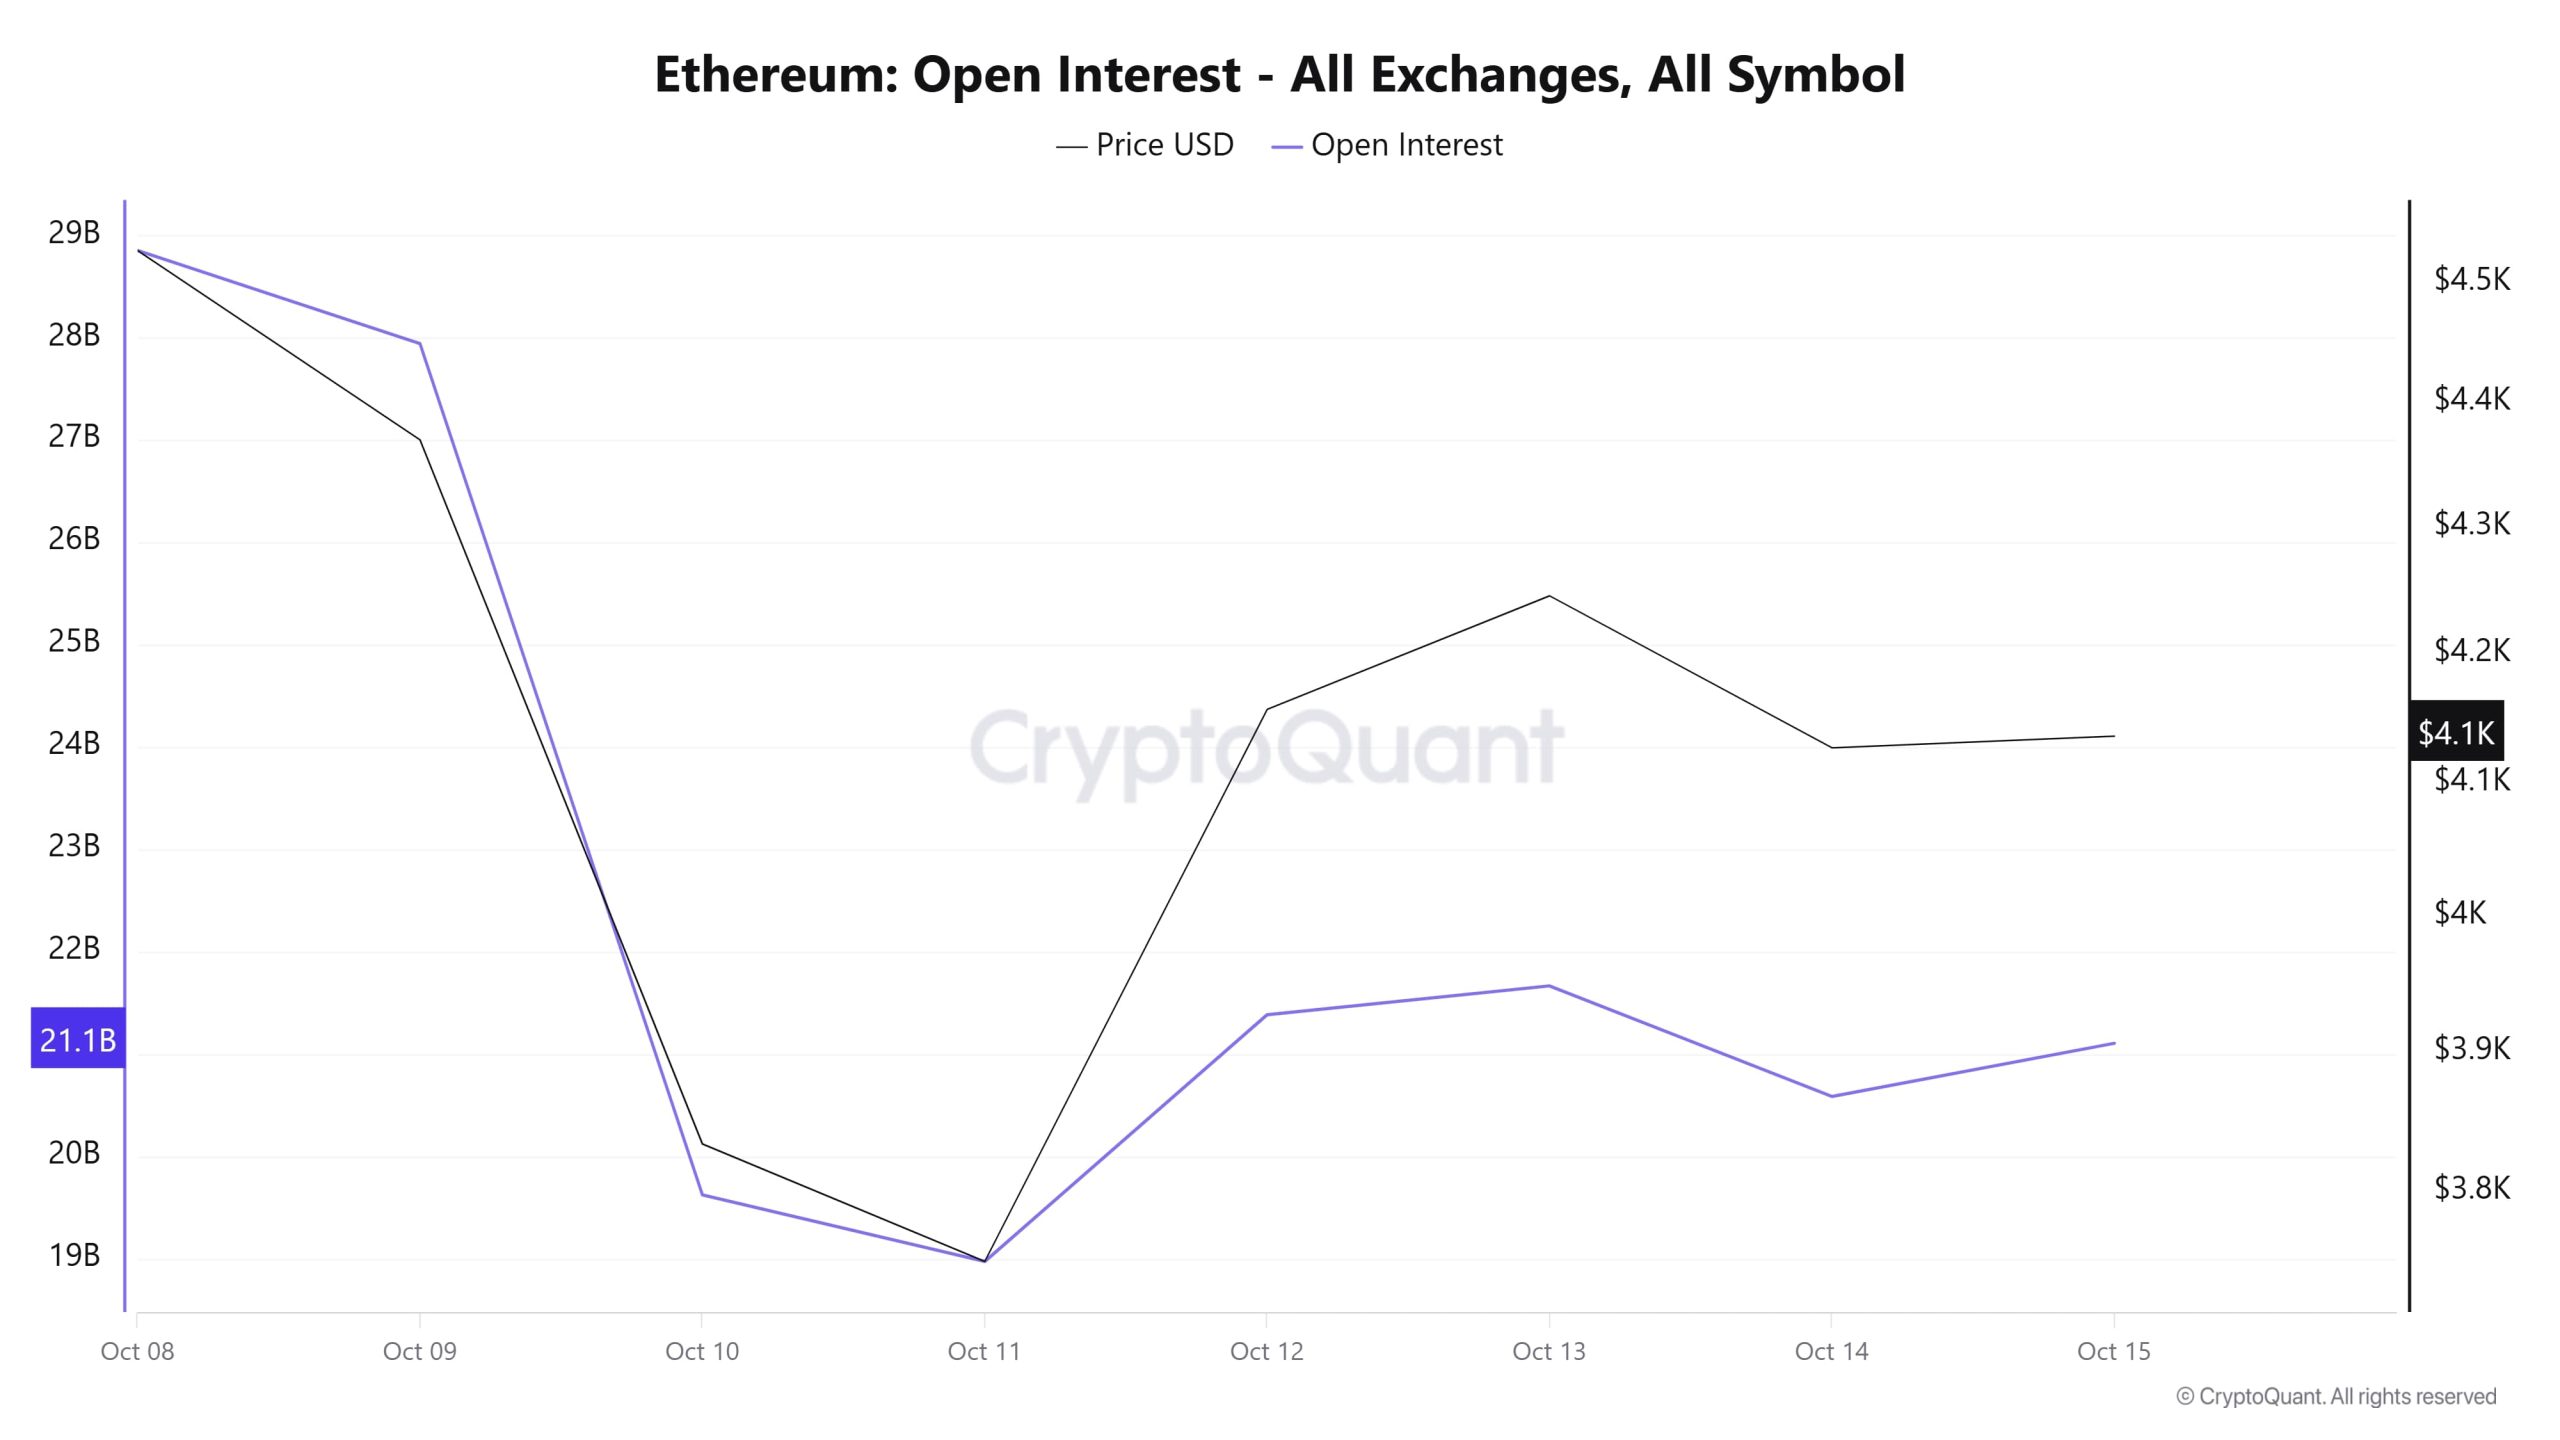
Between October 8 and 10, Ethereum’s open interest data experienced a sharp decline, with prices falling in parallel during this period. This rapid decline largely indicates the liquidation of leveraged positions or investors’ tendency to close positions. Although a gradual recovery in open interest was observed starting October 11, it has not reached previous levels, indicating that the market remains cautious. On the price front, a more pronounced recovery occurred between October 11 and 13, but a flat trend emerged again afterwards. Overall, it can be said that after the sharp decline, the Ethereum market is seeking balance and moving towards lower leverage and more cautious positioning.
Funding Rate
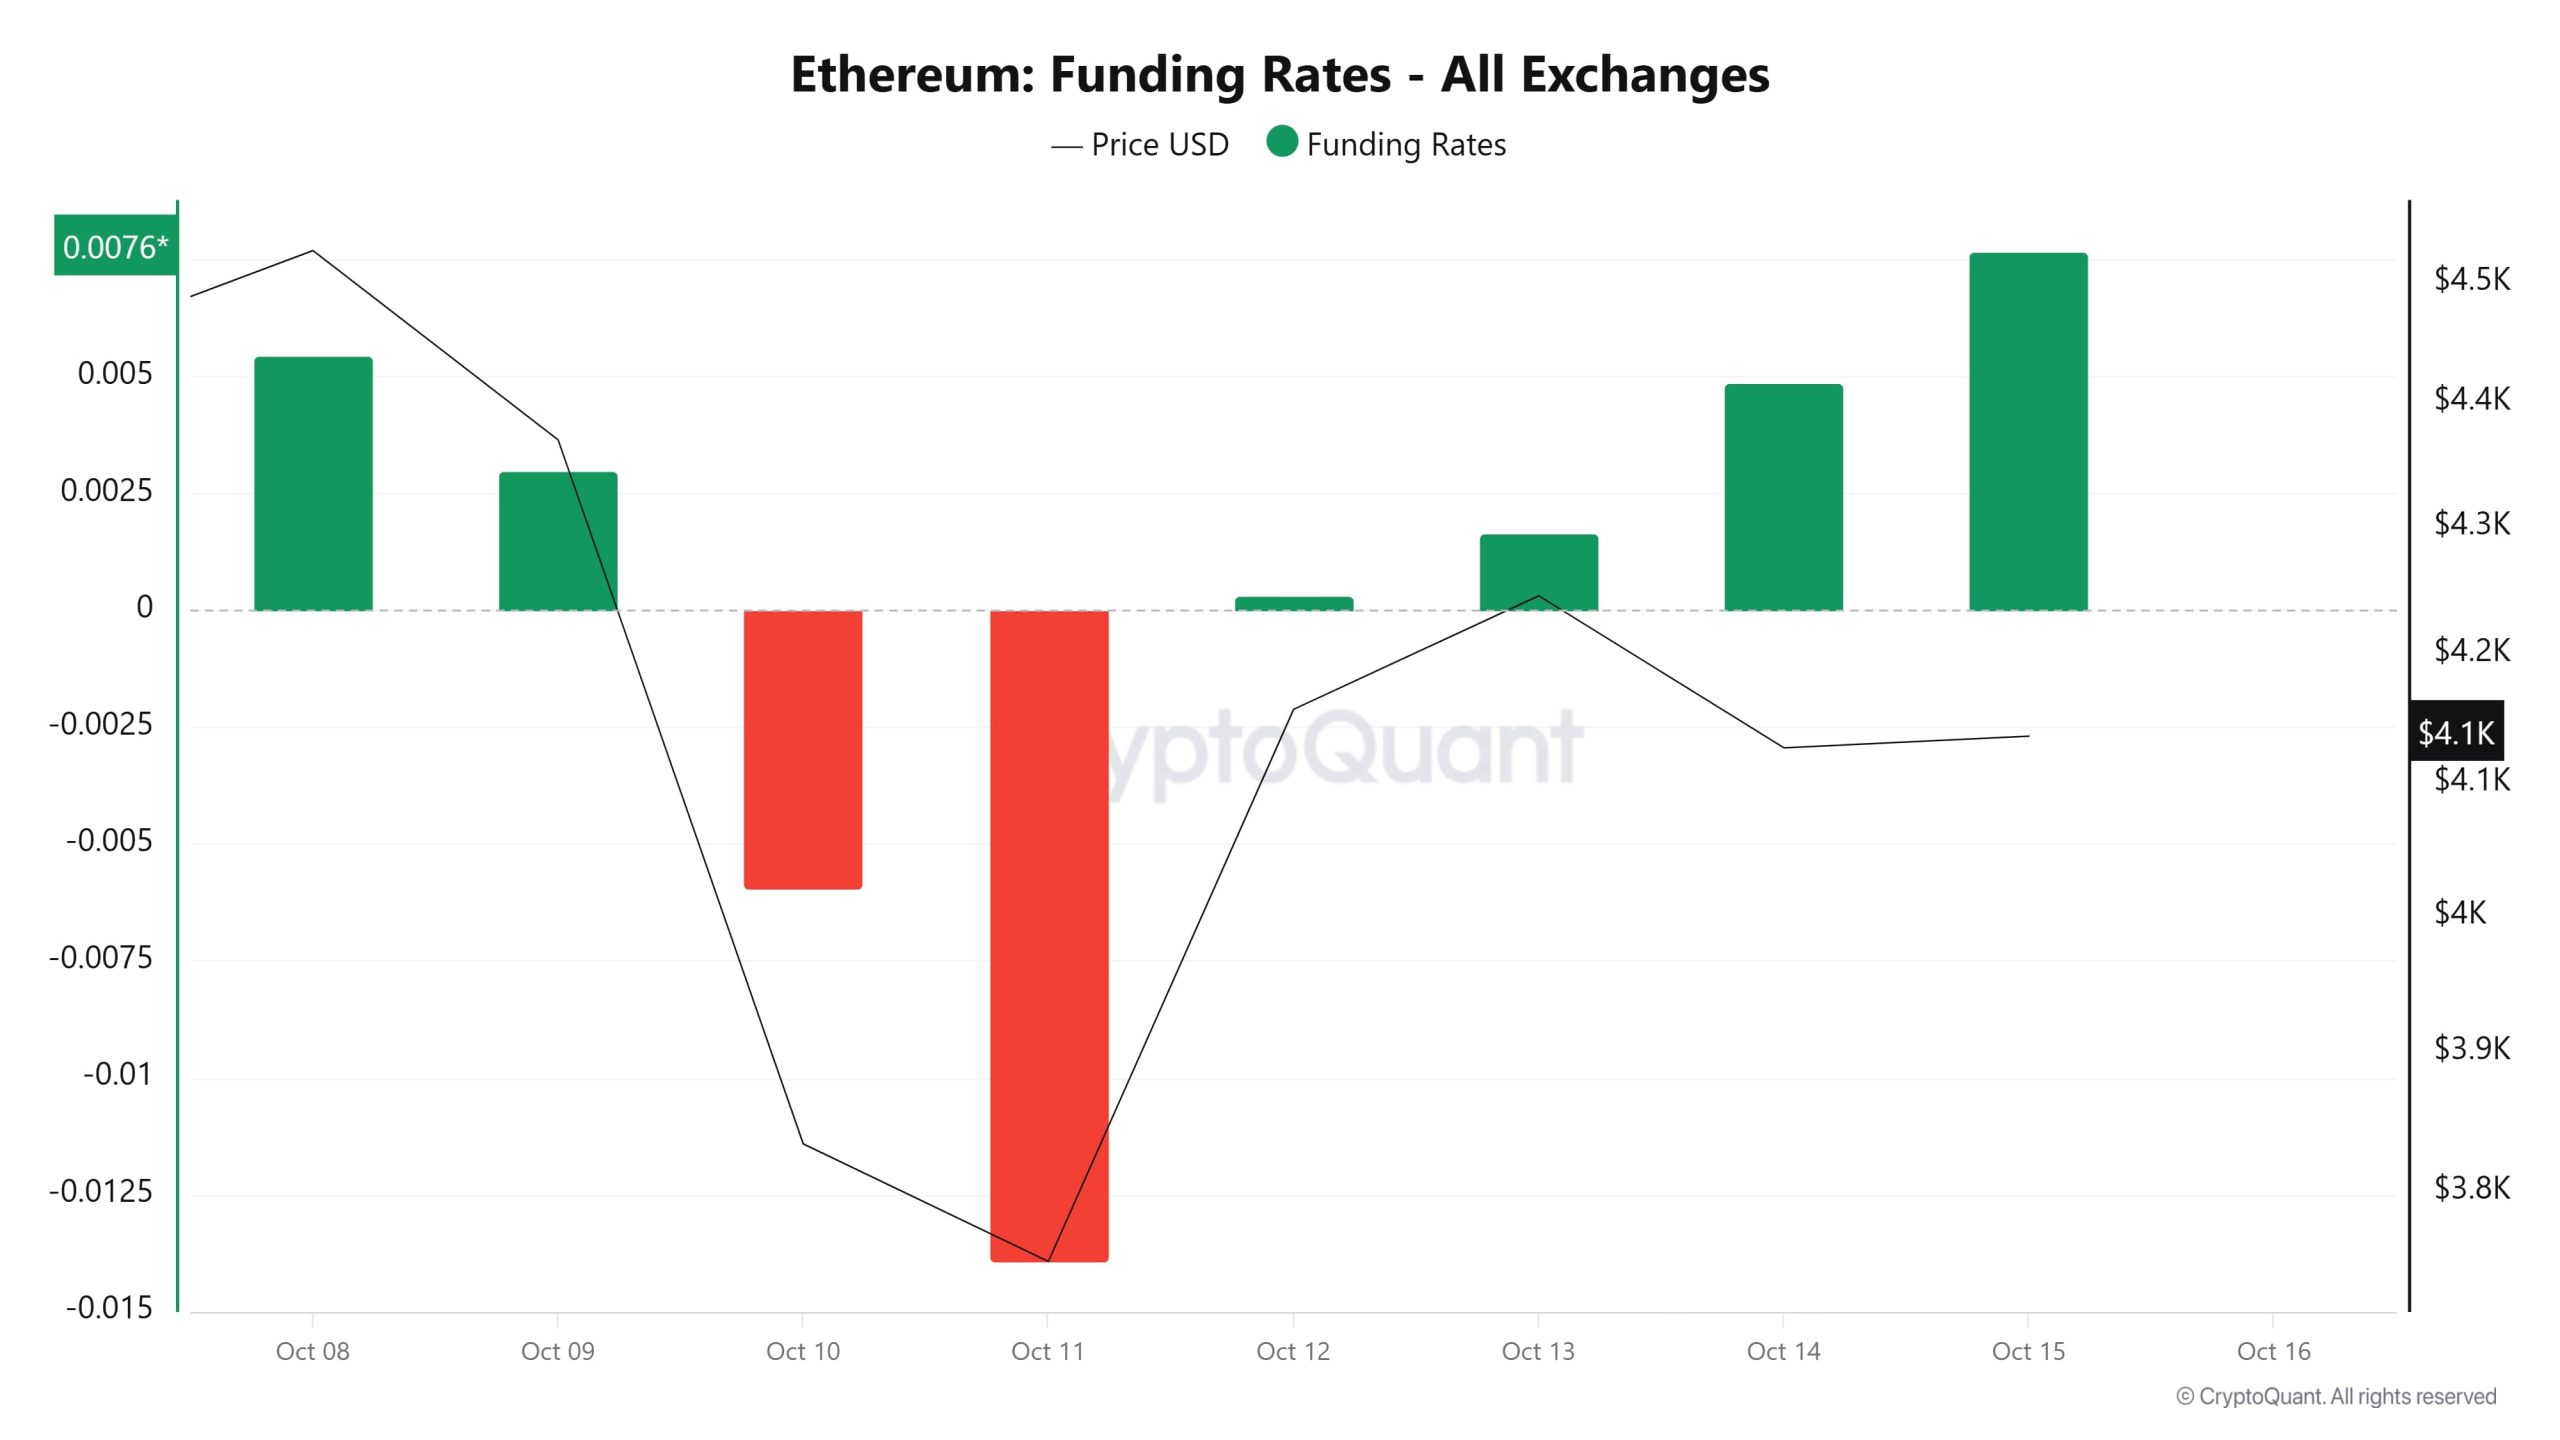 Ethereum’s funding rate data has shown a clear recovery trend in recent days. The rates, which turned negative on October 10 and 11, indicating that short positions had become dominant, have returned to positive territory since October 12. The rise in funding rate values, particularly on October 14 and 15, reveals that the market is once again favoring long positions. On the price side, ETH, which fell to around $3,400 with the decline on October 10, seems to have stabilized at the $4,100 level. Despite the increase in funding rates, the limited price response indicates that leveraged long positions have risen, but spot demand has not yet fully gained strength. The overall outlook suggests that investors maintain their bullish expectations in the short term, but the market is proceeding cautiously.
Long & Short Liquidations
Last week, particularly on Friday, approximately $1.77 billion in long positions were liquidated. During the same time period, $824 million in short positions were also liquidated.
| Dates | Long Amount (Million $) | Short Amount (Million $) |
|---|---|---|
| October 8 | 54.22 | 42.48 |
| October 9 | 214.08 | 28.78 |
| October 10 | 896.07 | 229.73 |
| October 11 | 257.15 | 62.60 |
| October 12 | 64.33 | 268.11 |
| October 13 | 57.44 | 105.68 |
| October 14 | 234.65 | 87.53 |
| Total | 1,776.94 | 824.91 |
Supply Distribution
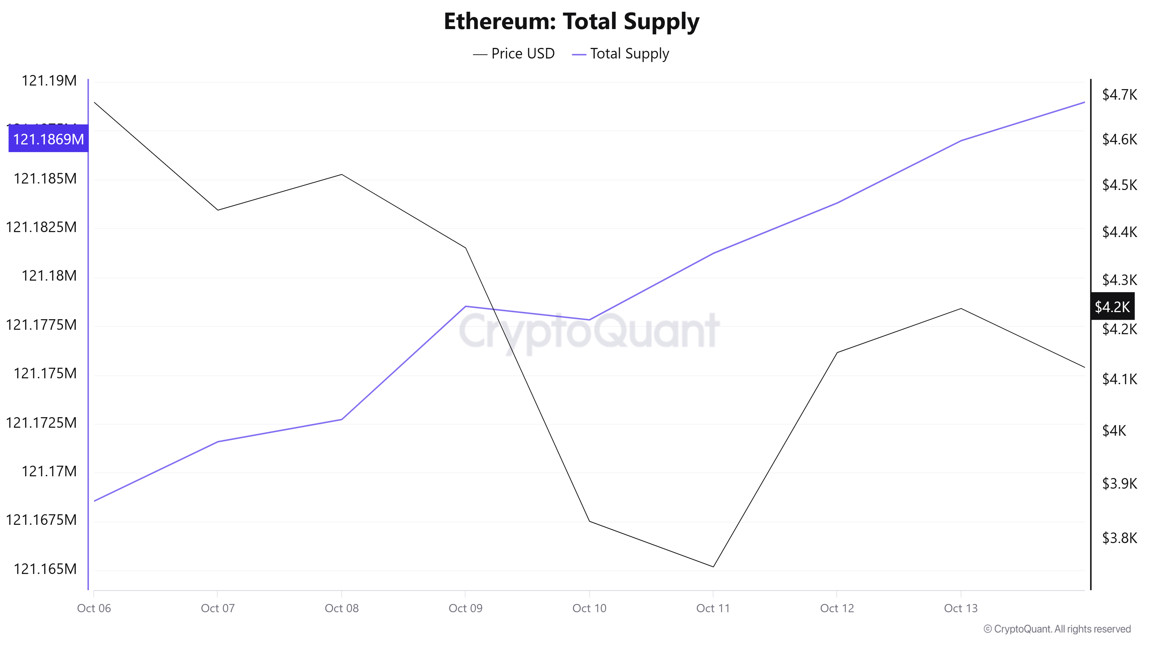
Total Supply: Reached 121,186,993 units, an increase of approximately 0.0151% compared to last week.
New Supply: The amount of ETH produced this week was 18,445.
Velocity: The velocity, which was 9.77 last week, reached 9.90 as of October 13.
| Wallet Category | October 6, 2025 | October 13, 2025 | Change (%) |
|---|---|---|---|
| 100 – 1k ETH | 8.4835M | 8.5366M | +0.63% |
| 1k – 10k ETH | 13.1369M | 12.0377M | −8.38% |
| 10k – 100k ETH | 21.7766M | 21.9659M | +0.87% |
| 100k+ ETH | 4.1781M | 4.1815M | +0.08% |
According to the latest weekly data, the Ethereum wallet distribution saw an increase of approximately 0.63% in the 100–1k ETH range, rising from 8.4835M to 8.5366M. The 1k–10k ETH segment declined by approximately 8.38%, falling from 13.1369M to 12.0377M. The 10k–100k ETH group increased from 21.7766M to 21.9659M, showing an approximate 0.87% rise. The most notable movement occurred in the 100k+ ETH category; this segment rose from 4.1781M to 4.1815M, recording an approximate 0.08% increase.
Exchange Supply Ratio
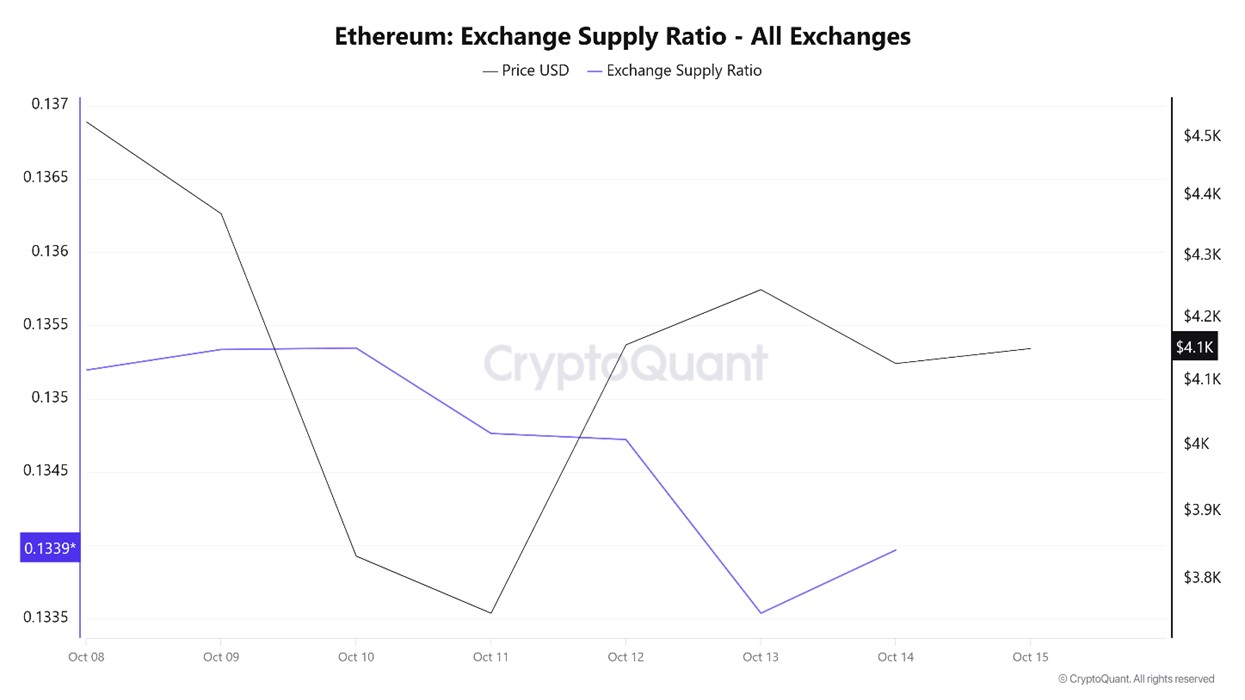
Between October 8 and 15, following Trump’s statements regarding China, crypto markets began to decline, causing the Ethereum Exchange Supply Ratio to drop from 0.13519414 to 0.13396711. During this period, the price of Ethereum fell from $4,369 to $4,126. This week in particular, the positive correlation between price and Exchange Supply Ratio indicates that the amount of Ethereum supplied to exchanges decreased alongside the price decline, suggesting that long-term investors may have stopped holding their assets. Overall, uncertainty prevails in the price of Ethereum.
Exchange Reserve
“Ethereum Exchange Reserve – All Exchanges Visual to be Added”
Between October 8 and 14, 2025, Ethereum reserves on exchanges declined from approximately 16,190,977 ETH to 15,847,271 ETH, resulting in a net outflow of 343,707 ETH. During this period, reserves decreased by approximately 2.12%, while the ETH price fell from $4,449 to $4,127, losing approximately 7.26% of its value. Despite the price decline, this decrease in exchange reserves indicates that investors are attempting to turn the selling pressure into an opportunity and that there are buying-oriented movements. However, the weak overall market outlook was insufficient to support this trend.
| Date | Exchange Inflow | Exchange Outflow | Exchange Netflow | Exchange Reserve | ETH Price ($) |
|---|---|---|---|---|---|
| 08-Oct | 1,623,378 | 1,829,533 | -206,155 | 15,984,823 | 4,449 |
| 09-Oct | 1,006,443 | 988,687 | 17,756 | 16,002,579 | 4,370 |
| 10-Oct | 1,276,069 | 1,275,100 | 970 | 16,003,549 | 3,834 |
| 11-Oct | 1,491,507 | 1,559,801 | -68,295 | 15,935,254 | 3,751 |
| 12-Oct | 767,719 | 771,506 | -3,788 | 15,931,467 | 4,156 |
| 13-Oct | 1,480,444 | 1,617,183 | -136,739 | 15,794,727 | 4,245 |
| 14-Oct | 1,603,770 | 1,551,227 | 52,543 | 15,847,271 | 4,127 |
Fees and Revenues
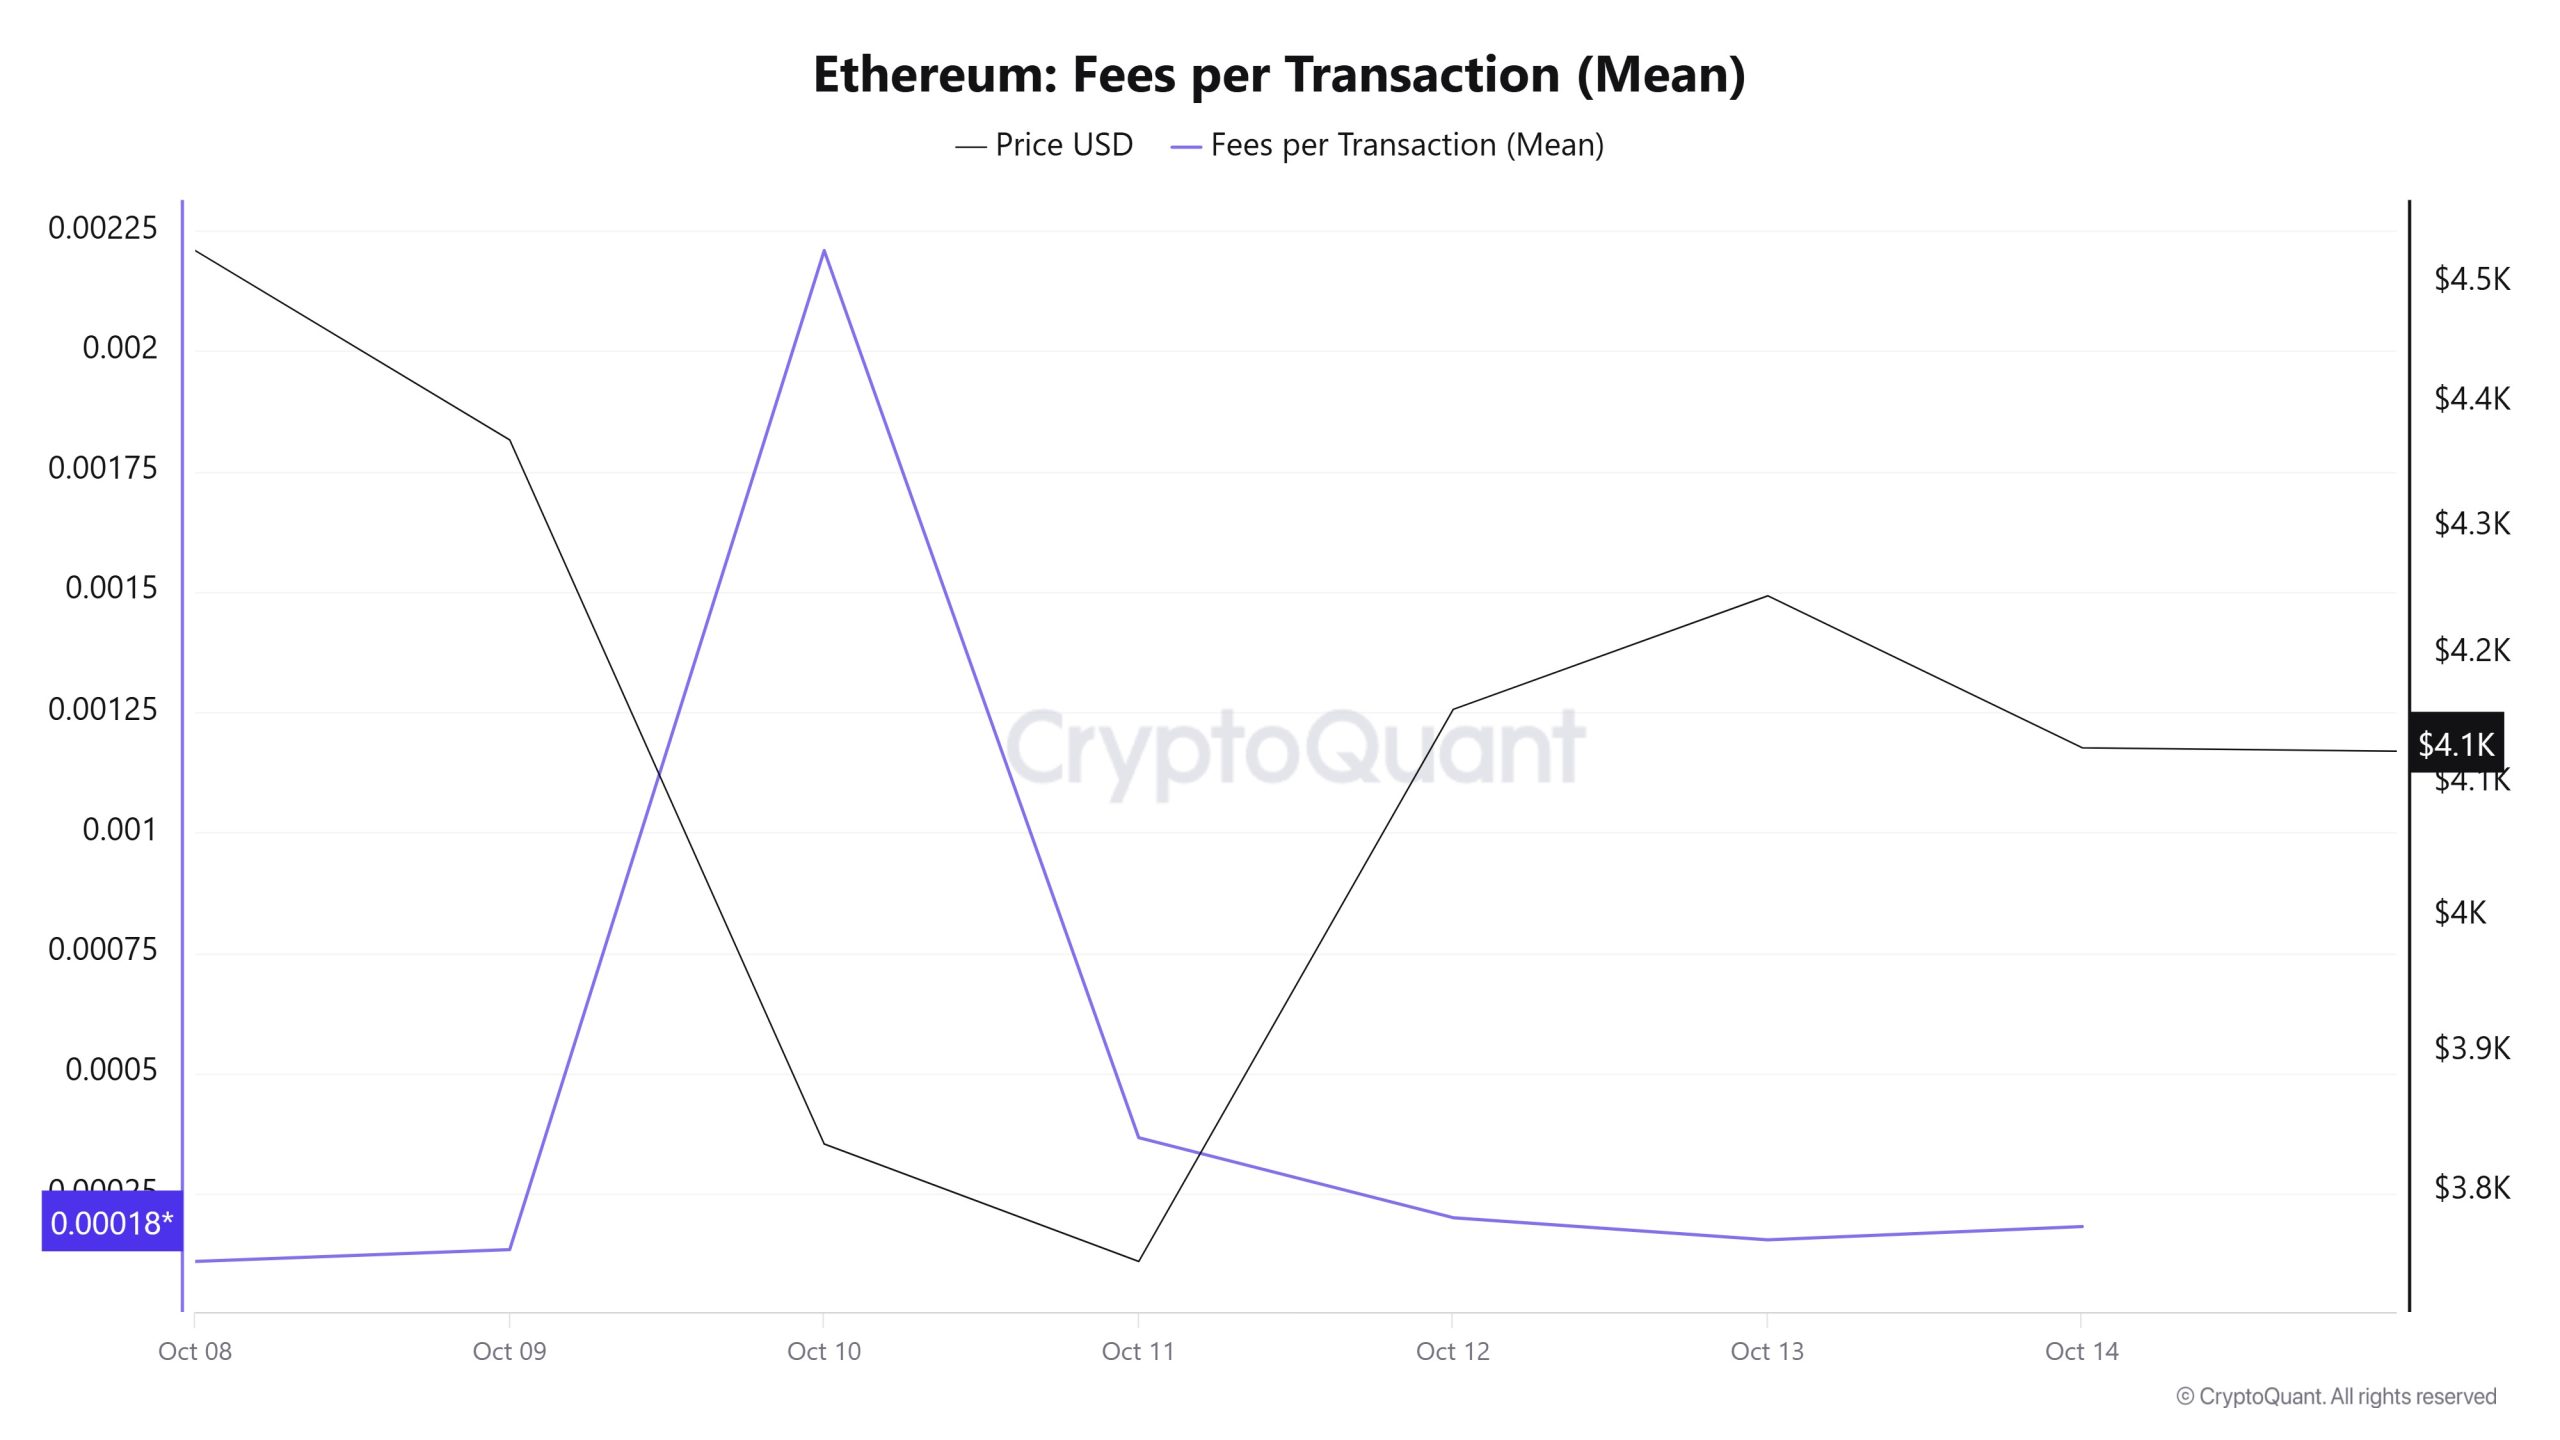
When examining the Ethereum Fees per Transaction (Mean) data between October 8 and 14, it is seen that on October 8, the first day of the week, the indicator stood at 0.000109868748783491.
Following this date, the indicator followed a rapid trajectory due to the volatility in the Ethereum price, reaching 0.002208496036473896 on October 10, recording the highest value of the week.
In the following days, the Ethereum Fees per Transaction (Mean) indicator resumed its downward trend and closed at 0.00018237250721277 on October 14, the last day of the week.
Ethereum: Fees (Total)
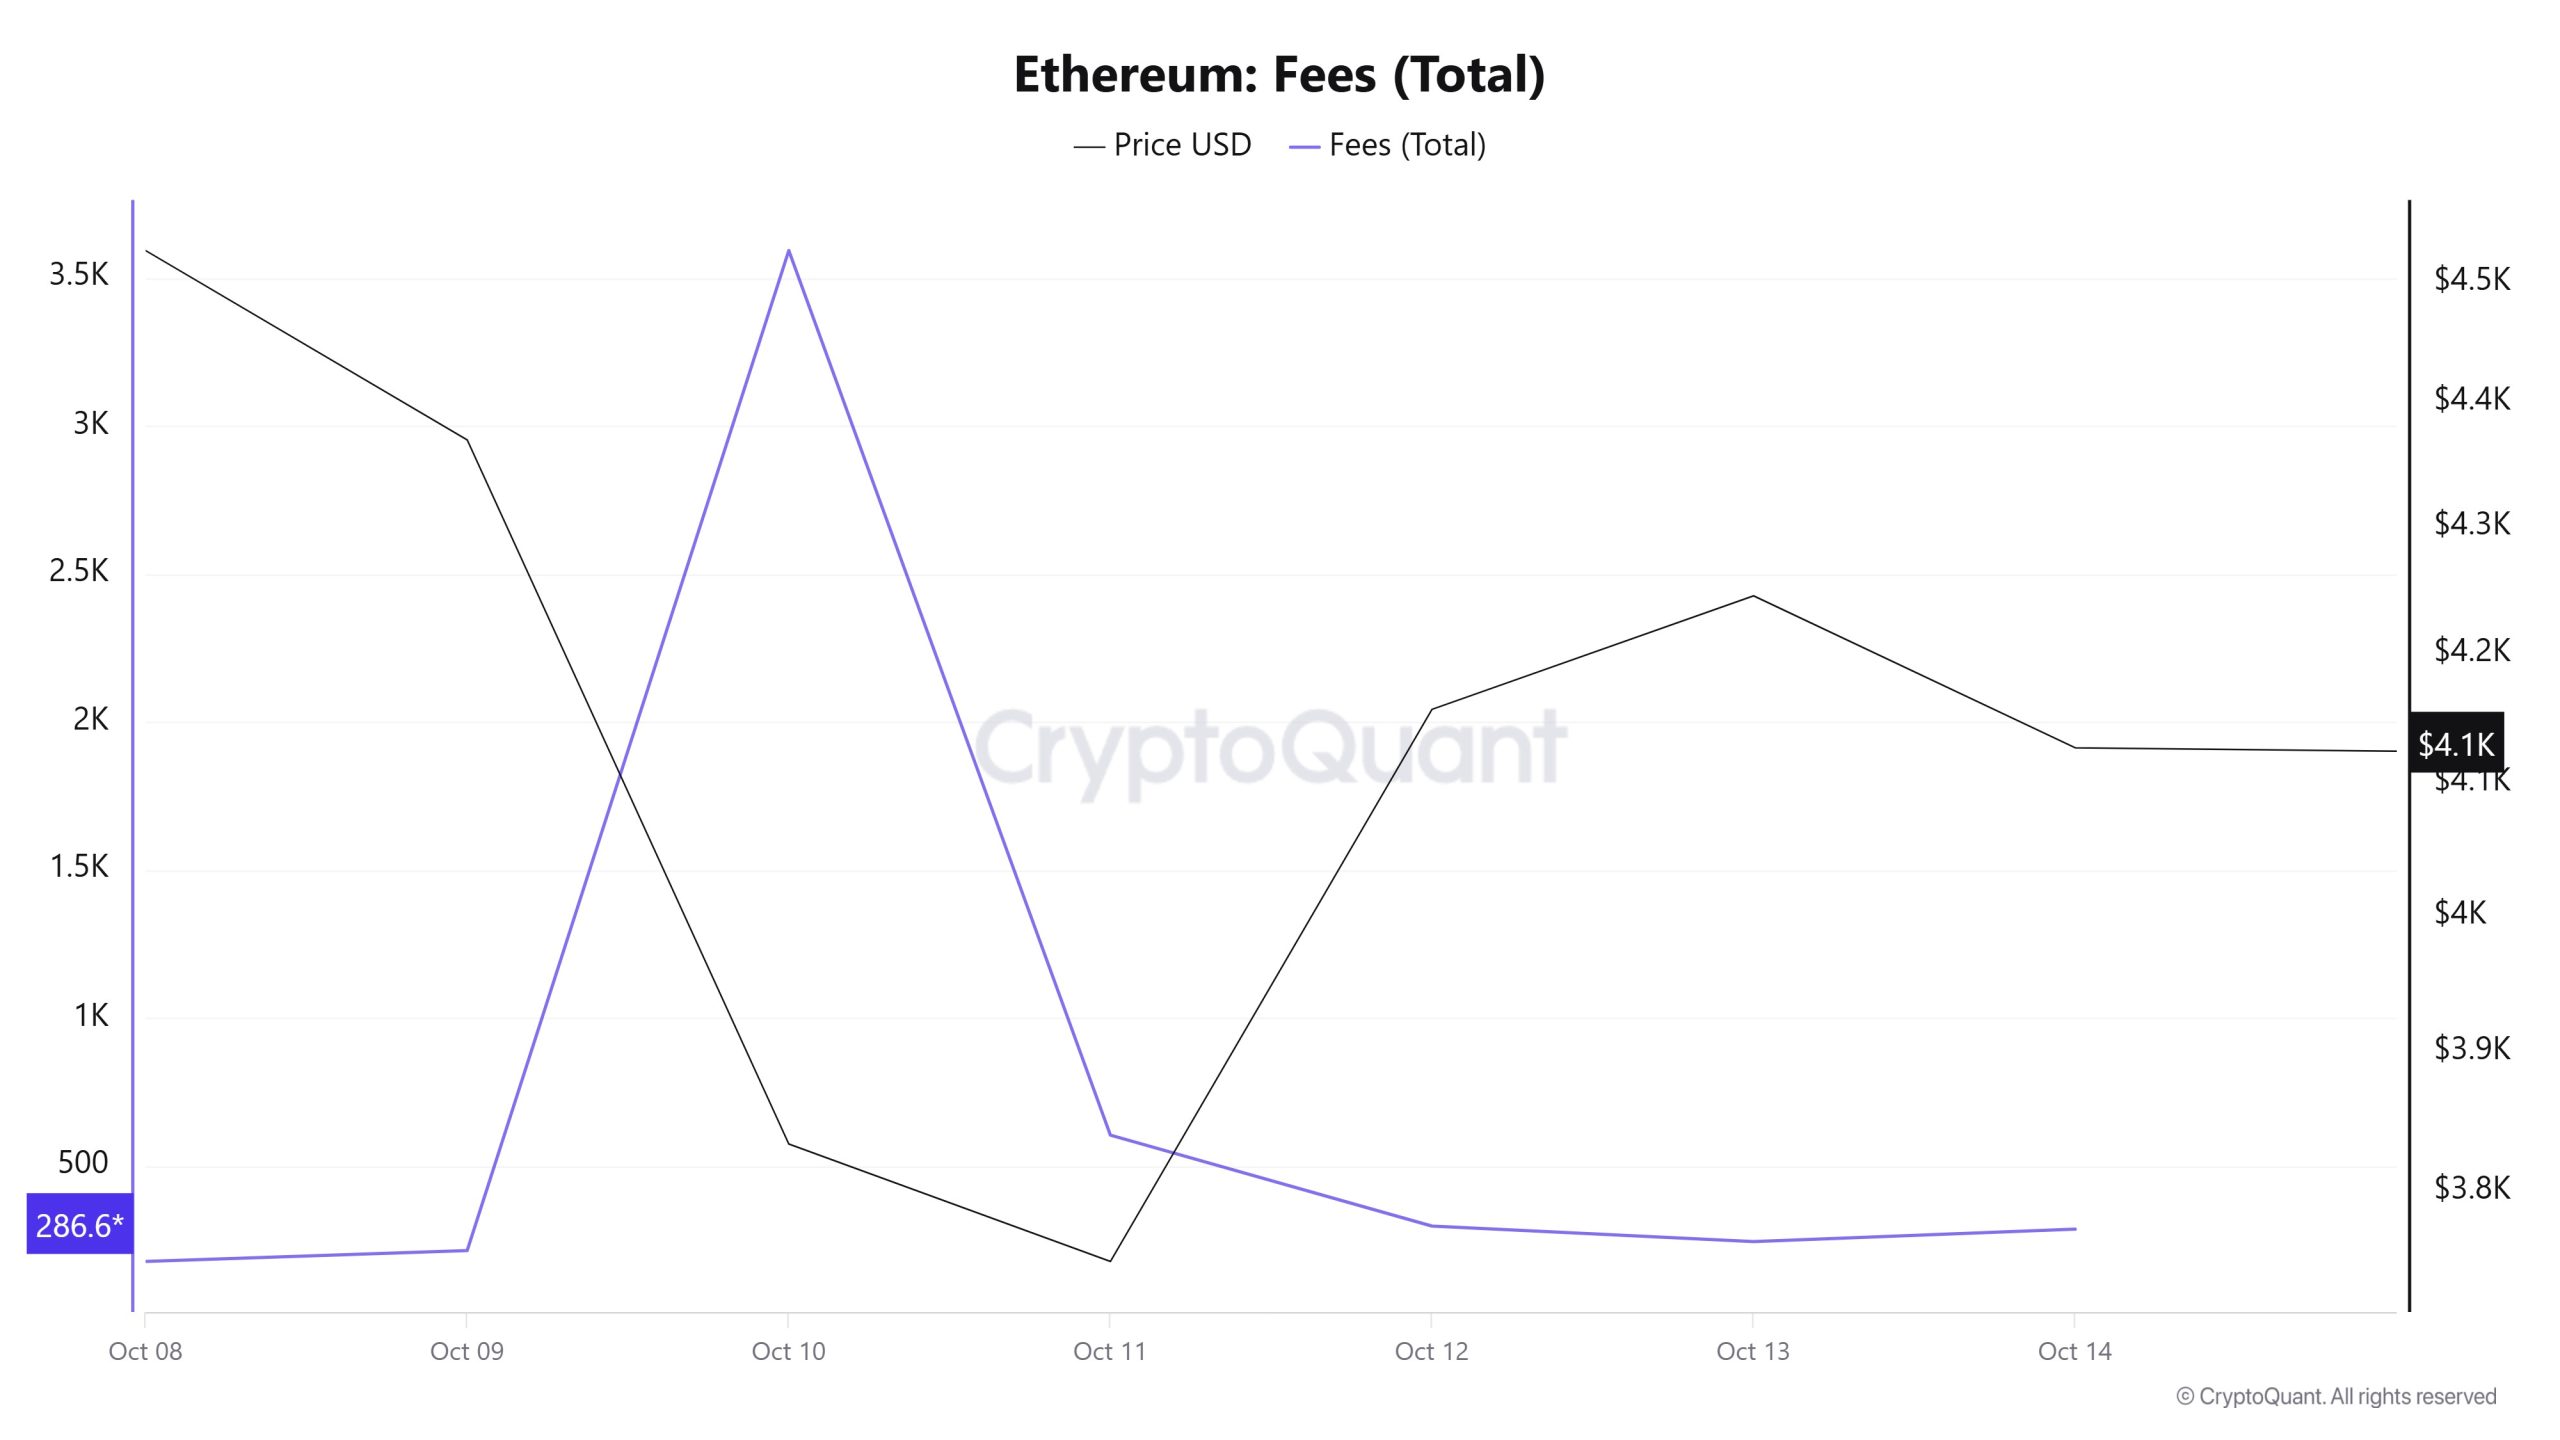
Similarly, when examining the Ethereum Fees (Total) data between October 8 and 14, it can be seen that the indicator reached 177.55723687776805 on October 8, the first day of the week.
Following this date, the indicator followed a rapid trajectory due to the volatility in the Ethereum price, reaching 3592.944780842433 on October 10, recording the highest value of the week.
In the following days, the Ethereum Fees (Total) indicator resumed its downward trend and closed at 286.65839563974095 on October 14, the last day of the week.
Blocks Mined
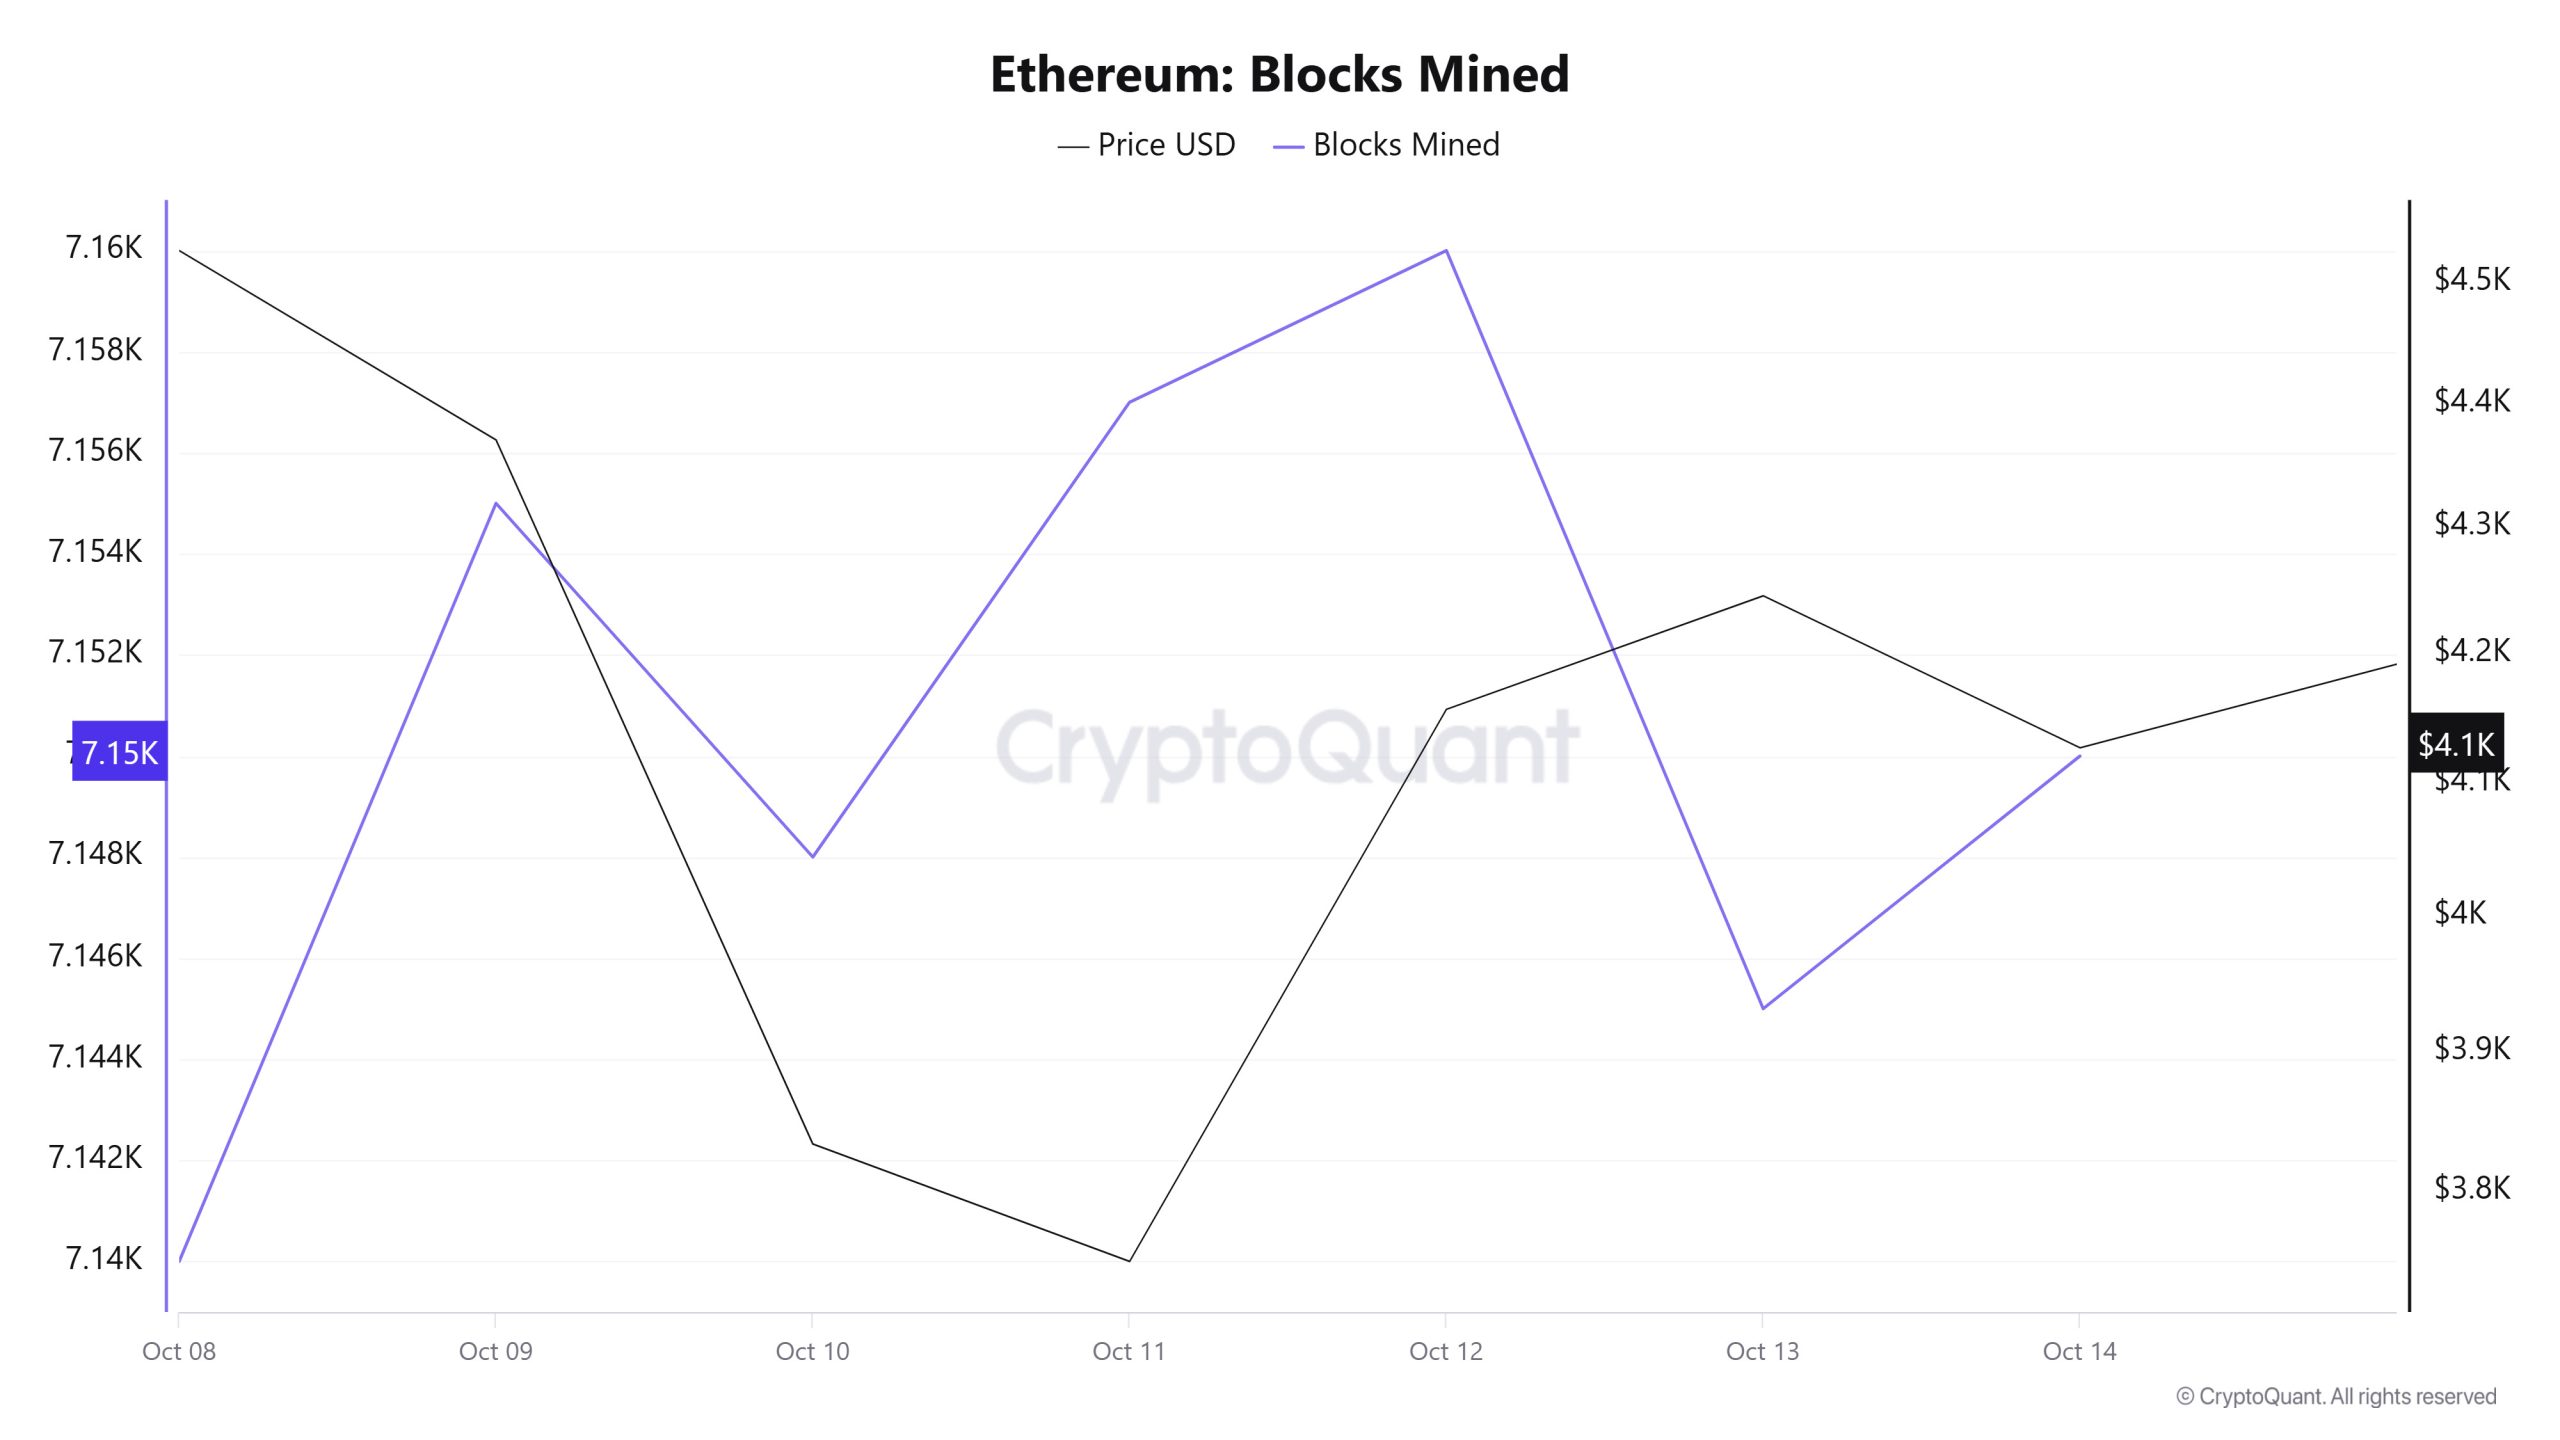
When examining Ethereum block production data between October 8 and 14, an increase was observed throughout the week. While 7,140 blocks were produced on October 8, this number rose to 7,150 by October 14.
A time-dependent correlation structure has been observed between the Ethereum price and the number of blocks produced. However, the general trend reveals that a negative correlation between these two variables is dominant.
Block Size
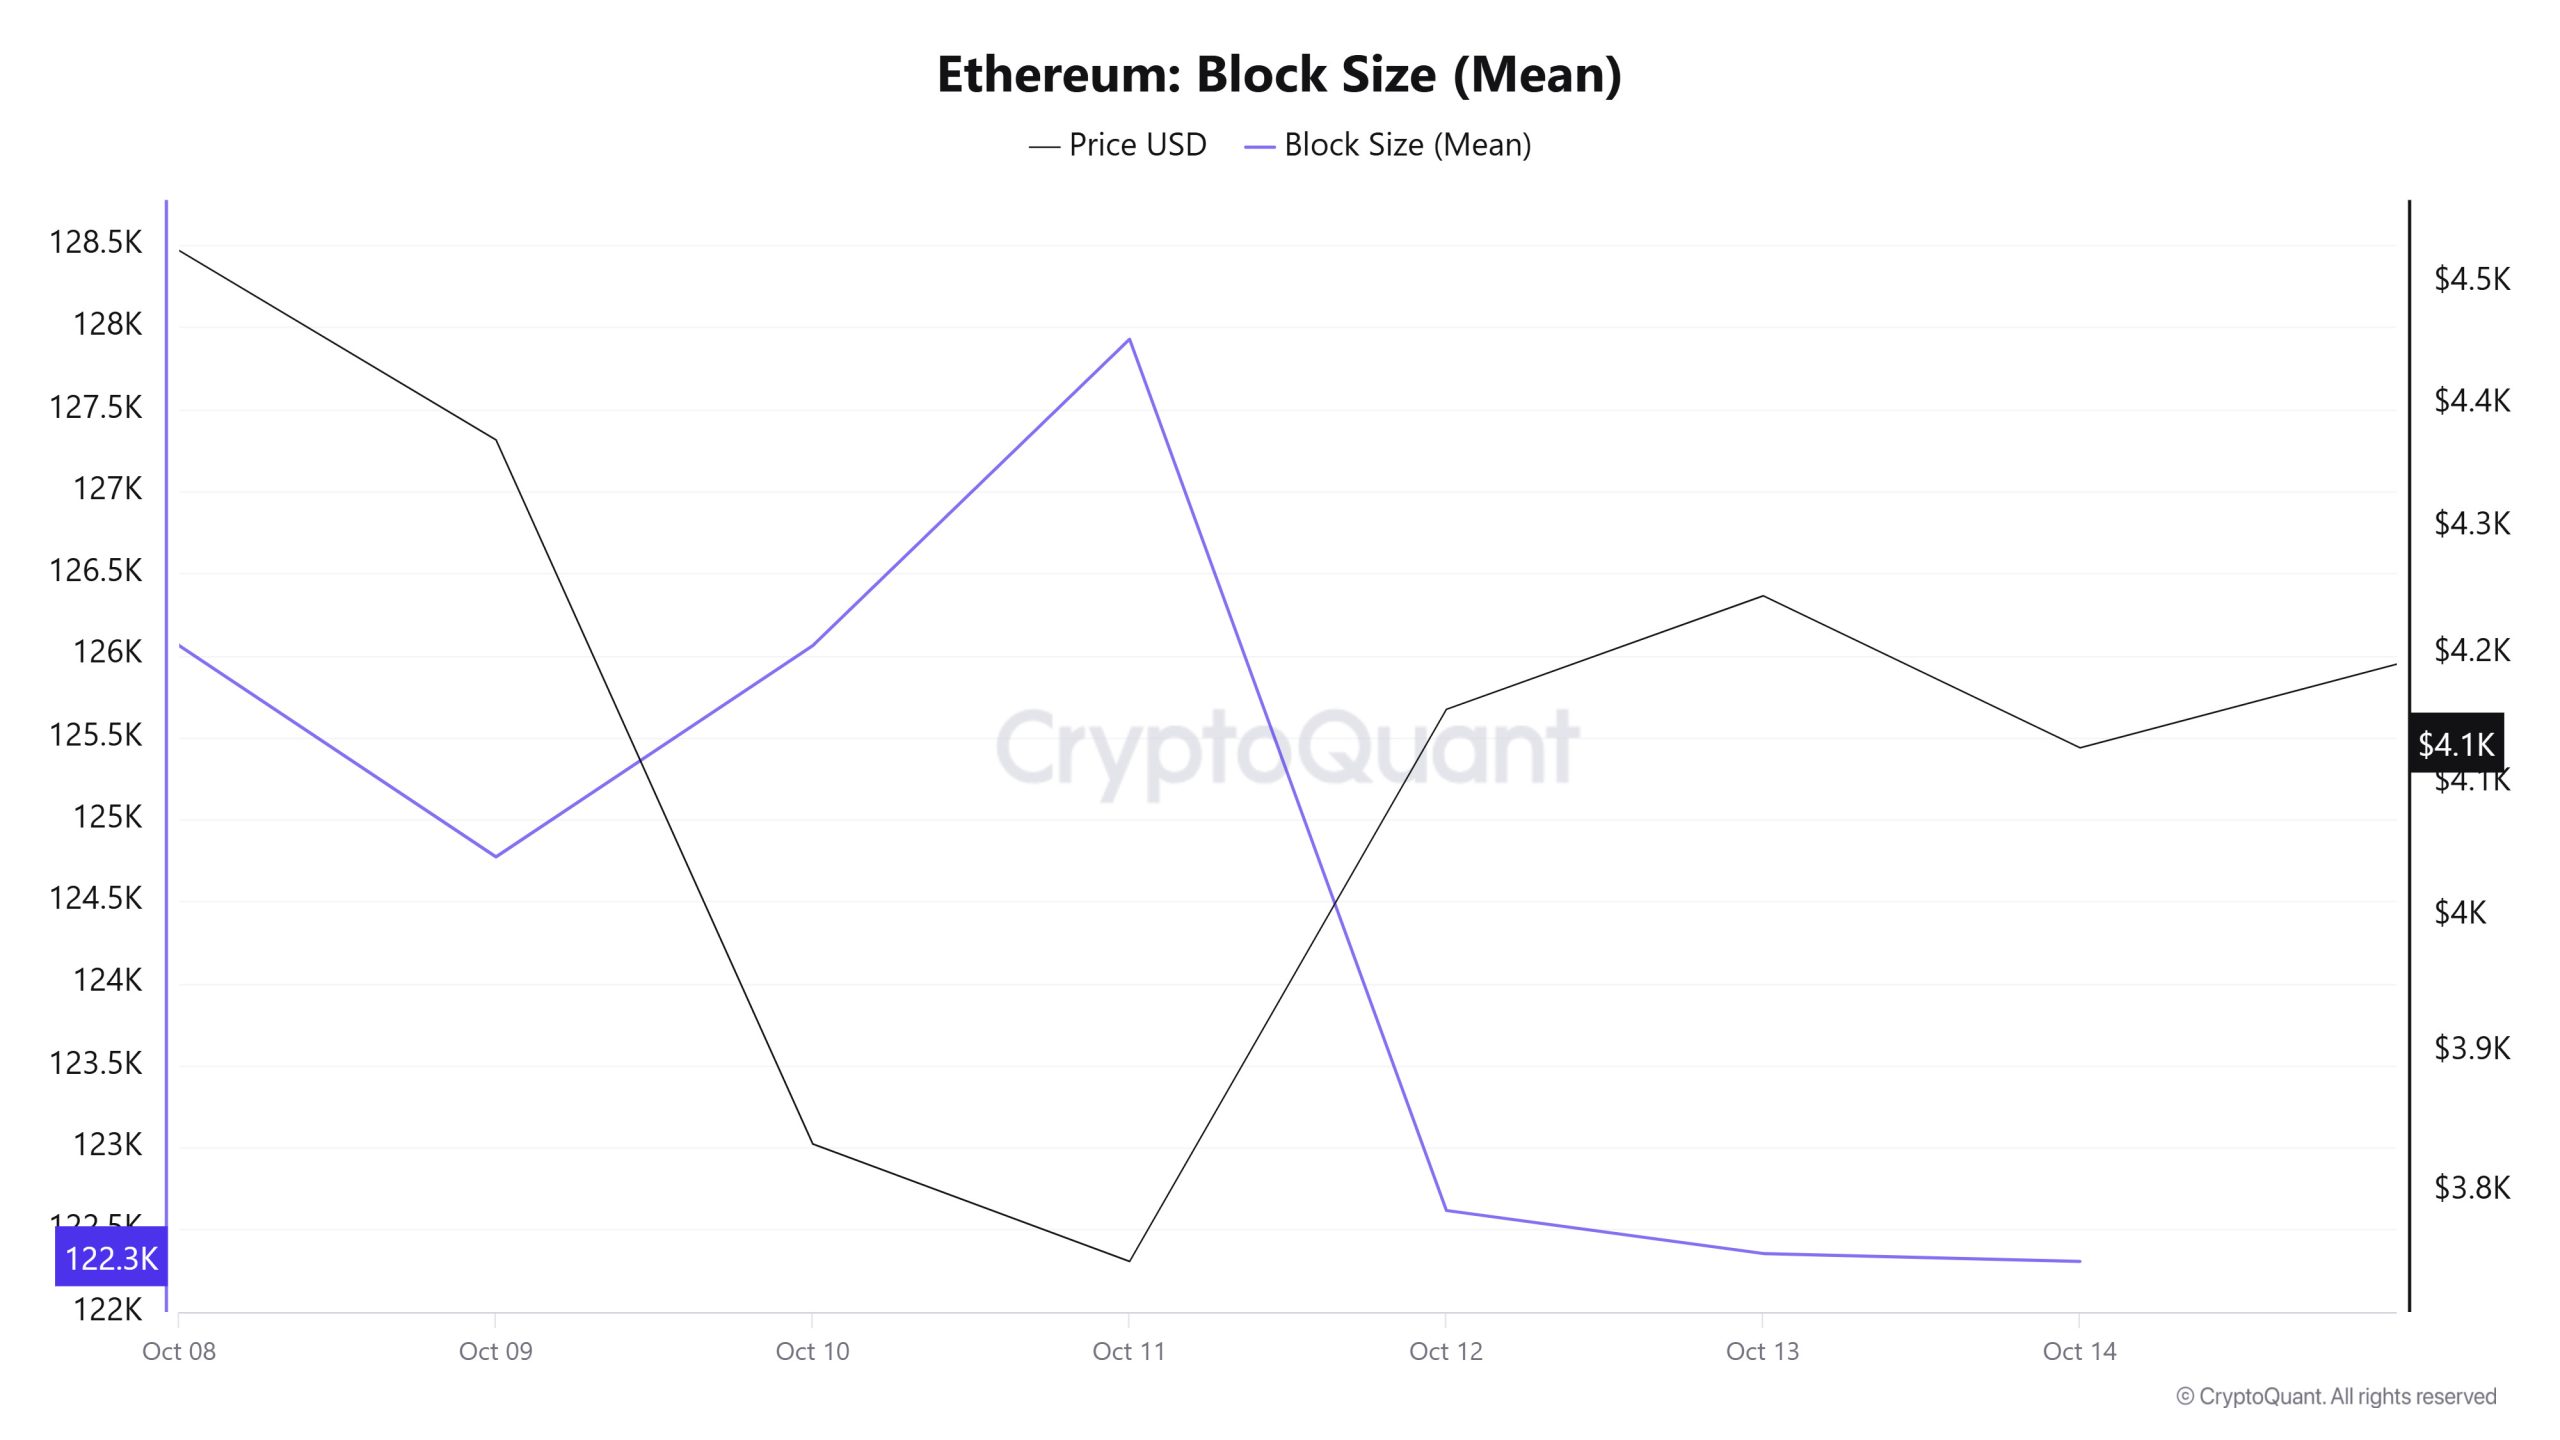
When examining Ethereum block size data between October 8 and 14, a decrease was observed throughout the week. While the average block size was measured at 126,059 bytes on October 8, this value declined to 122,305 bytes by October 14.
During the relevant period, a time-dependent correlation structure was observed between block size and Ethereum price. However, the general trend reveals that a negative correlation between these two variables is dominant.
Block Interval
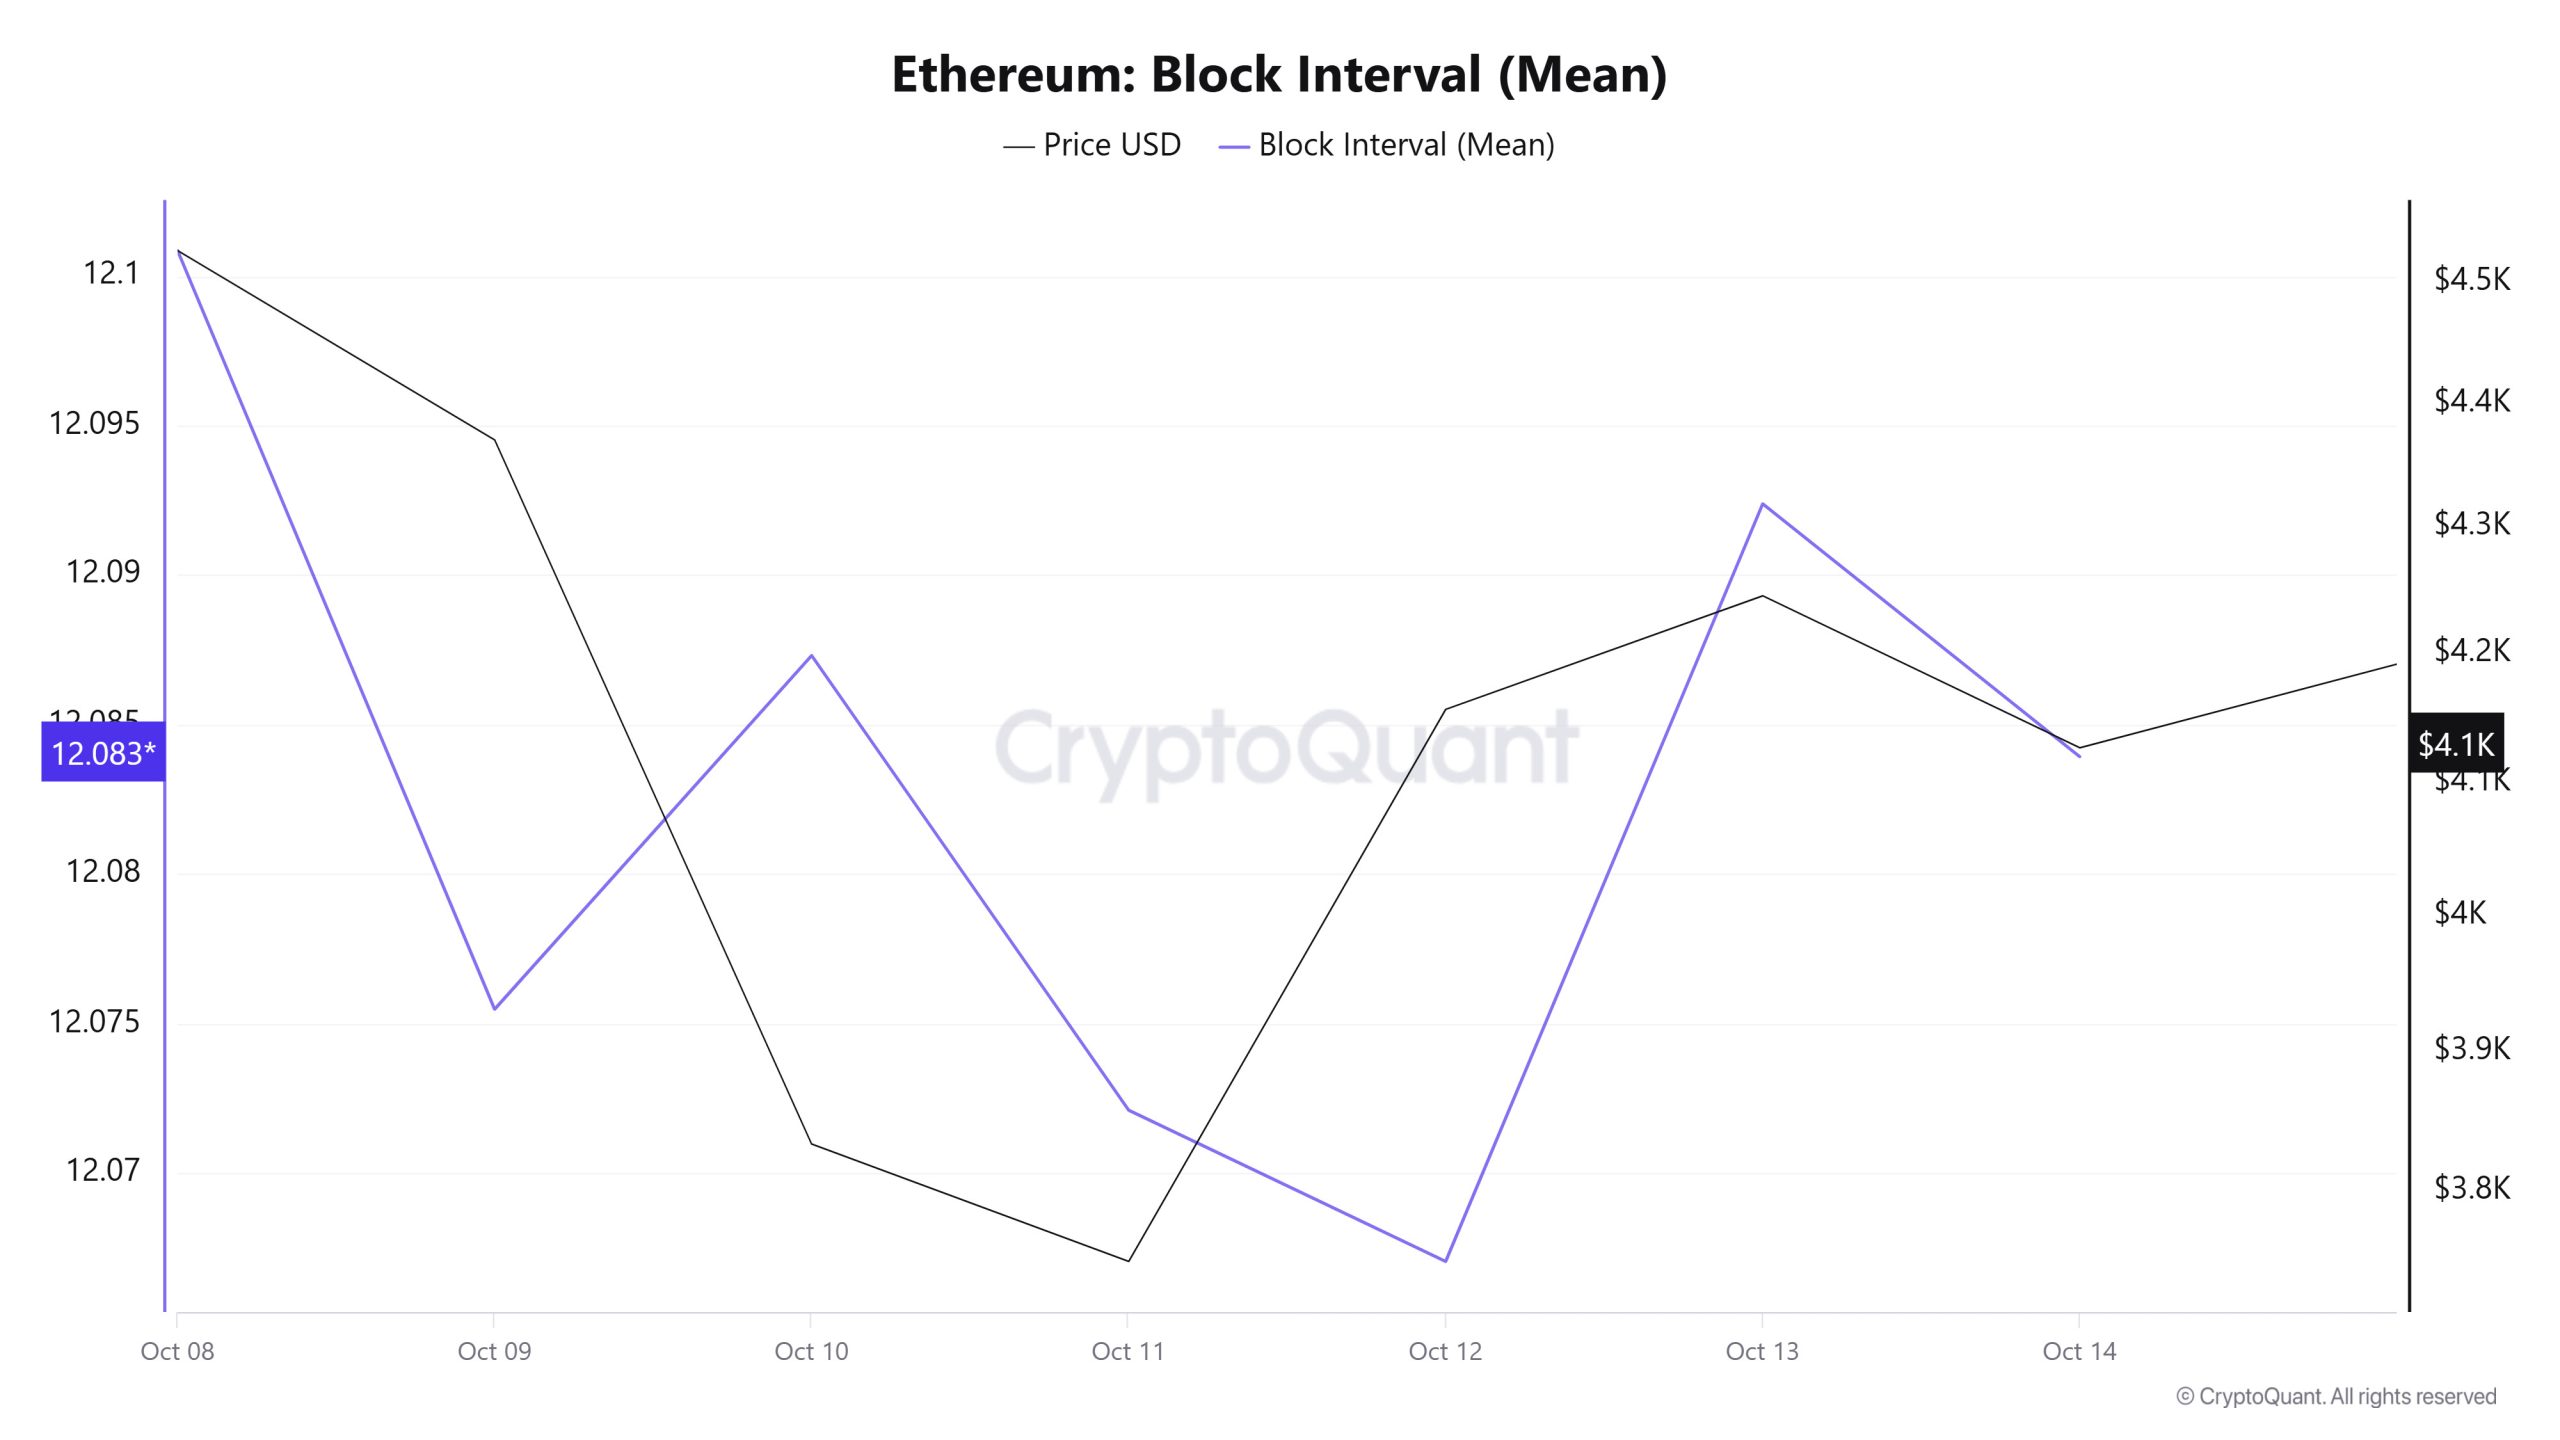
When examining the Ethereum block time between October 8 and 14, a slight decrease occurred throughout the week. While the average block time was recorded as 12.10 seconds on October 8, this time decreased to 12.08 seconds as of October 14.
During the period in question, a time-dependent correlation structure was observed between Ethereum block time and price movement. However, the general trend indicates that a positive correlation between these two variables is dominant.
Transaction
“Ethereum Transaction Count (Total) Image to be Added”
Last week, a total of 11,076,994 transactions were executed on the Ethereum network, while this week the number of transactions increased by approximately 0.35% to 11,116,288. The highest weekly transaction count was recorded on October 11 at 1,647,316, while the lowest was on October 12 at 1,480,041. The correlation between the number of transactions and the price showed a mixed picture with positive and negative fluctuations between days. Therefore, it seems difficult to clearly determine whether transfers are predominantly buying or selling based on the current data. On the other hand, although the stability in network activity is relatively high compared to previous periods, the fact that it has started to stabilize does not indicate a negative picture in terms of the overall outlook.
Tokens Transferred
The total amount of ETH transferred between last week and this week increased by approximately 32.76%, rising from 13,537,133 to 17,971,911. The highest weekly transfer was recorded on October 8 at 3,660,916 ETH, while the lowest transfer was recorded on October 12 at 1,434,614 ETH. Daily fluctuations exceeding 100% in transferred amounts serve as a reminder of the market’s continued extreme volatility between days. During this period, the negative correlation between price and token transfer volume may be interpreted as an indicator that transfers were predominantly driven by selling pressure.
The partial increase in network activity and the significant rise in the amount of Ethereum transferred make it difficult to draw clear conclusions based solely on numerical values. However, when compared to previous periods, the fact that network activity remains at a very high level indicates that stability between periods during this time has been maintained and that network health has not deteriorated.
Estimated Leverage Ratio
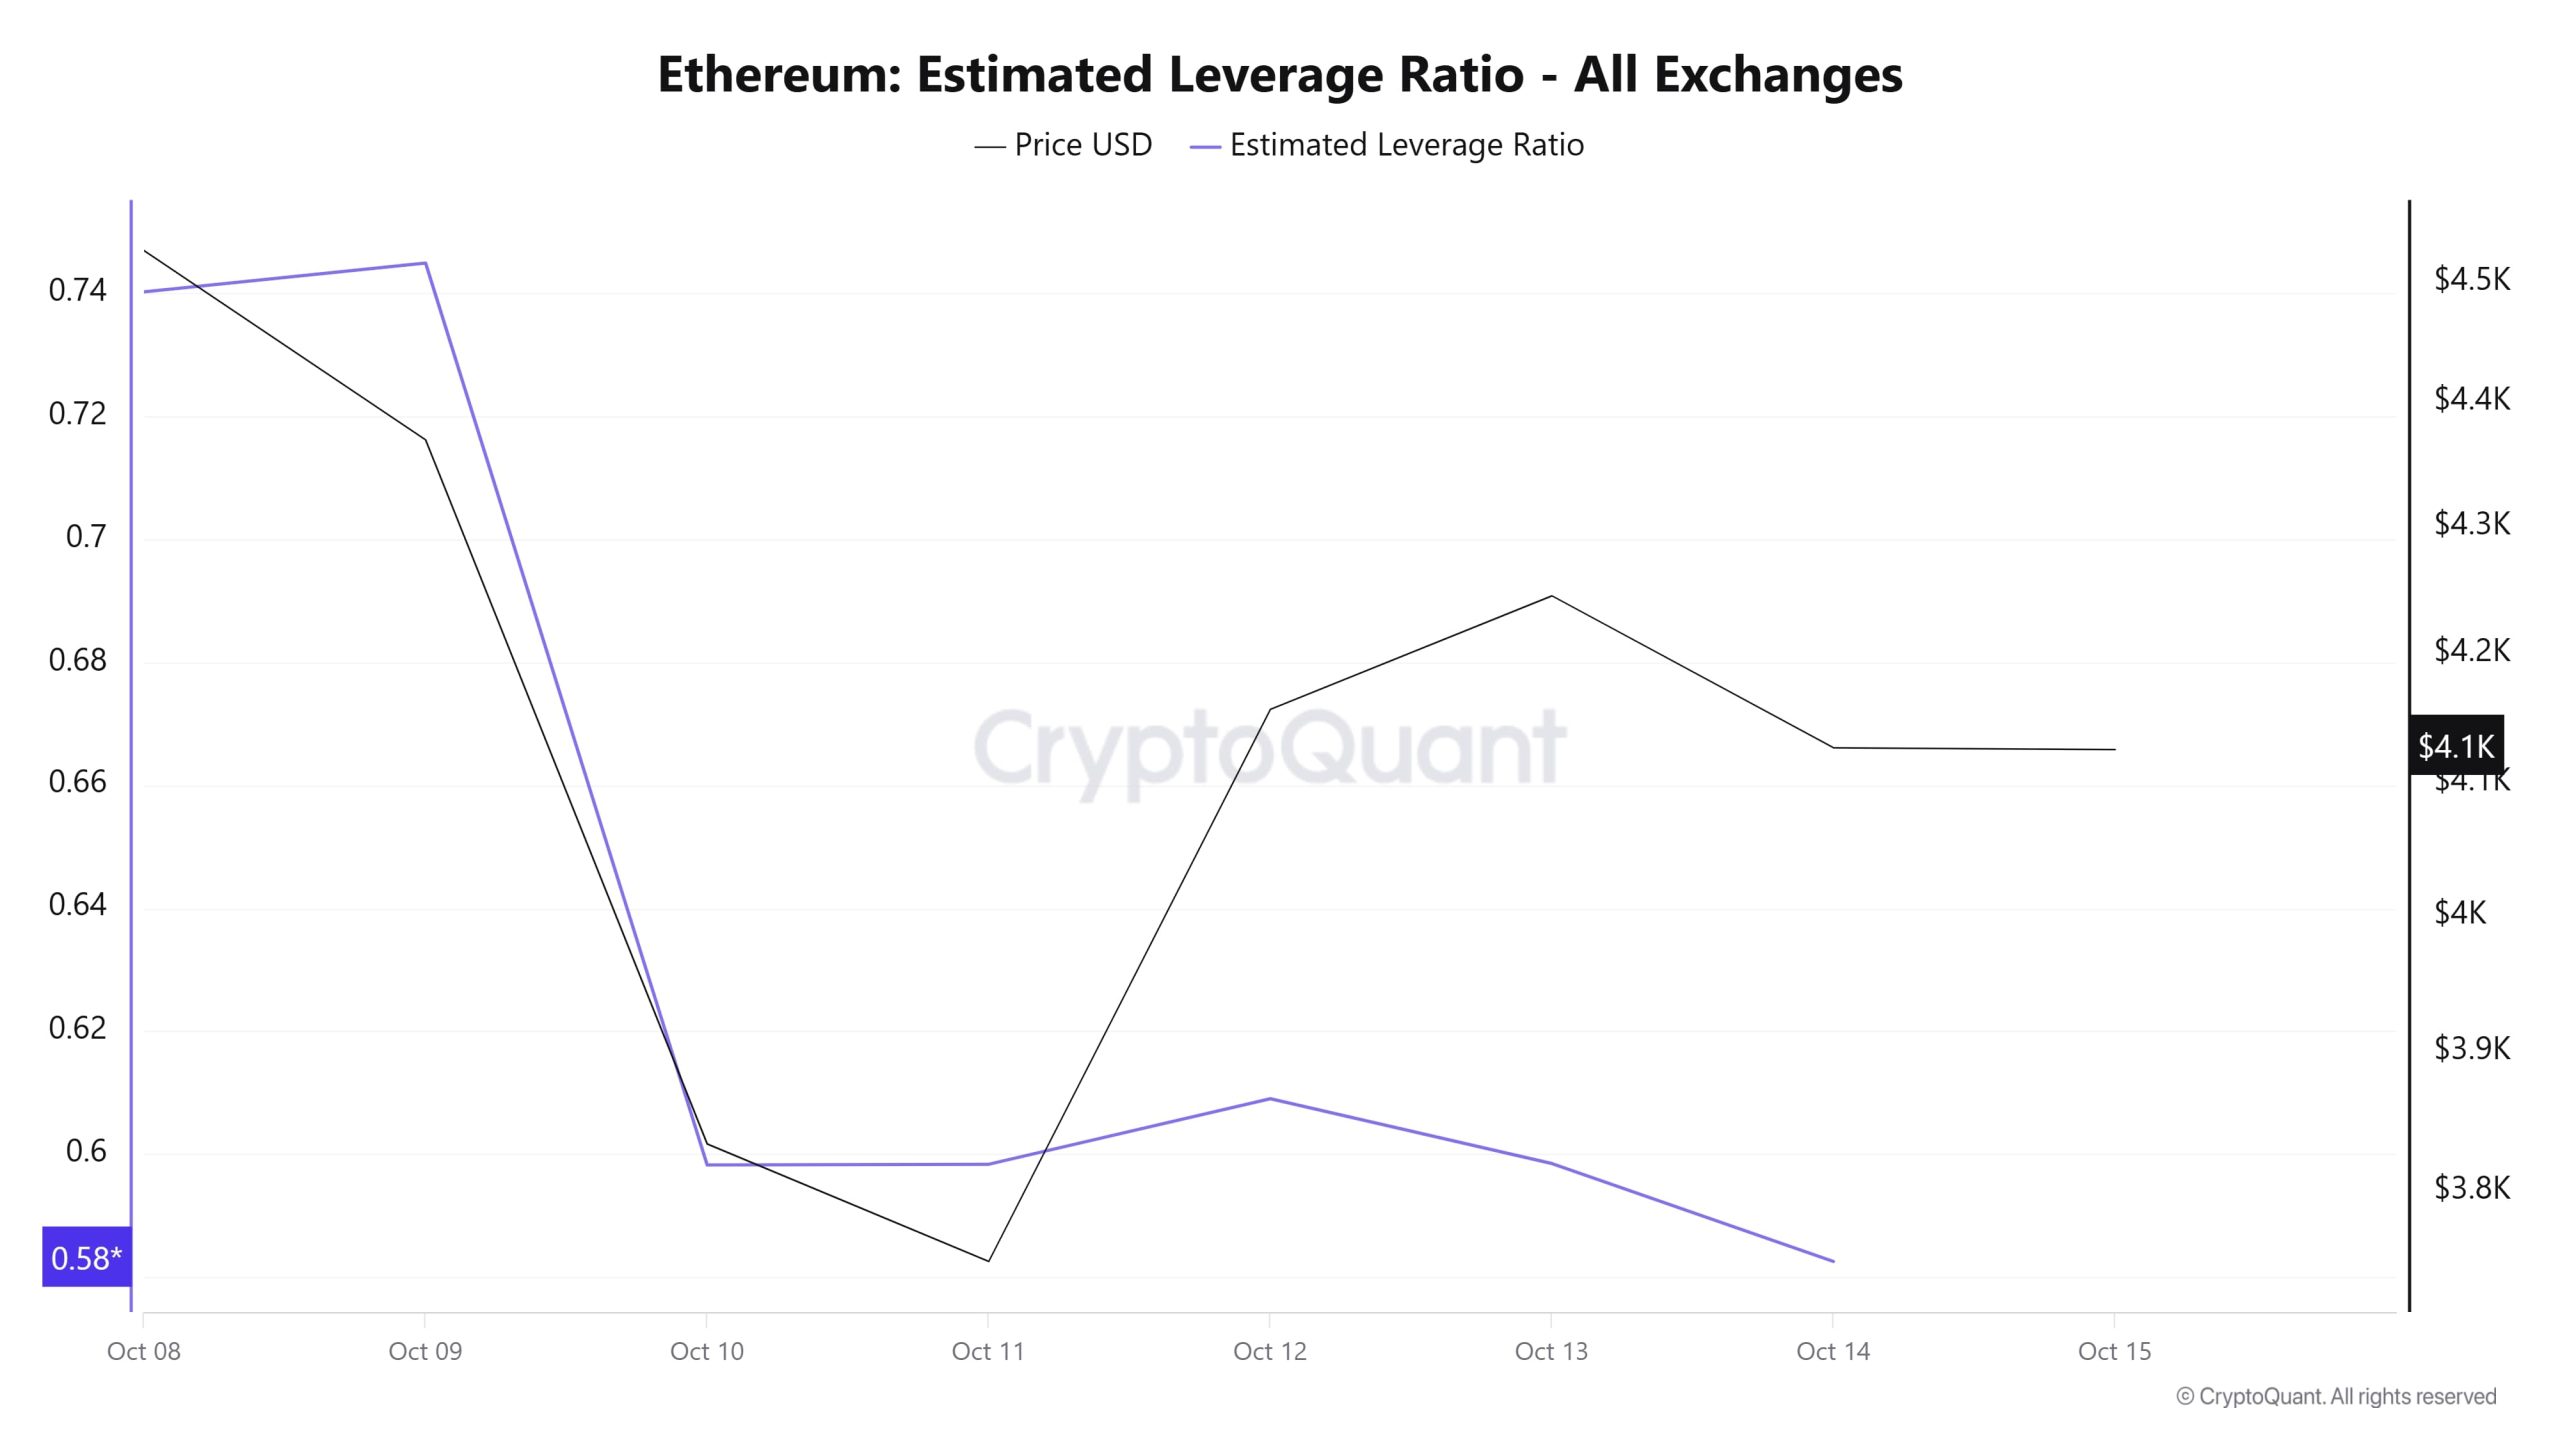
Over the 7-day period, the metric showed a narrow decline from start to finish. Starting at 0.740 at the beginning of the process, the ELR (Estimated Leverage Ratio) rose to 0.744 on October 9, reaching the peak of the process. At the time of writing, it has fallen to 0.582, forming the lowest point of the process. A higher ELR means that participants are willing to take on more risk and usually indicates bullish conditions or expectations. It should be noted that these increases may also be due to a decrease in reserves. Looking at Ethereum reserves, there were 15.98 million reserves at the beginning of the process, but this figure declined slightly during the rest of the process and currently stands at 15.82 million. At the same time, Ethereum’s Open Interest was $60.36 billion at the beginning of the process. As of now, volume has declined during the process, and the open interest value stands out at $46.81 billion. With all this data, the ELR metric experienced a slight increase in the early stages of the process but steadily lost value during the remainder of the period. The asset’s price fluctuated between $4,530 and $3,400 with all this data. As of now, investors’ and traders’ risk appetite has decreased significantly. The decrease in open interest volume seen throughout the process, accompanied by a decrease in reserves, indicates that the decline in the ELR ratio reflects a significant decrease in risk appetite among investors. As a result, the withdrawal of reserves and the decline in open interest have caused a decline in the ELR metric. This
ETH Onchain Overall
| Metric | Positive 📈 | Negative 📉 | Neutral ➖ |
|---|---|---|---|
| Active Addresses | ✓ | ||
| Total Value Staked | ✓ | ||
| Derivatives | ✓ | ||
| Supply Distribution | ✓ | ||
| Exchange Supply Ratio | ✓ | ||
| Exchange Reserve | ✓ | ||
| Fees and Revenues | ✓ | ||
| Blocks Mined | ✓ | ||
| Transaction | ✓ | ||
| Estimated Leverage Ratio | ✓ |
*The metrics and guidance provided in the table do not alone explain or imply any expectation regarding future price changes in any asset. Digital asset prices can fluctuate based on numerous variables. The on-chain analysis and related guidance are intended to assist investors in their decision-making process, and basing financial investments solely on the results of this analysis may lead to unfavorable outcomes. Even if all metrics produce positive, negative, or neutral results simultaneously, the expected outcomes may not materialize depending on market conditions. It would be beneficial for investors reviewing the report to take these warnings into consideration.
Legal Notice
The investment information, comments, and recommendations contained in this document do not constitute investment advisory services. Investment advisory services are provided by authorized institutions on a personal basis, taking into account the risk and return preferences of individuals. The comments and recommendations contained in this document are of a general nature. These recommendations may not be suitable for your financial situation and risk and return preferences. Therefore, making an investment decision based solely on the information contained in this document may not result in outcomes that align with your expectations.
NOTE: All data used in Ethereum on-chain analysis is based on CryptoQuant.