Active Addresses
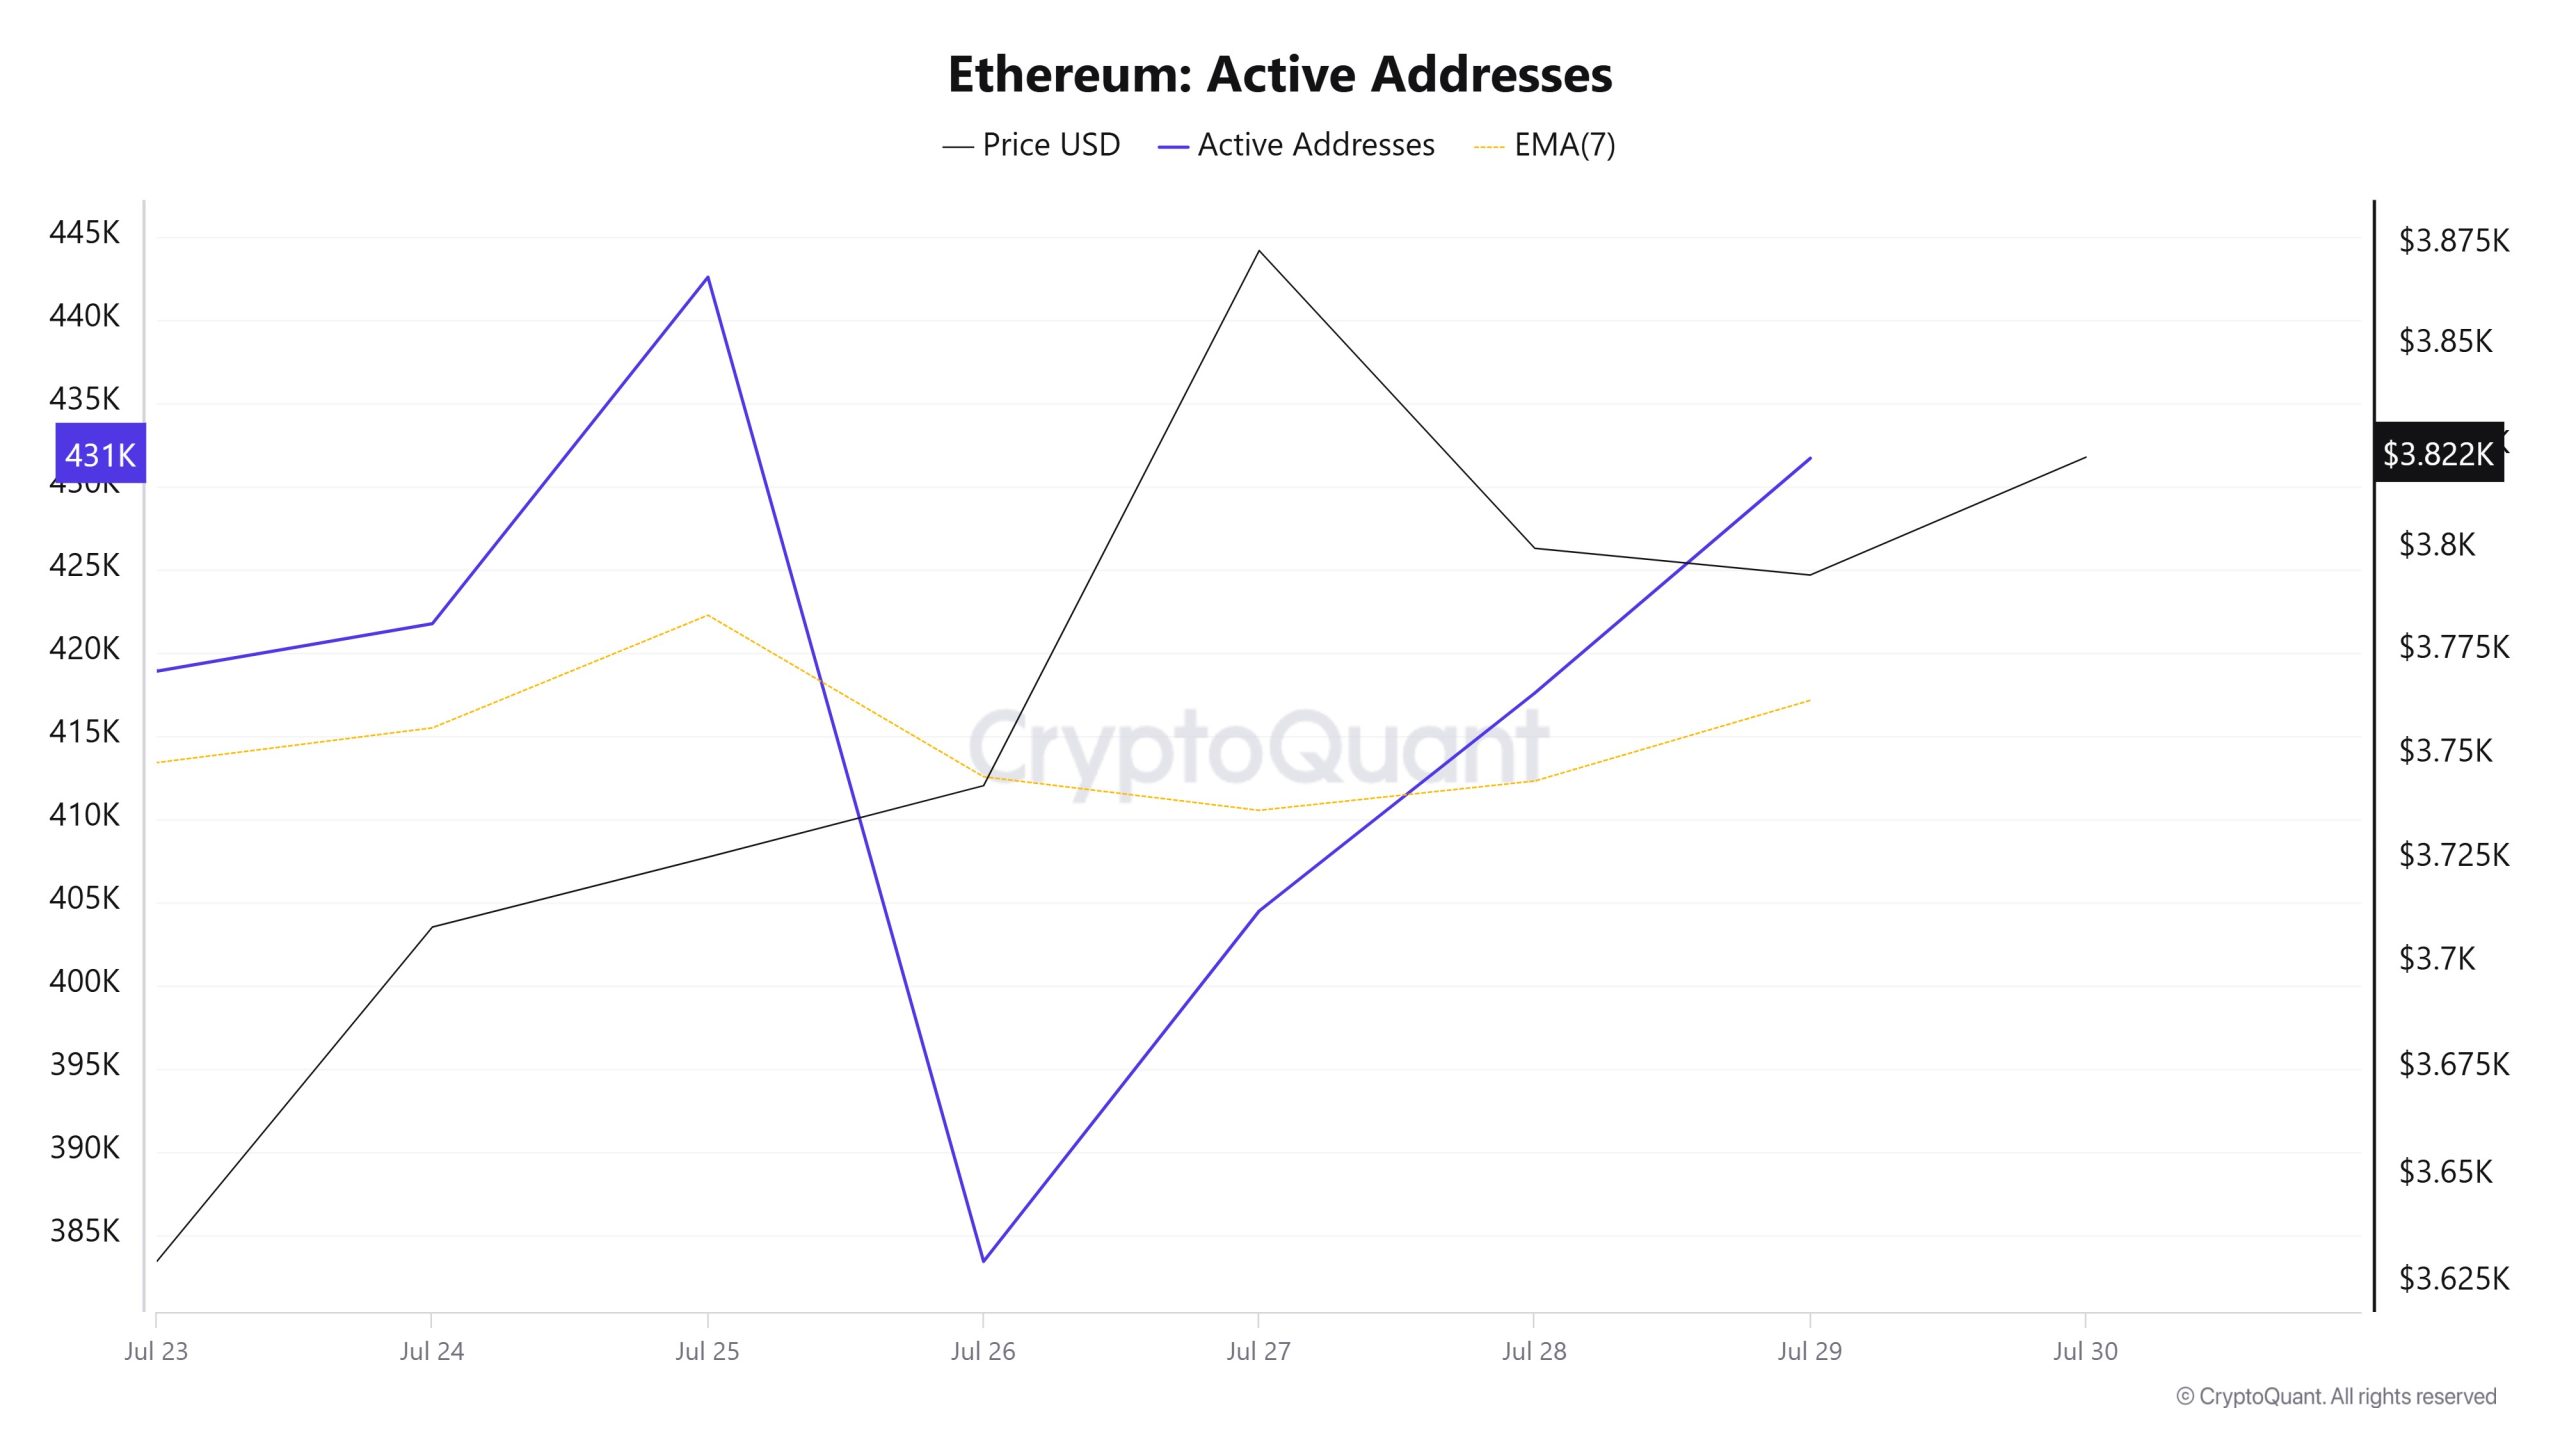
Between July 23-30, a total of 404,443 active addresses entered the Ethereum network. During this period, the Ethereum price rose from $3,629 to $3,873. Especially on July 26, at the intersection of the price and the number of active addresses, there was a significant drop in the number of active addresses while the price continued to rise. This suggests that despite the price increase, short-term participation has decreased and is likely to be dominated by trades among existing investors. When the 7-day simple moving average (SMA) is analyzed, it is seen that a general upward trend is dominant in the Ethereum price.
Active Sending Addresses
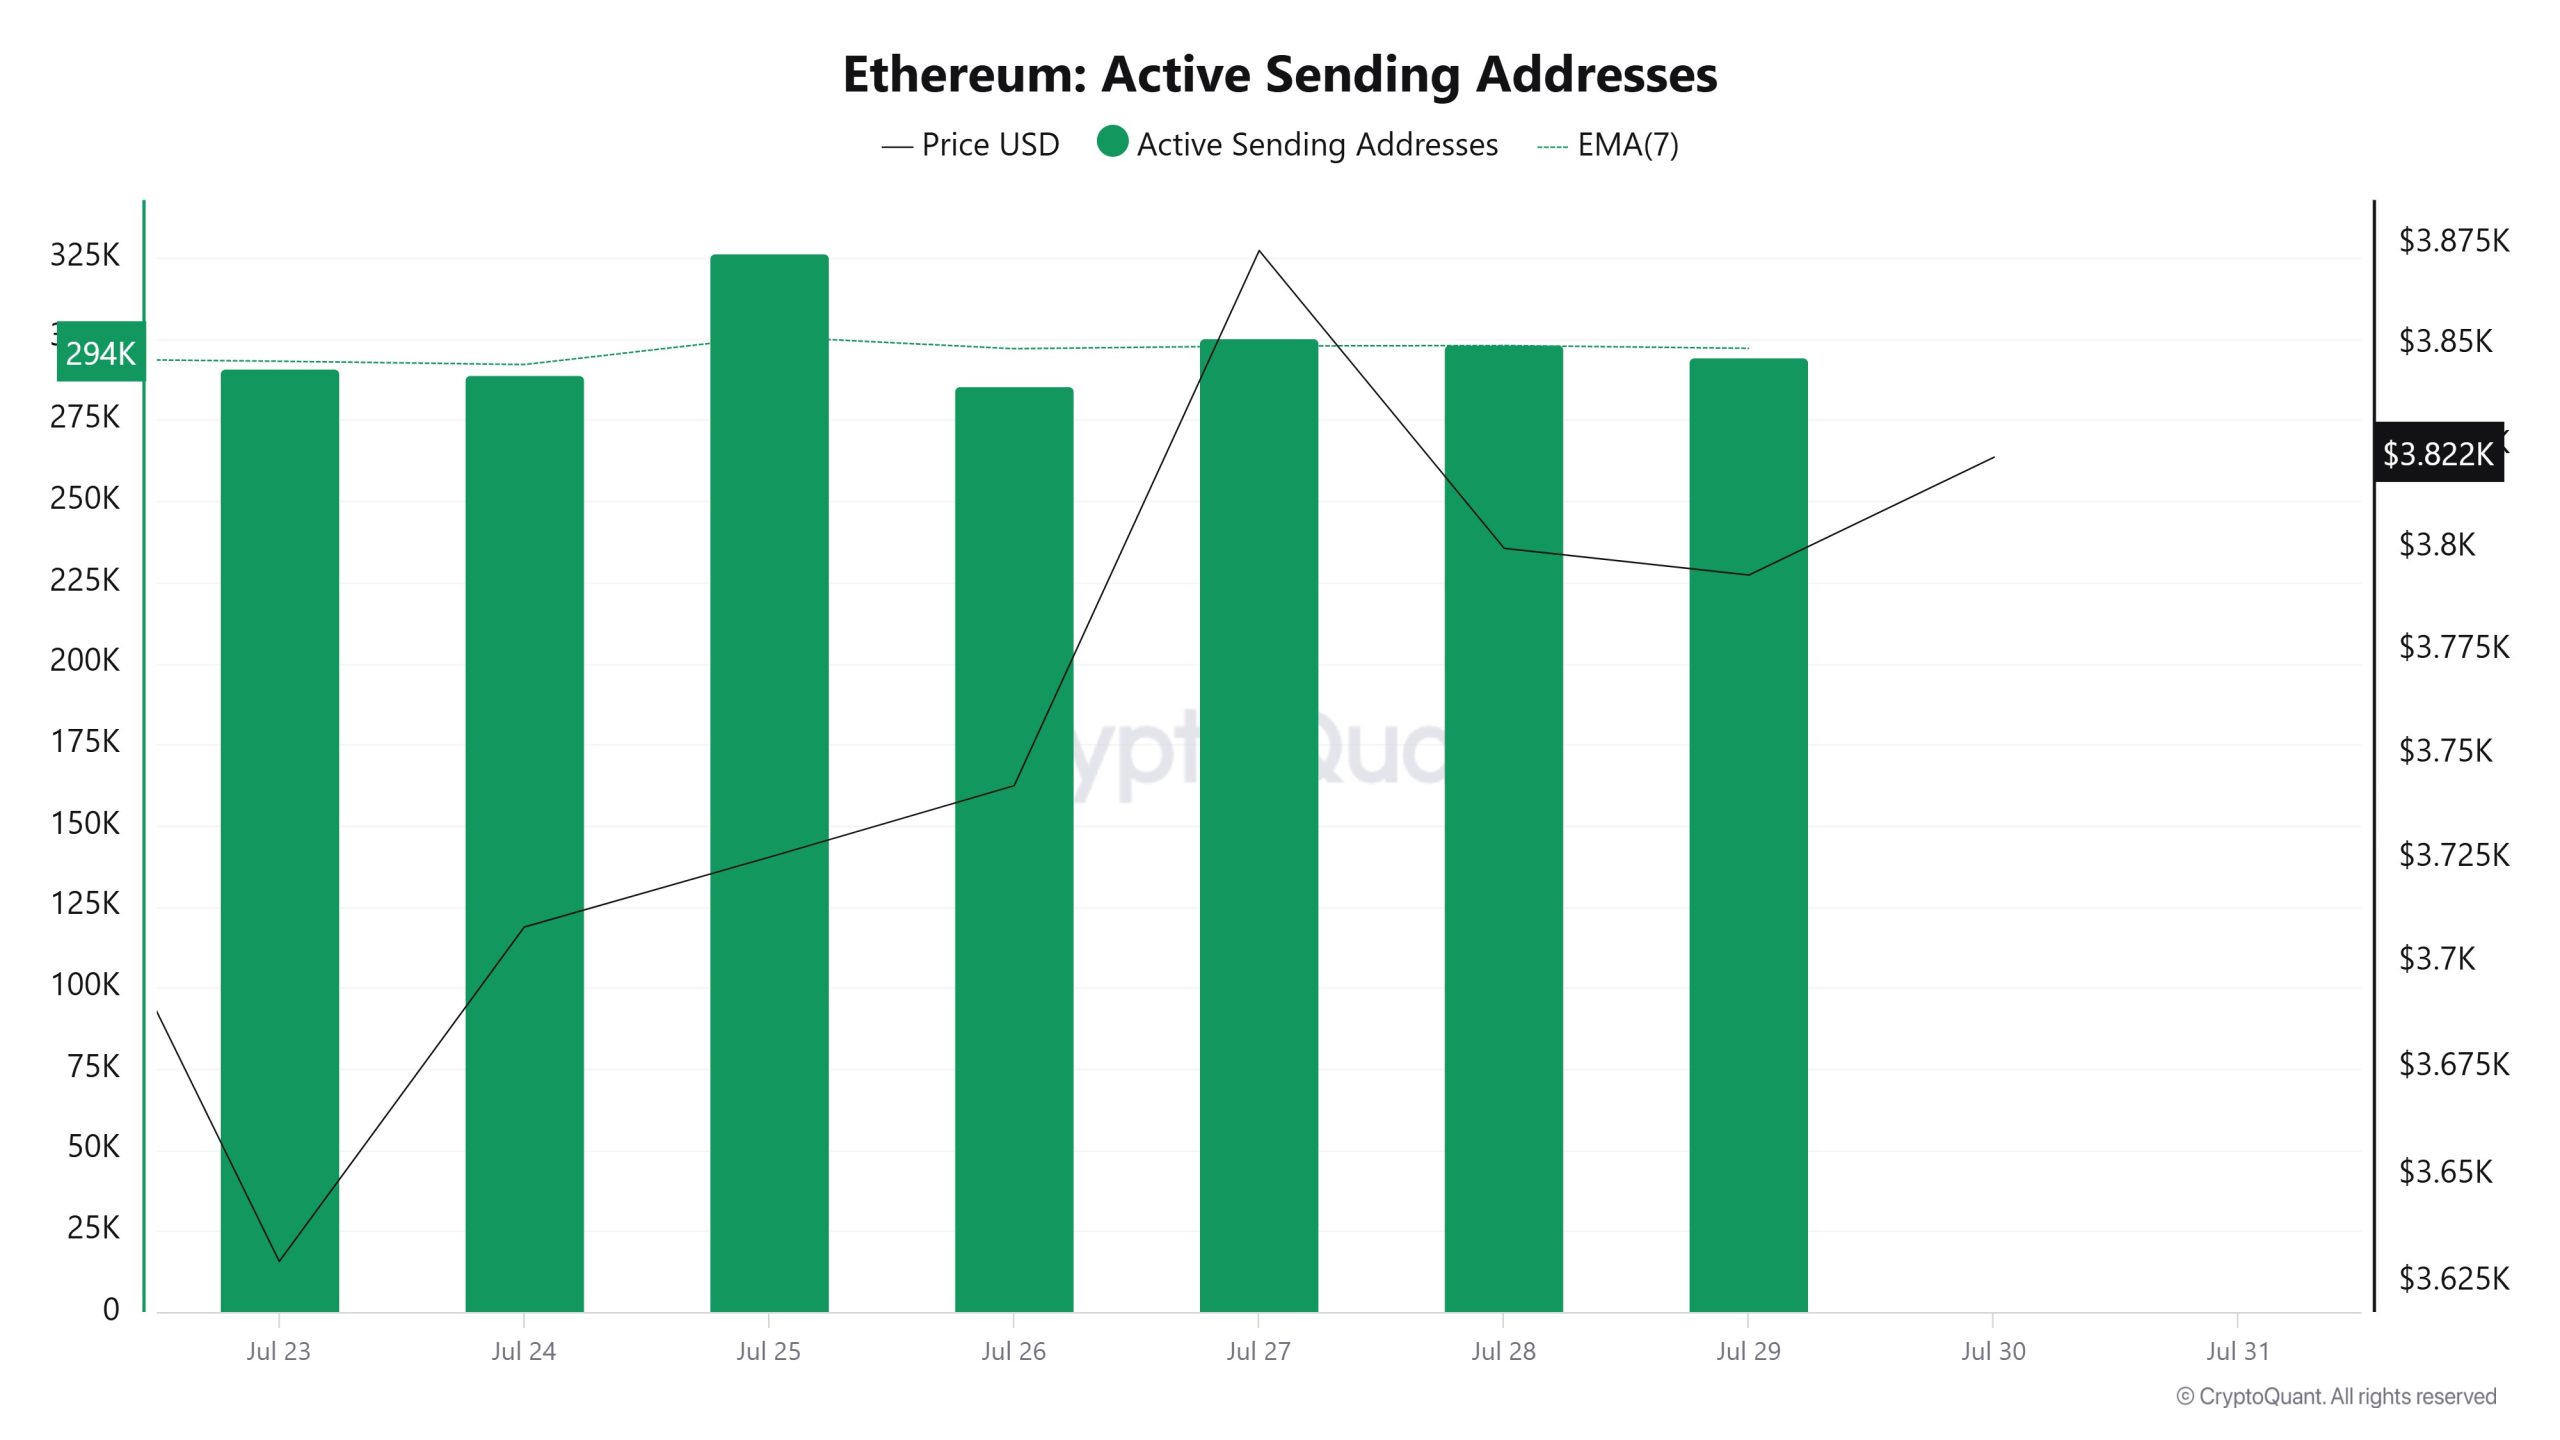
Between July 23rd and July 30th, there was an upward movement in active shipping addresses with the Black Line (price line). On the same day that the price reached a weekly high, active sending addresses increased to 300,318.
Active Receiving Addresses
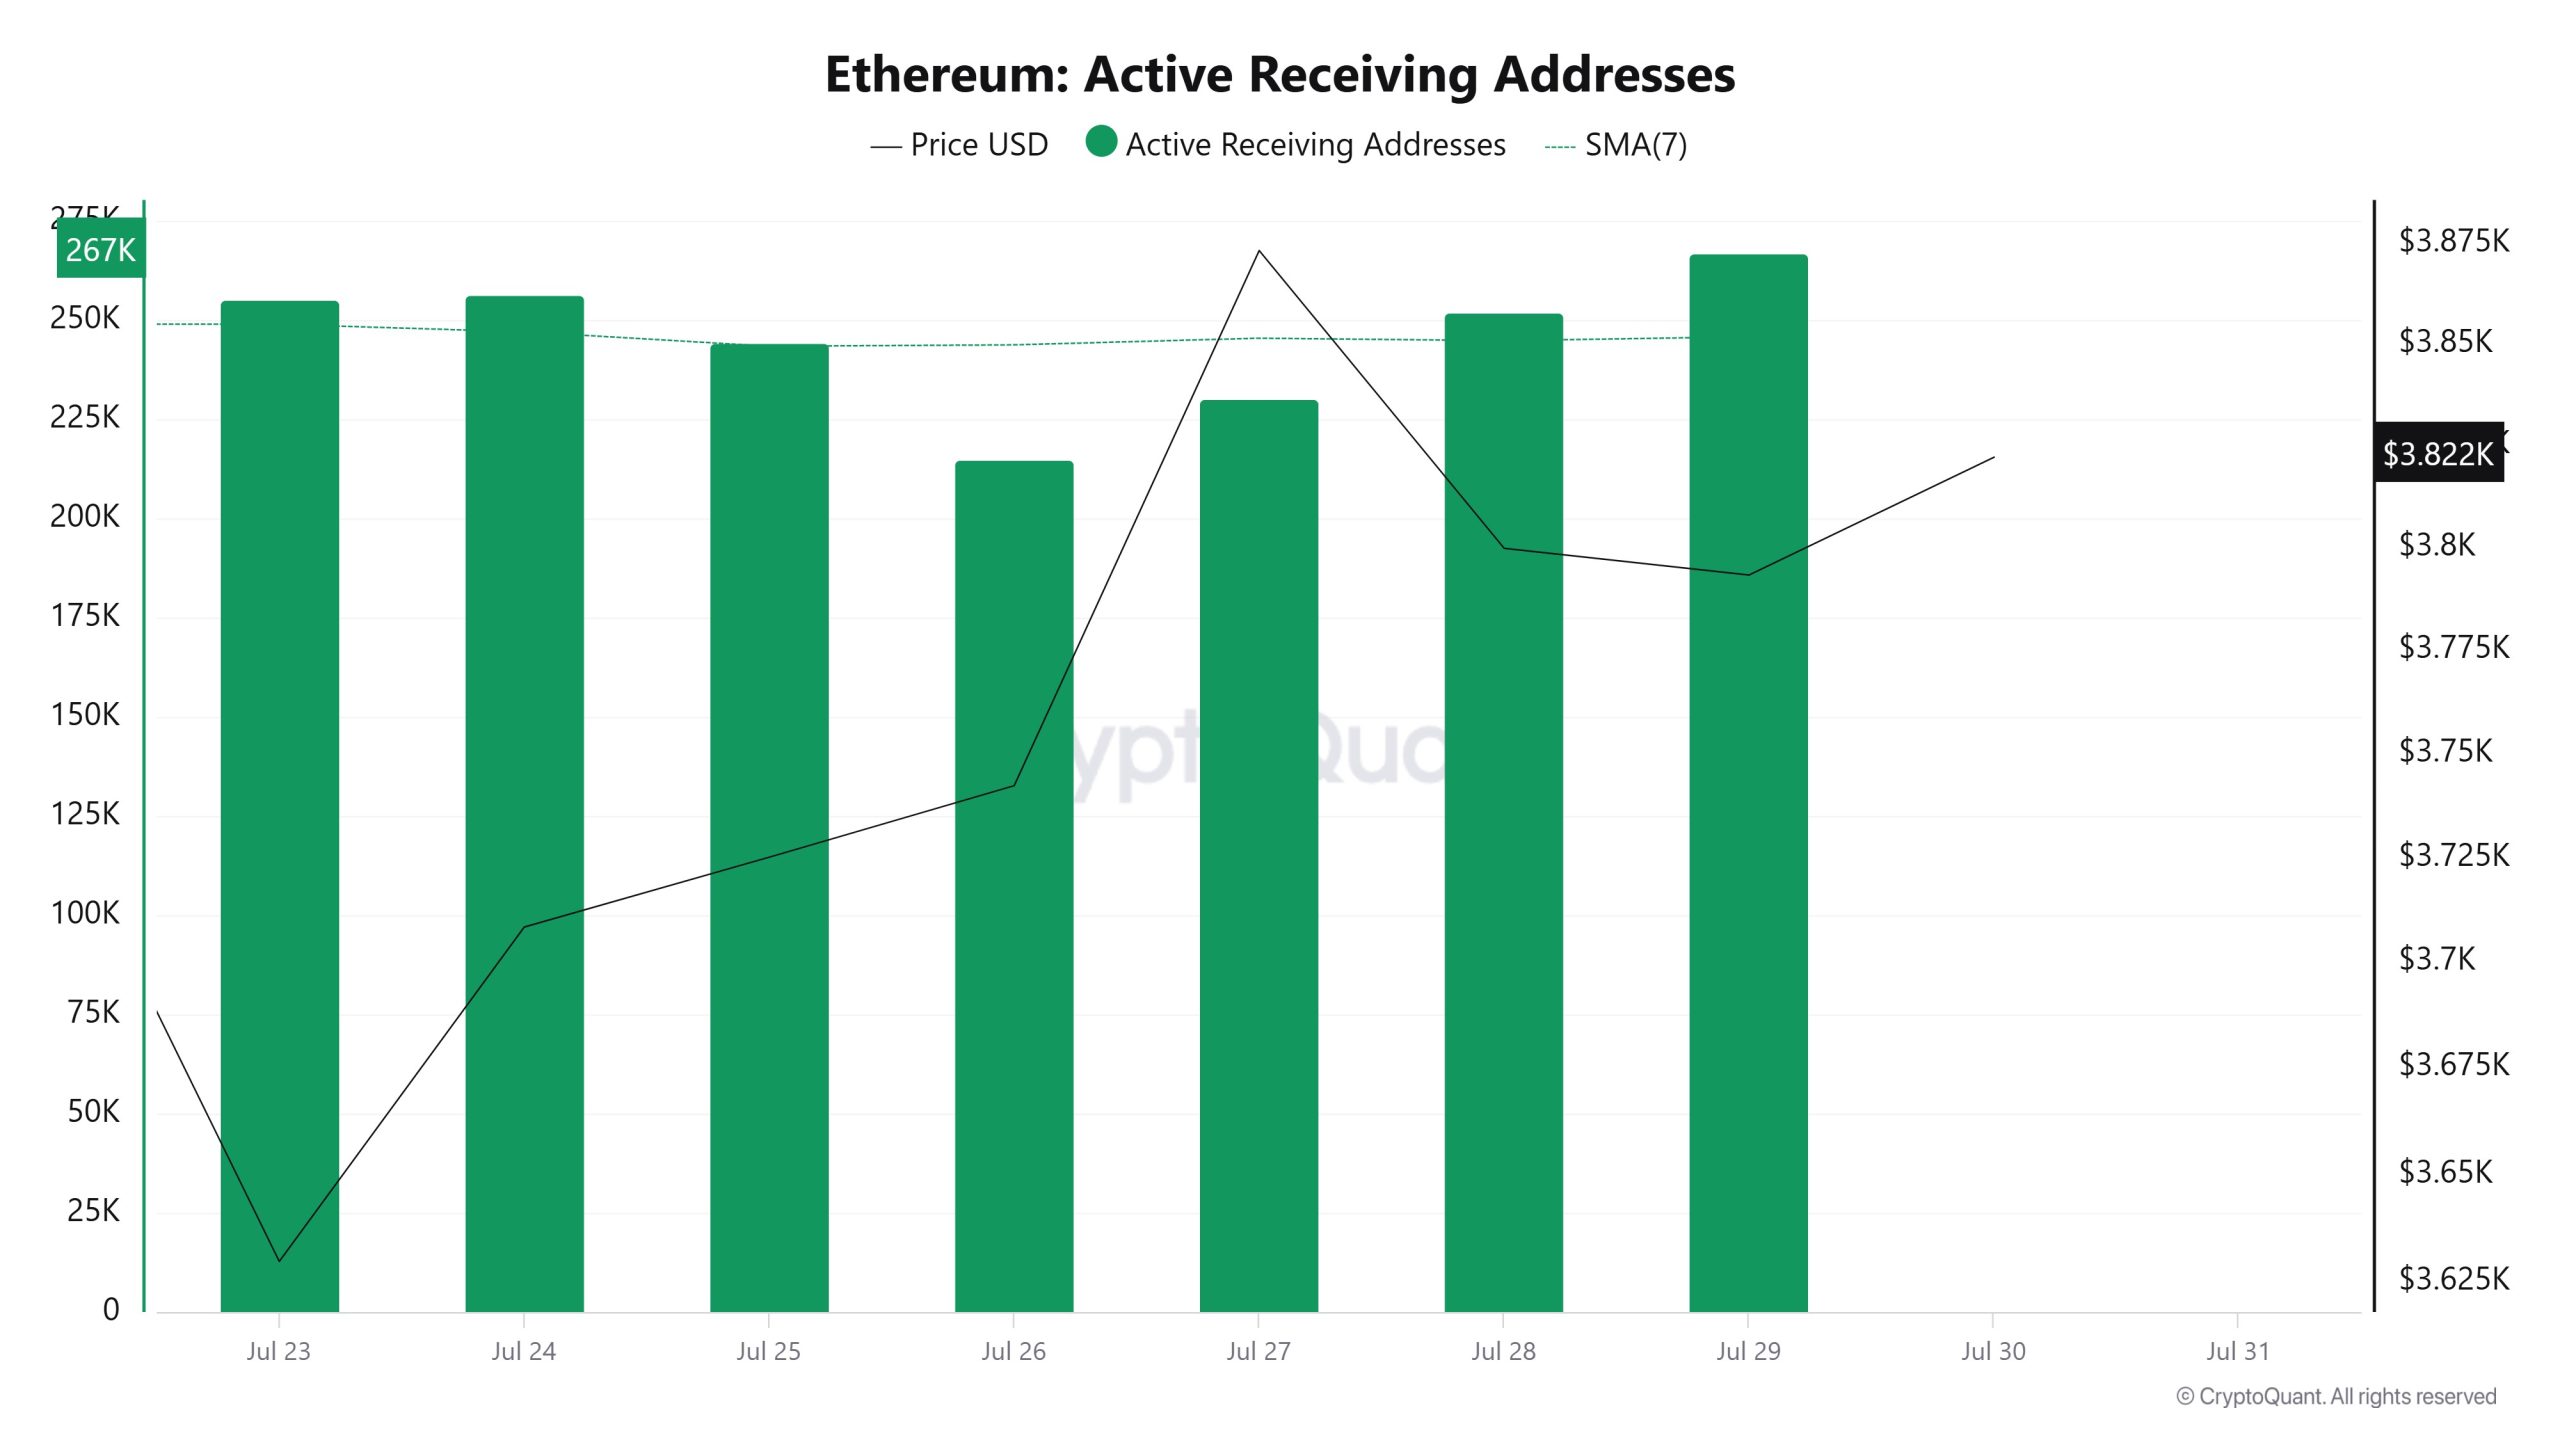
Between July 23rd and July 30th, there was an upward consolidation in active buying addresses and a parallel upward consolidation in the price. On the day of the price high, active receiving addresses dropped to 230,437, indicating that buying is slowing down.
Total Value Staked
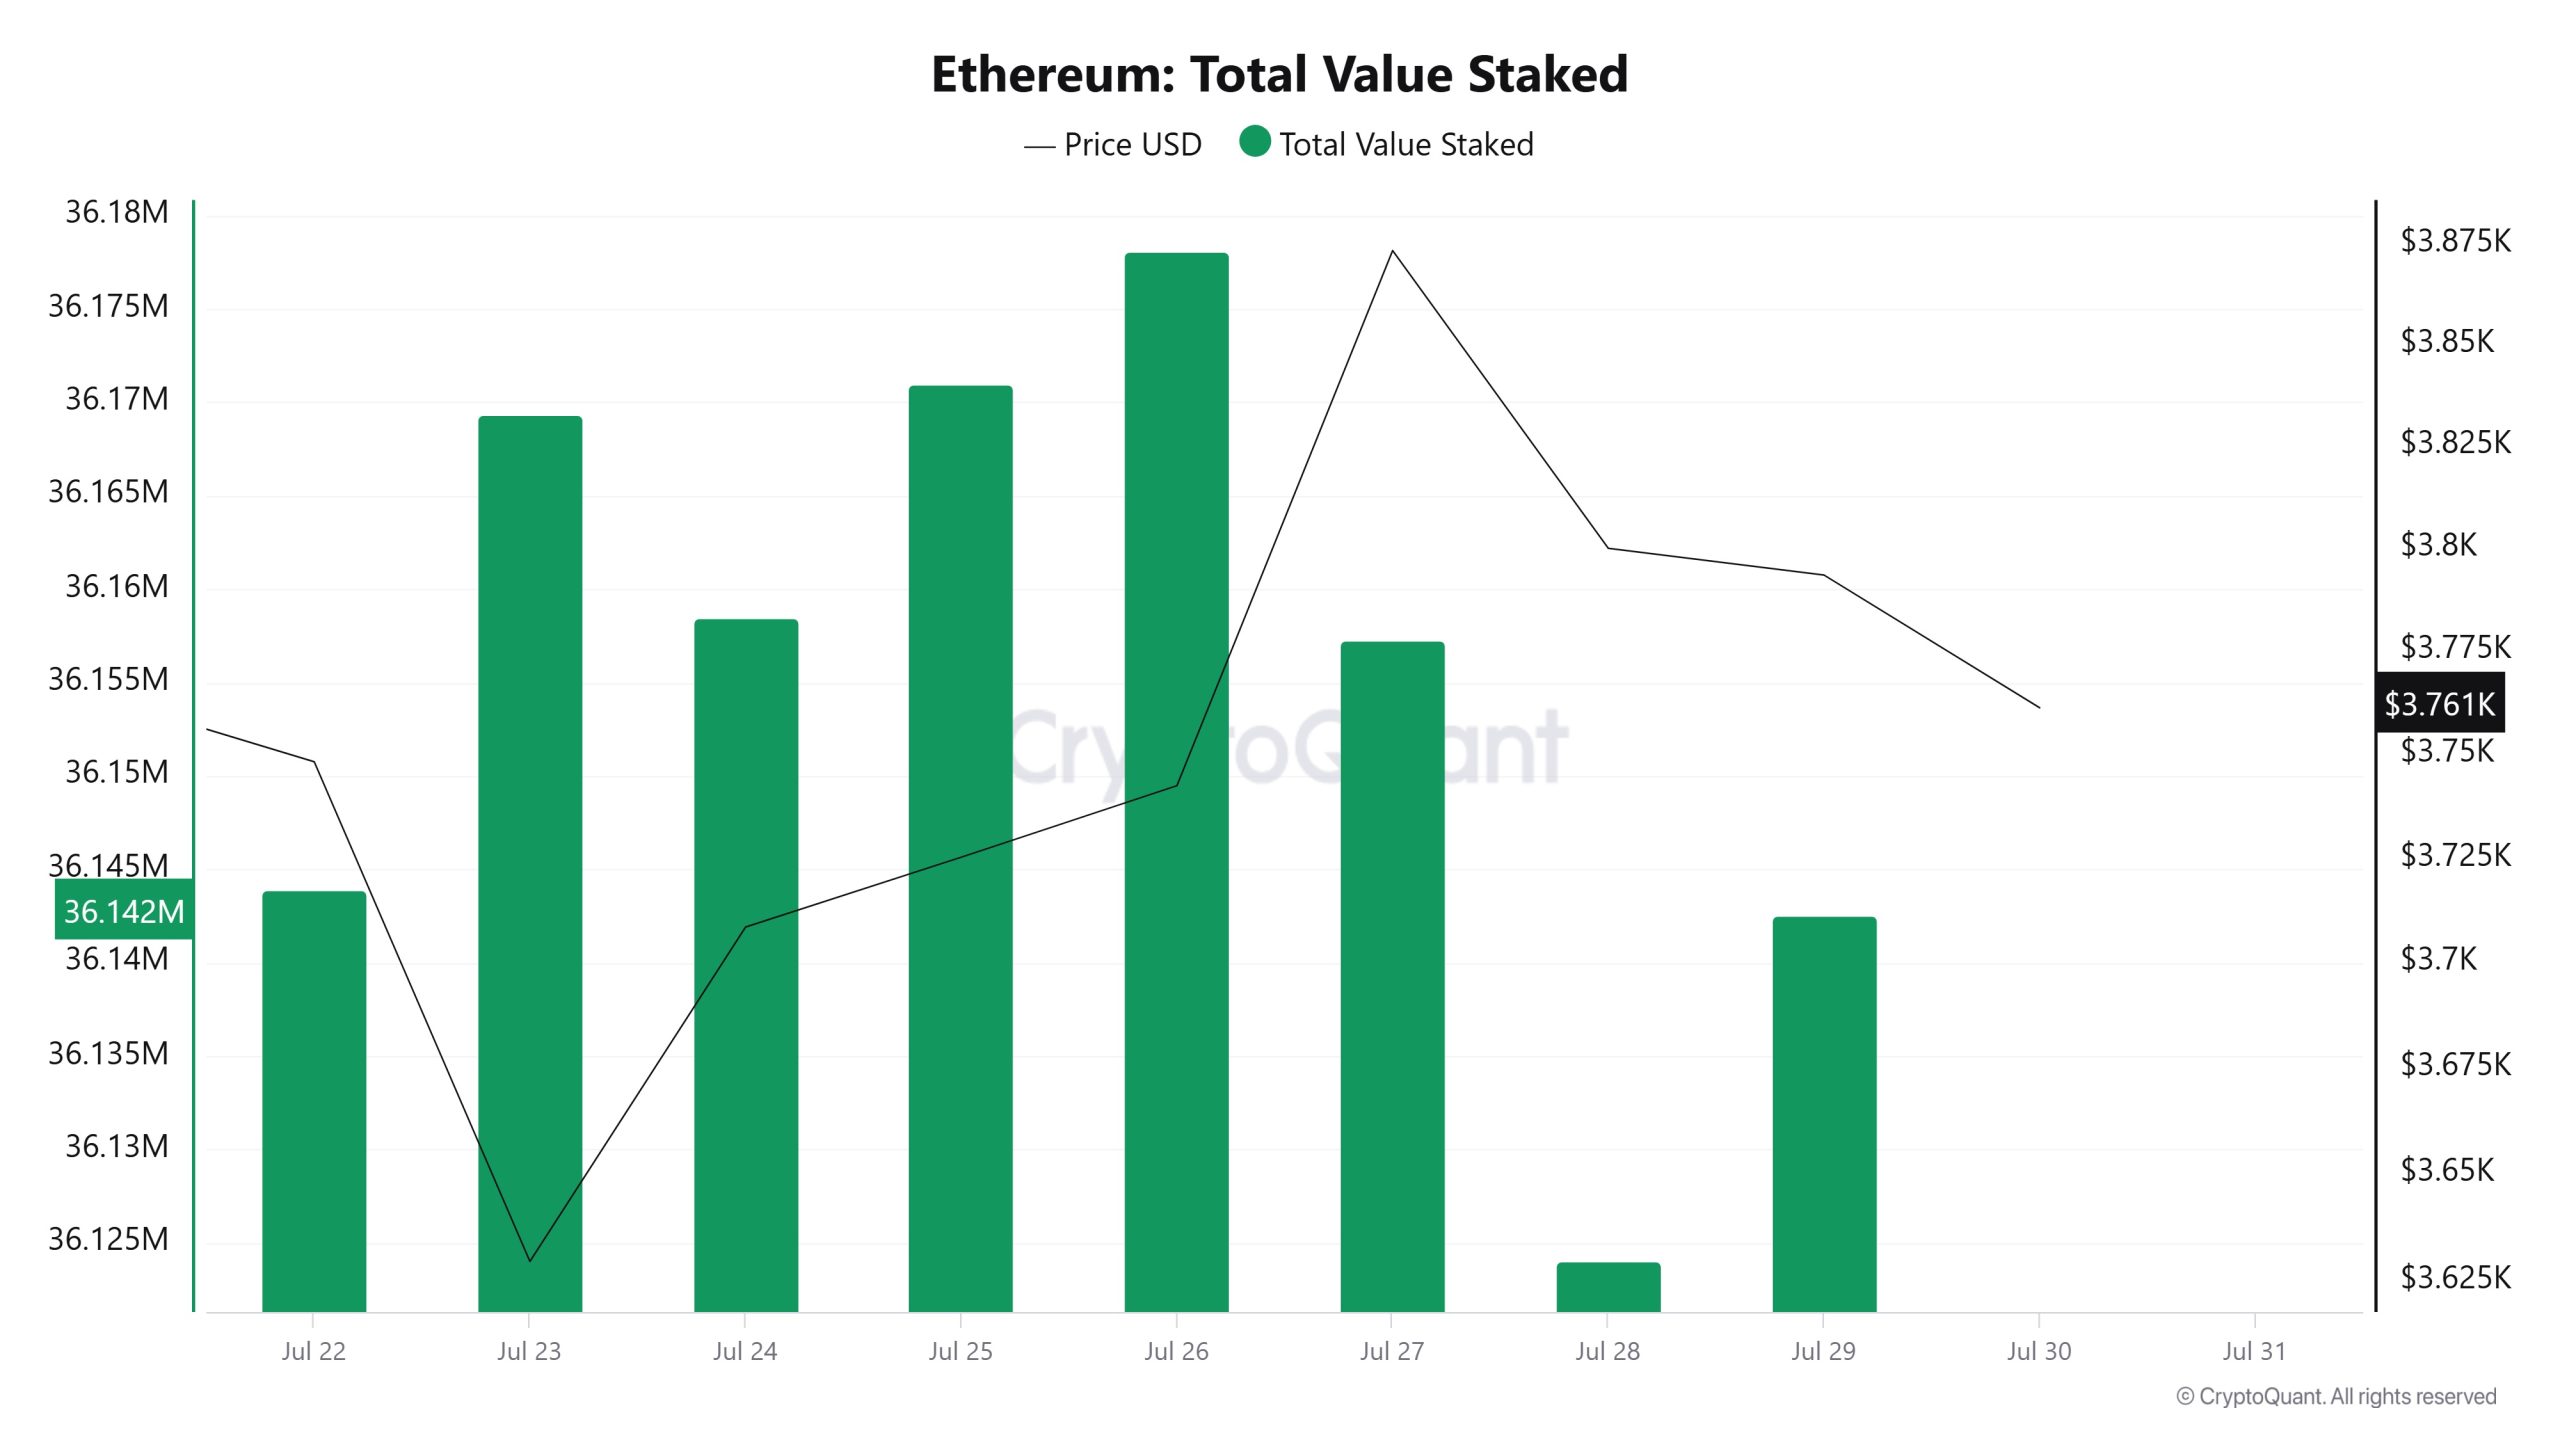
On July 23rd, ETH price was at 3.629 while Total Value Staked was at 36,169,340. As of July 29, ETH price increased by 4.51% to 3,793, while Total Value Staked decreased by 0.07% to 36,142,572.
Staking Inflows
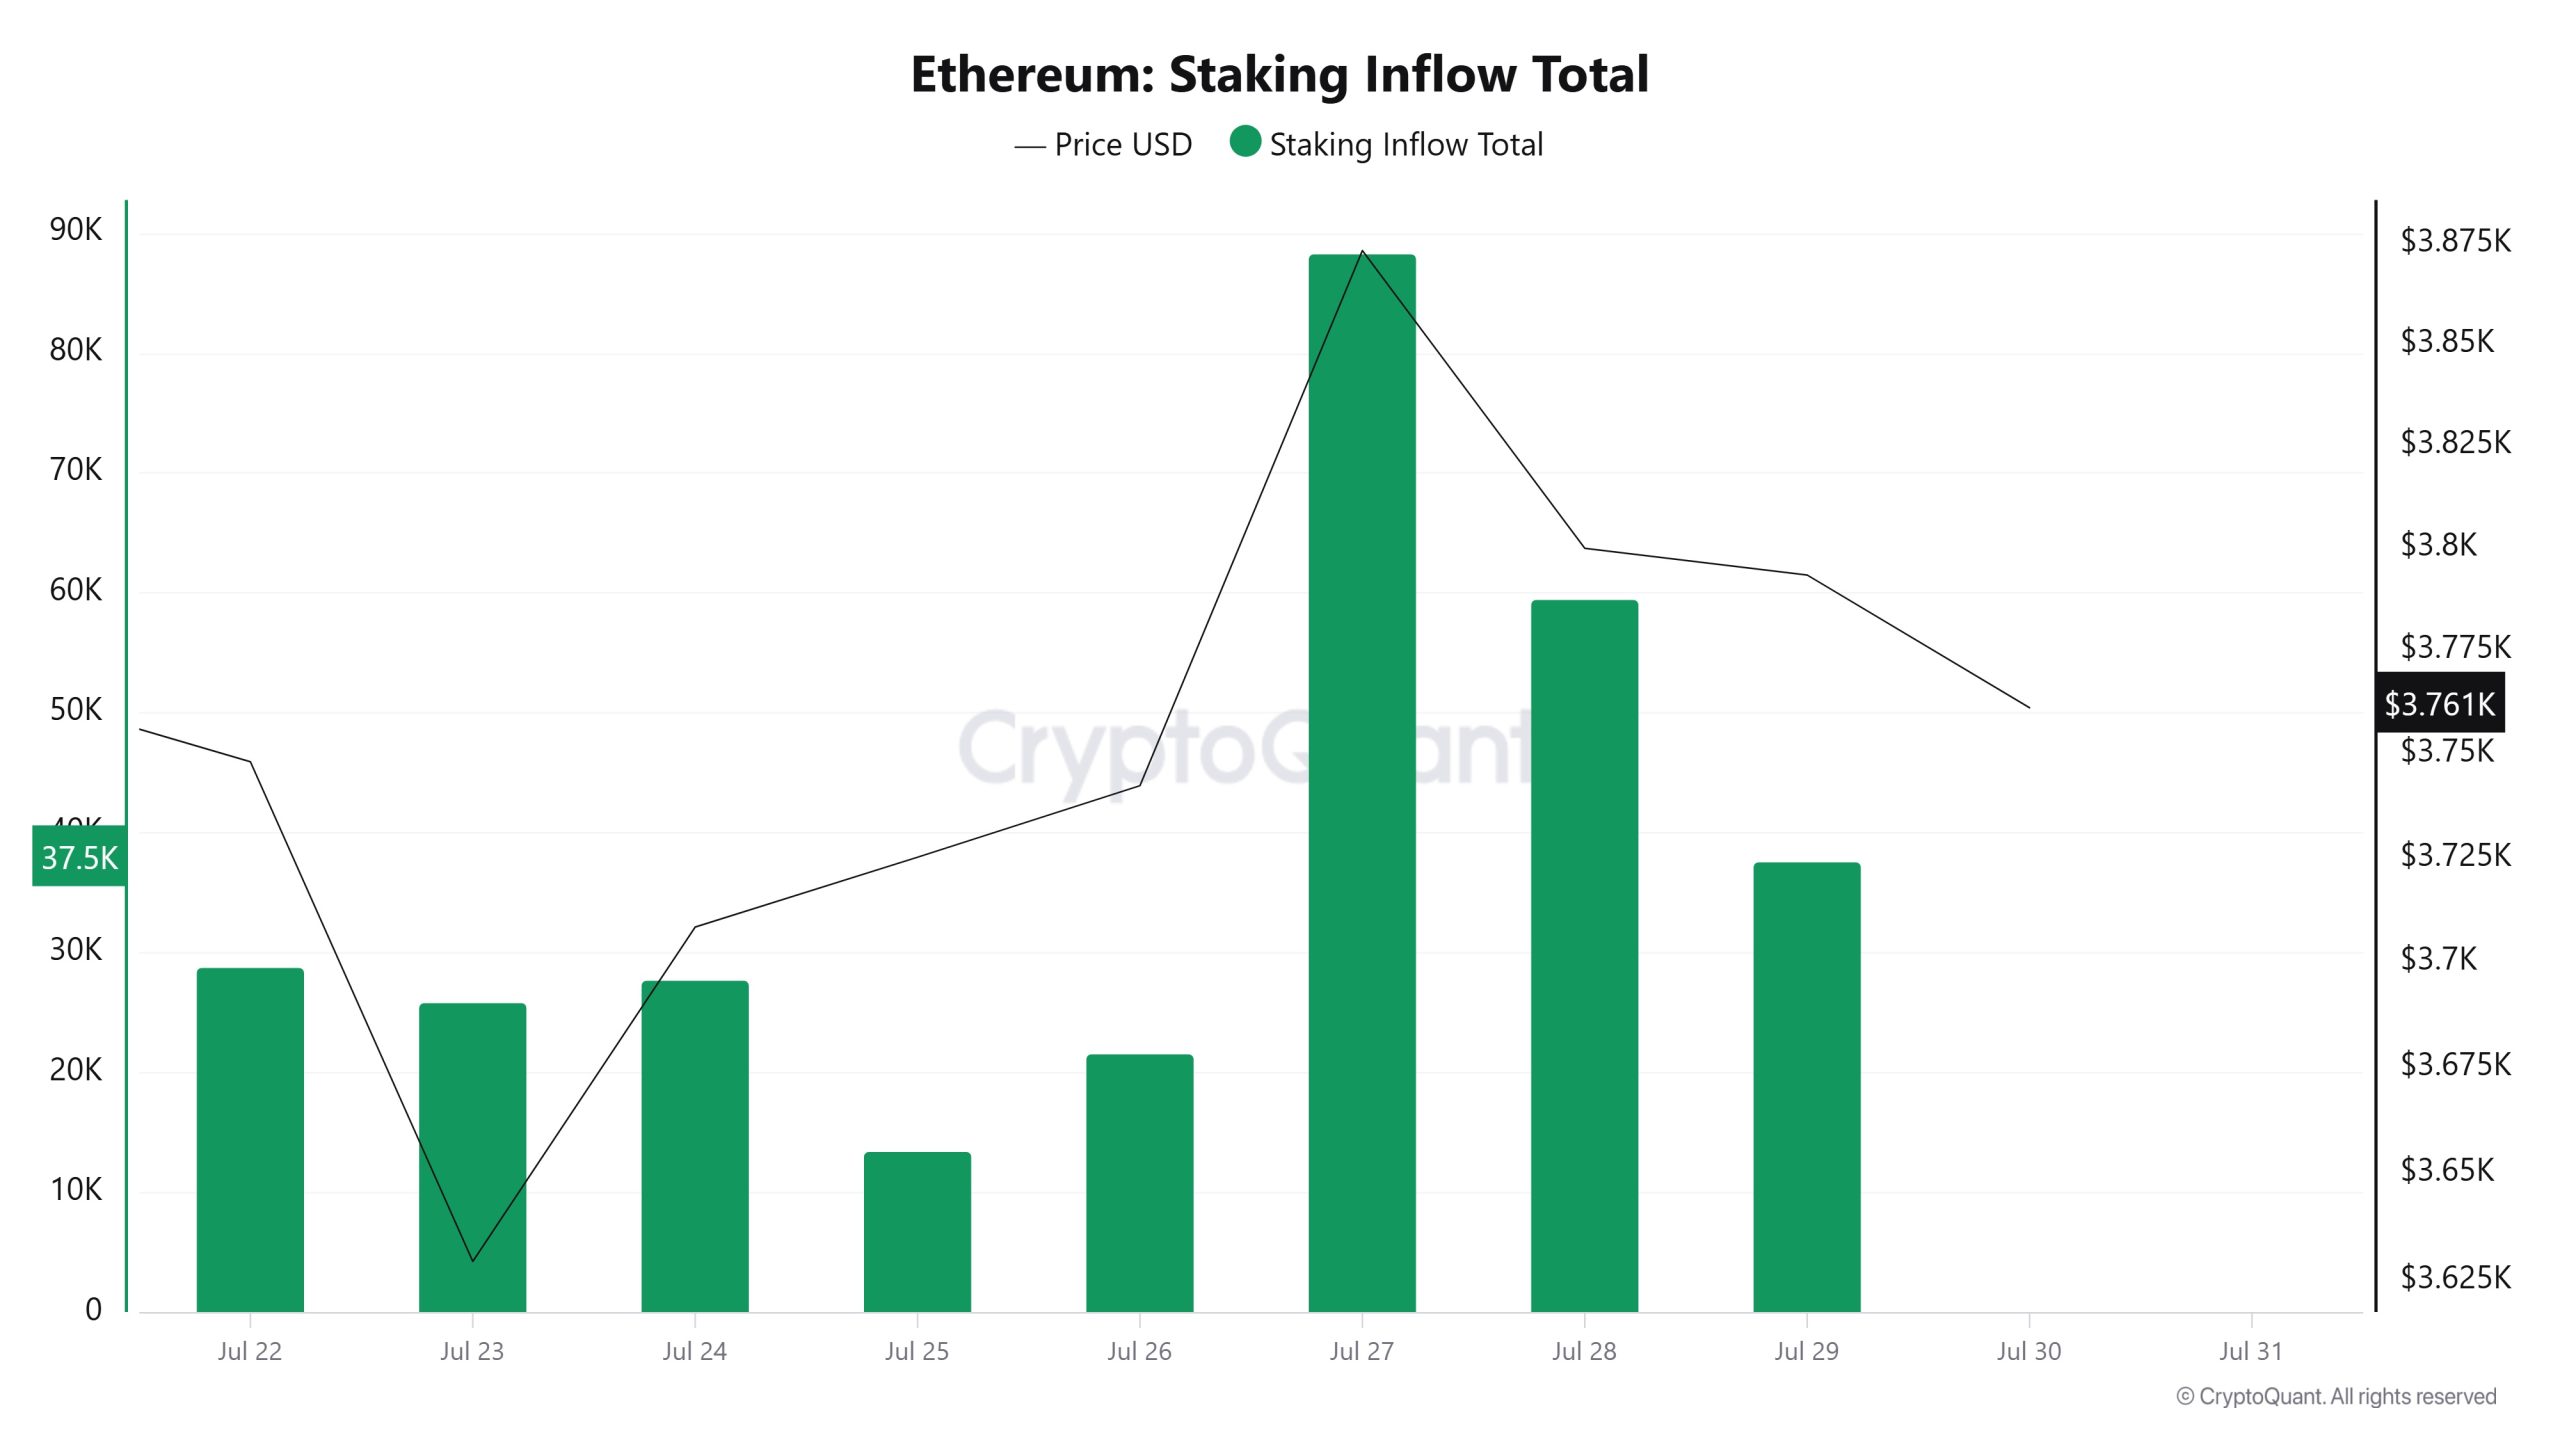
On July 23, ETH price was at 3.629, while Staking Inflow was at 25.884. As of July 29, ETH price rose to 3,793, an increase of 4.51%, while Staking Inflow rose to 37,586, an increase of 45.19%.
Derivatives
Open Interest
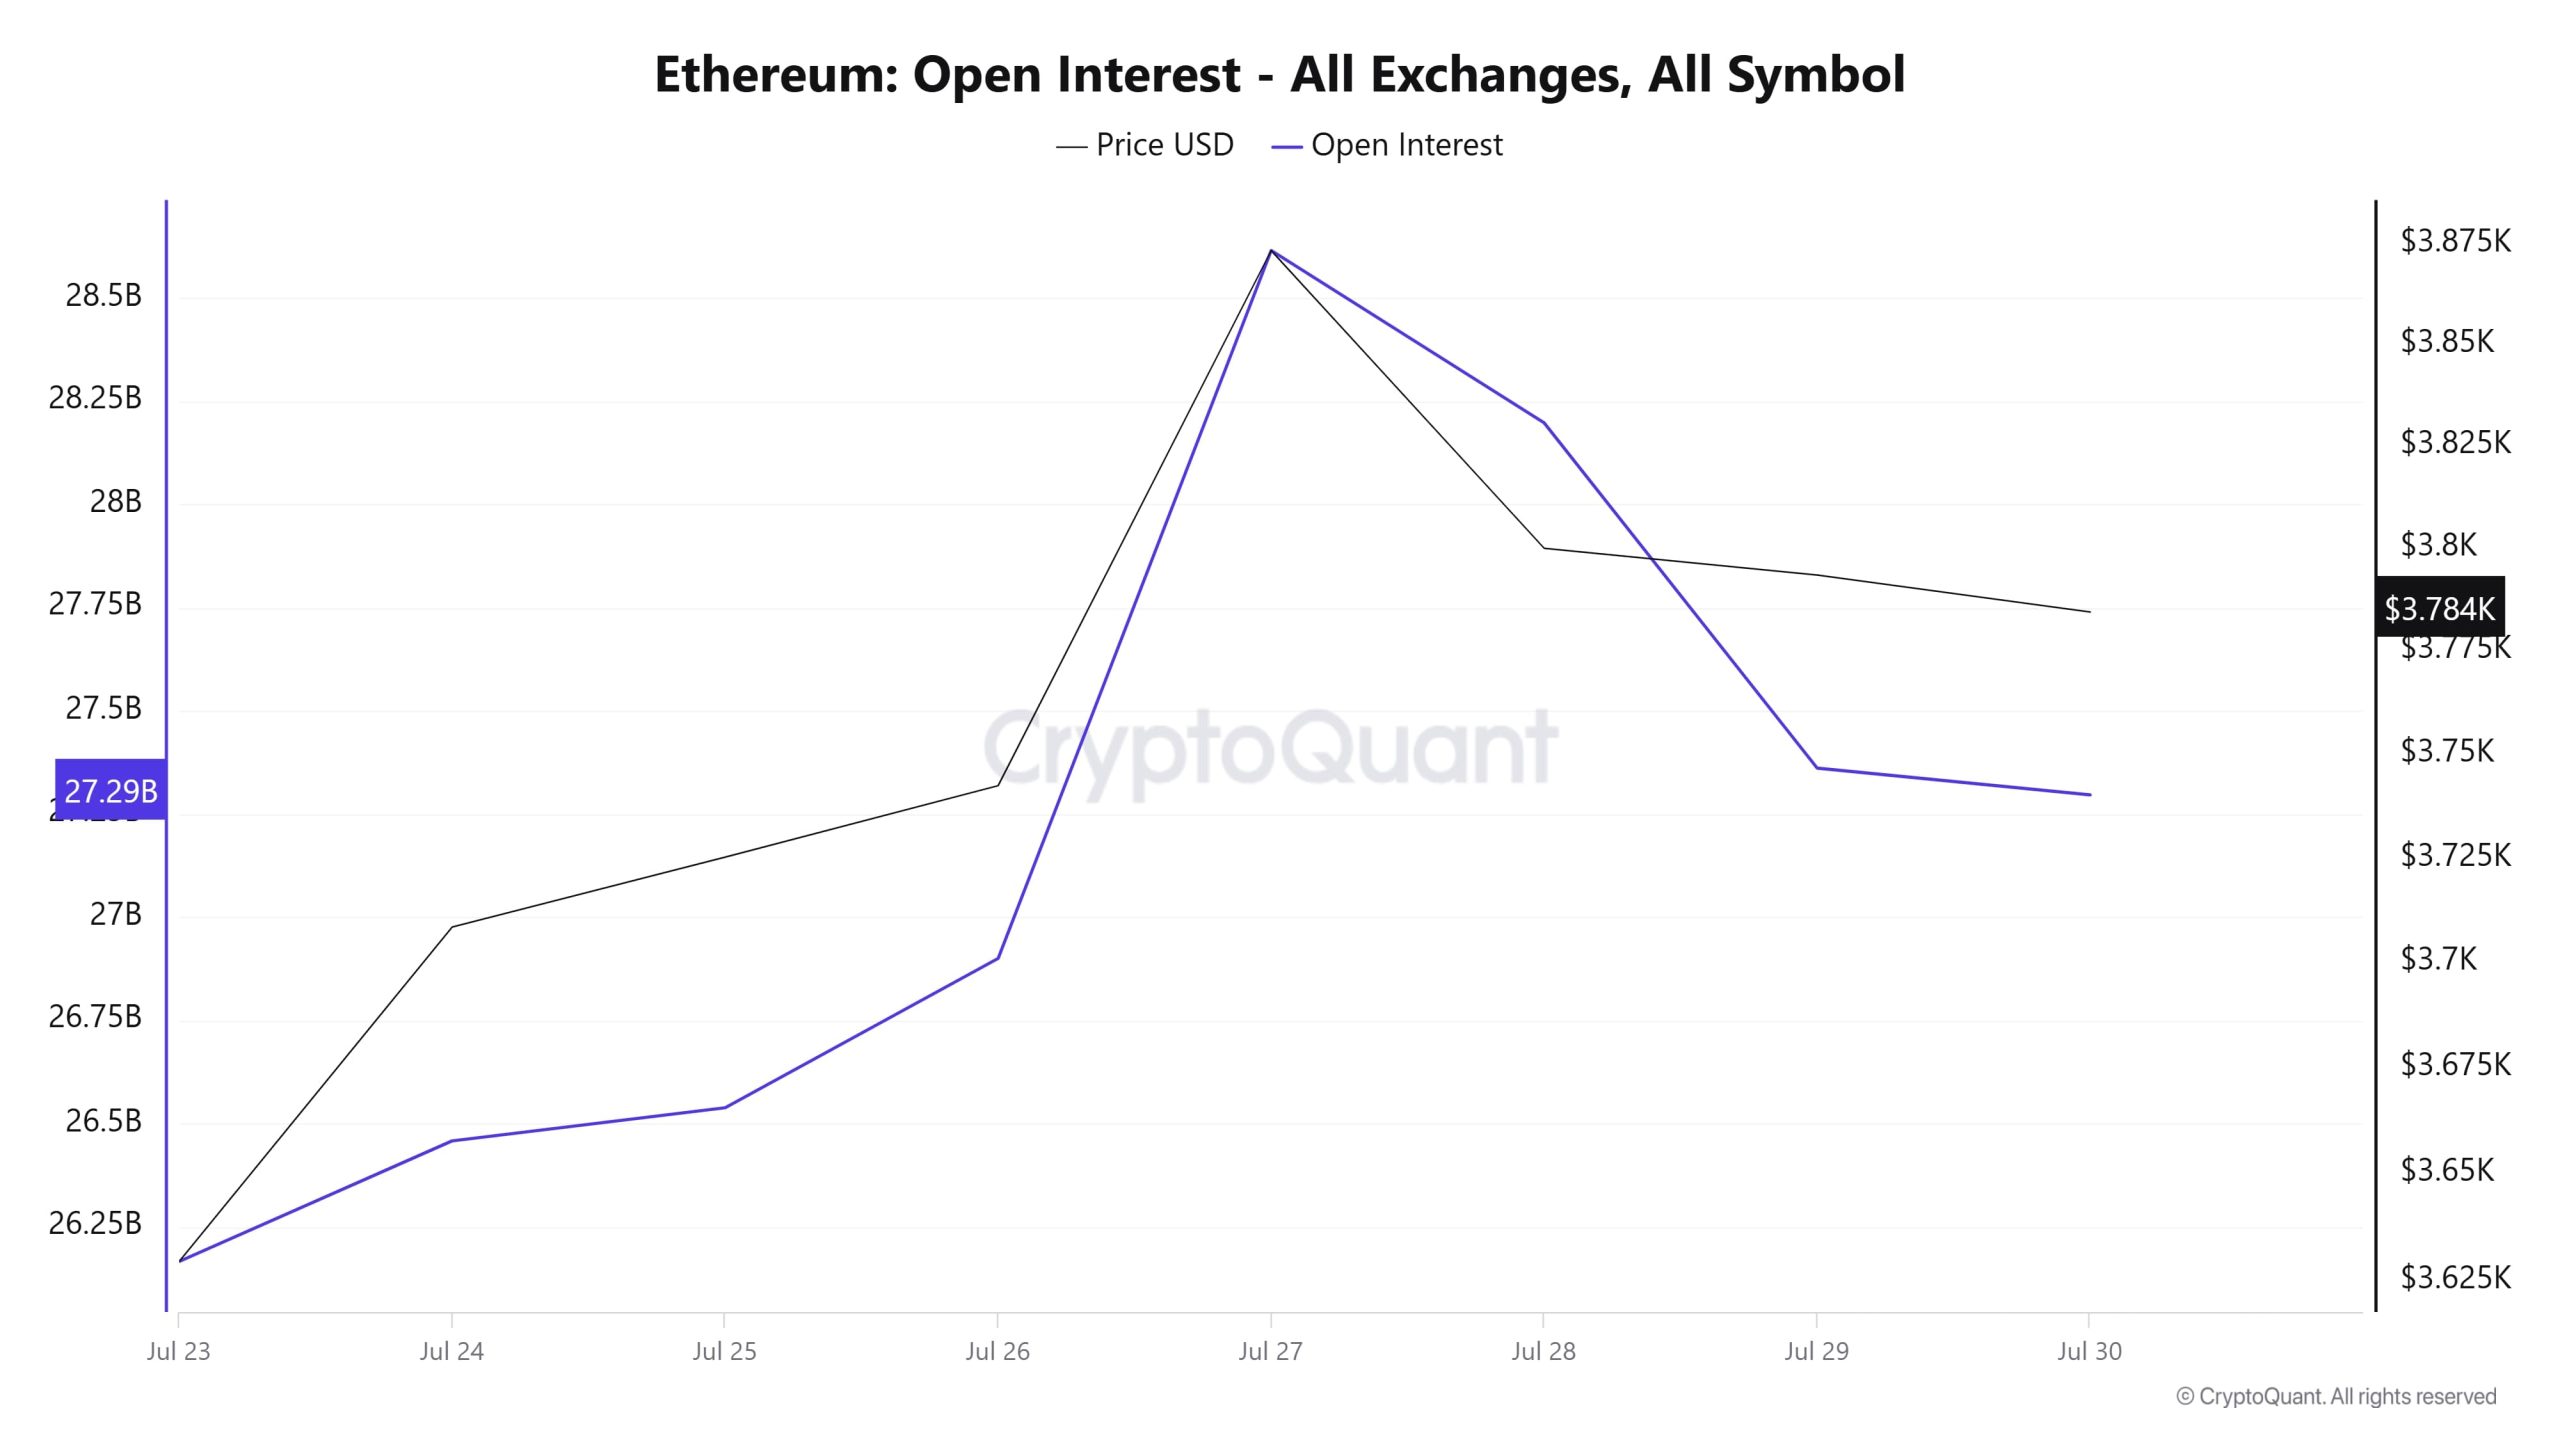
Open positions in Ethereum have gradually increased since July 23, with a peak in both price and open interest on July 27. After this date, a downward trend in both indicators came to the fore. Especially on July 28 and 29, a rapid retreat in open interest was noteworthy, while the price experienced a more limited decline. On July 30, open interest remained close to flat while the price held at $3,784. In general, it can be said that most of the positions opened during the rise may have been closed and this situation indicates short-term profit realizations in the market.
Funding Rate
Ethereum funding rate data has remained in high positive territory in recent days. The rates, which were quite high on July 23, fell on July 24, but recovered again in the following days. In other words, demand for long positions increased and the price reacted upwards.
As of July 28, although the funding rate increased again, the price started to decline. This shows that long positions are intensifying but the price is now struggling to go up with this demand. On July 29 and 30, there was a significant drop in the funding rate. Despite this drop, the price seems to have held at $3,784.
To summarize, the market first had high expectations for longs and the price followed suit. However, momentum may be weakening with the decline in funding rates in recent days. Although the price is still holding at high levels, it may be necessary to be cautious about the upward continuation.
Long & Short Liquidations
ETH price, which fell to $3,500 last time, continued its upward movement. However, with volatile daily candles, a total of $727 million worth of longs and $376 million worth of shorts were liquidated.
| Date | Long Amount (Million $) | Short Amount (Million $) |
|---|---|---|
| July 23 | 182.36 | 36.62 |
| July 24 | 84.13 | 72.96 |
| July 25 | 237.34 | 67.94 |
| July 26 | 13.22 | 45.93 |
| July 27 | 16.68 | 55.52 |
| July 28 | 120.52 | 58.44 |
| July 29 | 73.11 | 39.66 |
| Total | 727.36 | 376.07 |
Supply Distribution
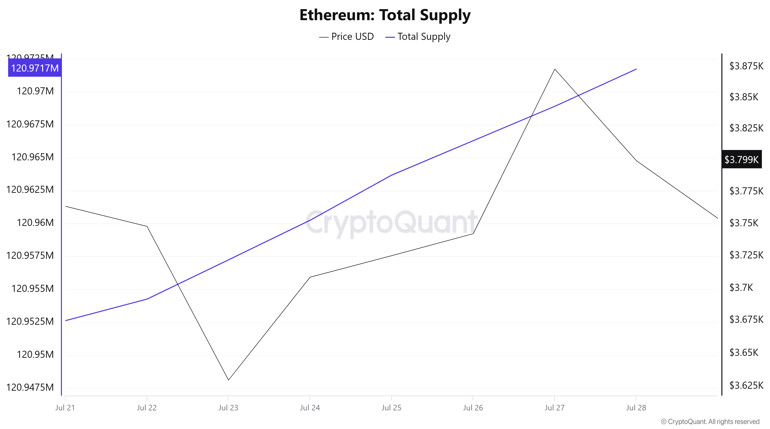
Total Supply: It reached 120,971,736 units, up about 0.0158% from last week.
New Supply: The amount of ETH produced this week was 19,118.
Velocity: Velocity was 8.85 as of July 28, down from 8.76 last week.
| Wallet Category | 21.07.2025 | 28.07.2025 | Change (%) |
|---|---|---|---|
| 100 – 1k ETH | 8.9037M | 8.8642M | -0.4435% |
| 1k – 10k ETH | 13.4586M | 12.6256M | -6.1908% |
| 10k – 100k ETH | 17.071M | 18.1479M | 6.3084% |
| 100k+ ETH | 4.1136M | 4.3805M | 6.4893% |
According to the latest weekly data, Ethereum wallet distribution is mixed. While wallet balances in the 100 – 1k ETH range experienced a limited decrease of 0.44%, a significant decrease of 6.19% was recorded in the 1k – 10k ETH segment. In contrast, the 10k – 100k ETH range saw a notable increase of 6.31%, while the 100k+ ETH category saw a strong rise of 6.49%.
Exchange Supply Ratio
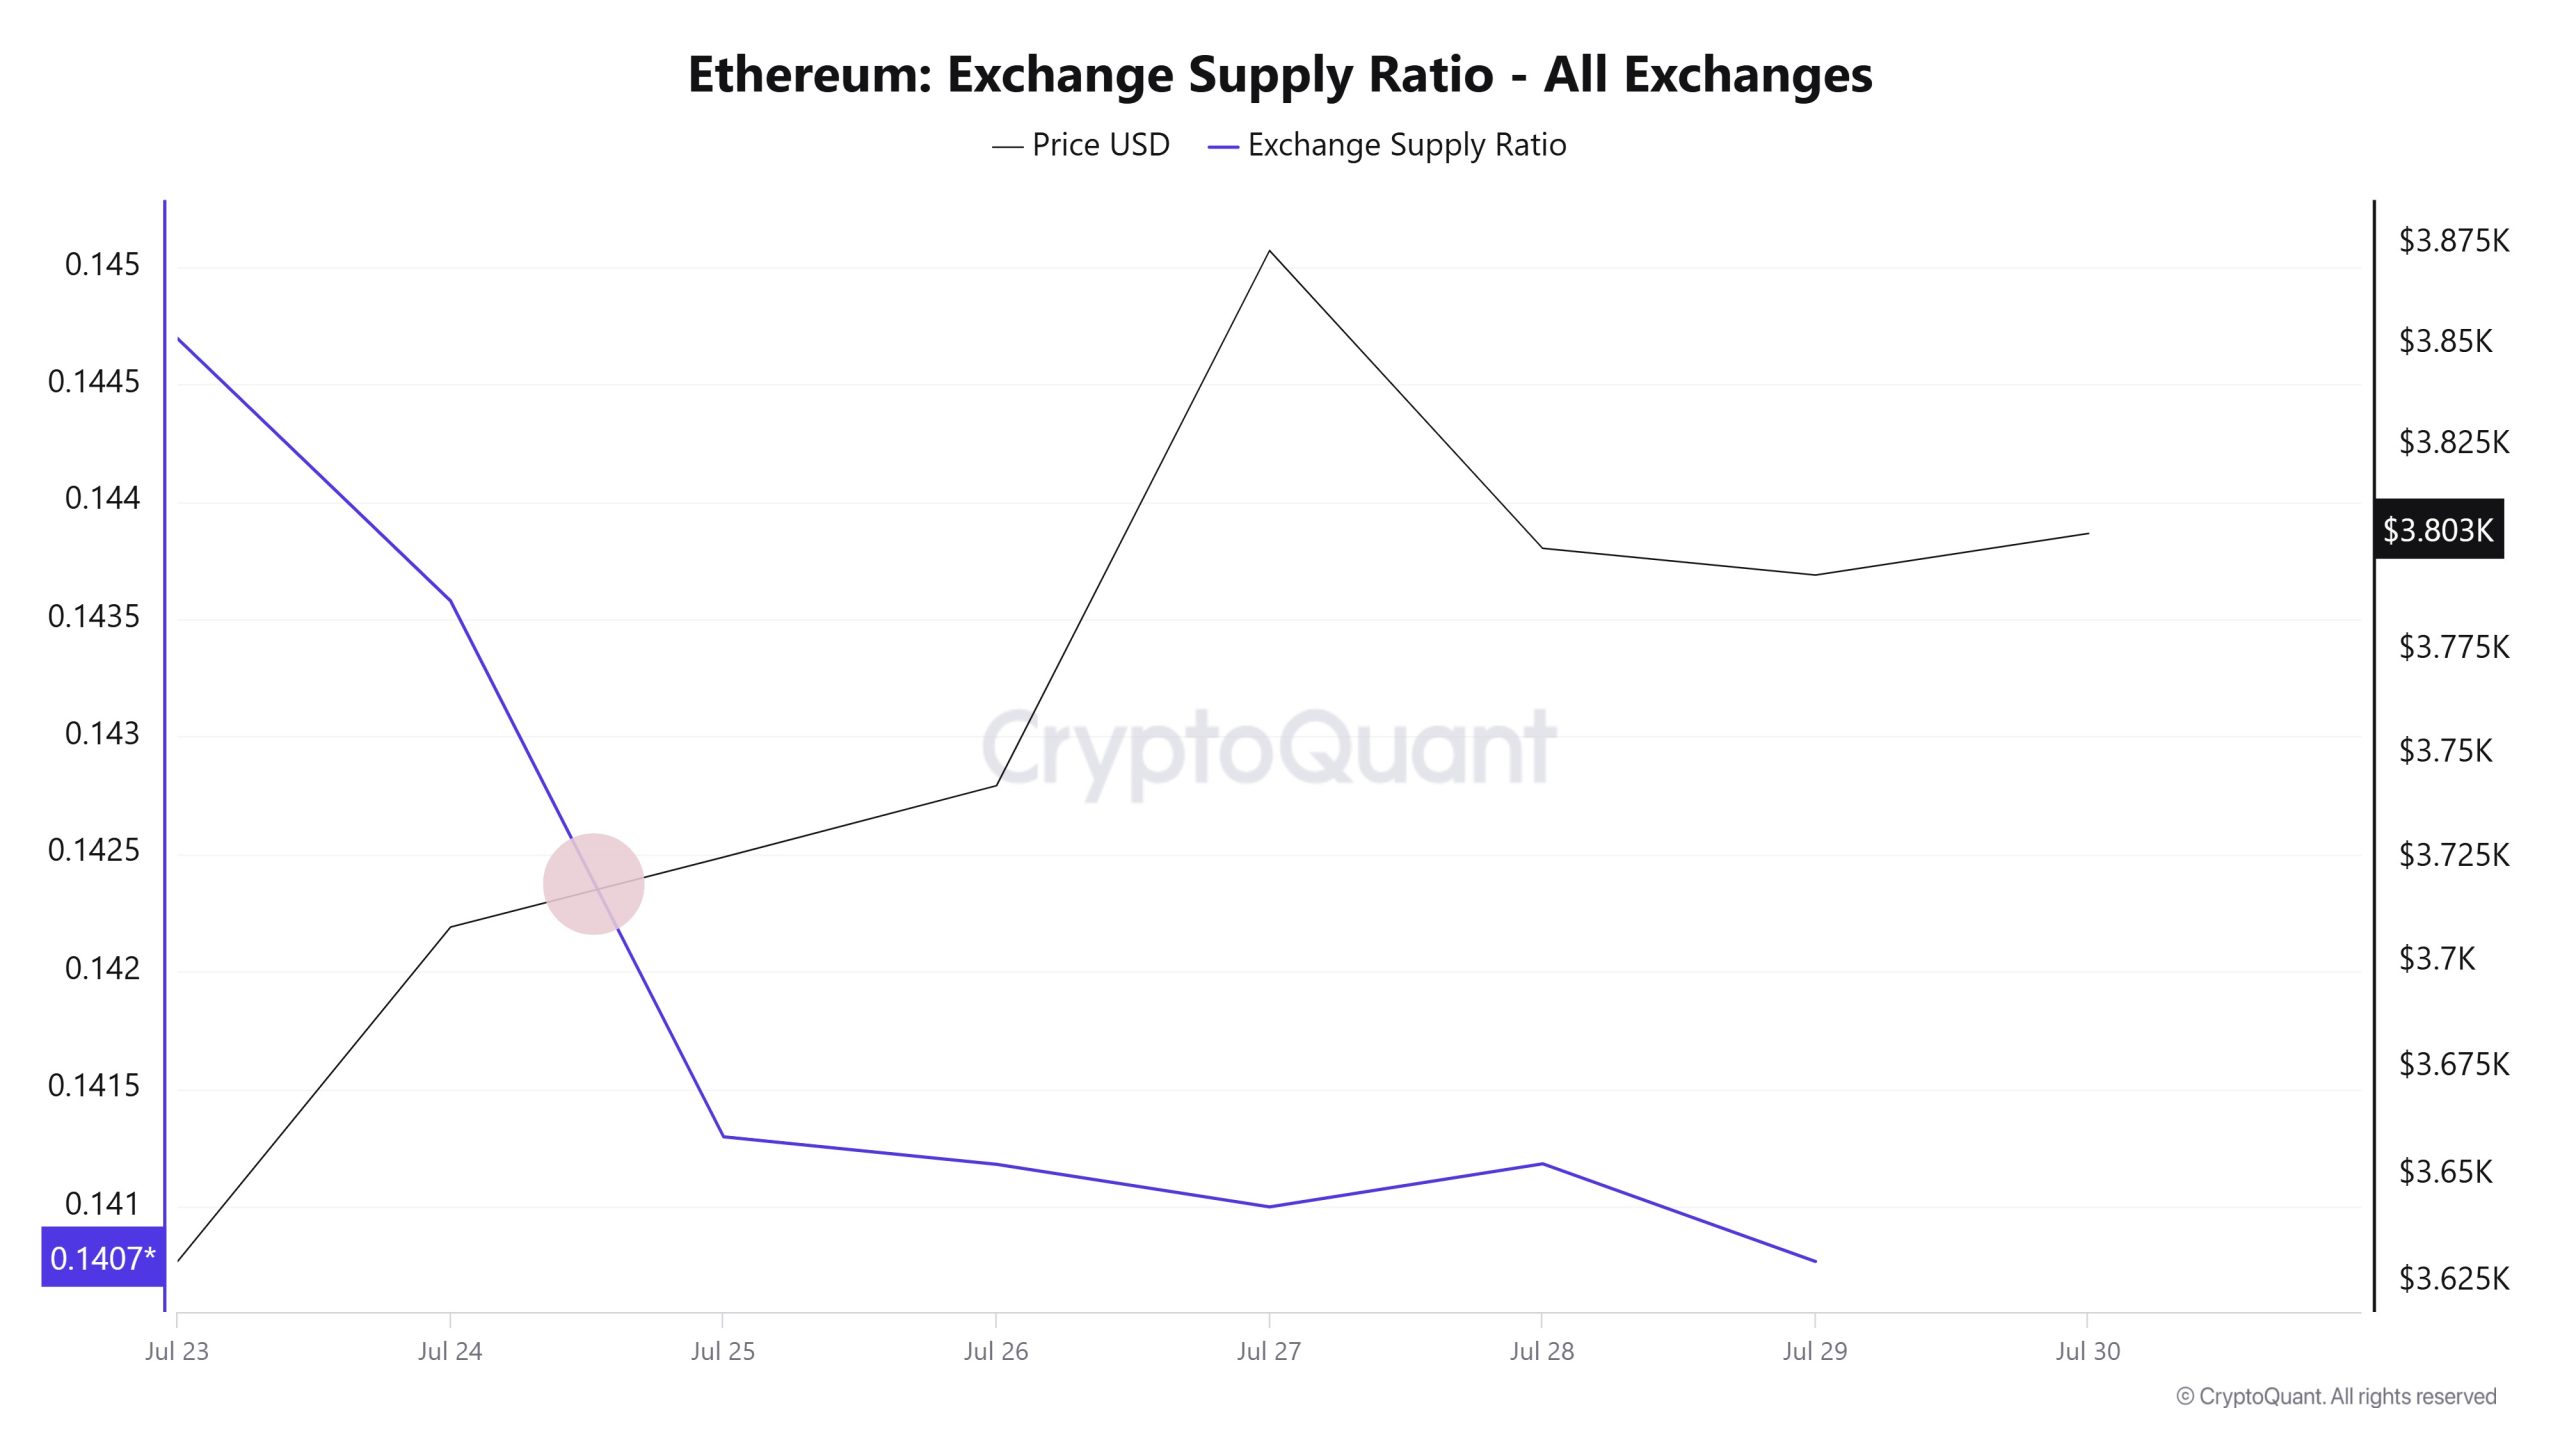
Between July 23rd and July 29th, the Ethereum Exchange Supply Ratio decreased from 0.14357835 to 0.14018054. During this period, the Ethereum price increased from $3,708 to $3,793. At the intersection of the price and the Exchange Supply Ratio, there was a significant decrease in the Exchange Supply Ratio while the price continued to rise, especially between July 24 and 25. This suggests that despite the price increase, the amount of Ethereum supplied to exchanges has decreased, possibly indicating that long-term investors continue to hold their holdings. Ethereum price is generally on an upward trend.
Fees and Revenues
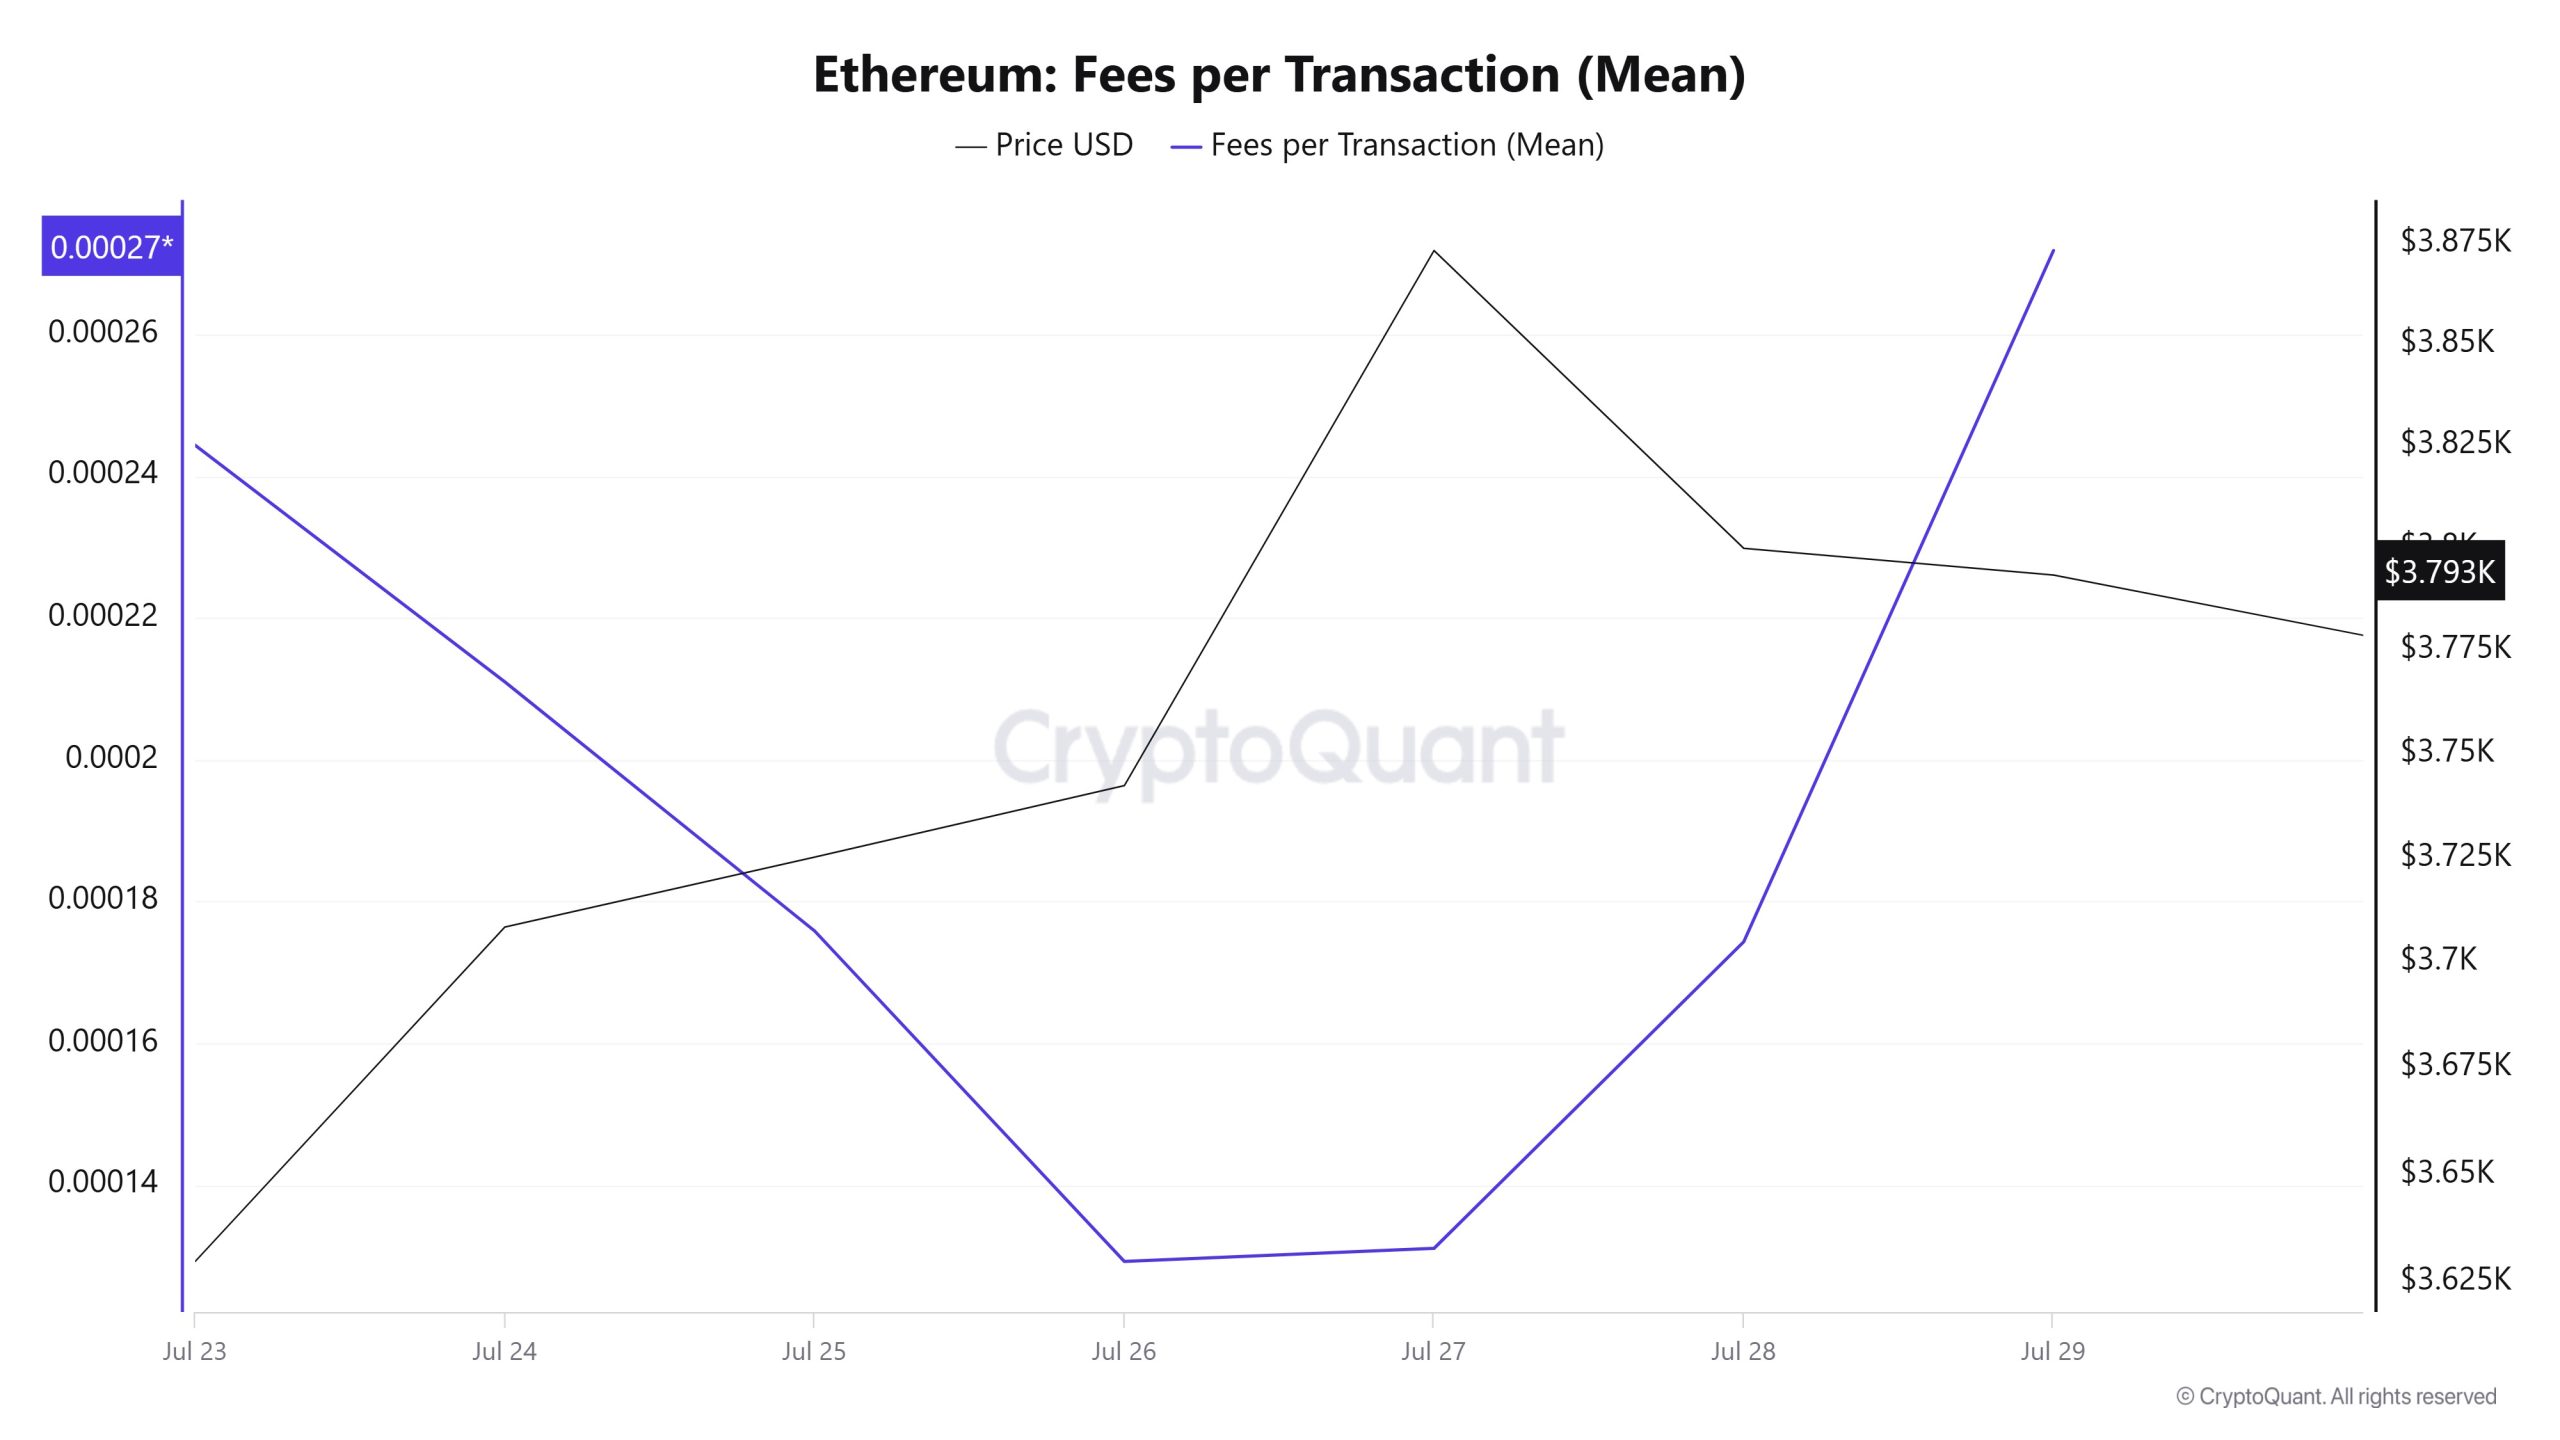
When the Ethereum Fees per Transaction (Mean) data between July 23 and July 29 are analyzed, it is seen that this indicator was realized at 0.00024440525569803 on July 23, the first day of the week.
As of this date, a fluctuating course was observed with the effect of the volatile movements in the Ethereum price; As of July 26, it reached 0.000129196352034924, reaching the lowest level of the week.
In the following days, Ethereum Fees per Transaction (Mean) started to rise again and closed at 0.000271887124639353 on July 29, the last day of the week.
Ethereum: Fees (Total)
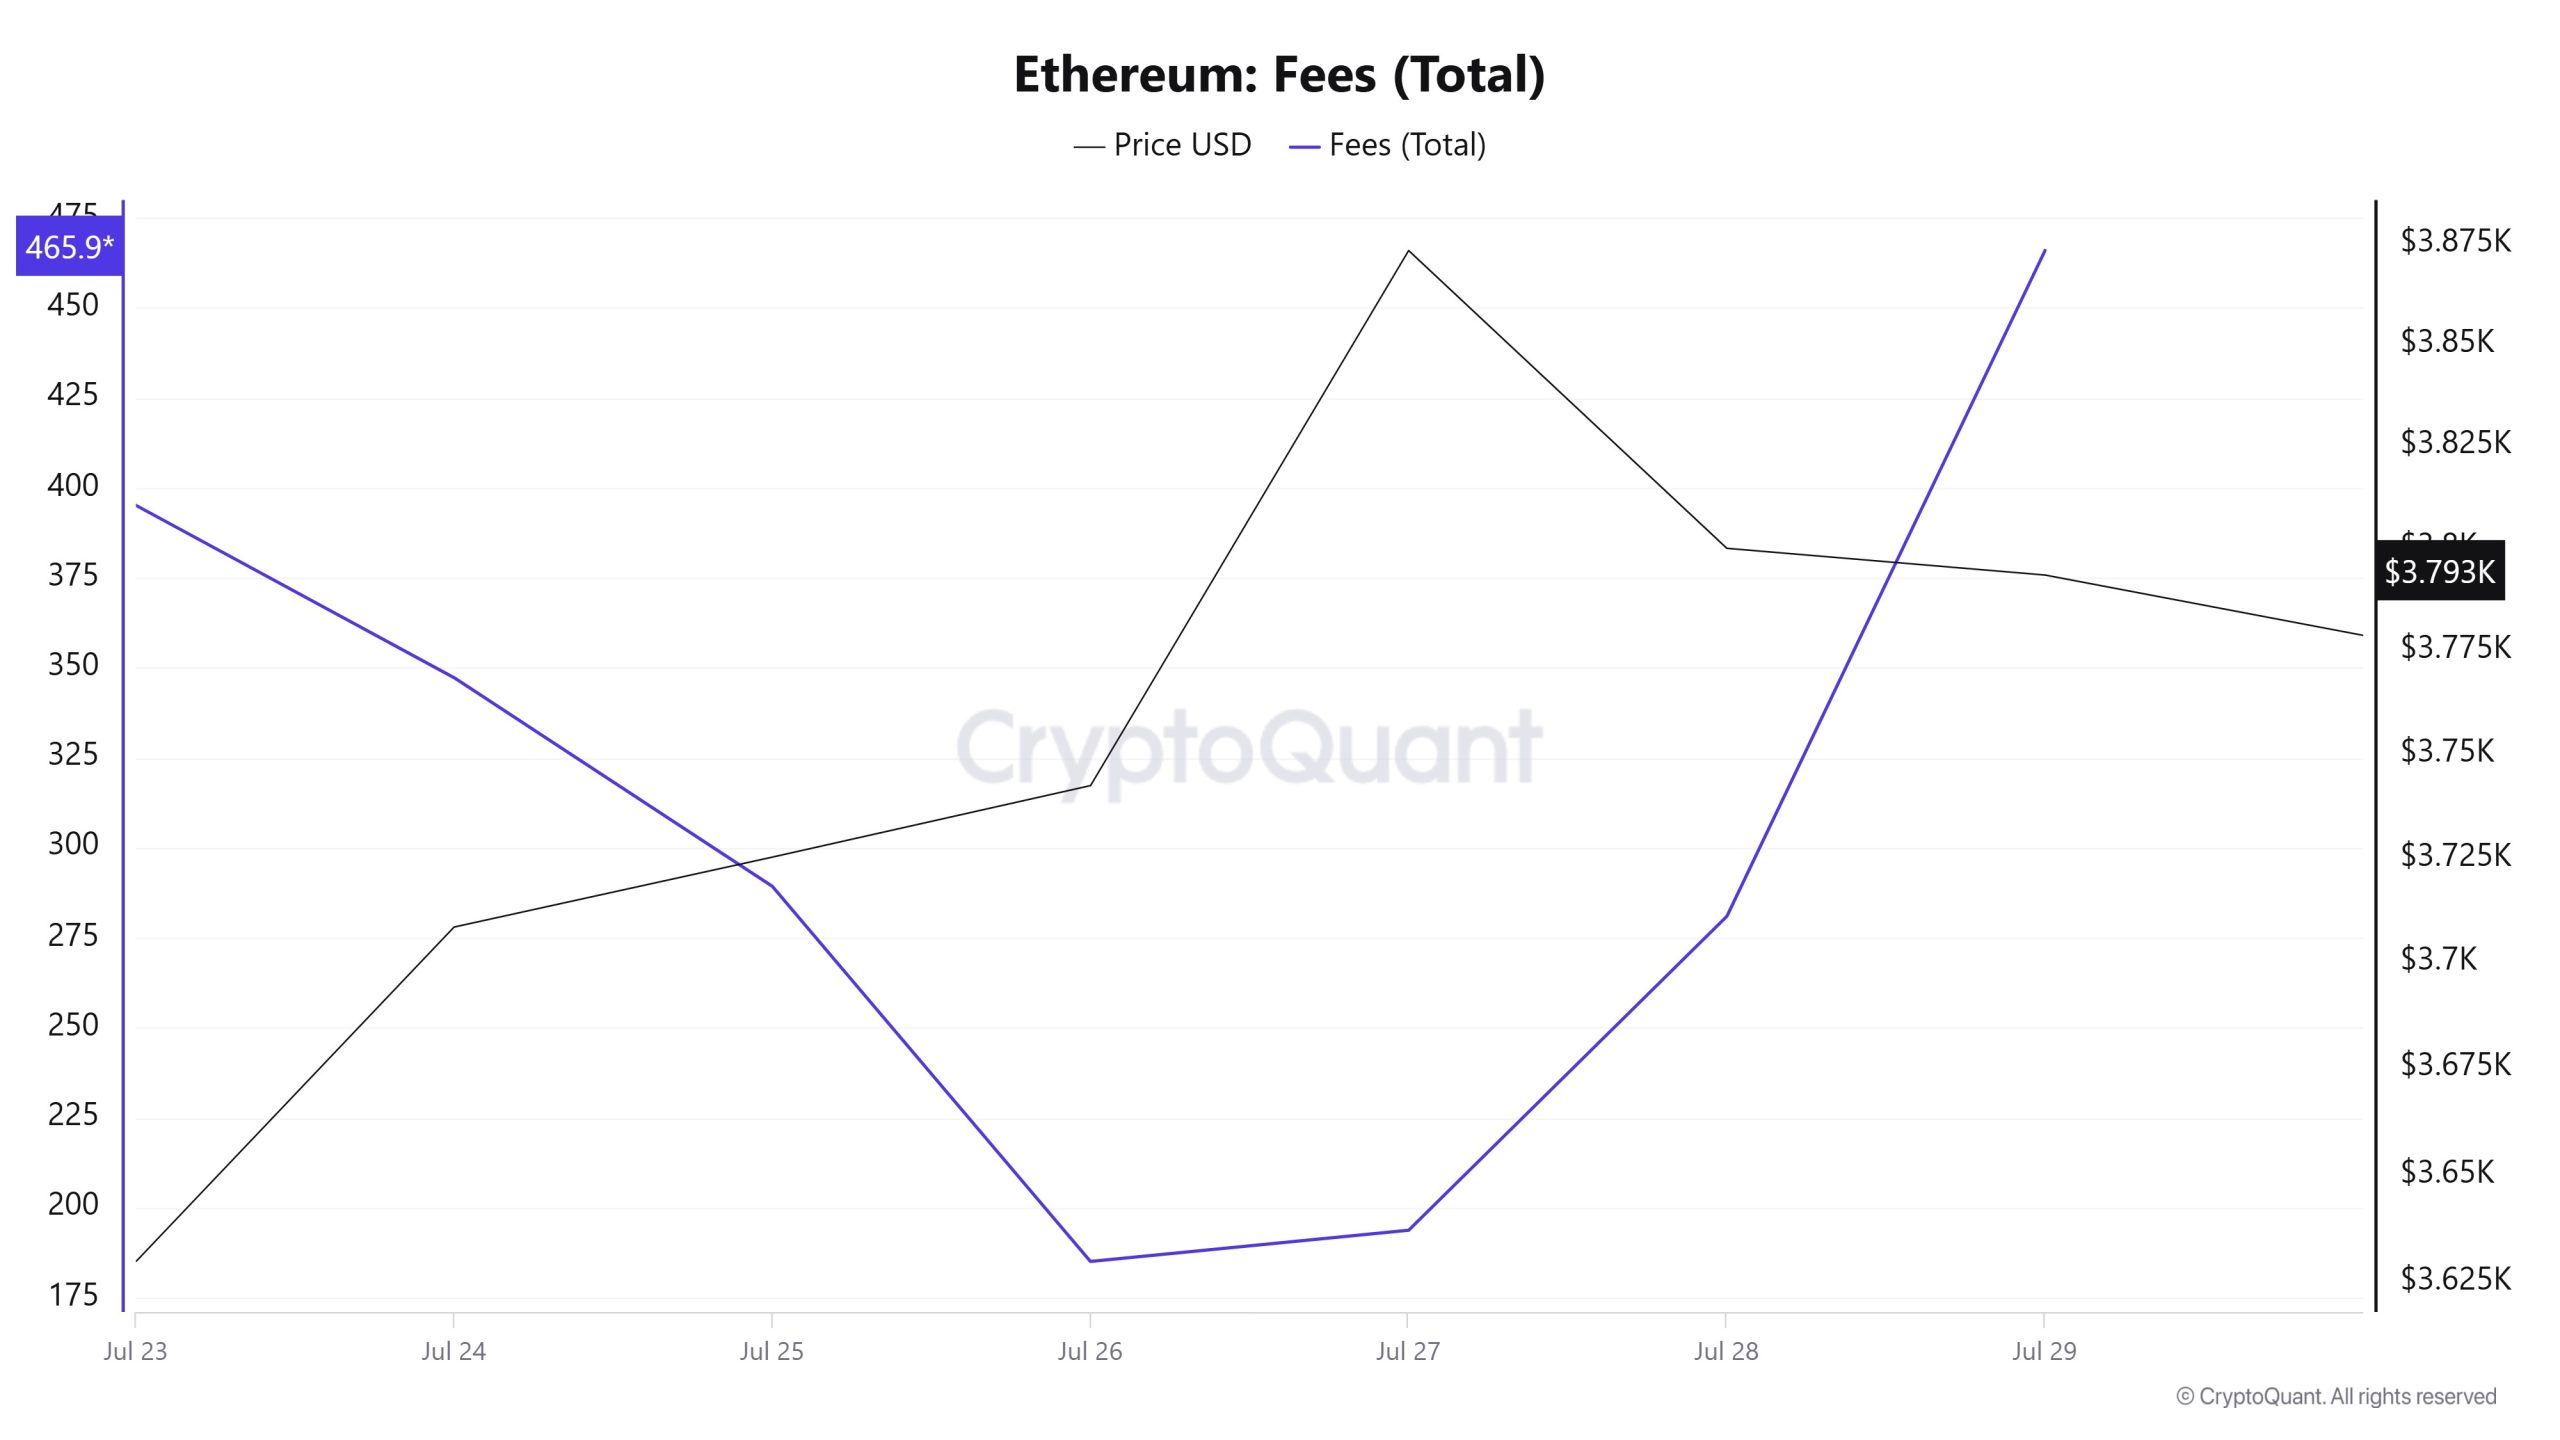
Similarly, an analysis of Ethereum Fees (Total) data between July 23 and July 29 shows that this indicator was 395.12459997138046 on July 23, the first day of the week.
As of this date, a fluctuating course was observed due to the volatile movements in the Ethereum price; as of July 26, it reached 185.03927886403497, reaching the lowest level of the week.
In the following days, Ethereum Fees (Total) started to rise again and closed at 465,91909925110315 on July 29, the last day of the week.
Blocks Mined
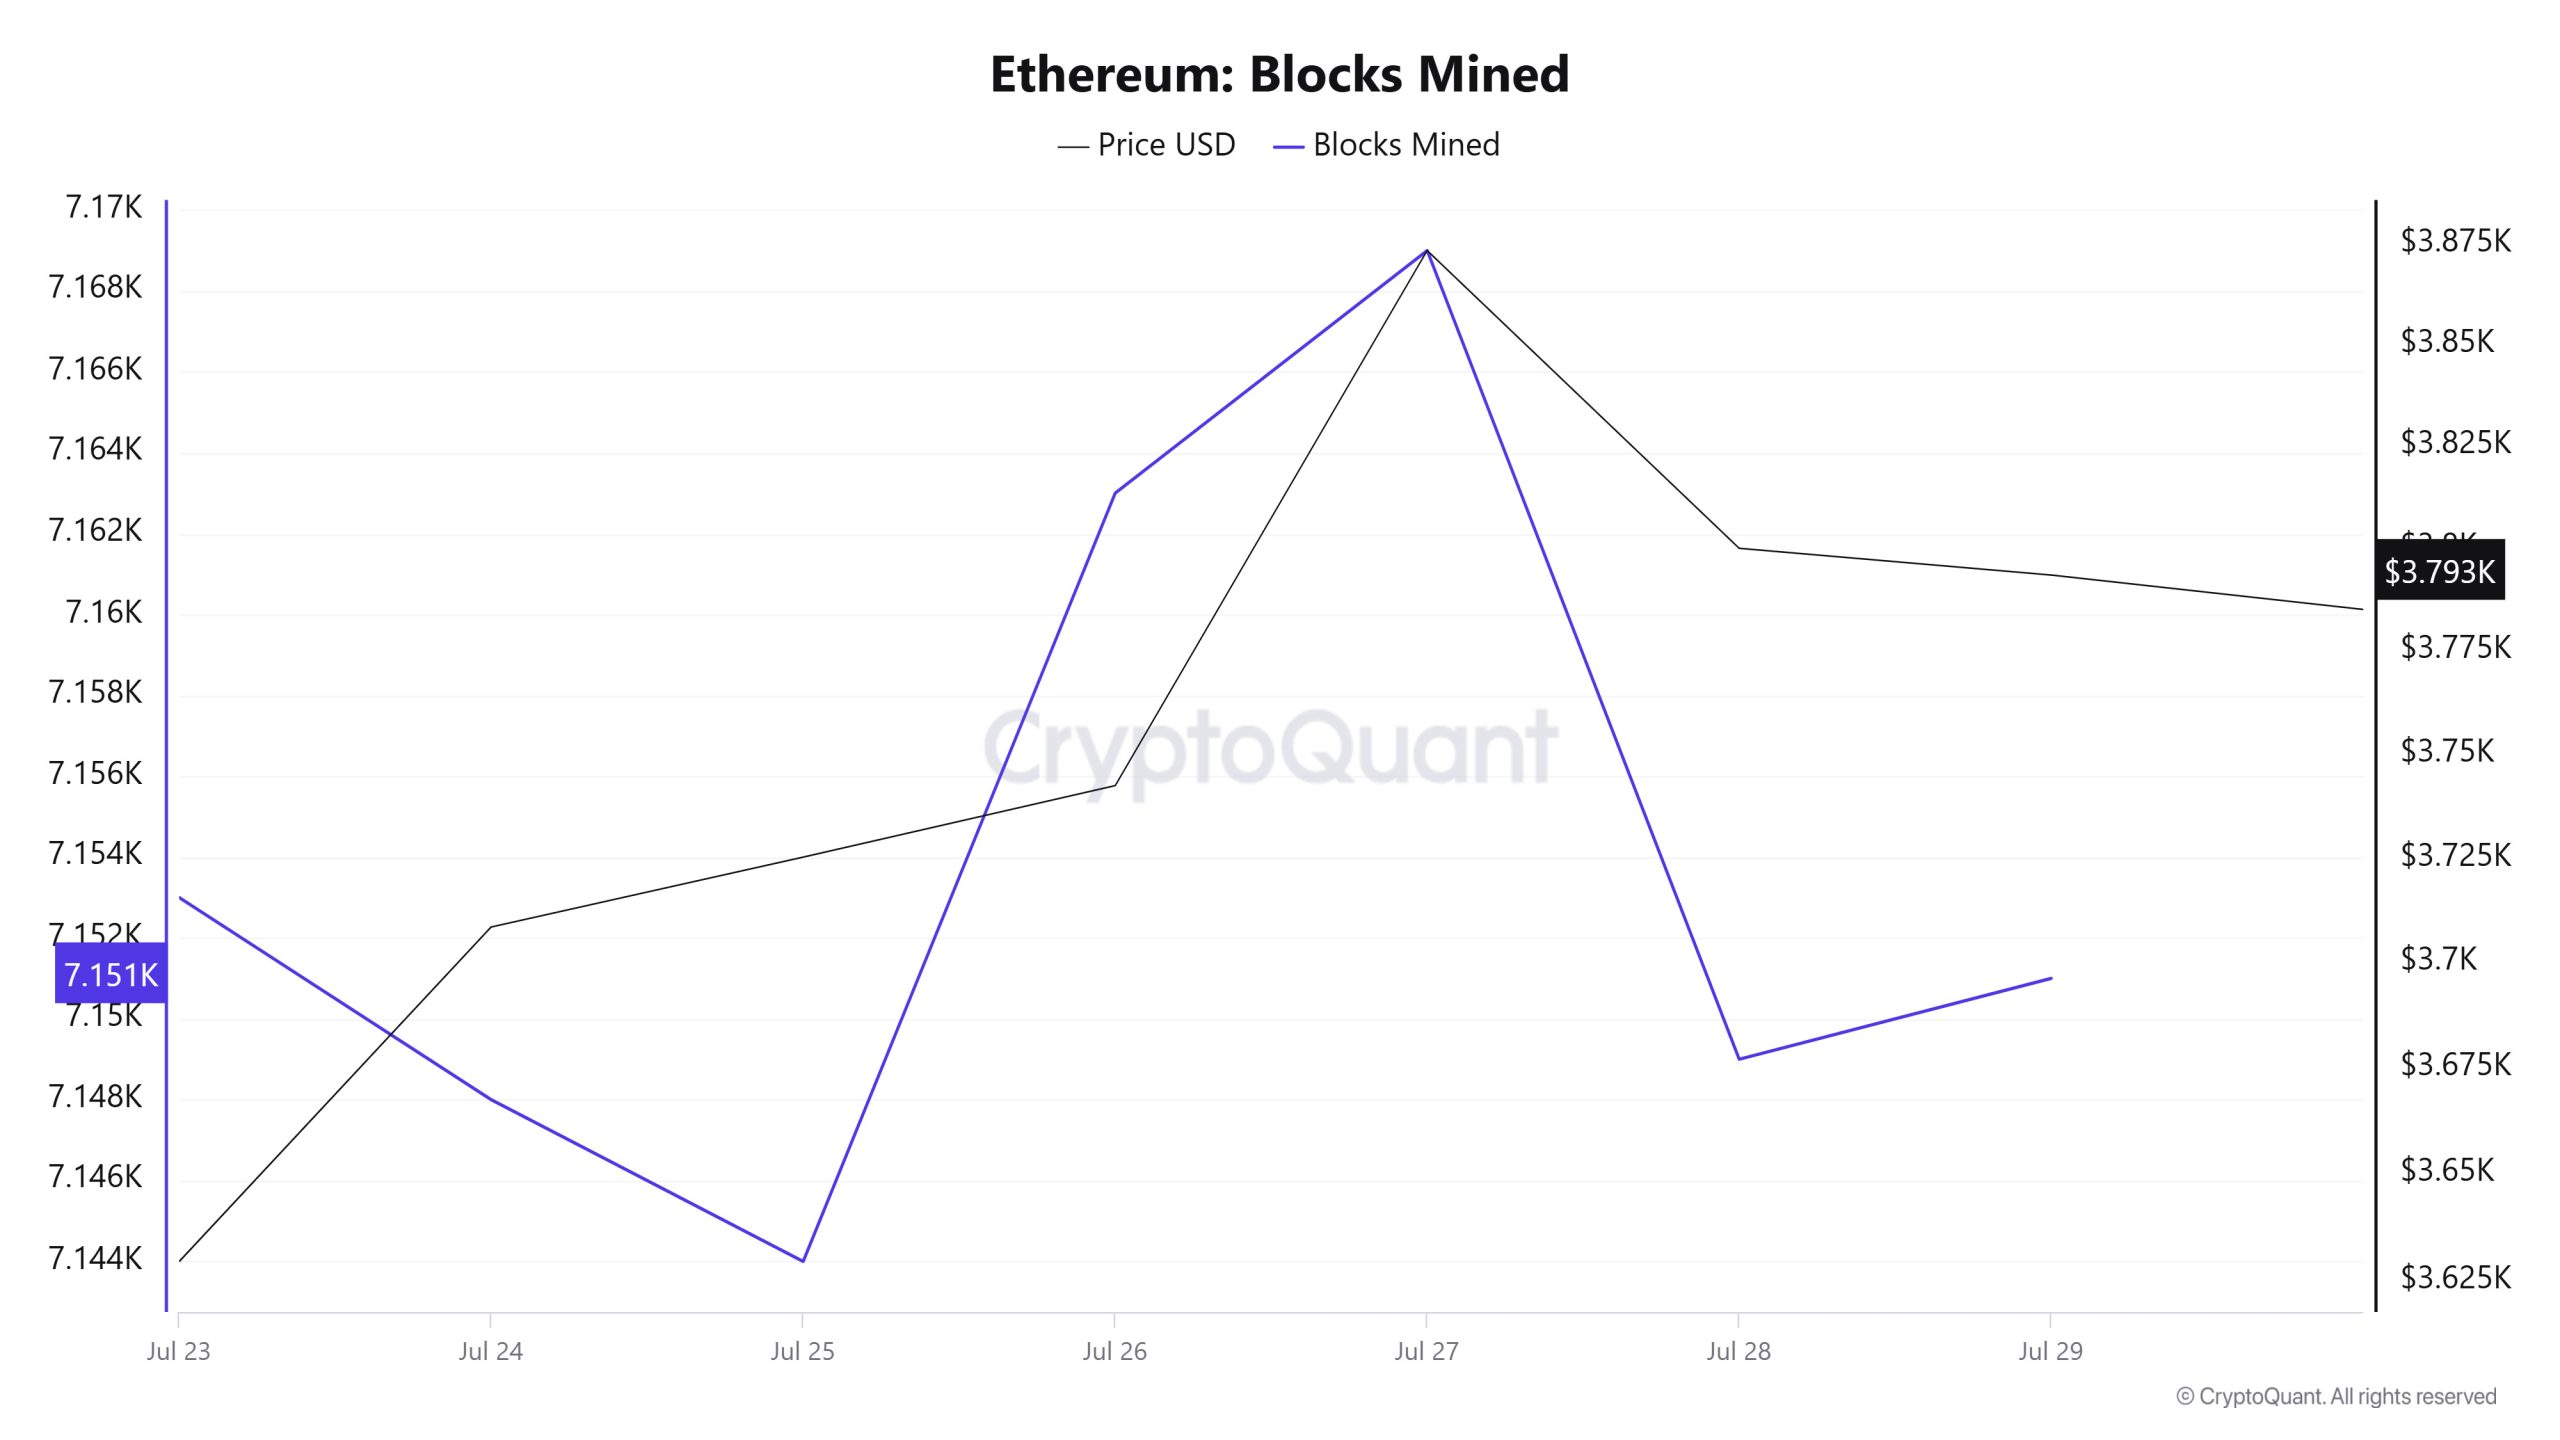
Between July 23 and July 29, Ethereum block production data showed a slight decrease throughout the week. While 7,153 blocks were produced on July 23, this number dropped to 7,151 as of July 29. This limited decline indicates that the network has maintained a general stability and there has been no significant change in block production. There was a positive correlation between the Ethereum price and the number of block production throughout the week.
Block Size
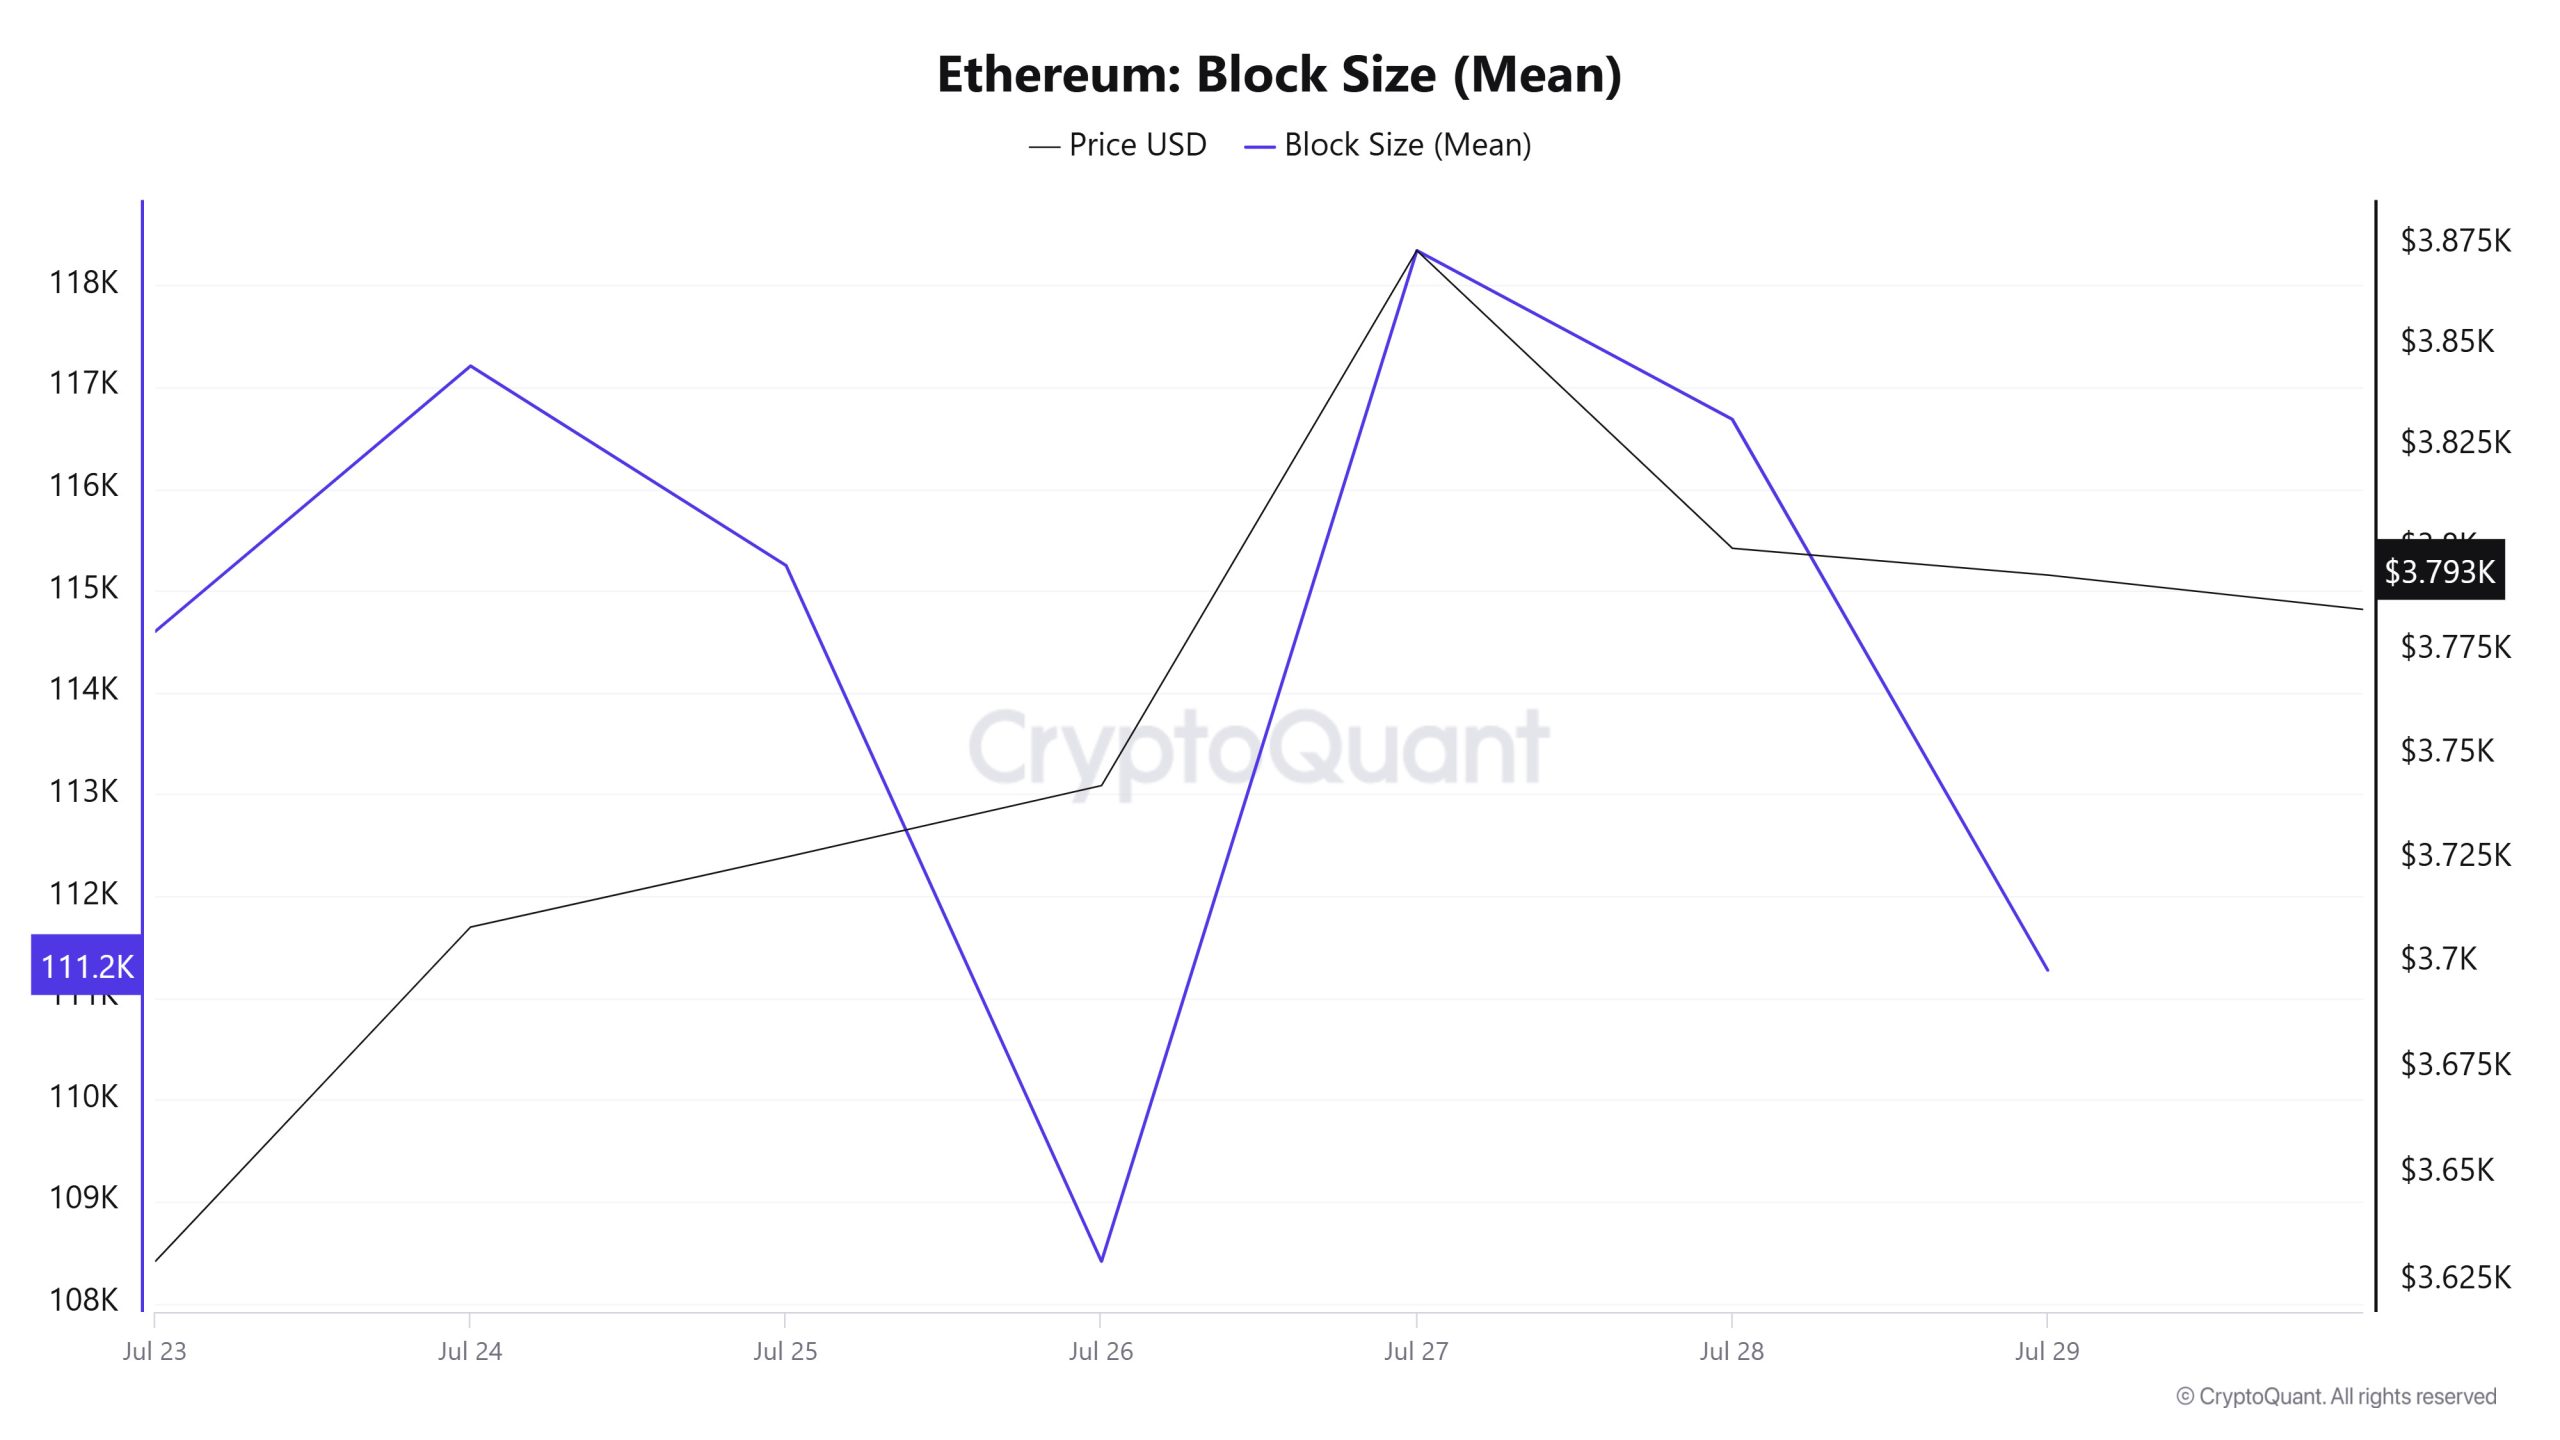
Between July 23 and July 29, Ethereum block size data showed a decline throughout the week. On July 23rd, the average block size was 114,600 bytes, while as of July 29th, this value decreased to 111,272 bytes. There was a positive correlation between block size and Ethereum price during the week.
Block Interval
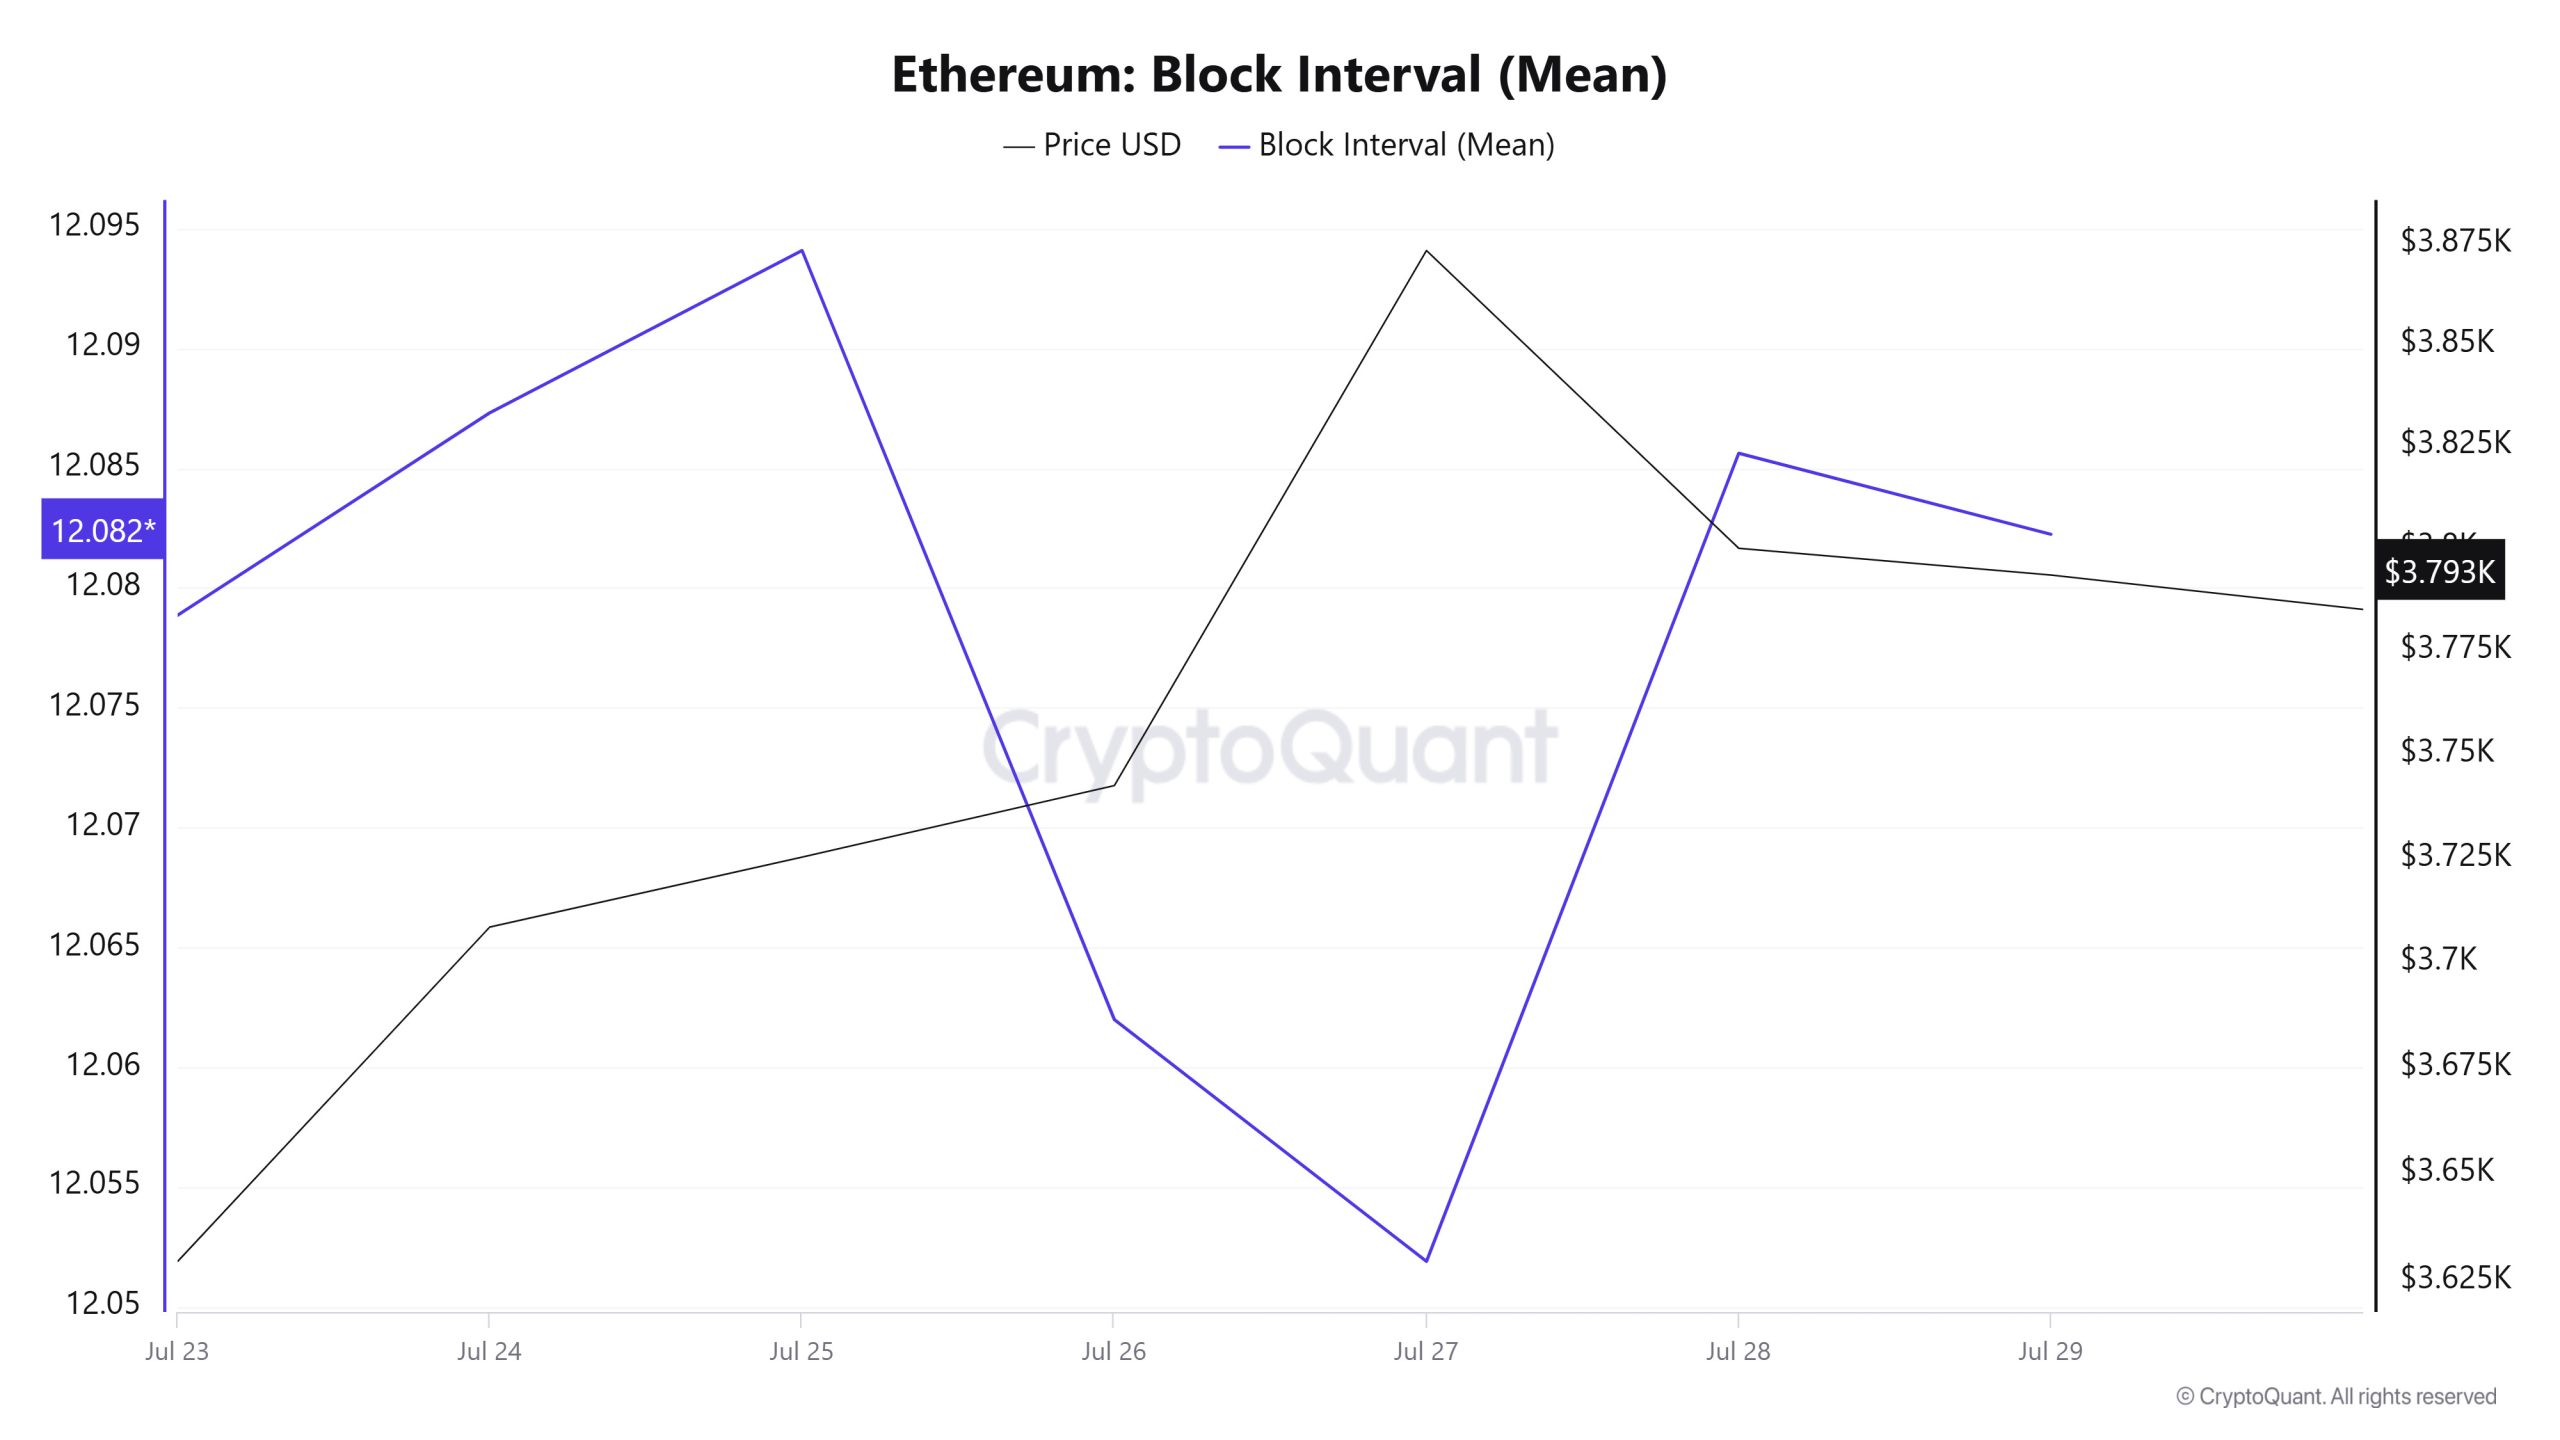
Between July 23 and July 29, Ethereum block data showed a slight increase throughout the week. On July 23, the average block duration was recorded as 12.07 seconds, while it increased to 12.08 seconds as of July 29. During the period in question, Ethereum block duration and price movement were negatively correlated throughout the week.
Transaction
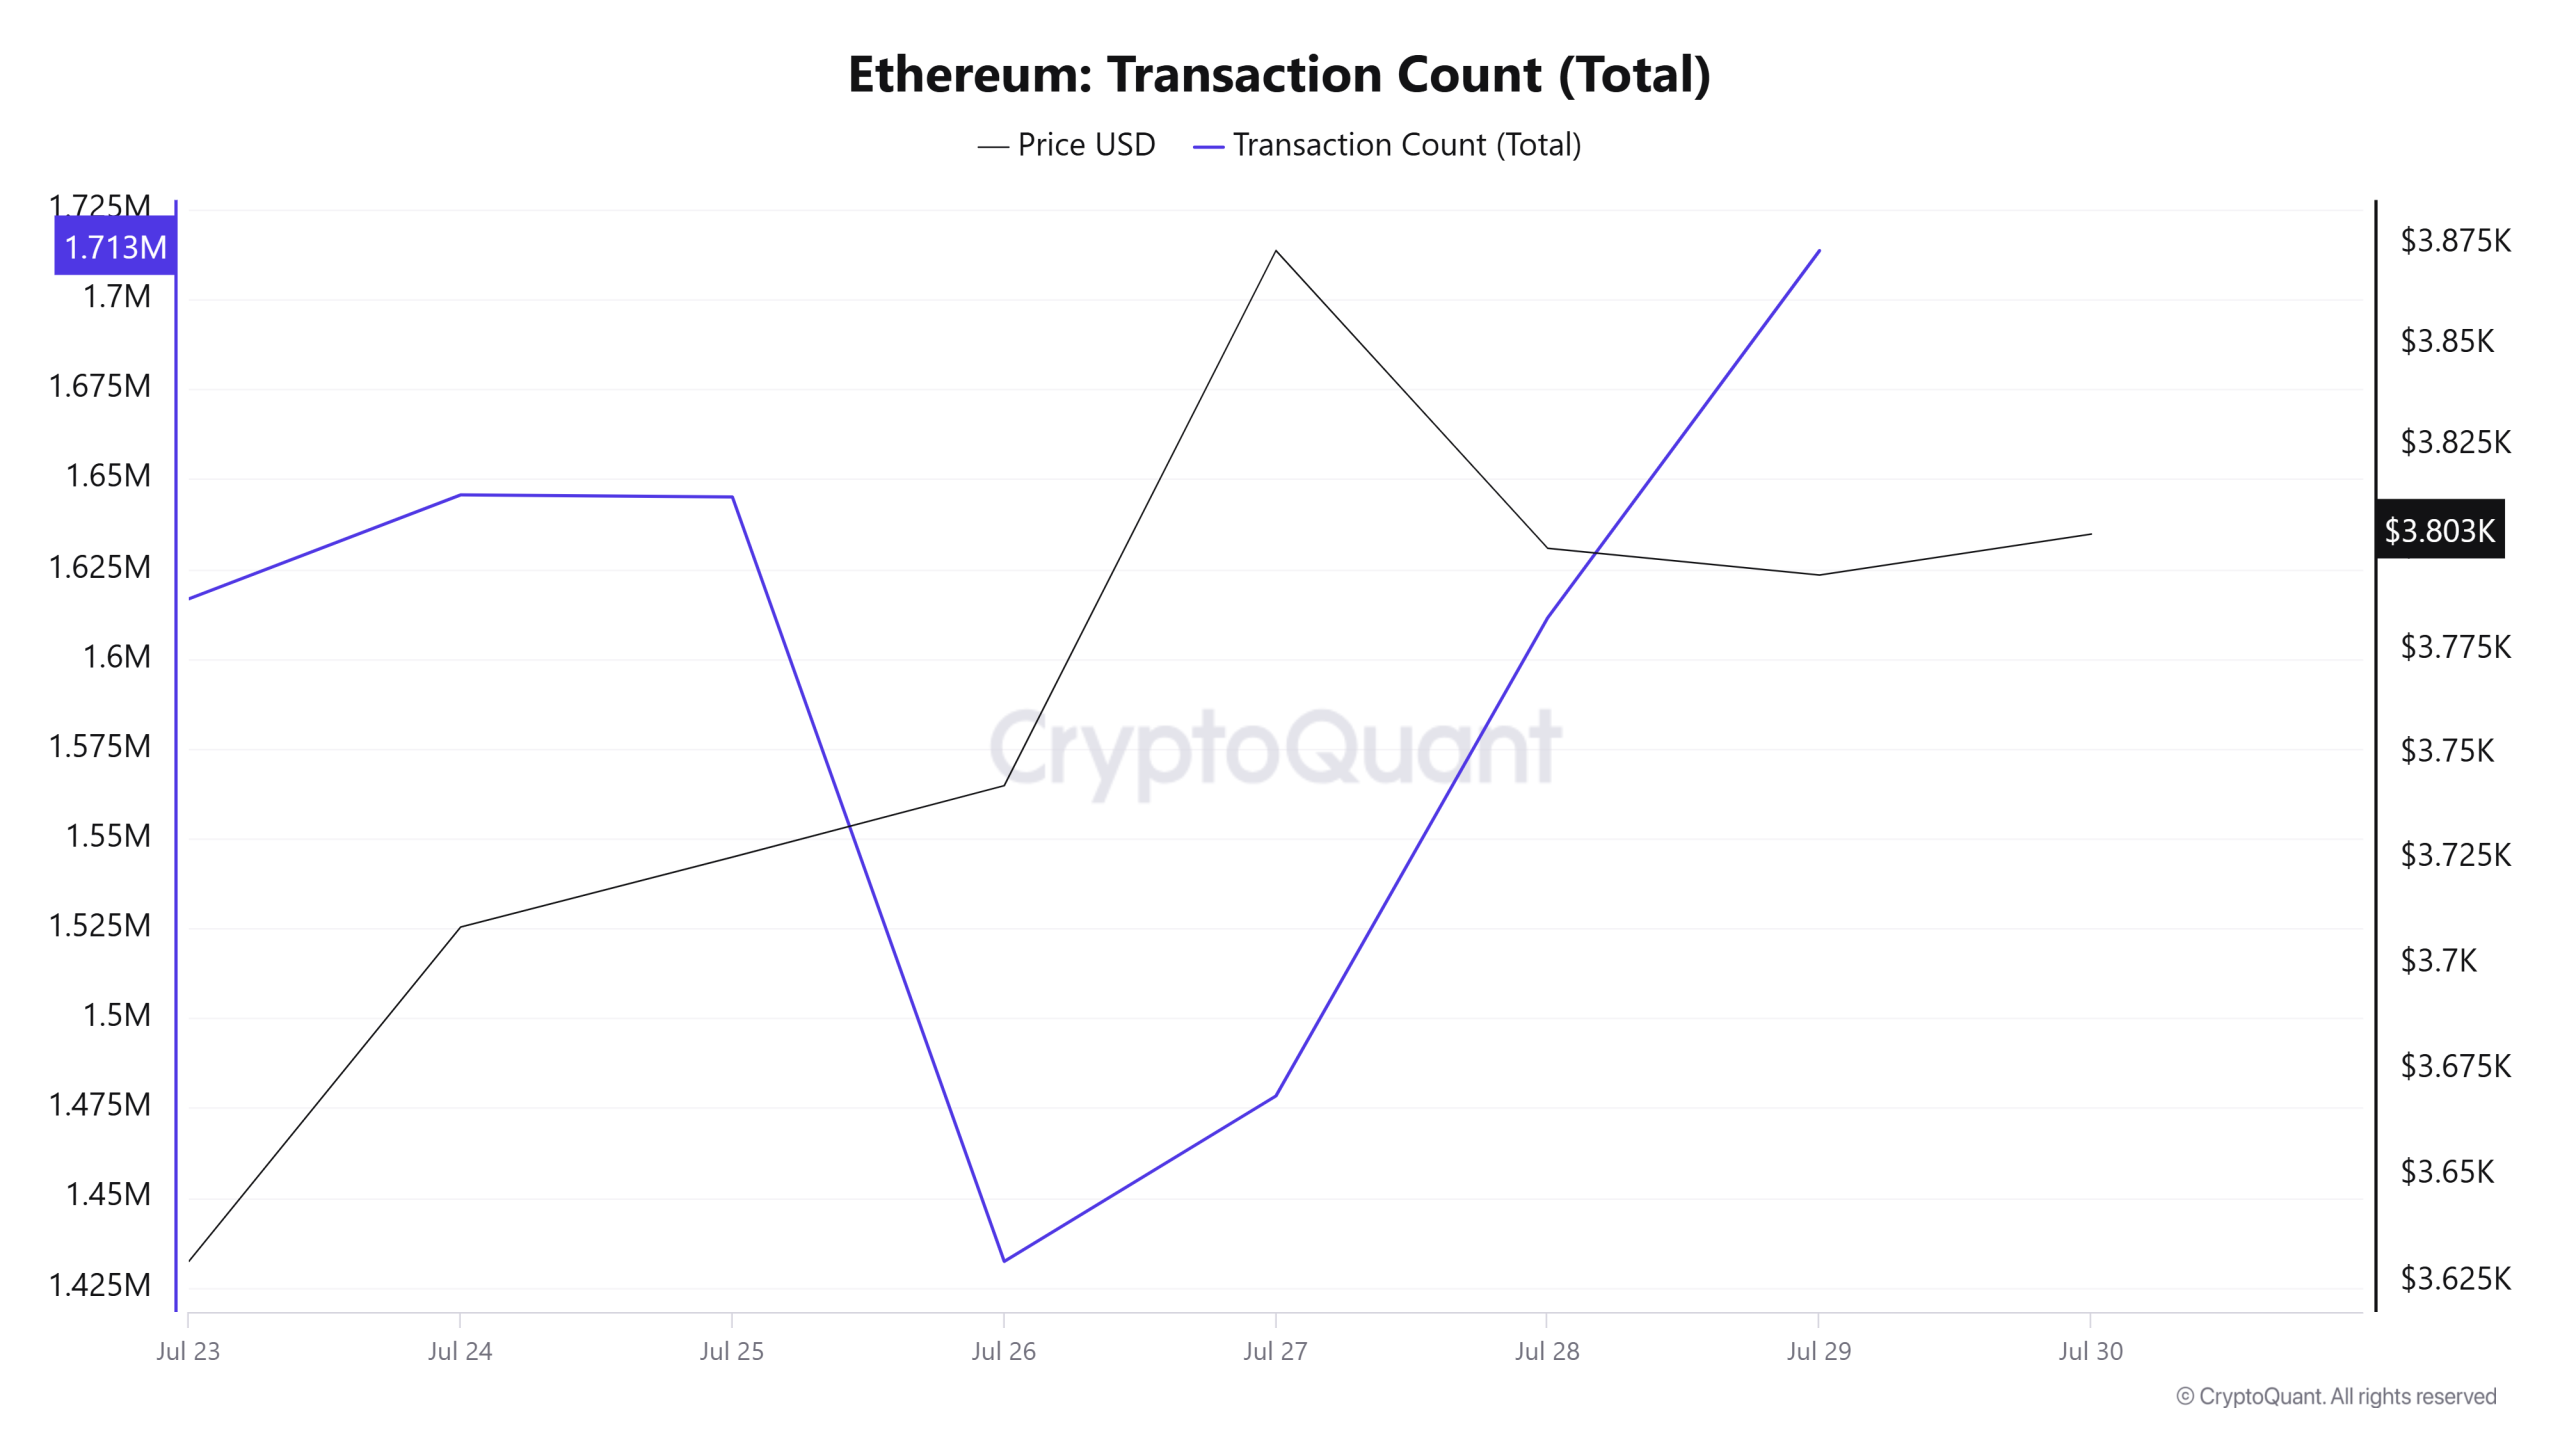
Last week, a total of 10,576,447 transactions were executed on the Ethereum network, while this week that number increased by about 5.36% to 11,143,025. The highest number of transactions on a weekly basis was 1,713,649 on July 29, while the lowest number of transactions was 1,432,233 on July 26.
This change in the number of transactions indicates that the usage on the network continues to increase and, accordingly, Ethereum burns have increased compared to last week. The correlation between the price and the number of transactions remained stable throughout the week.
Tokens Transferred
Last week, the total amount of ETH transferred on the Ethereum network was 22,354,842, while this week it decreased by 24.17% to 16,952,280. 3,466,579 ETH transfers on July 23rd was the highest daily token transfer amount of the week, while the lowest value of the week was recorded on July 26th with only 985,288 ETH transferred. Throughout the week, when the relationship between the price and the amount of tokens transferred was analyzed, a balanced correlation was observed.
The fact that the number of transfers in network usage has increased while the total amount of tokens transferred has decreased indicates that user activity on the Ethereum network has increased, but in volume terms, smaller users have come to the fore. This can be interpreted as Ethereum expanding its user base to smaller investors on DeFi, NFT and other Web3 applications. The decrease in liquidity movements on the network compared to last week suggests that users are executing lower volume transactions and that the vibrancy in the Ethereum ecosystem is spreading to the grassroots.
On the other hand, it should be noted that the amount of tokens transferred last week was well above the average weekly transfer amounts on the Ethereum network. Therefore, this week’s decline can be considered as a momentary and usual normalization.
Estimated Leverage Ratio
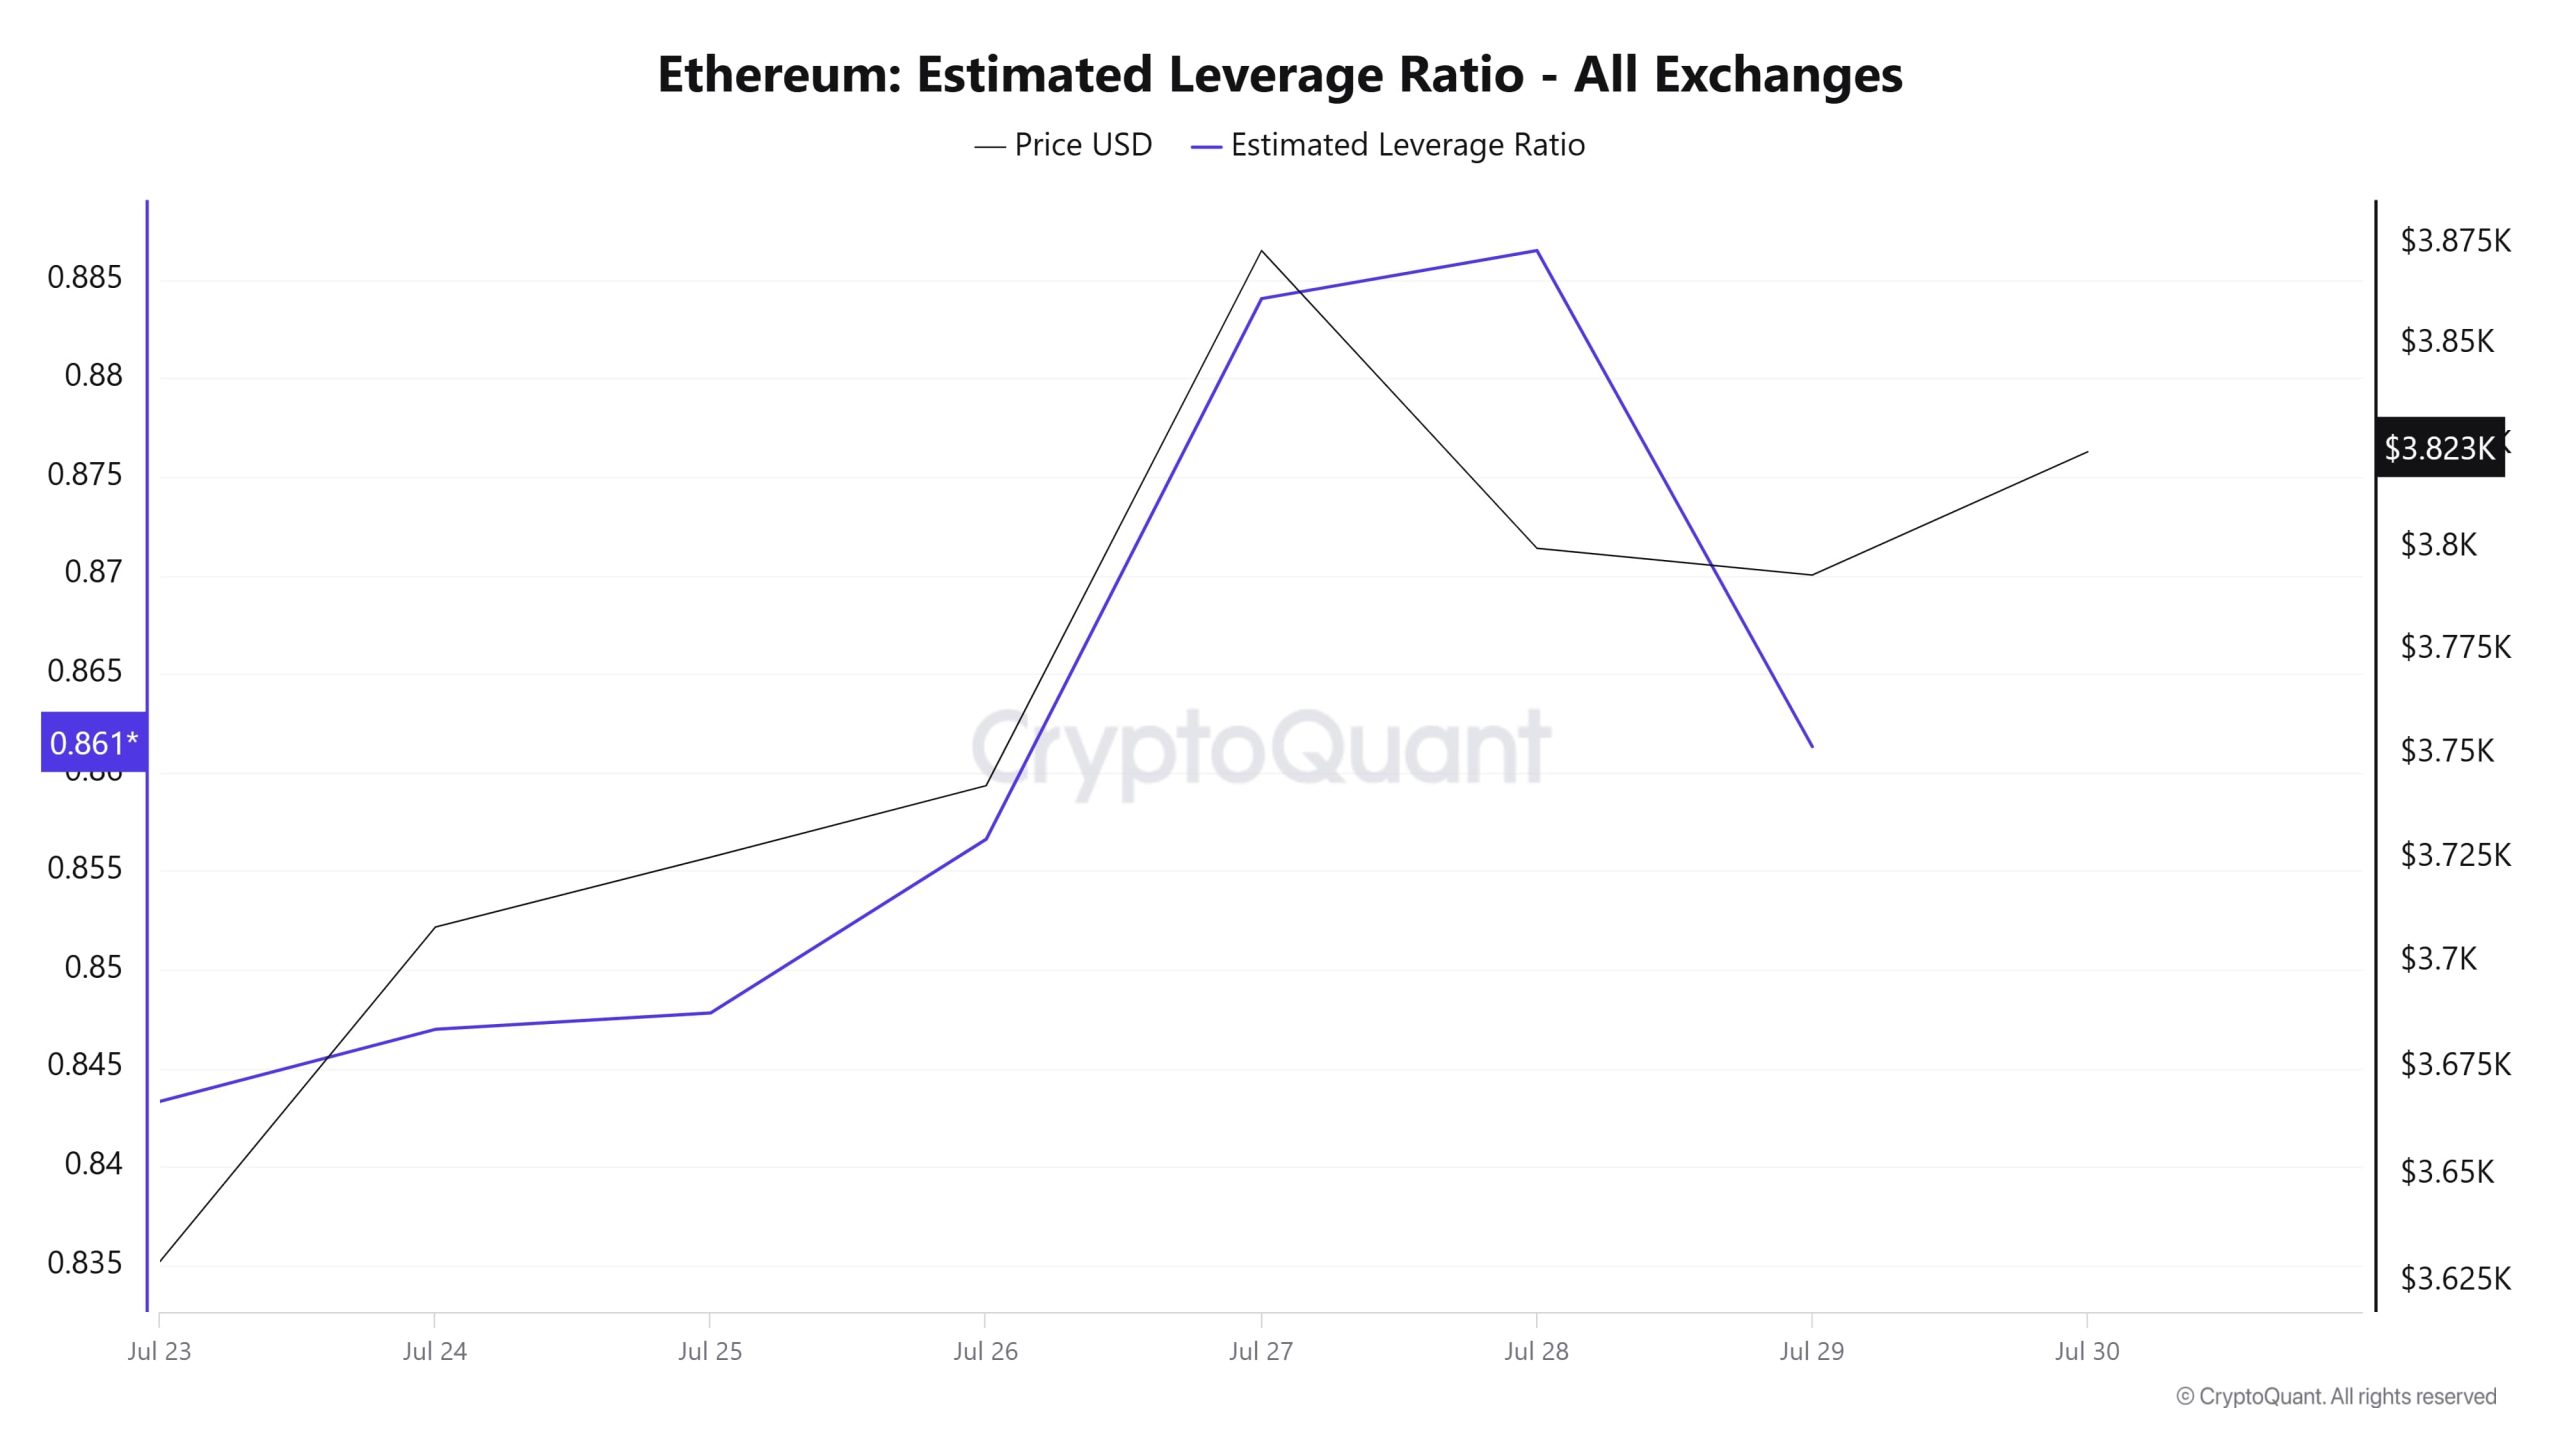
In the 7-day process, the metric generally rose at the first time of the process. ELR (Estimated Leverage Ratio), which had a value of 0.843 at the beginning of the process, also formed the lowest point of the process. It then rose steadily, reaching a peak of 0.886 on July 28. After this point, the metric declined, reaching 0.861 at the time of writing. A higher ELR means that participants are willing to take on more risk and usually indicates bullish conditions or expectations. It should be noted that these rallies can also be caused by dwindling reserves. When we look at Ethereum reserves, there were 19.55 million reserves at the beginning of the process, while this figure decreased during the rest of the process and is currently seen as 19.02 million. At the same time, Ethereum’s Open Interest is seen as 56.00 billion dollars at the beginning of the process. As of now, the volume did not change much in the process and the open interest value stood out as 55.64 billion dollars. With all this data, the ELR metric retreated towards the end of the process . The price of the asset, with all this data, reached its highest point on July 28, reaching $3,940. The lowest point was $3,500 on July 24. As of now, there is a decrease in the increase in the risk appetite of investors and traders. This was reflected in the price, causing the price to drop to $3,807 as of now. Throughout the process, the rise in the ELR rate did not have an impact on the open interest. This explains the rise due to the decrease in reserves. As a result, as a result of the decrease in reserves and the open interest rate remaining constant, the market has lost its appetite at the moment and shows a bearish approach.
ETH Onchain Overall
| Metric | Positive 📈 | Negative 📉 | Neutral ➖ |
|---|---|---|---|
| Active Addresses | ✓ | ||
| Total Value Staked | ✓ | ||
| Derivatives | ✓ | ||
| Supply Distribution | ✓ | ||
| Exchange Supply Ratio | ✓ | ||
| Fees and Revenues | ✓ | ||
| Bloks Mined | ✓ | ||
| Transaction | ✓ | ||
| Estimated Leverage Ratio | ✓ |
*The metrics and guidance in the table do not, by themselves, describe or imply an expectation of future price changes for any asset. The prices of digital assets may vary depending on many different variables. The onchain analysis and related guidance are intended to assist investors in their decision-making process, and making financial investments based solely on the results of this analysis may result in harmful transactions. Even if all metrics produce a positive, negative or neutral result at the same time, the expected results may not be seen according to market conditions. Investors reviewing the report would be well advised to heed these caveats.
Legal Notice
The investment information, comments and recommendations contained in this document do not constitute investment advisory services. Investment advisory services are provided by authorized institutions on a personal basis, taking into account the risk and return preferences of individuals. The comments and recommendations contained in this document are of a general type. These recommendations may not be suitable for your financial situation and risk and return preferences. Therefore, making an investment decision based solely on the information contained in this document may not result in results that are in line with your expectations.
NOTE: All data used in Ethereum onchain analysis is based on Cryptoqaunt.