
Active Addresses
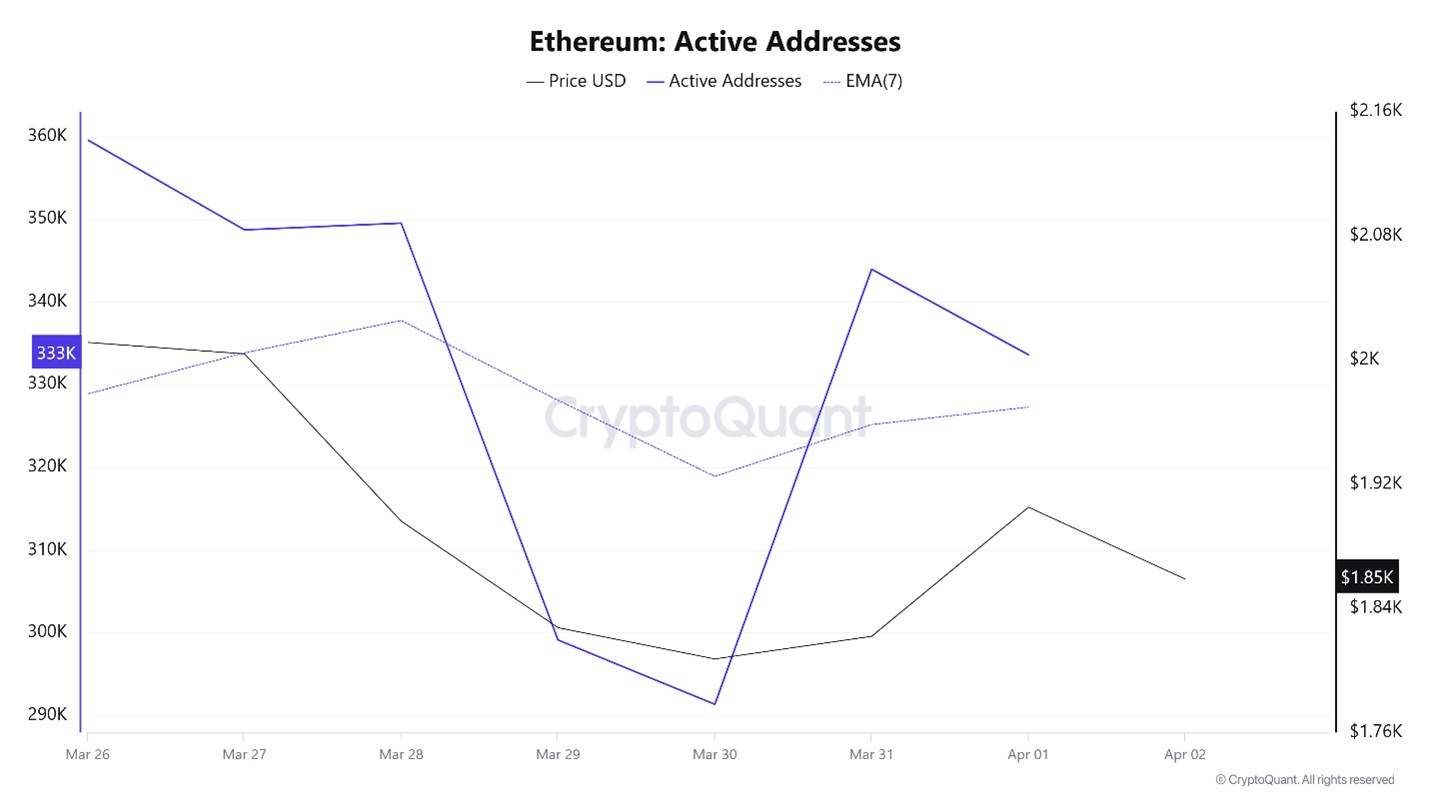
In the number of active addresses, there were 291,336 active entries to the ETH network between March 26 and April 2, 2025, this week. Ethereum fell to $1,807 during this period. The chart shows that Ethereum purchases are gradually decreasing in the area where the price and the number of active addresses intersect. When we follow the 7-day simple moving average, it is observed that the price follows a downward trend on the dates when this average cut the price. This situation indicates that the Ethereum price is experiencing inflows at $1,827 levels.
Active Sending Addresses
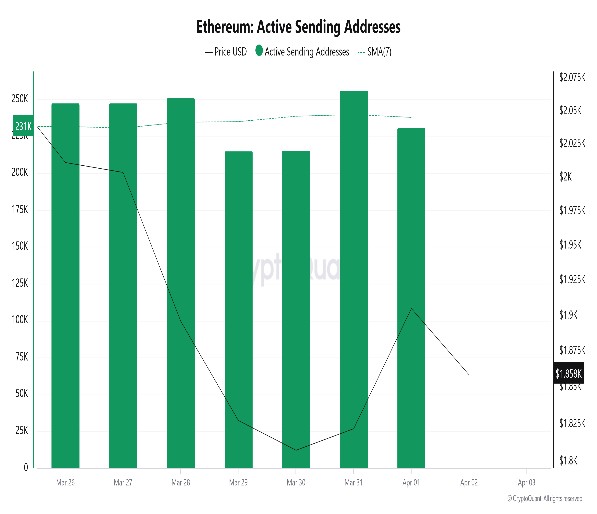
Along with the Black Line (price line) in active shipping addresses, there was a significant drop in active shipping addresses on March 30. On the day when the price hit its lowest point, active shipping addresses dropped to 215,784, indicating that buyers sold their positions as Ethereum remained at 1,807 for a while. As a result, it is seen that price drops cause an acceleration in sending addresses.
Active Receiving Addresses
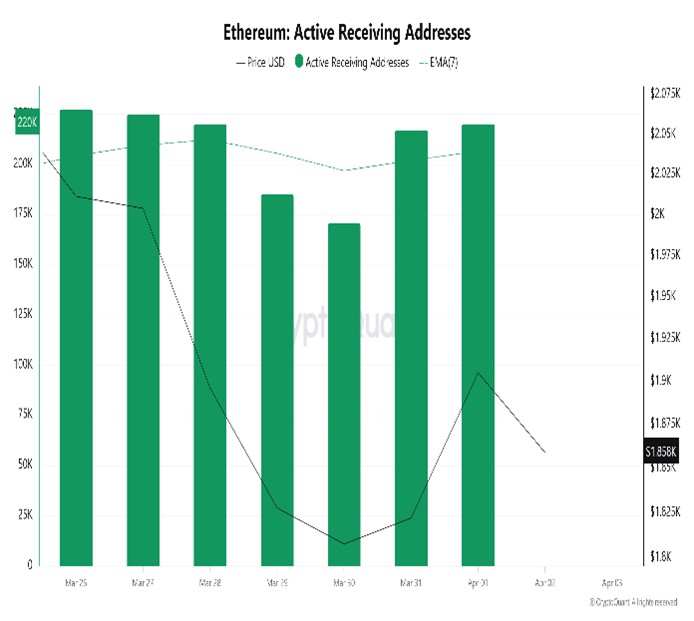
Along with the Black Line (price line) in active sending addresses, there has been a significant drop in active buying addresses after March 30. On the day of the price low, active shipping addresses rose as high as 170,905, indicating that buyers took their positions at Ethereum’s $1,807 level.
Total Value Staked
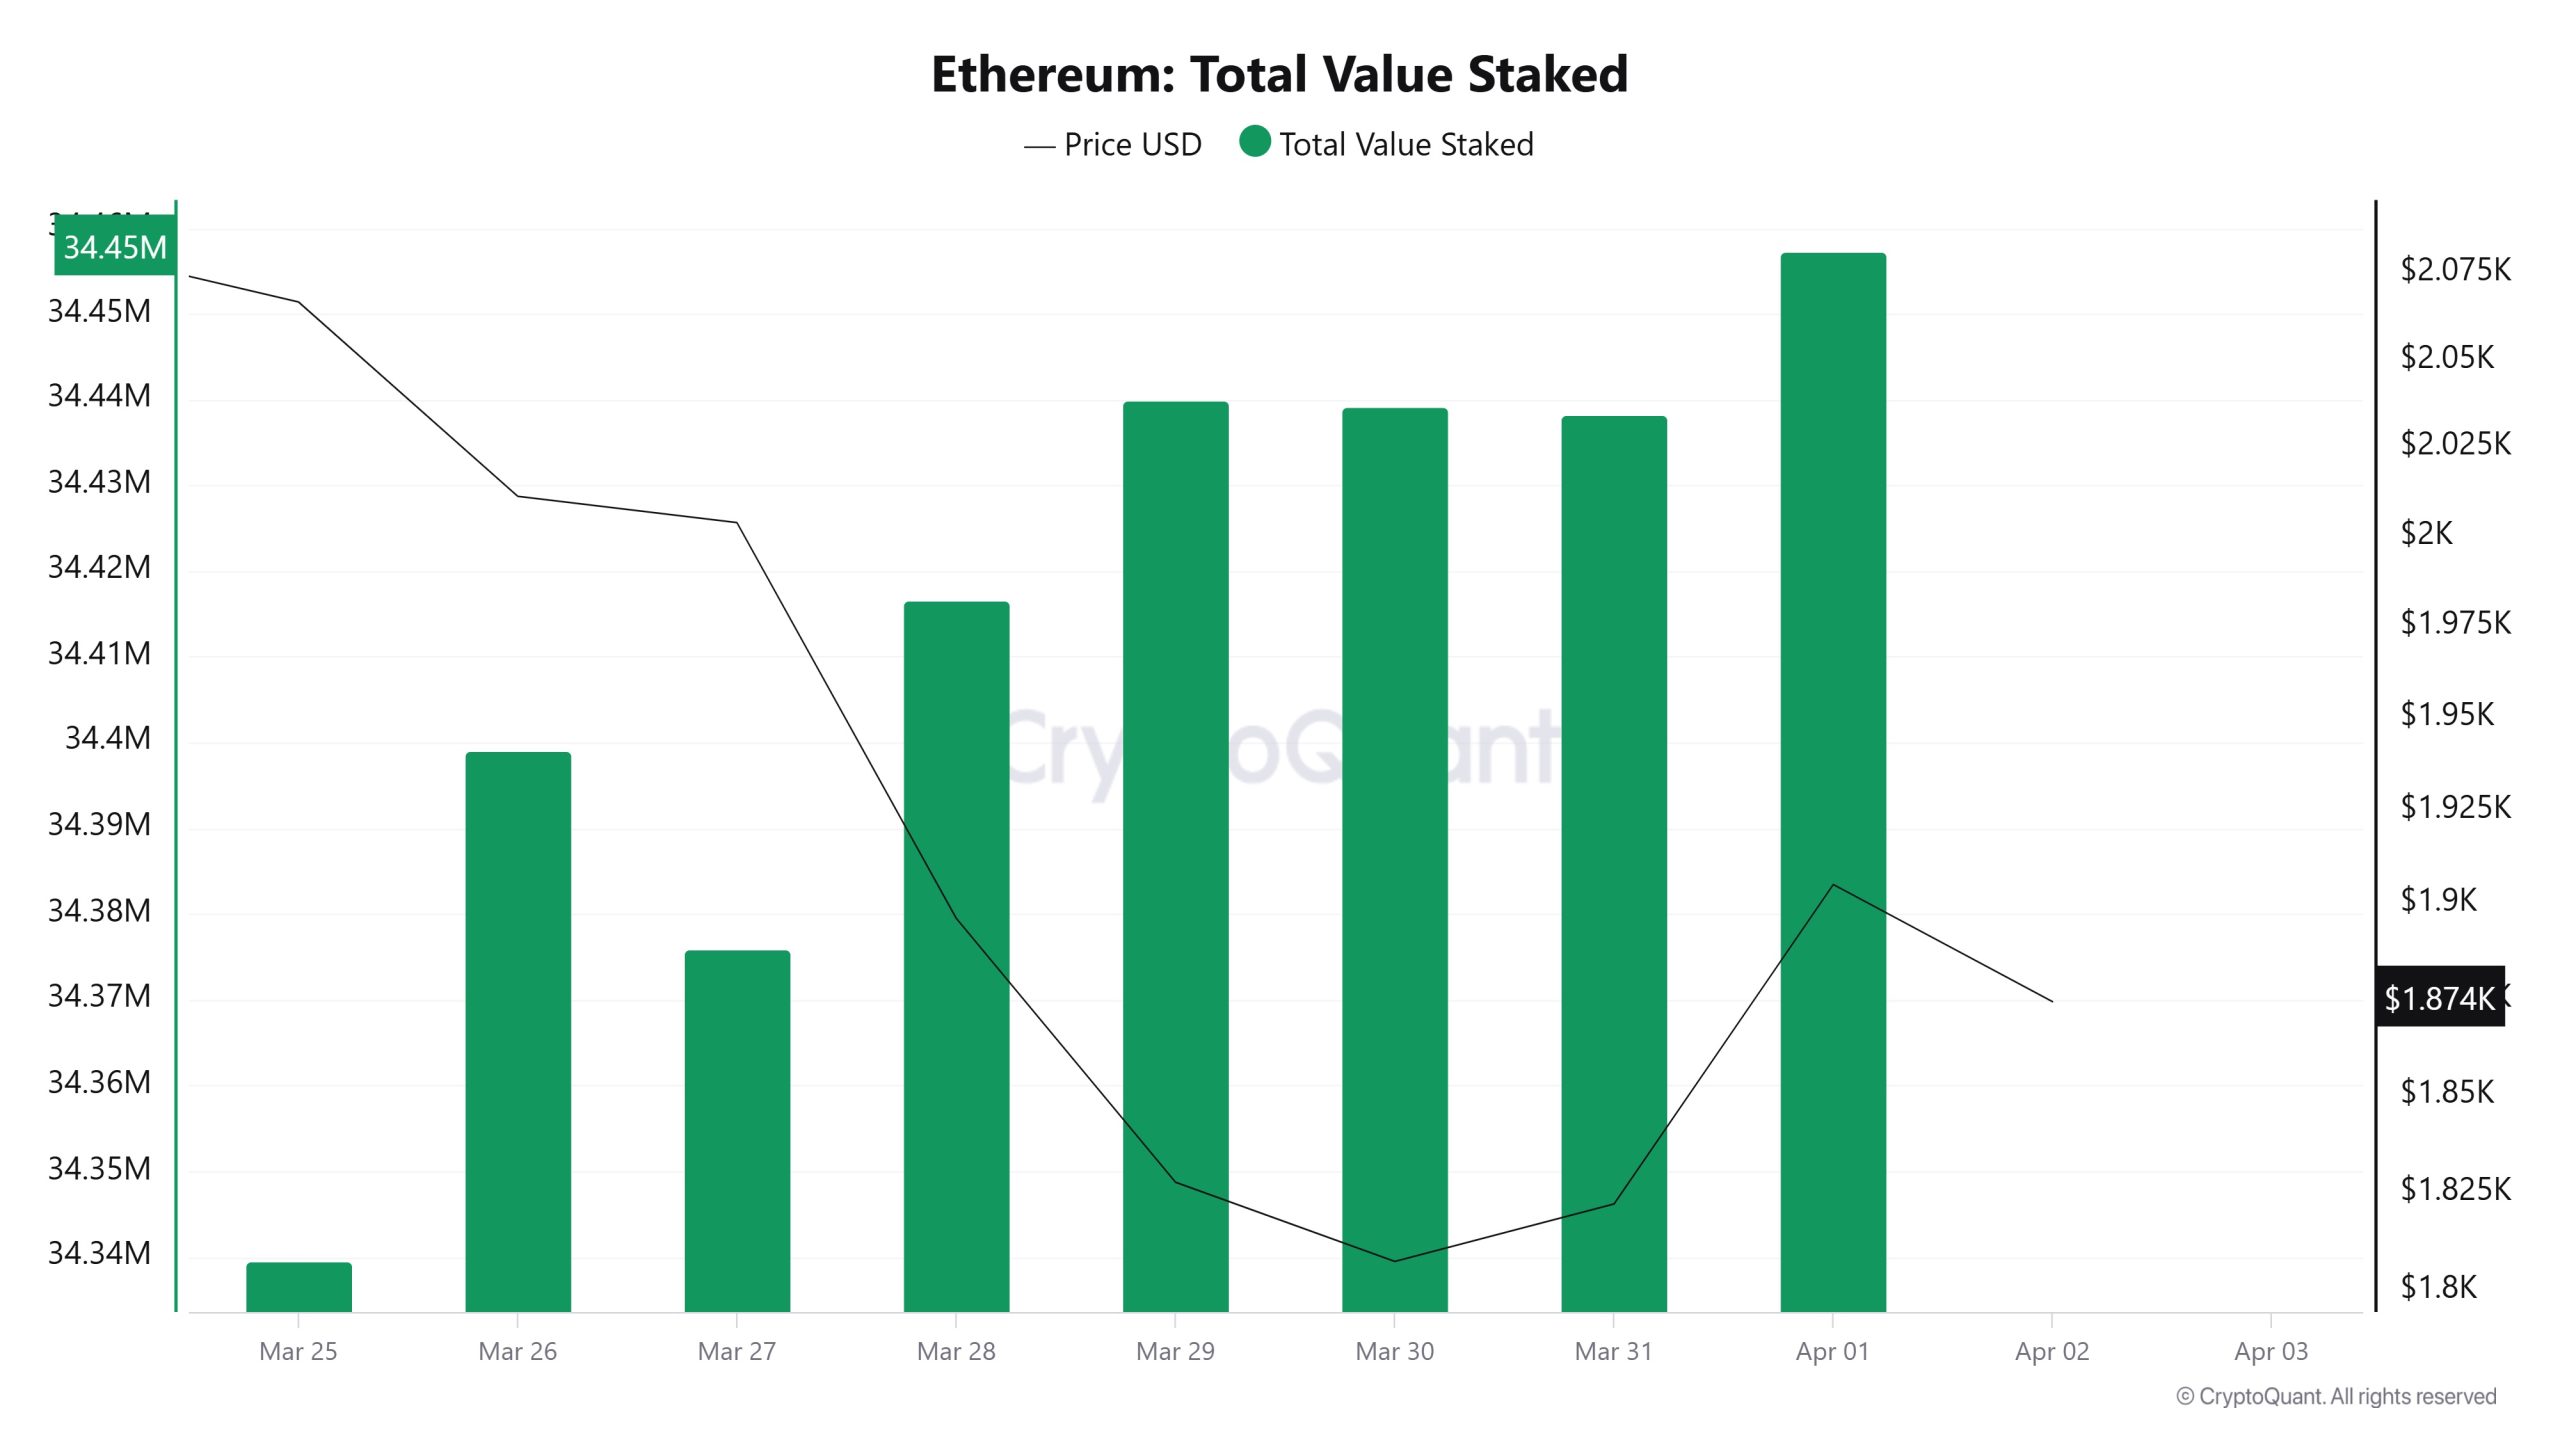
On March 26th, ETH price was 2,011 while Total Value Staked was 34,398,966. As of April 1, ETH price decreased to 1,905 while Total Value Staked Ratio increased to 34,457,413. Compared to last week, ETH price decreased by 5.27% while Total Value Staked Ratio increased by 0.17%.
Staking Inflows
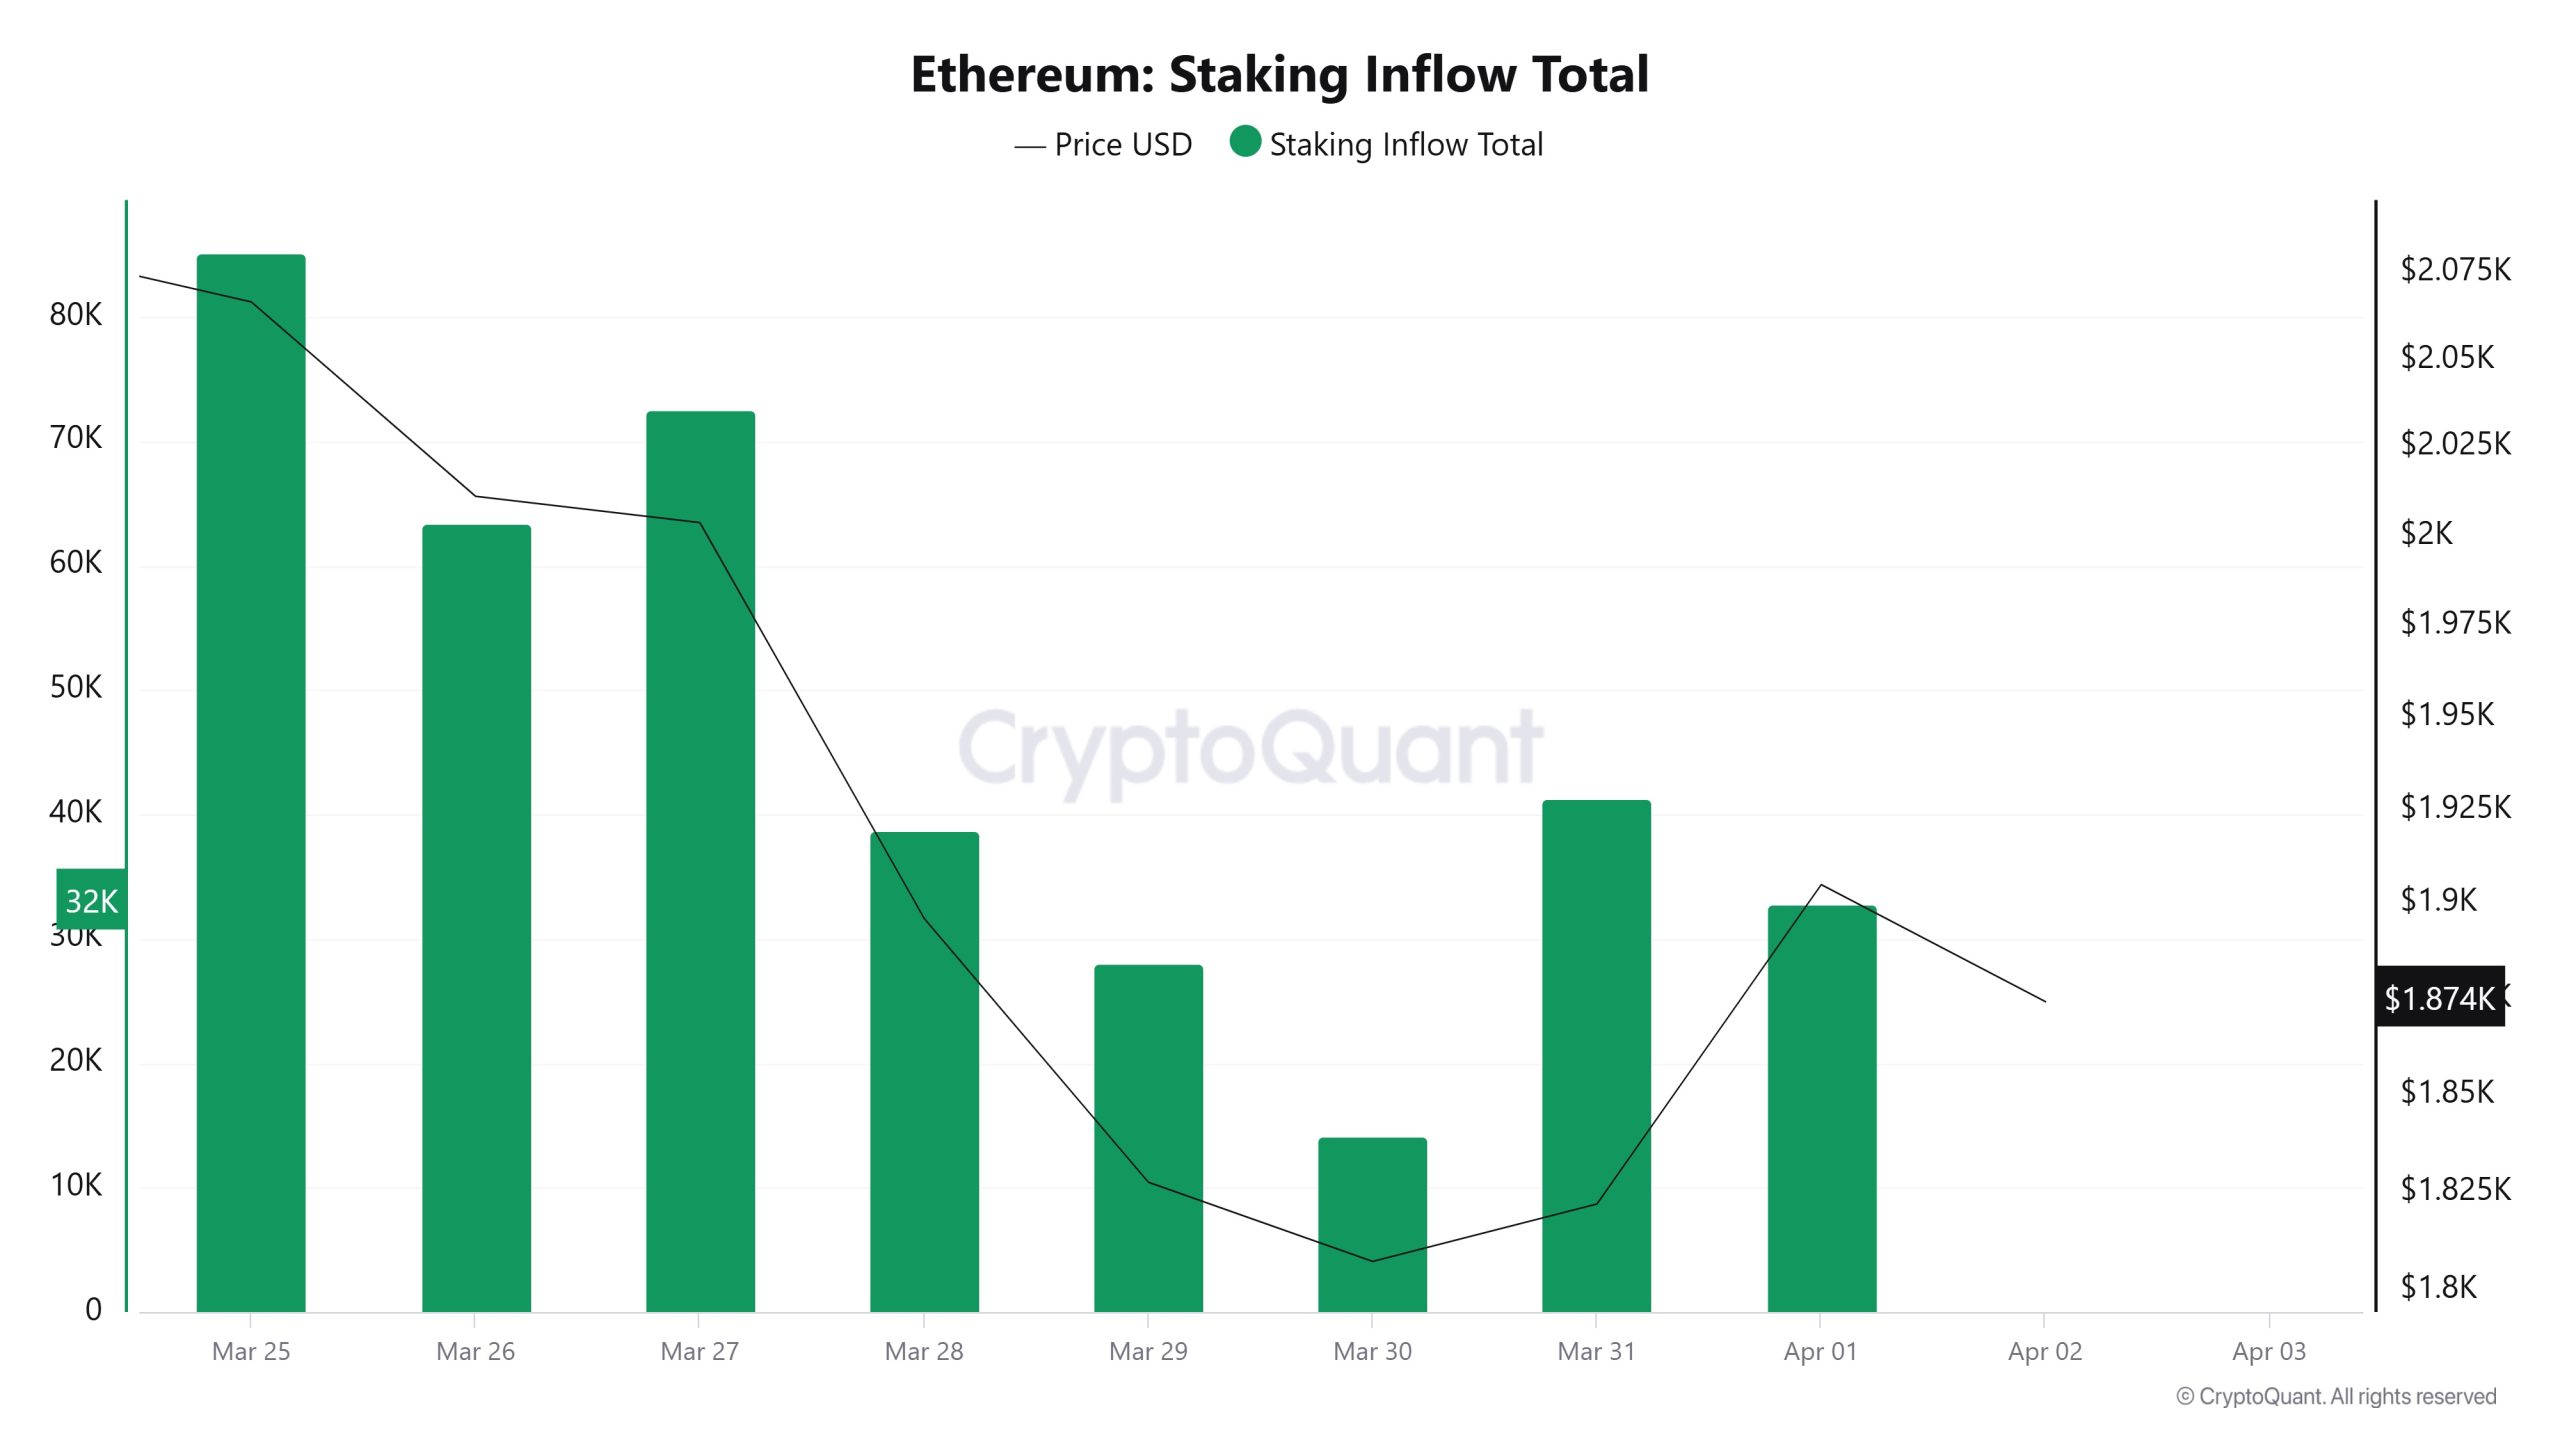
On March 26, the ETH price was at 2,011, while the Staking Inflow Ratio was 63,442. As of April 1, the ETH price decreased to 1,905, while the Staking Inflow Ratio decreased to 32,753. Compared to last week, there was a 5.27% decrease in ETH price and a 48.37% decrease in Staking Inflow Ratio.
Derivatives
Open Interest
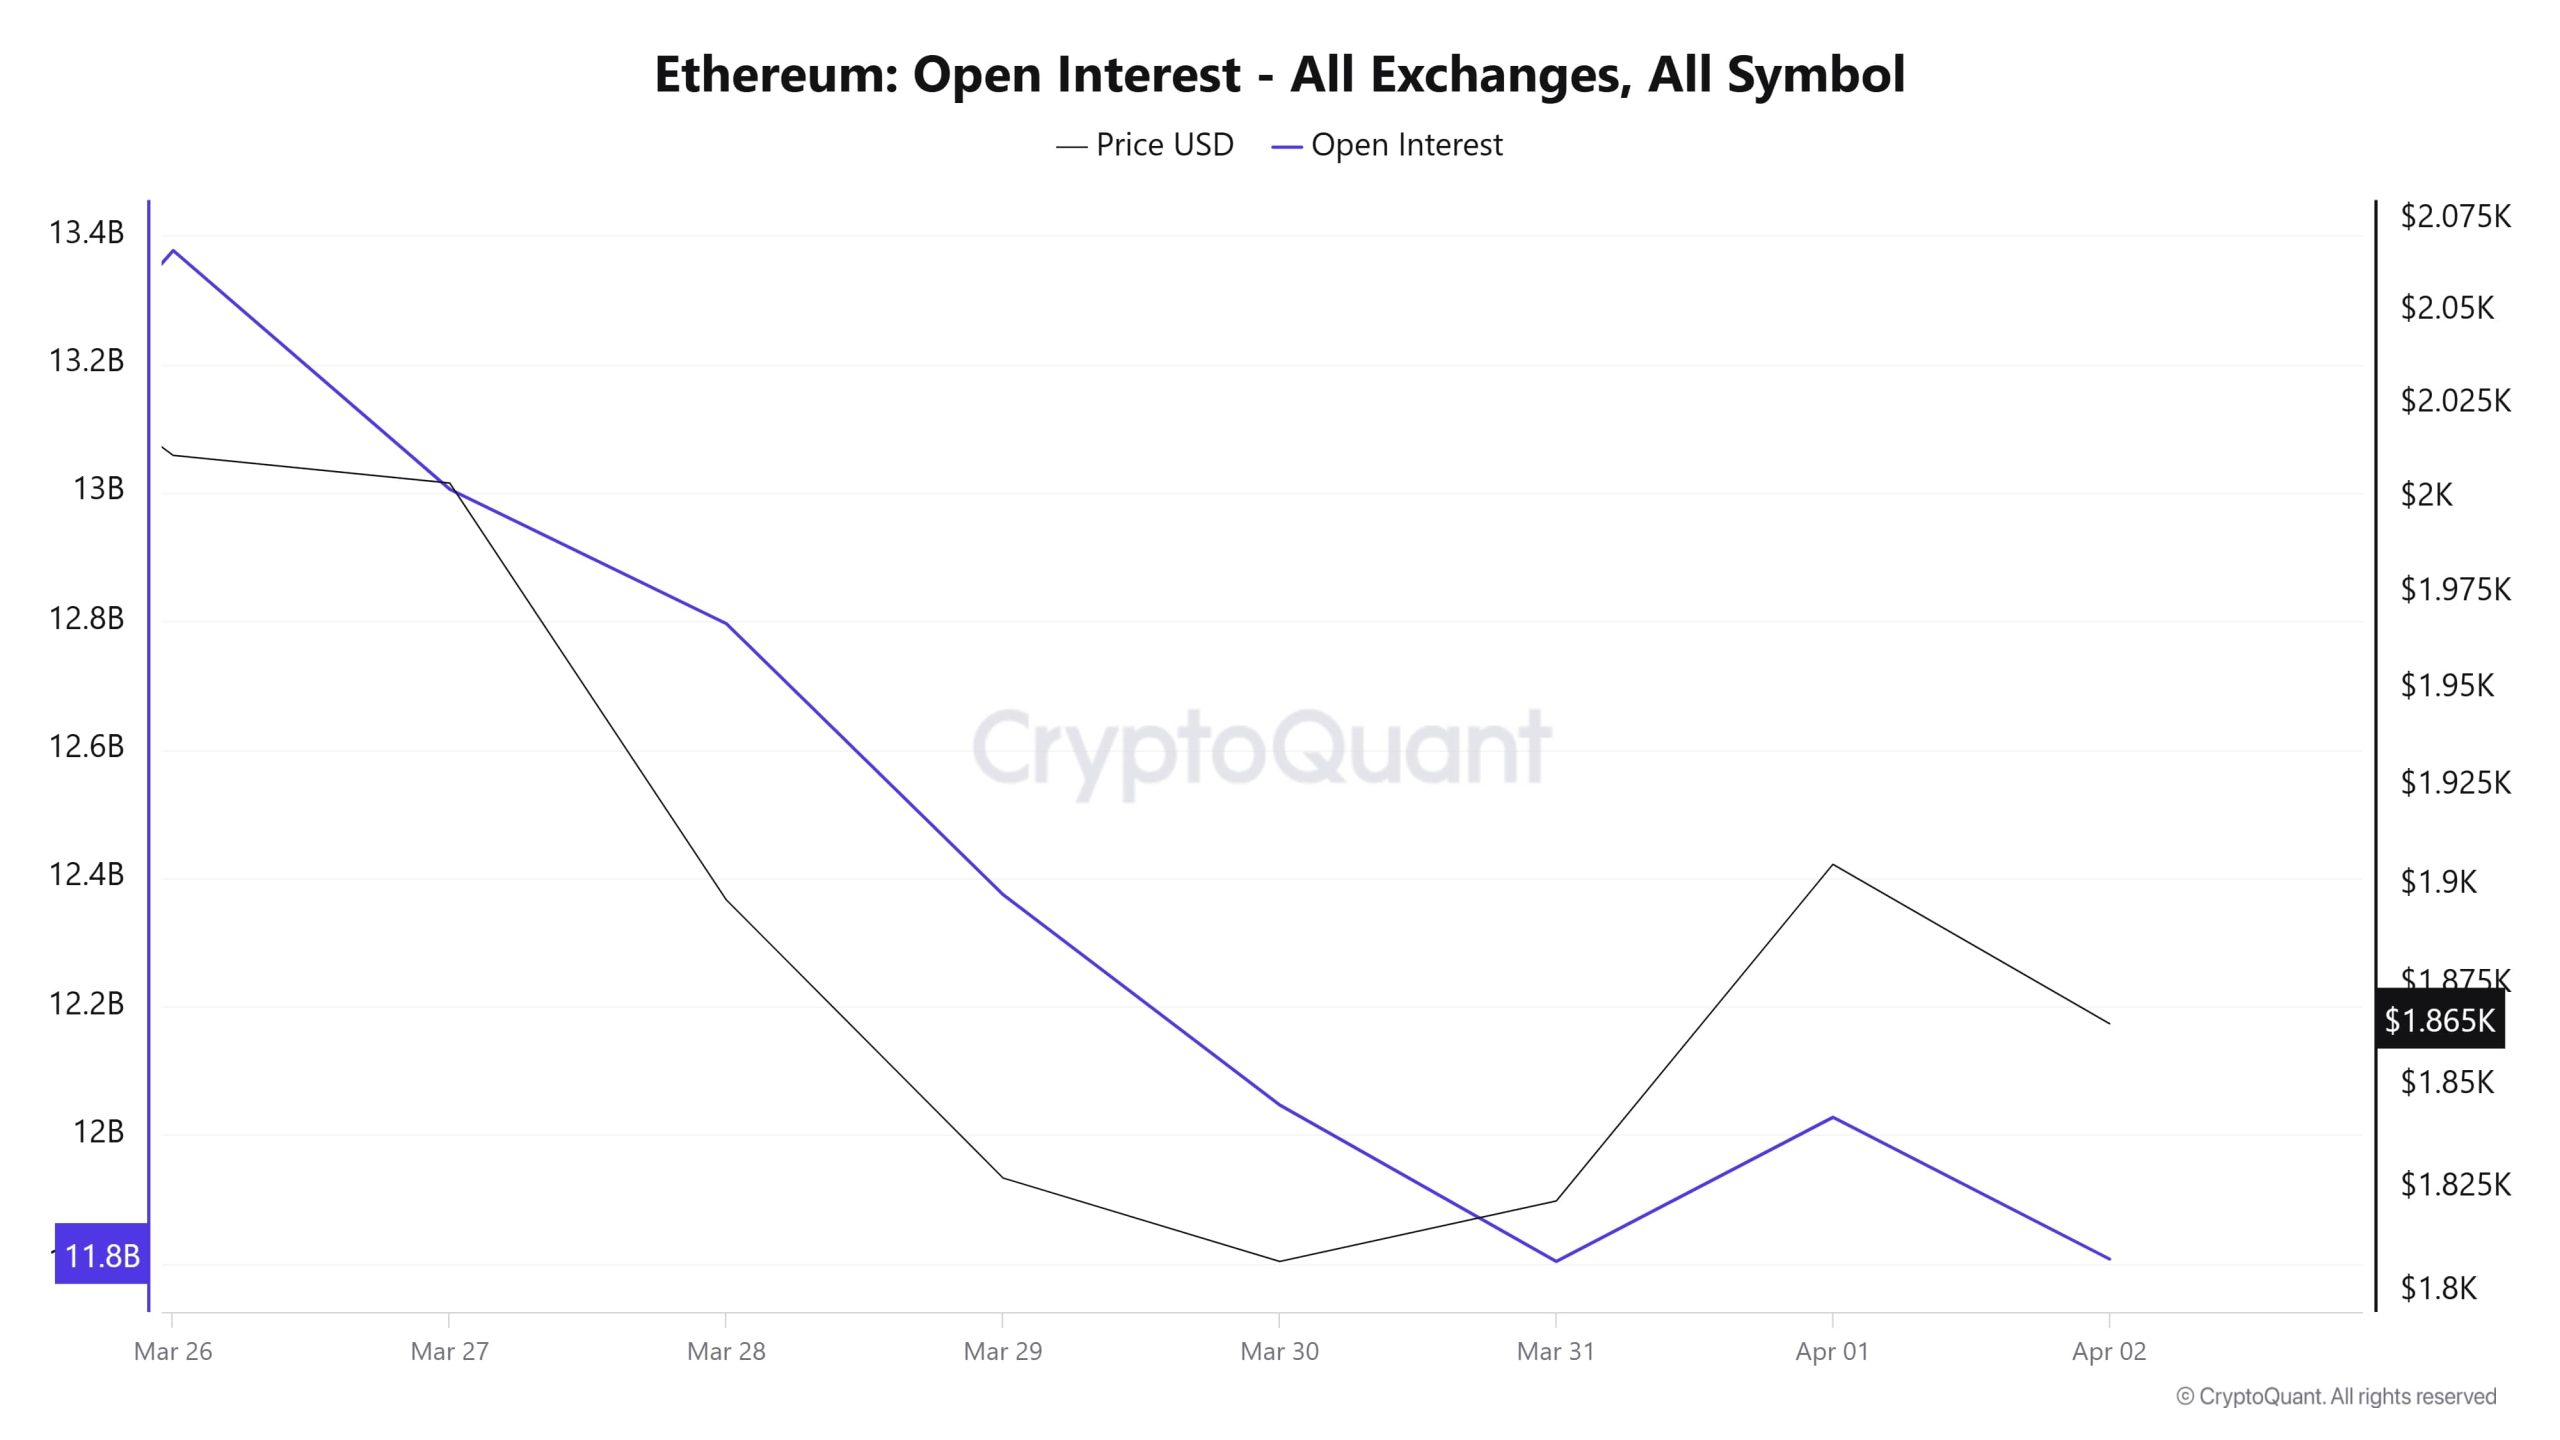
From March 26 onwards, open interest and price were at high levels, while after March 27 both data entered a downtrend. The decline in open interest suggests that long positions were closed, or traders were risk averse. The decline in the price over the same period suggests that selling pressure in the market increased and liquidations in leveraged trades may have taken place. On March 30 and 31, open interest reached its lowest levels, and the price continued to fall in the same direction. However, at this point, both price and open interest formed a floor and turned upwards. The fact that open interest started to rise again shows that new positions are entering the market and investor interest is increasing. On April 1, as the price rose, so did open interest, indicating that the market was again turning towards risk-taking. As of April 2, open interest has retreated slightly. The price followed a similar pattern and started to decline. This suggests that the market is short-term profit realization, or some long positions have been closed. In general, open interest is in line with price movements, indicating a healthy market structure. However, sharp fluctuations in open interest may indicate high leverage and potential liquidation risks.
Funding Rate
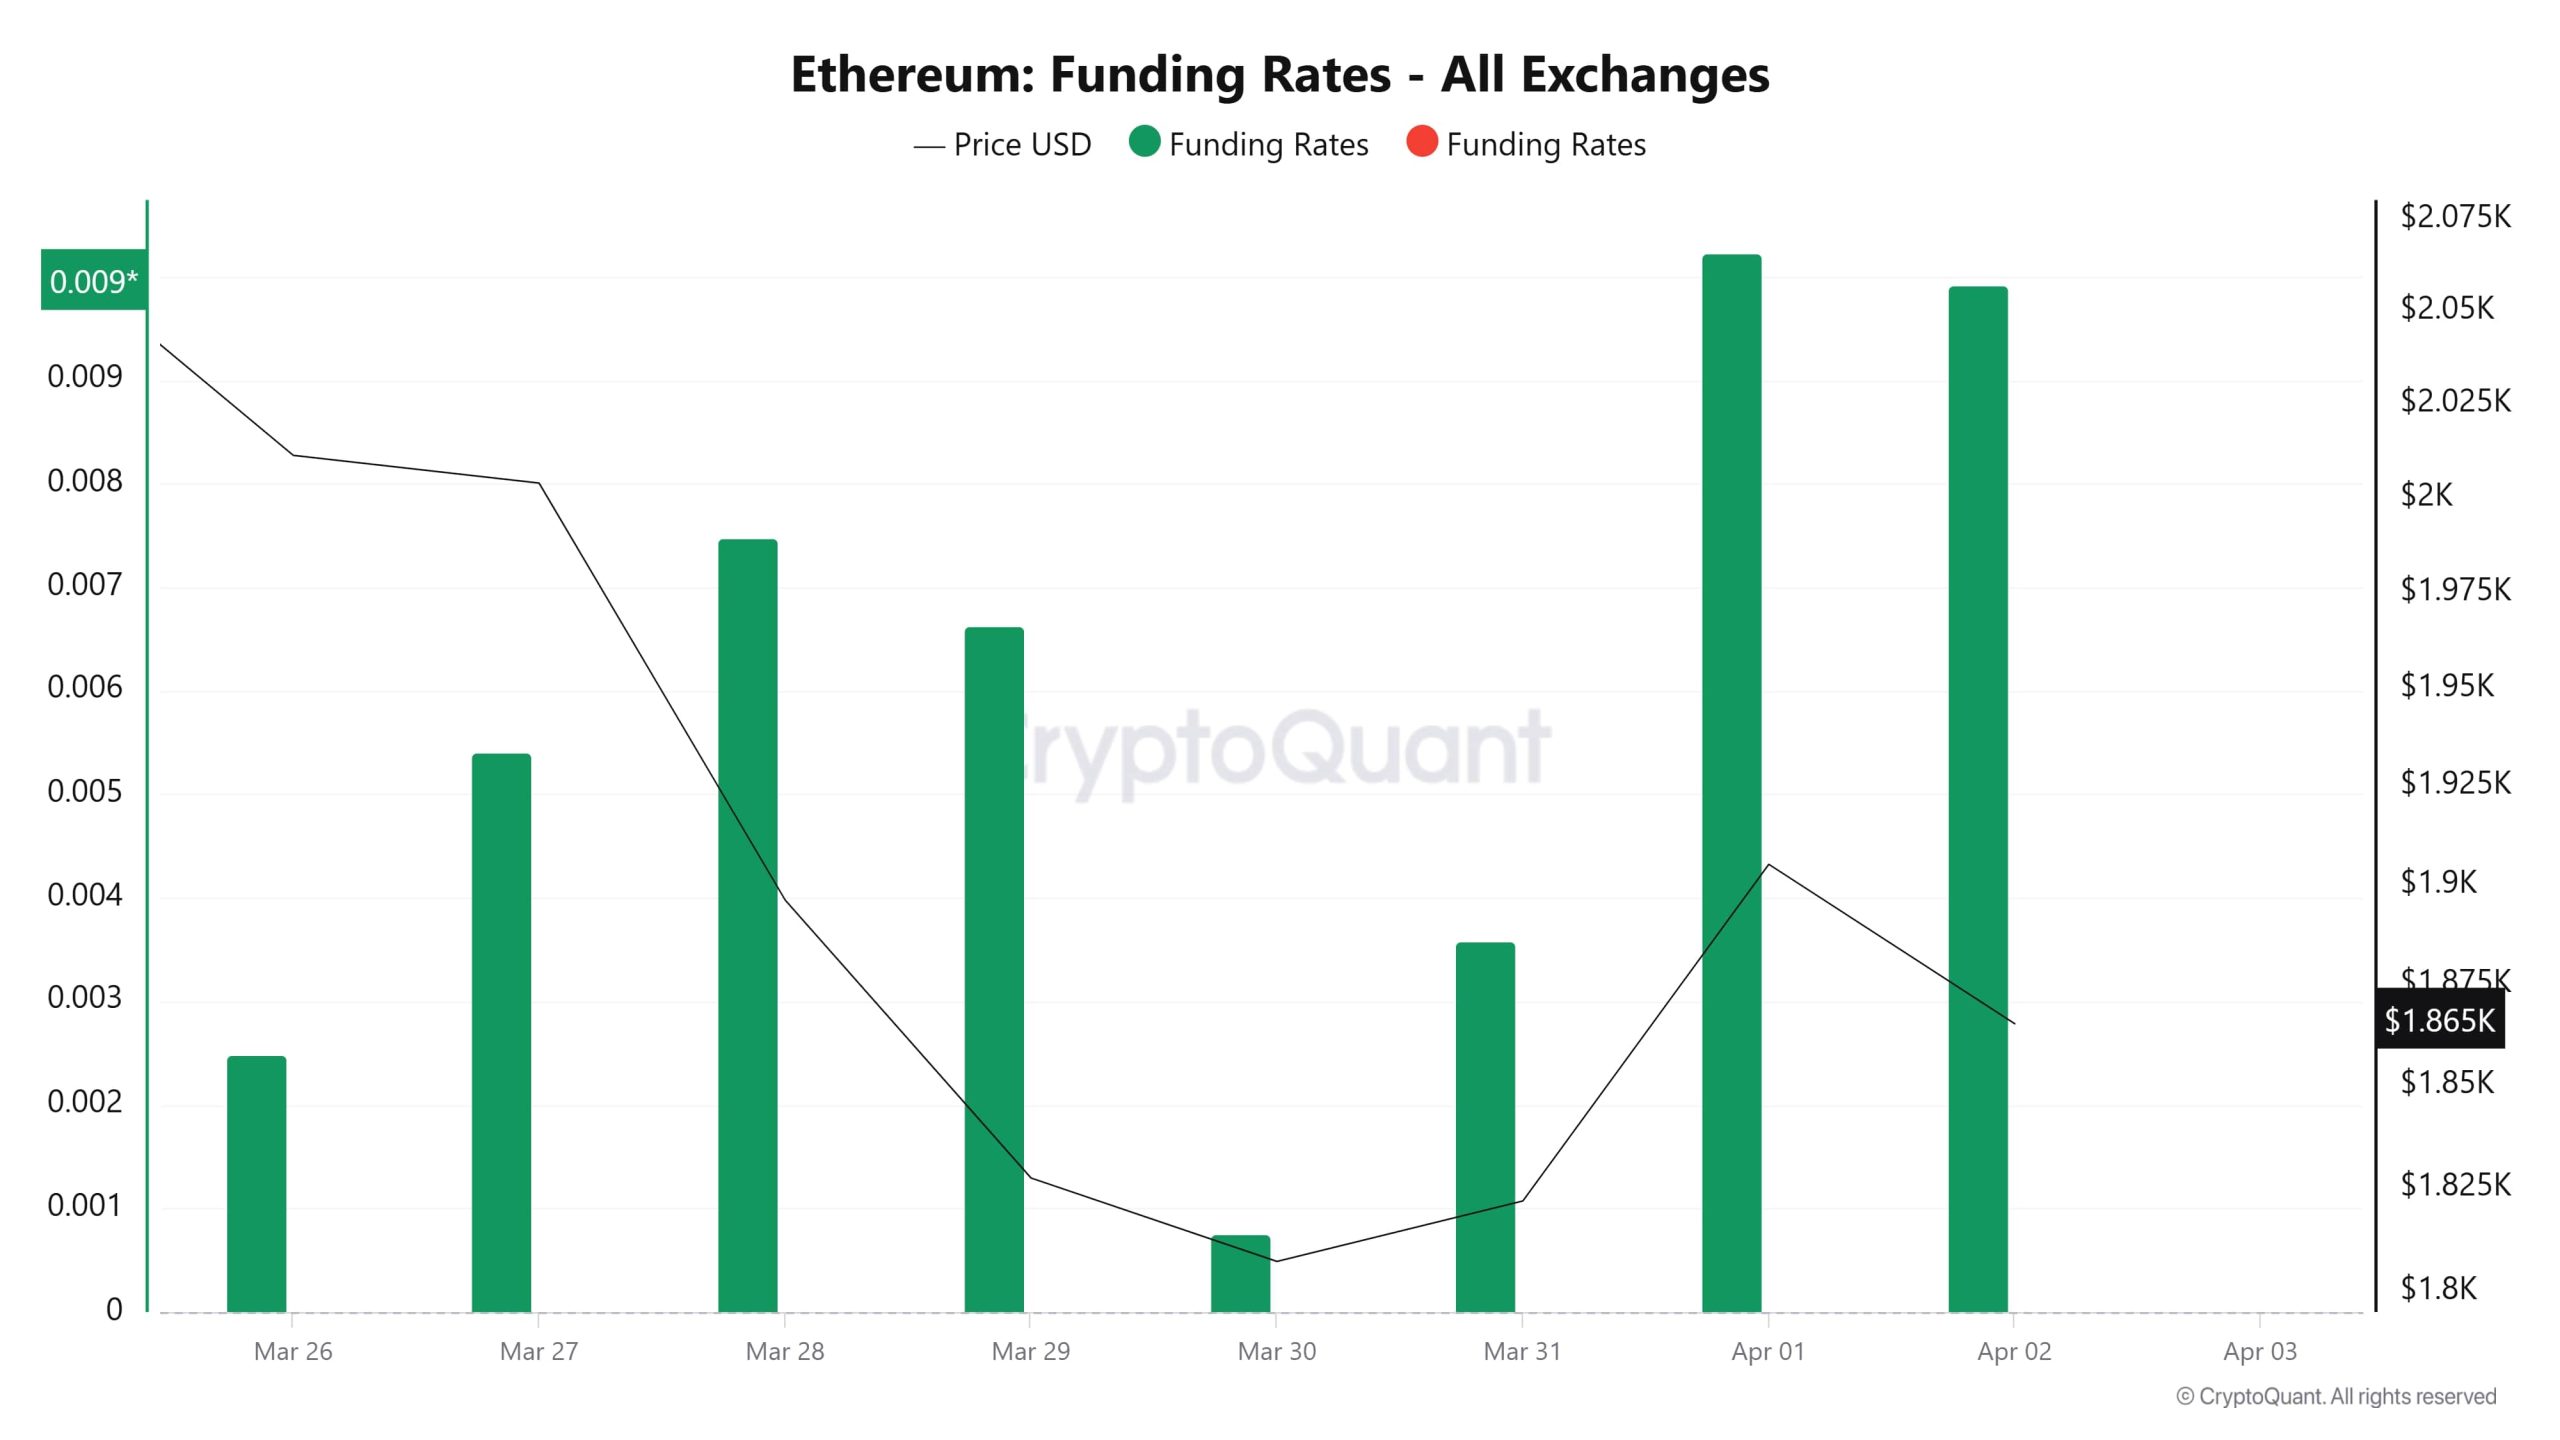
Ethereum’s funding rate is generally positive. It started March 26 at a high level but experienced a significant decline around March 29-30. On March 30, the funding rate almost reached zero, then recovered and rose sharply on April 1-2. While a positive funding rate indicates that long positions are dominant, the decline on March 30 suggests that short interest in the market has increased or long positions have been liquidated. The sudden rise on April 1-2 indicates that the long side is getting stronger again. ETH price also seems to be falling and recovering in parallel with the fluctuations in the funding rate. If the funding rate continues to rise, it may indicate that the market momentum continues.
Long & Short Liquidations
ETH, which fell to 1,770 levels with a sharp decline last week, caused a high level of long positions to be liquidated. In this period, when a total of 493 million dollars of long positions were liquidated, the liquidation rate of short positions was 172 million dollars.
Long vs Short Positions Overview
| Date | Long Amount (Million $) | Short Amount (Million $) |
|---|---|---|
| March 26 | 57.44 | 9.02 |
| March 27 | 27.64 | 9.04 |
| March 28 | 241.03 | 15.59 |
| March 29 | 67.95 | 29.17 |
| March 30 | 39.99 | 13.61 |
| March 31 | 42.73 | 35.18 |
| April 01 | 16.26 | 60.72 |
| Total | 493.04 | 172.33 |
Supply Distribution
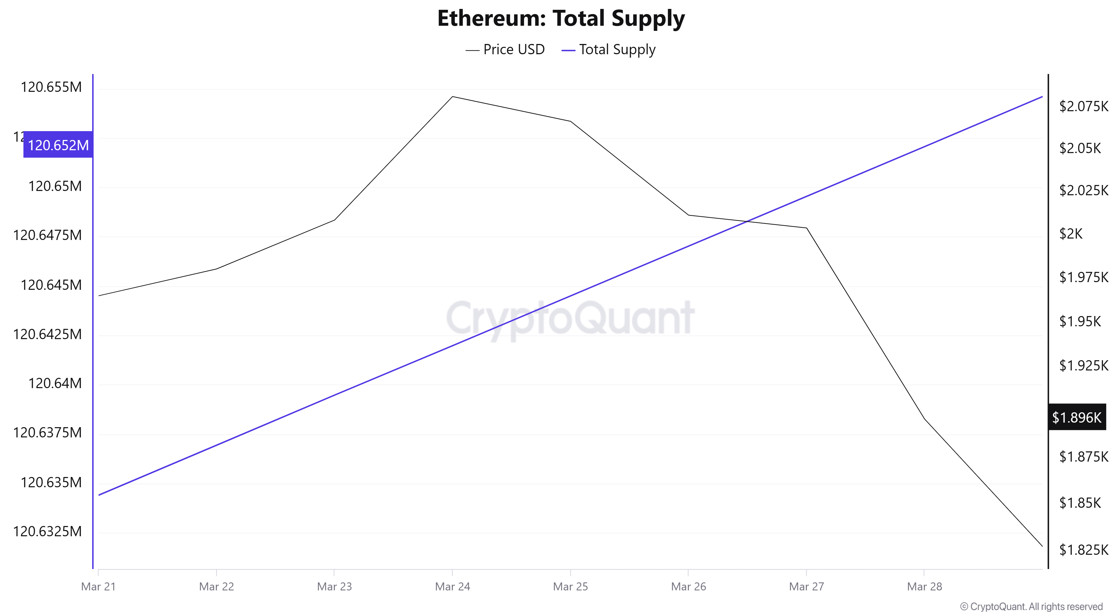
Total Supply: It reached 120,652,063 units, up about 0.037% from last week.
New Supply: The amount of ETH produced this week was 45,070.
Velocity: Velocity, which was 7.70 last week, was 7.67 as of March 28.
ETH Supply Distribution by Wallet Category
| Wallet Category | 21.03.2025 | 28.03.2025 | Change (%) |
|---|---|---|---|
| 100 – 1k ETH | 9.4371M | 9.4312M | -0.062% |
| 1k – 10k ETH | 12.6219M | 12.5996M | -0.177% |
| 10k – 100k ETH | 16.5674M | 16.6592M | 0.554% |
| 100k+ ETH | 5.2205M | 5.1032M | -2.247% |
According to the latest data, 100 – 1k ETH wallets decreased by 0.062%, while 1k – 10k ETH holders decreased by 0.177%. The 10k – 100k ETH category saw an increase of 0.554%, while the most notable change was a notable decrease of 2.247% in 100k+ ETH holders.
Exchange Reserve
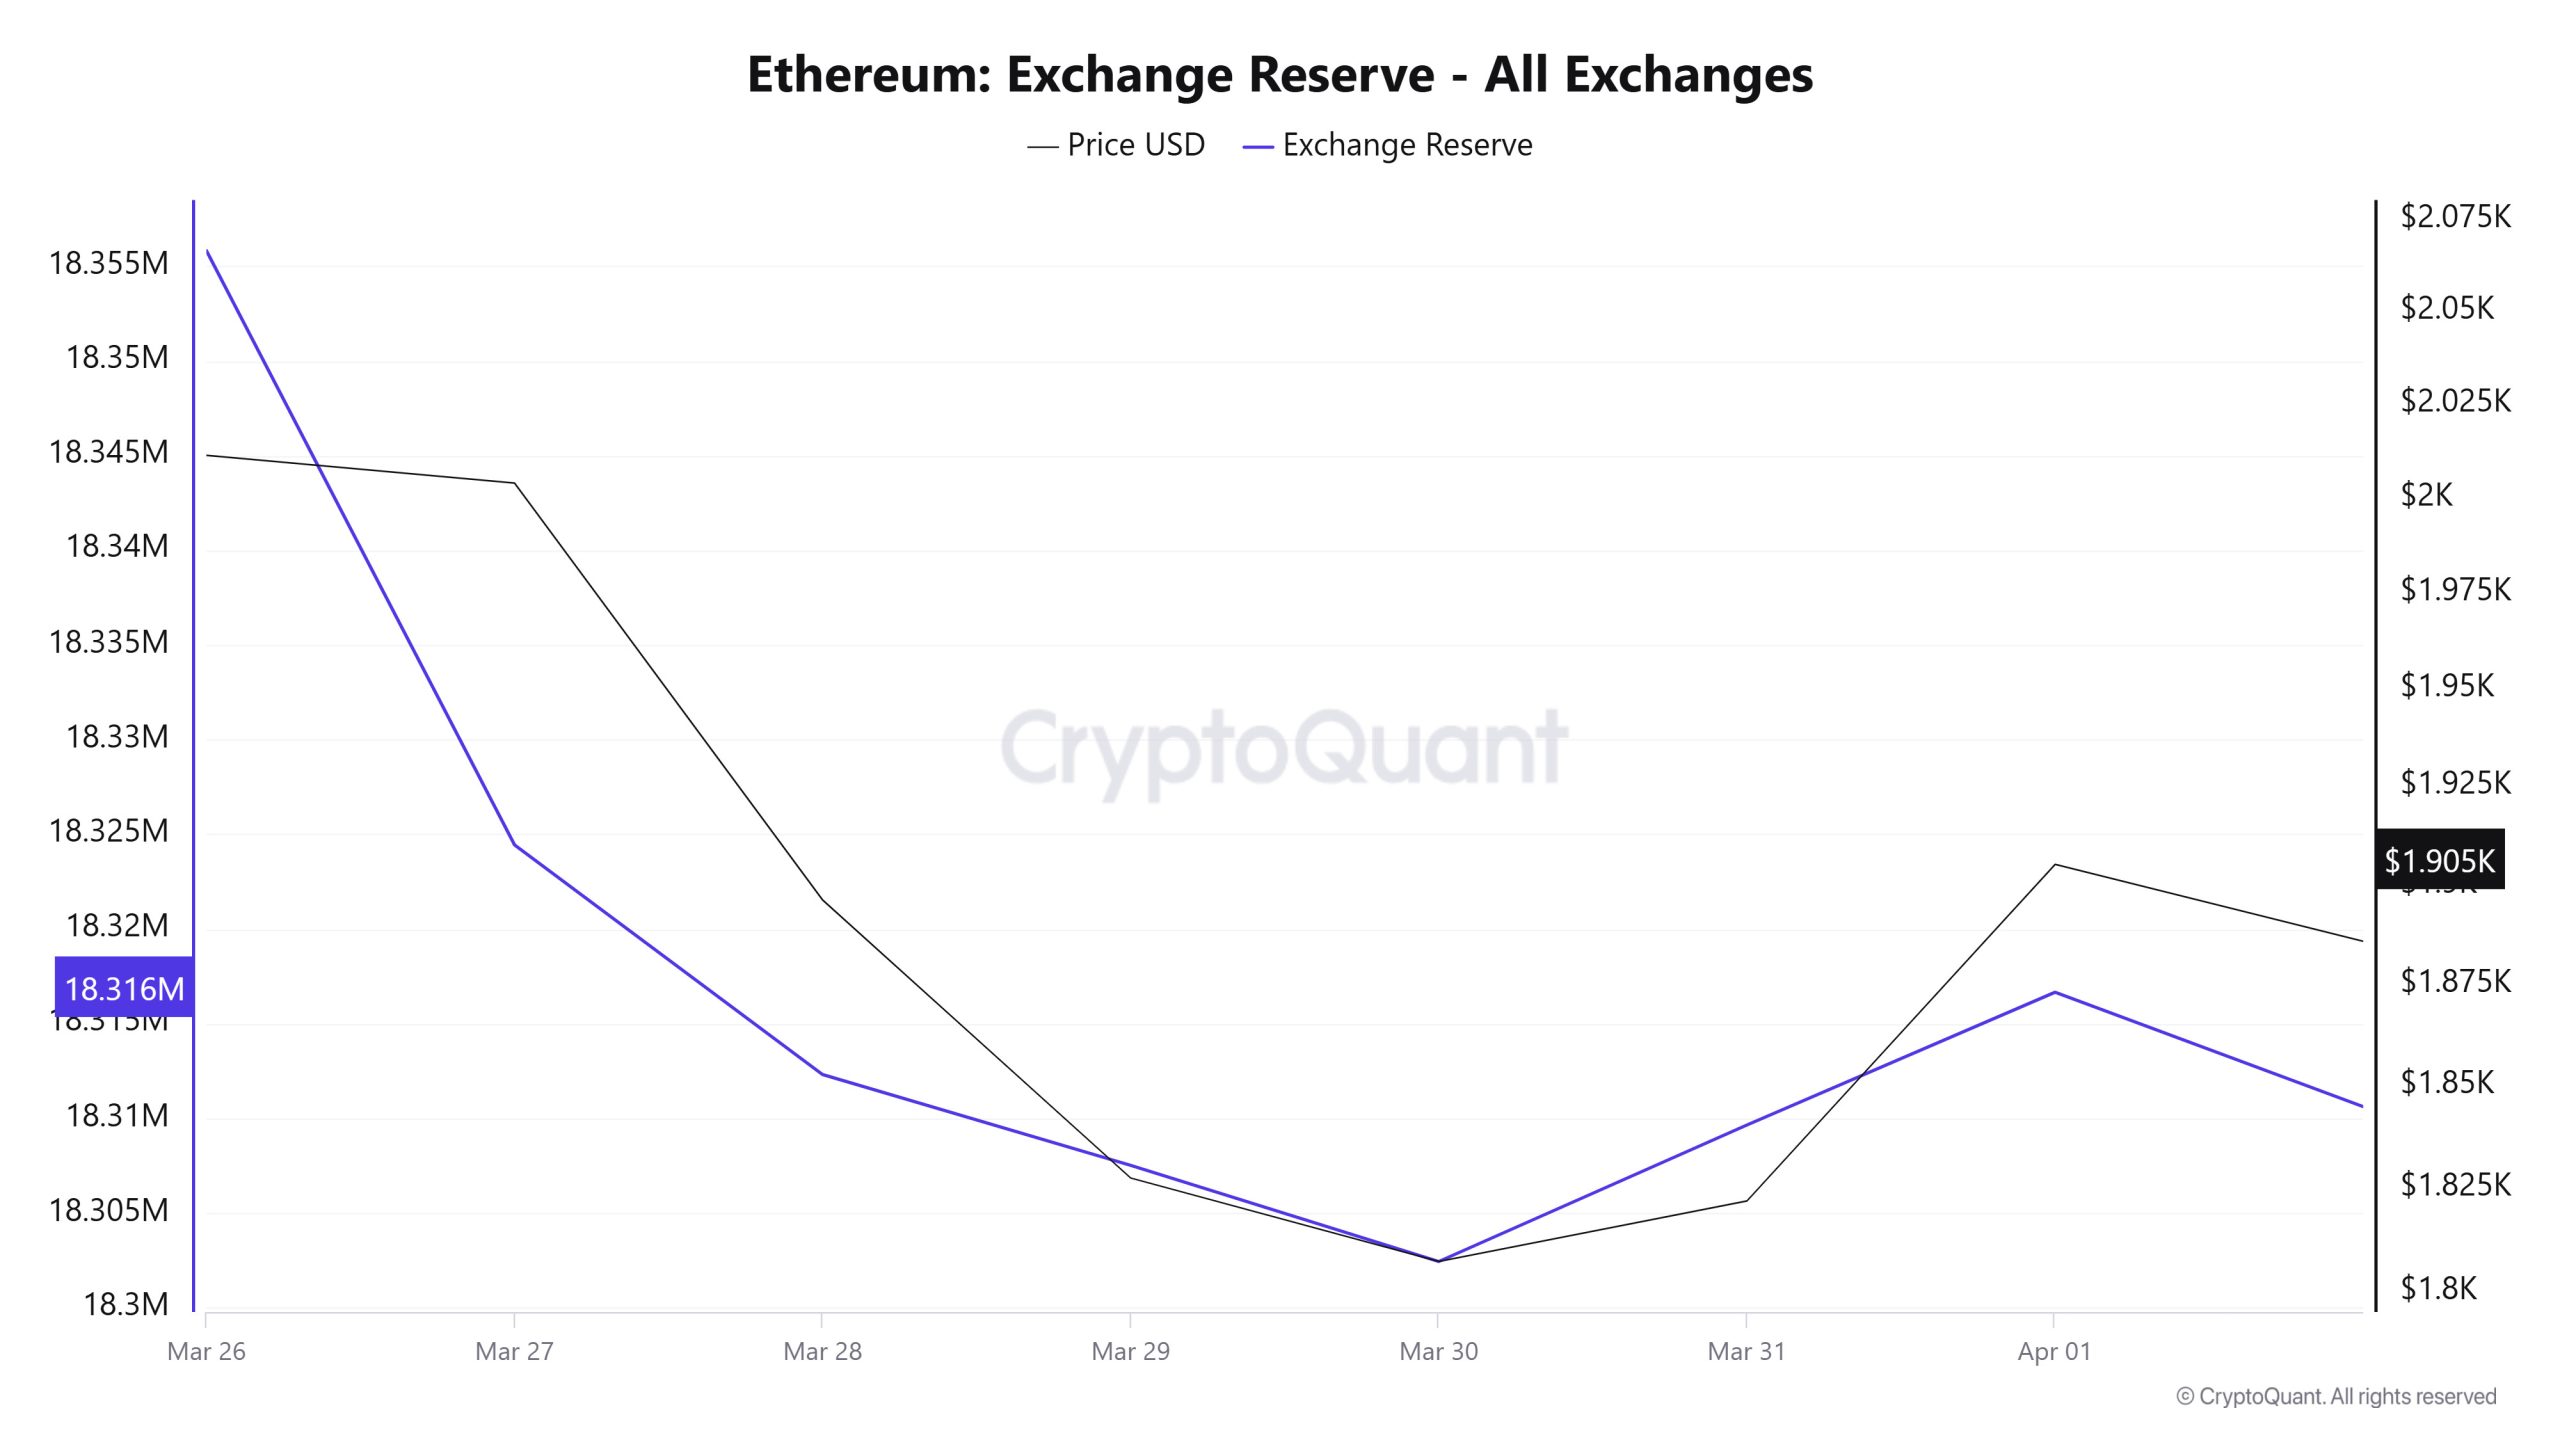
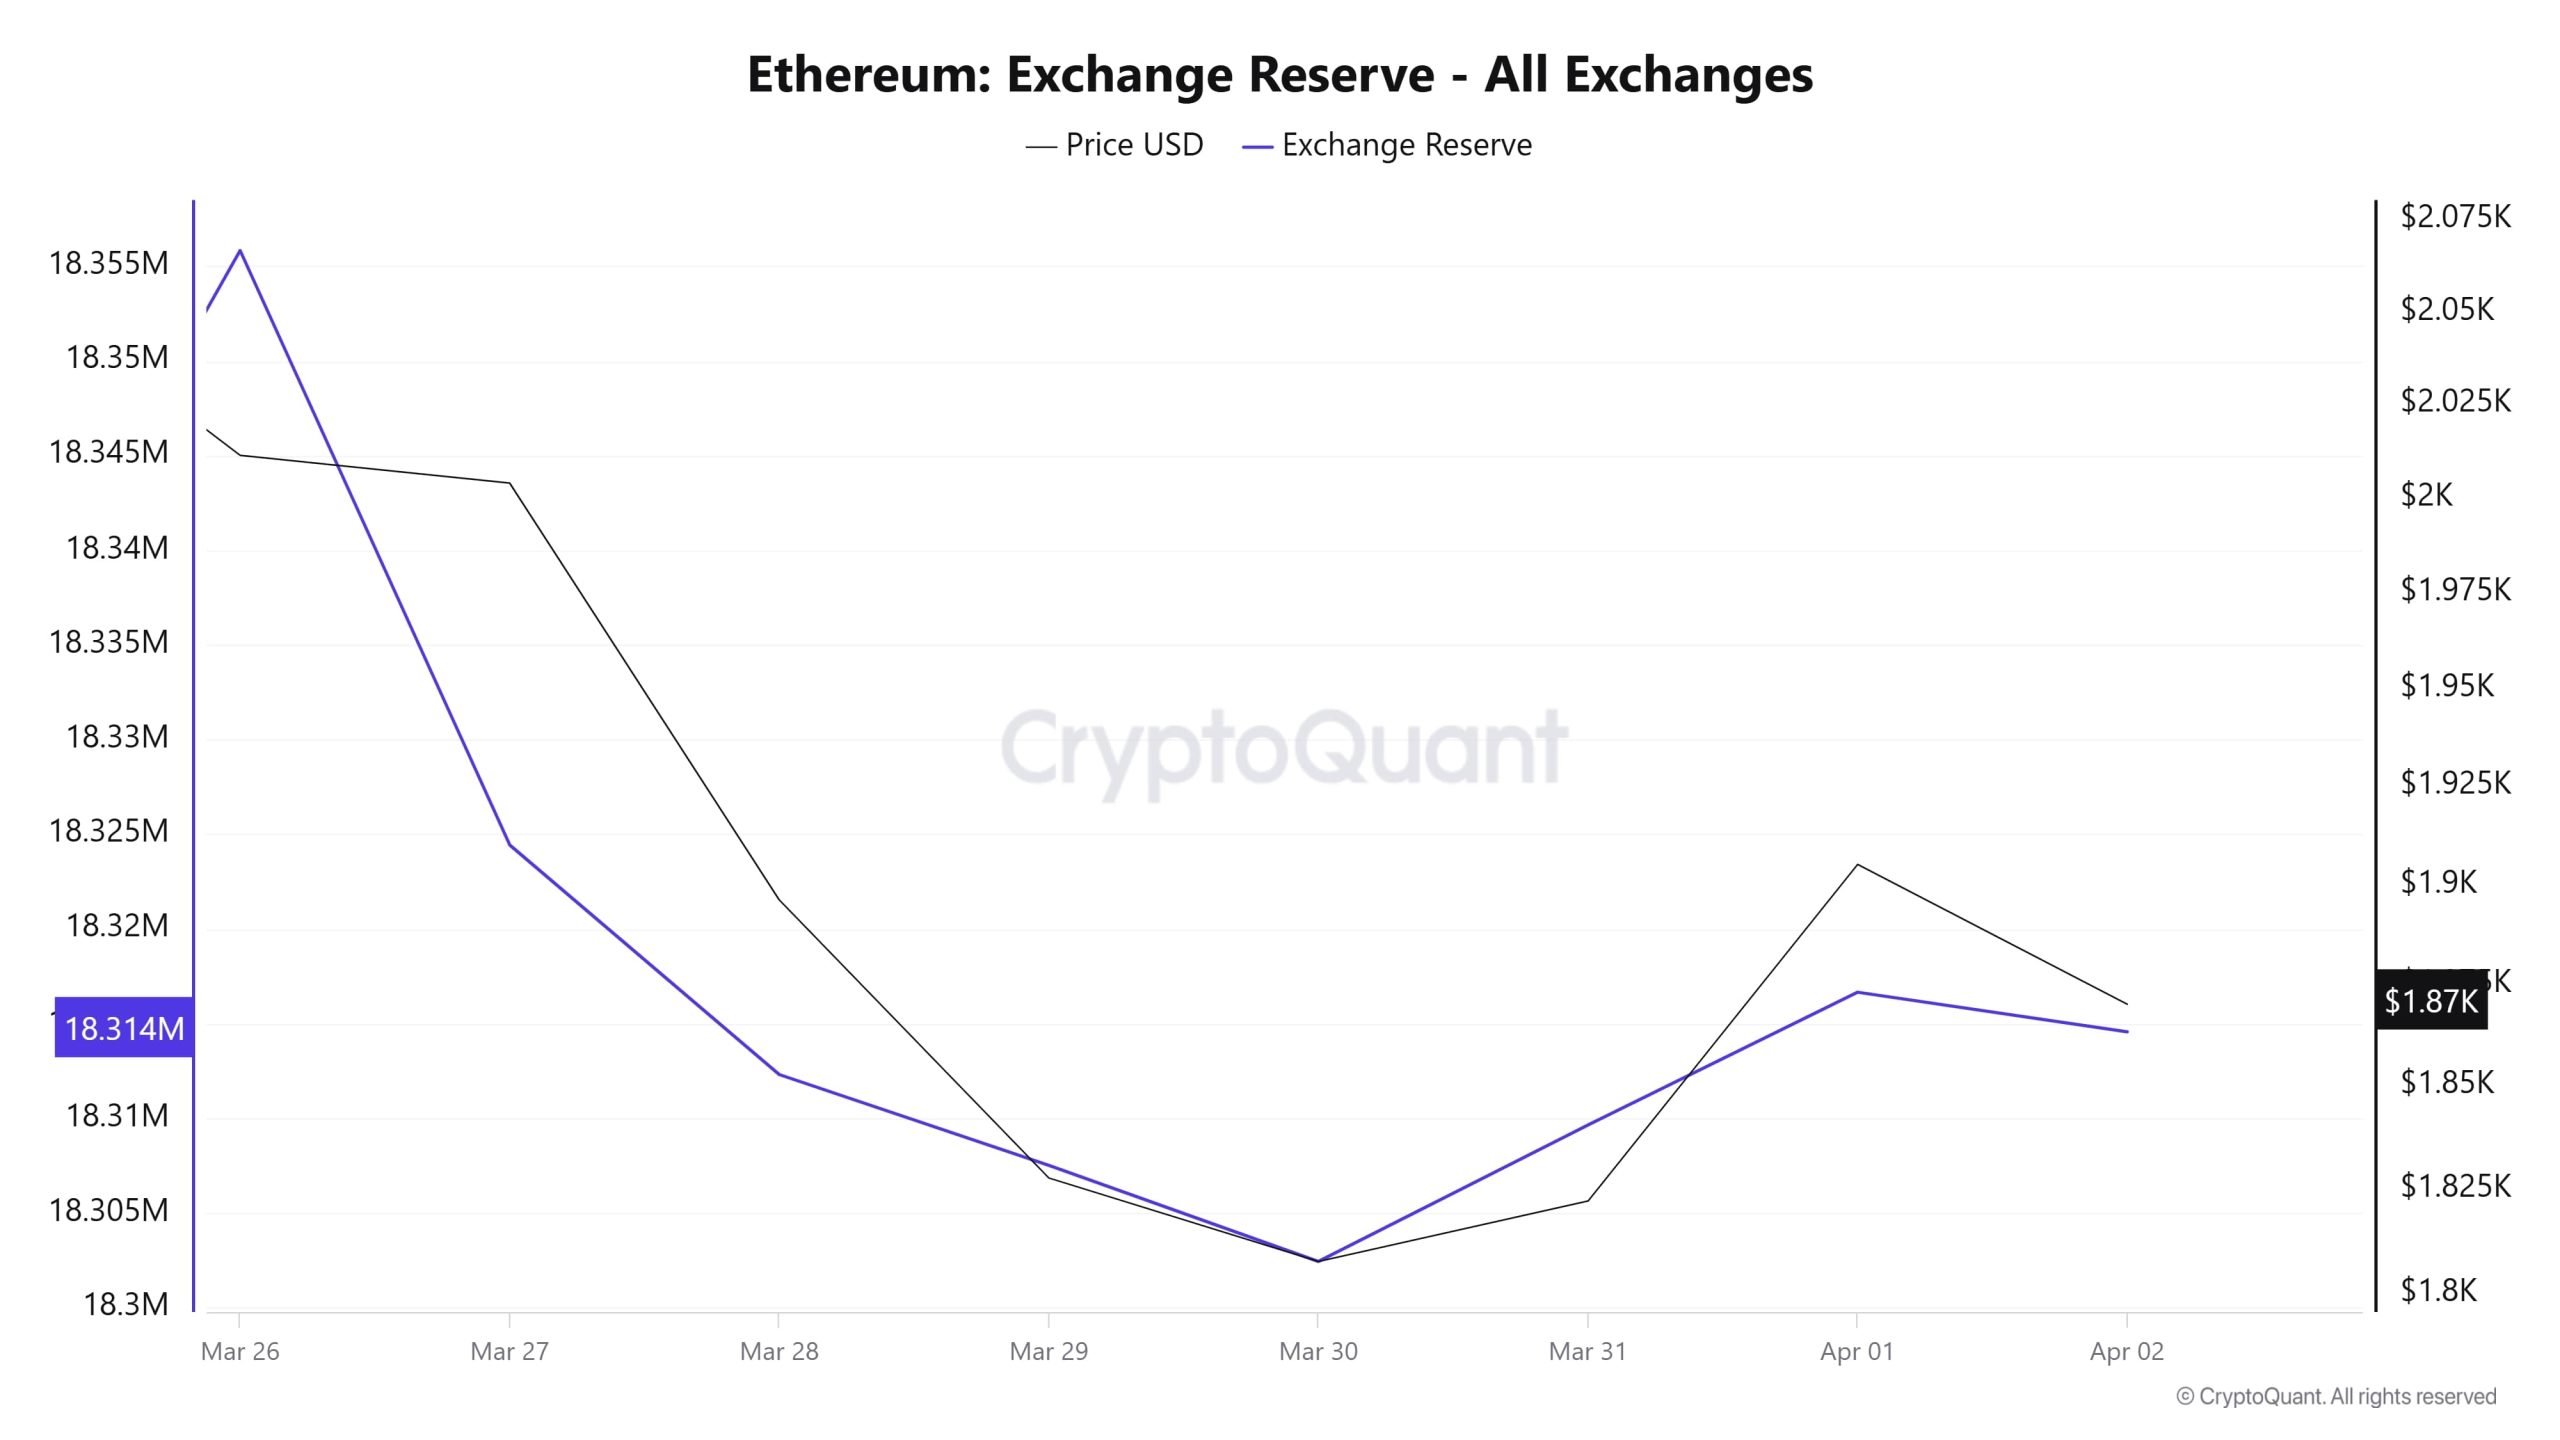
Between March 26 and April 1, 2025, Ethereum reserves on exchanges decreased from 18,355,824 ETH to 18,316,667 ETH. During this period, there was a total net outflow of 39,157 ETH and exchanges’ Ethereum reserves decreased by 0.21%. The Ethereum price fell by approximately 5.3% during this period. Ethereum, which closed at $2,011 on March 26, 2025, closed at $1,905 on April 1, 2025. Although the net outflows from the exchanges reduced the supply, the price declined in this process. In the long run, the reduction in reserves can be expected to put upward pressure on the price.
ETH Exchange Activity & Price
| Date | Exchange Inflow | Exchange Outflow | Exchange Netflow | Exchange Reserve | ETH Price ($) |
|---|---|---|---|---|---|
| March 26 | 626,984 | 601,740 | 25,244 | 18,355,824 | 2,011 |
| March 27 | 564,896 | 596,277 | -31,382 | 18,324,442 | 2,004 |
| March 28 | 1,193,419 | 1,205,541 | -12,122 | 18,312,320 | 1,896 |
| March 29 | 341,528 | 346,323 | -4,795 | 18,307,525 | 1,828 |
| March 30 | 255,477 | 260,549 | -5,072 | 18,302,453 | 1,807 |
| March 31 | 949,219 | 942,015 | 7,204 | 18,309,657 | 1,822 |
| April 01 | 716,789 | 709,779 | 7,010 | 18,316,667 | 1,905 |
Fees and Revenues
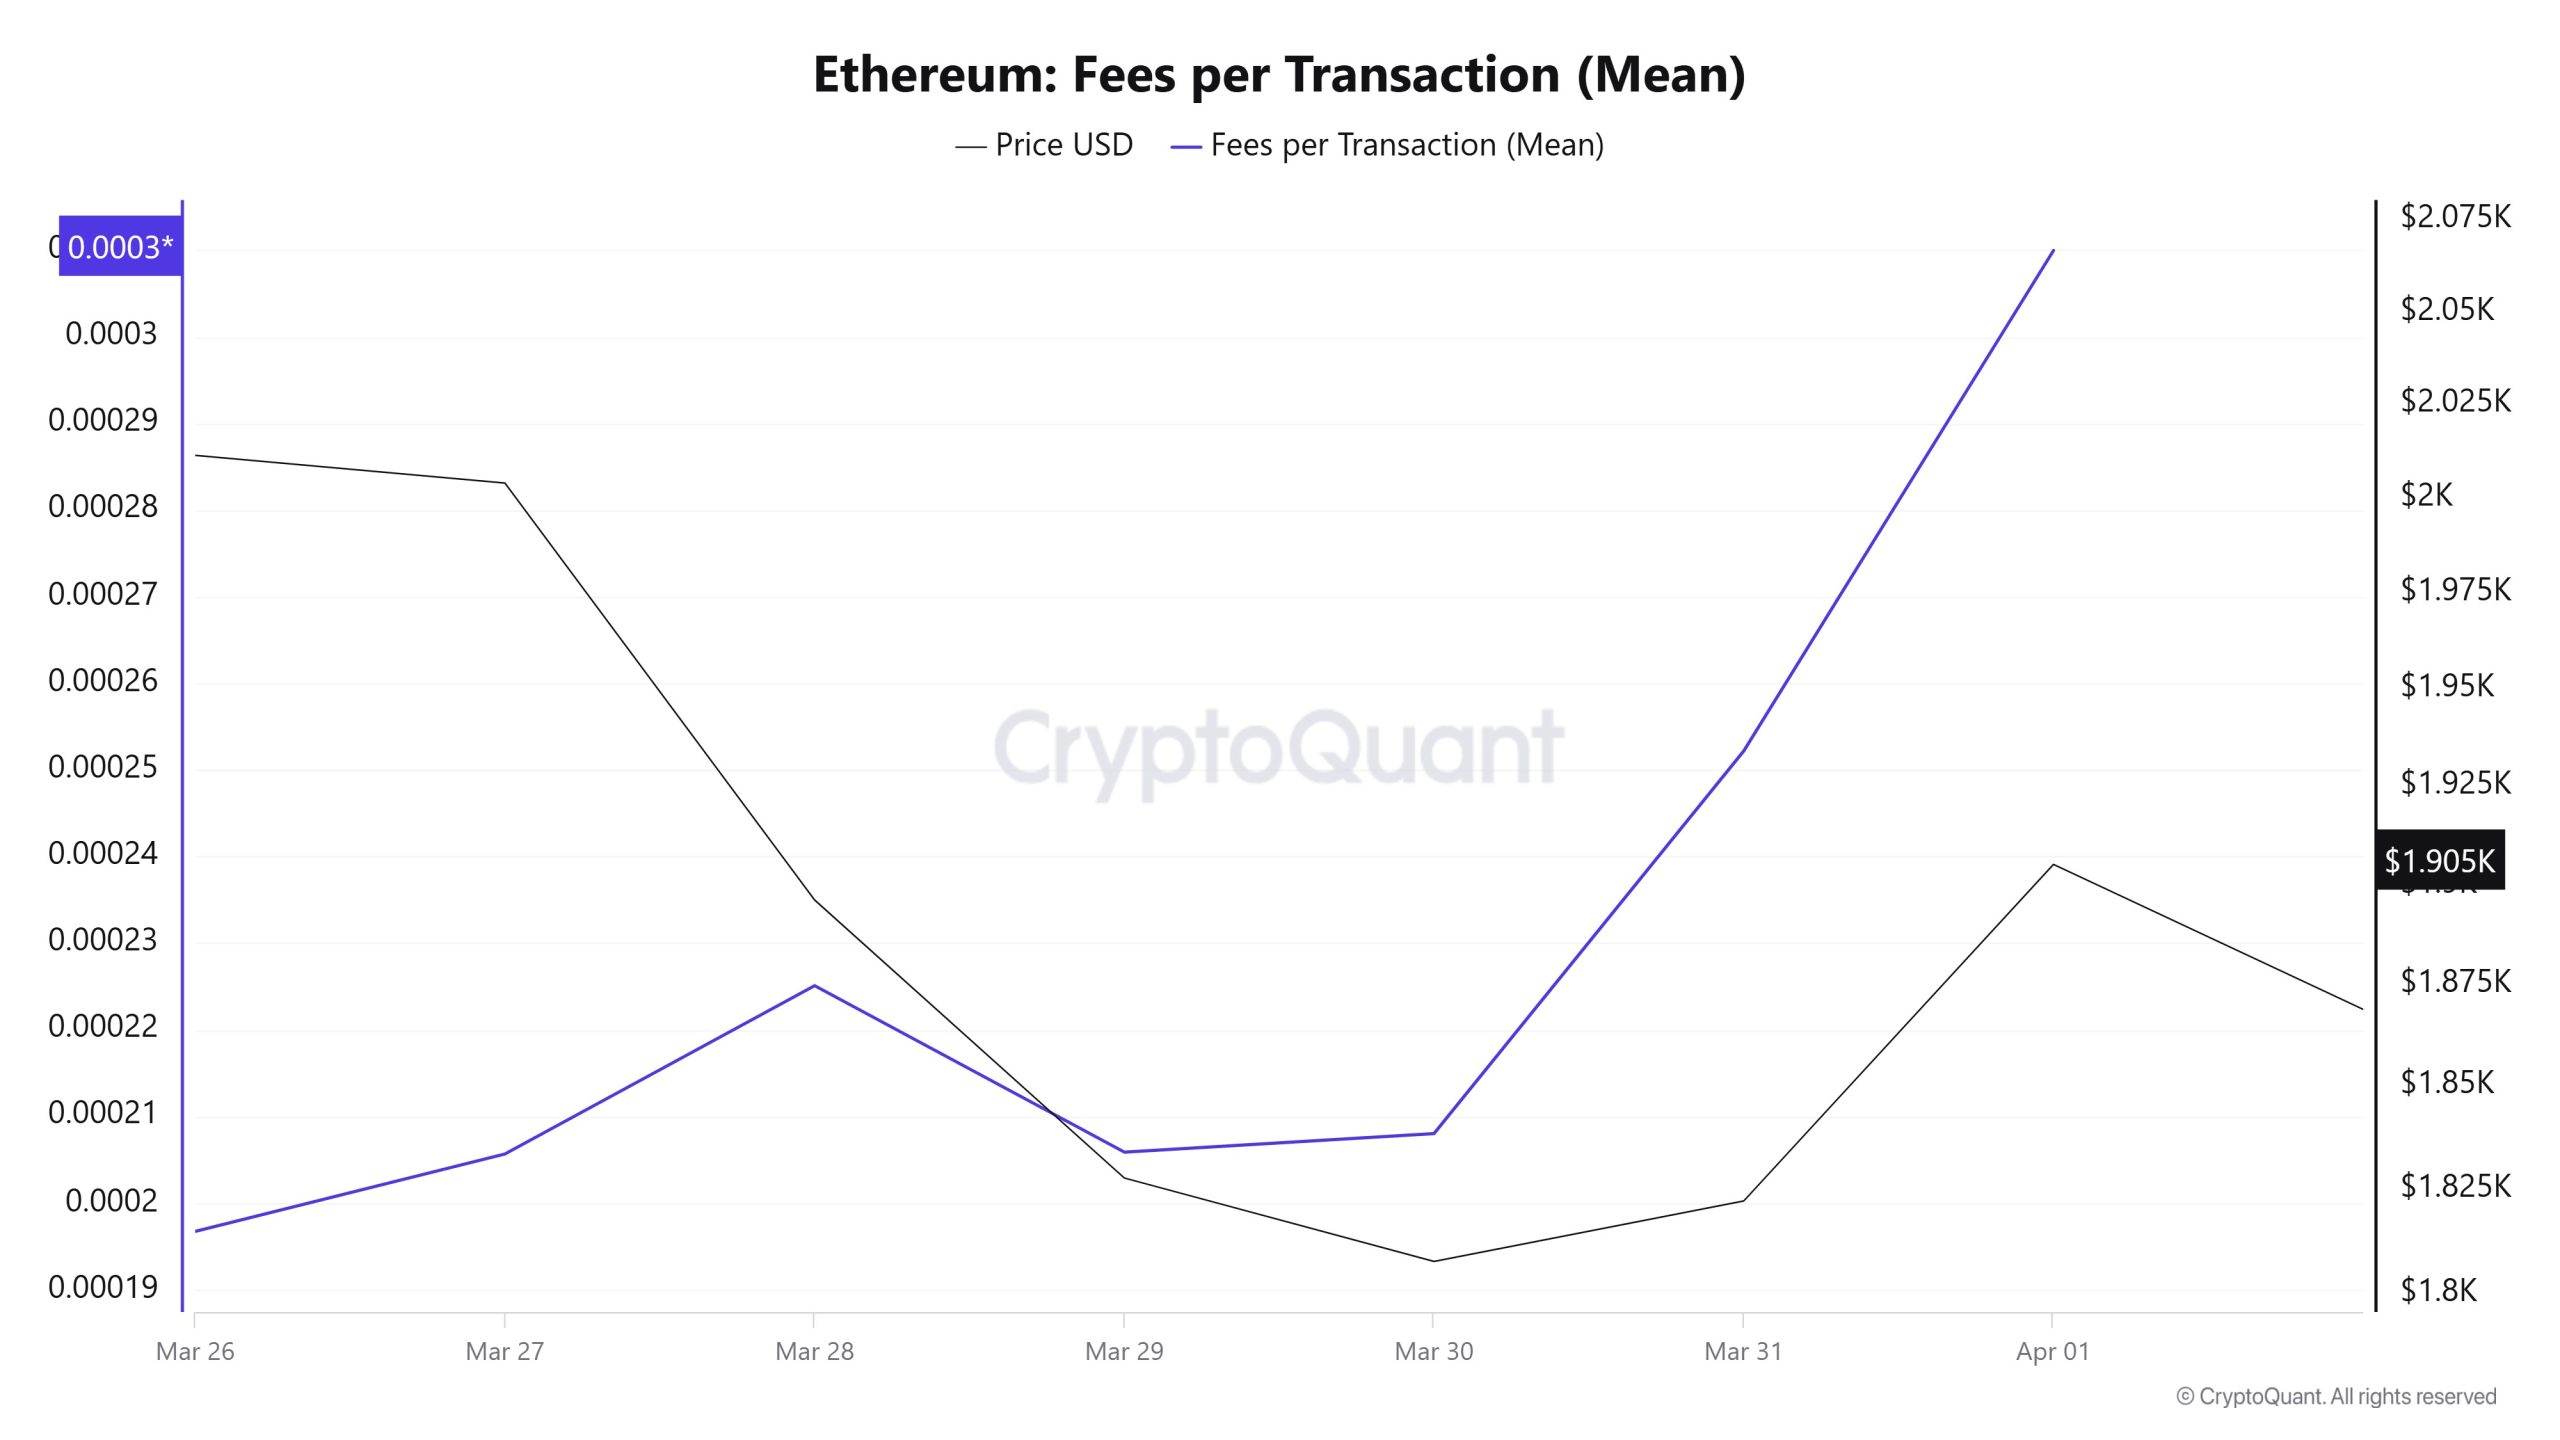
When the Ethereum Fees per Transaction (Mean) data between March 26 and April 1 is analyzed, it is seen that this value was at the level of 0.000196717669771781 on March 26, the first day of the weekly period. Until March 28, the value, which showed an upward trend, reached 0.00022508977519599 on this date and then entered a downward trend again.
As of March 30, the value, which gained upward momentum again in parallel with the fluctuations in the Ethereum price, closed at 0.000309965286037259 on April 1, the last day of the weekly period. This level was recorded as the highest value of the week.
Bitcoin: Fees (Total)
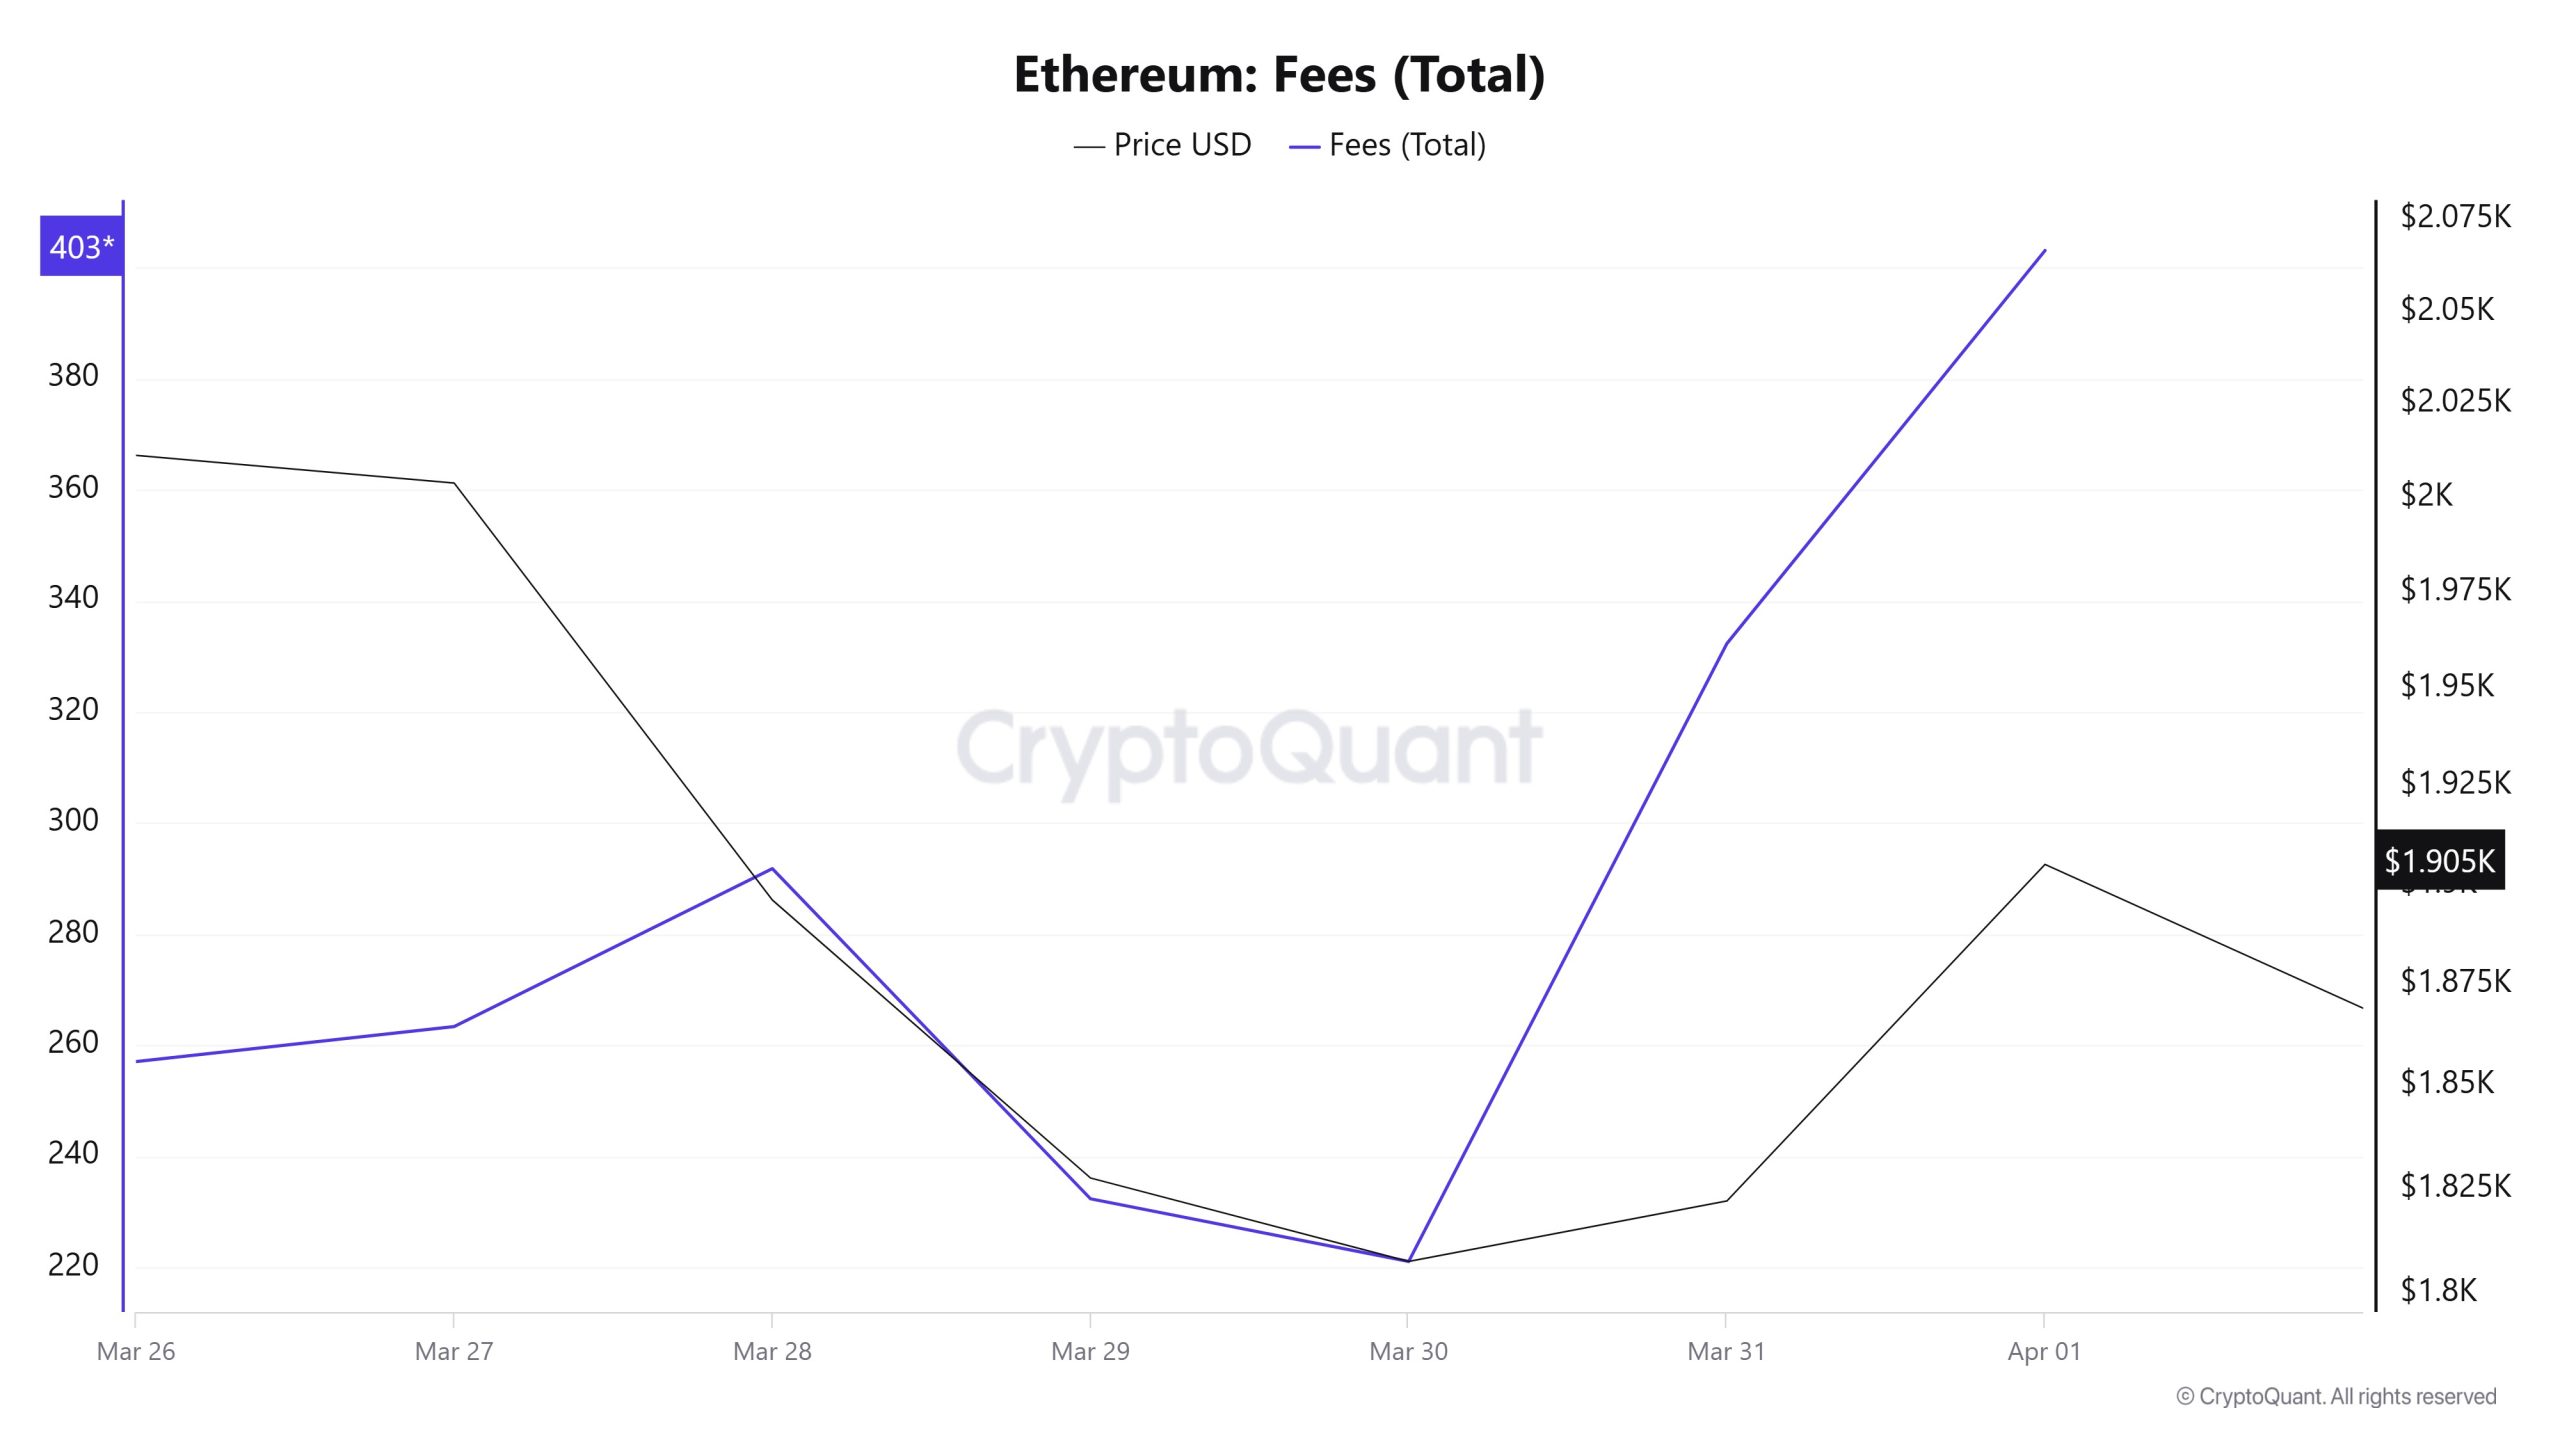
Similarly, when the Ethereum Fees (Total) data between March 26 and April 1 were analyzed, it was seen that this value was at the level of 257.0698639870838 on March 26, the first day of the weekly period. Until March 28, the value, which showed an upward trend, reached 291.7982813321742 on this date and then entered a downward trend again.
As of March 30, the value, which gained upward momentum again in parallel with the fluctuations in the Ethereum price, closed at 403,05344080939676 on April 1, the last day of the weekly period. This level was recorded as the highest value of the week.
Blocks Mined
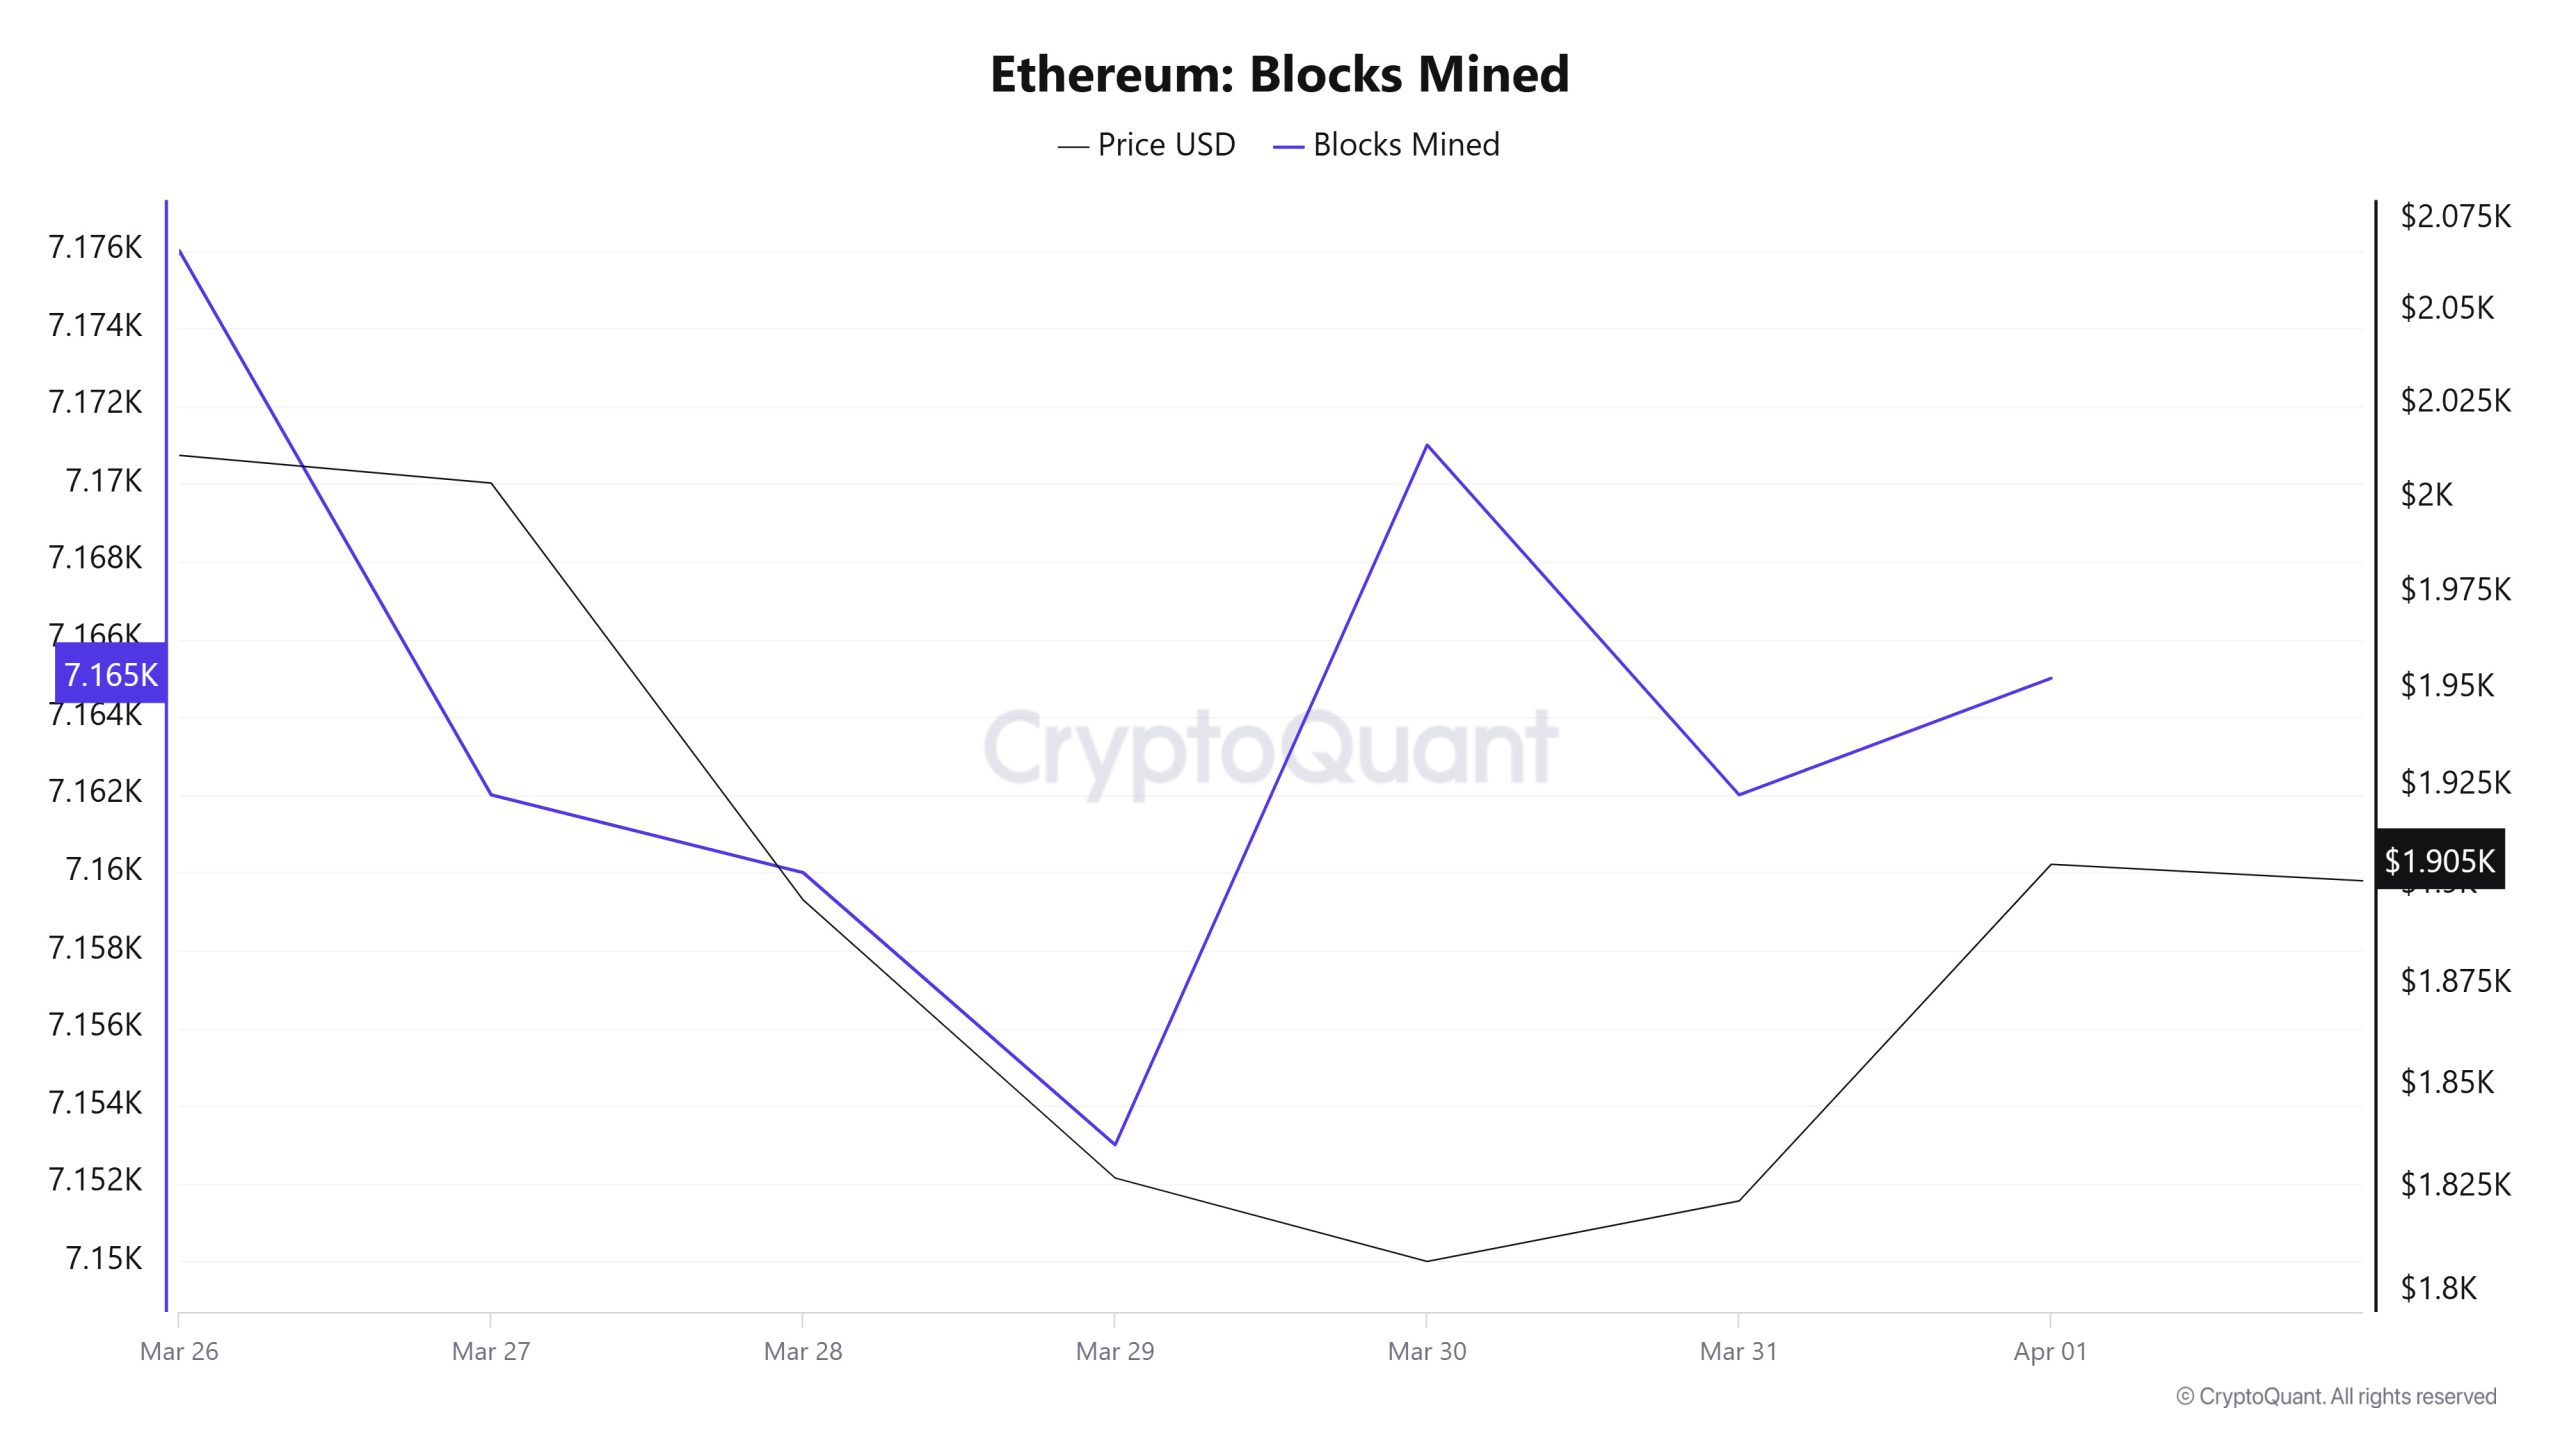
March 26 – April 1 When we examine the Ethereum Blocks Mined table between March 26 and April 1, the number of blocks produced decreased towards the middle of the week but increased towards the end of the week. While 7,176 blocks were produced on March 26, this number was 7,165 on April 1. There was a positive correlation between Blocks Mined and Ethereum price at the beginning of the week, a negative correlation in the middle of the week and a positive correlation at the end of the week.
Block Size

Between March 26 and April 1, when we examine the Ethereum Block Size table, there was a slight decrease in the middle of the week, but then it increased towards the end of the week. On March 26, the block size was 100,293 bytes, reaching 109,452 bytes on April 1. There was a positive correlation between Block Size and Ethereum price during the week.
Block Interval
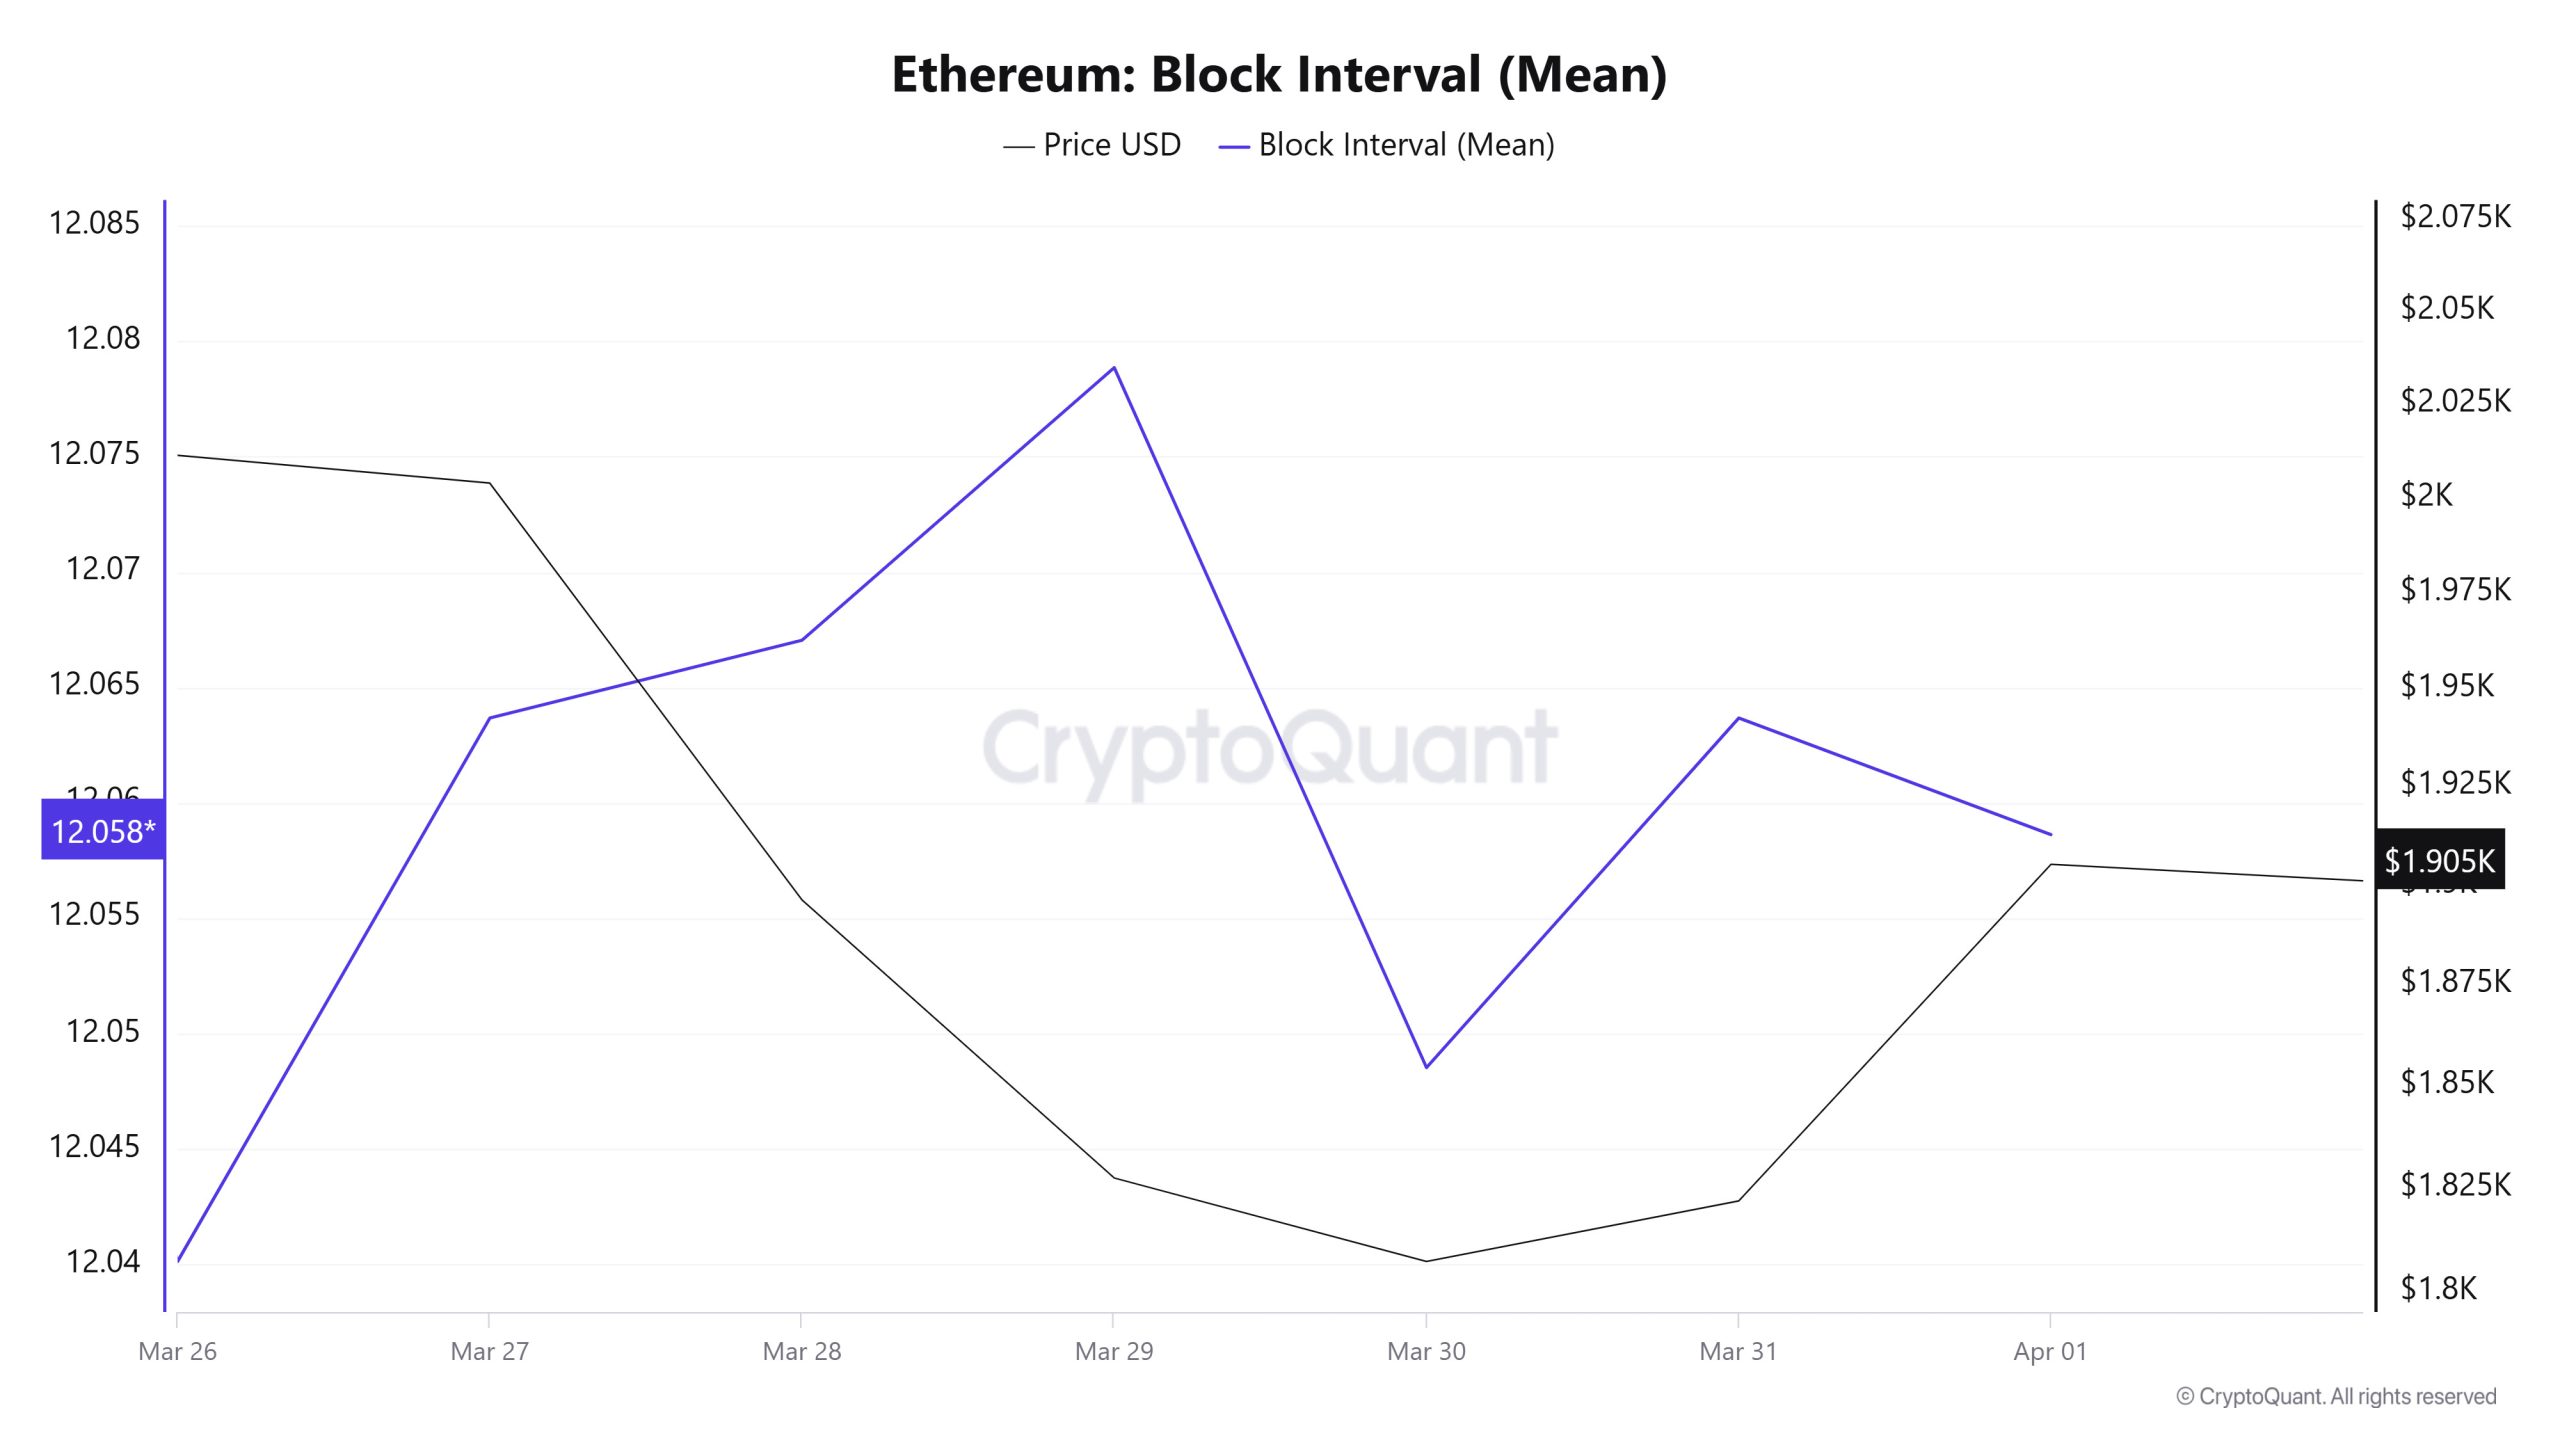
Between March 26 and April 1, when we examine the Ethereum Block Interval table, although there was an increase towards the middle of the week, there was a slight decrease in the time between blocks towards the end of the week. On March 26, the time between blocks was 12.04 seconds, while on April 1, it was 12.05 seconds. There was a negative correlation between Block Interval and Ethereum price during the week.
Transaction
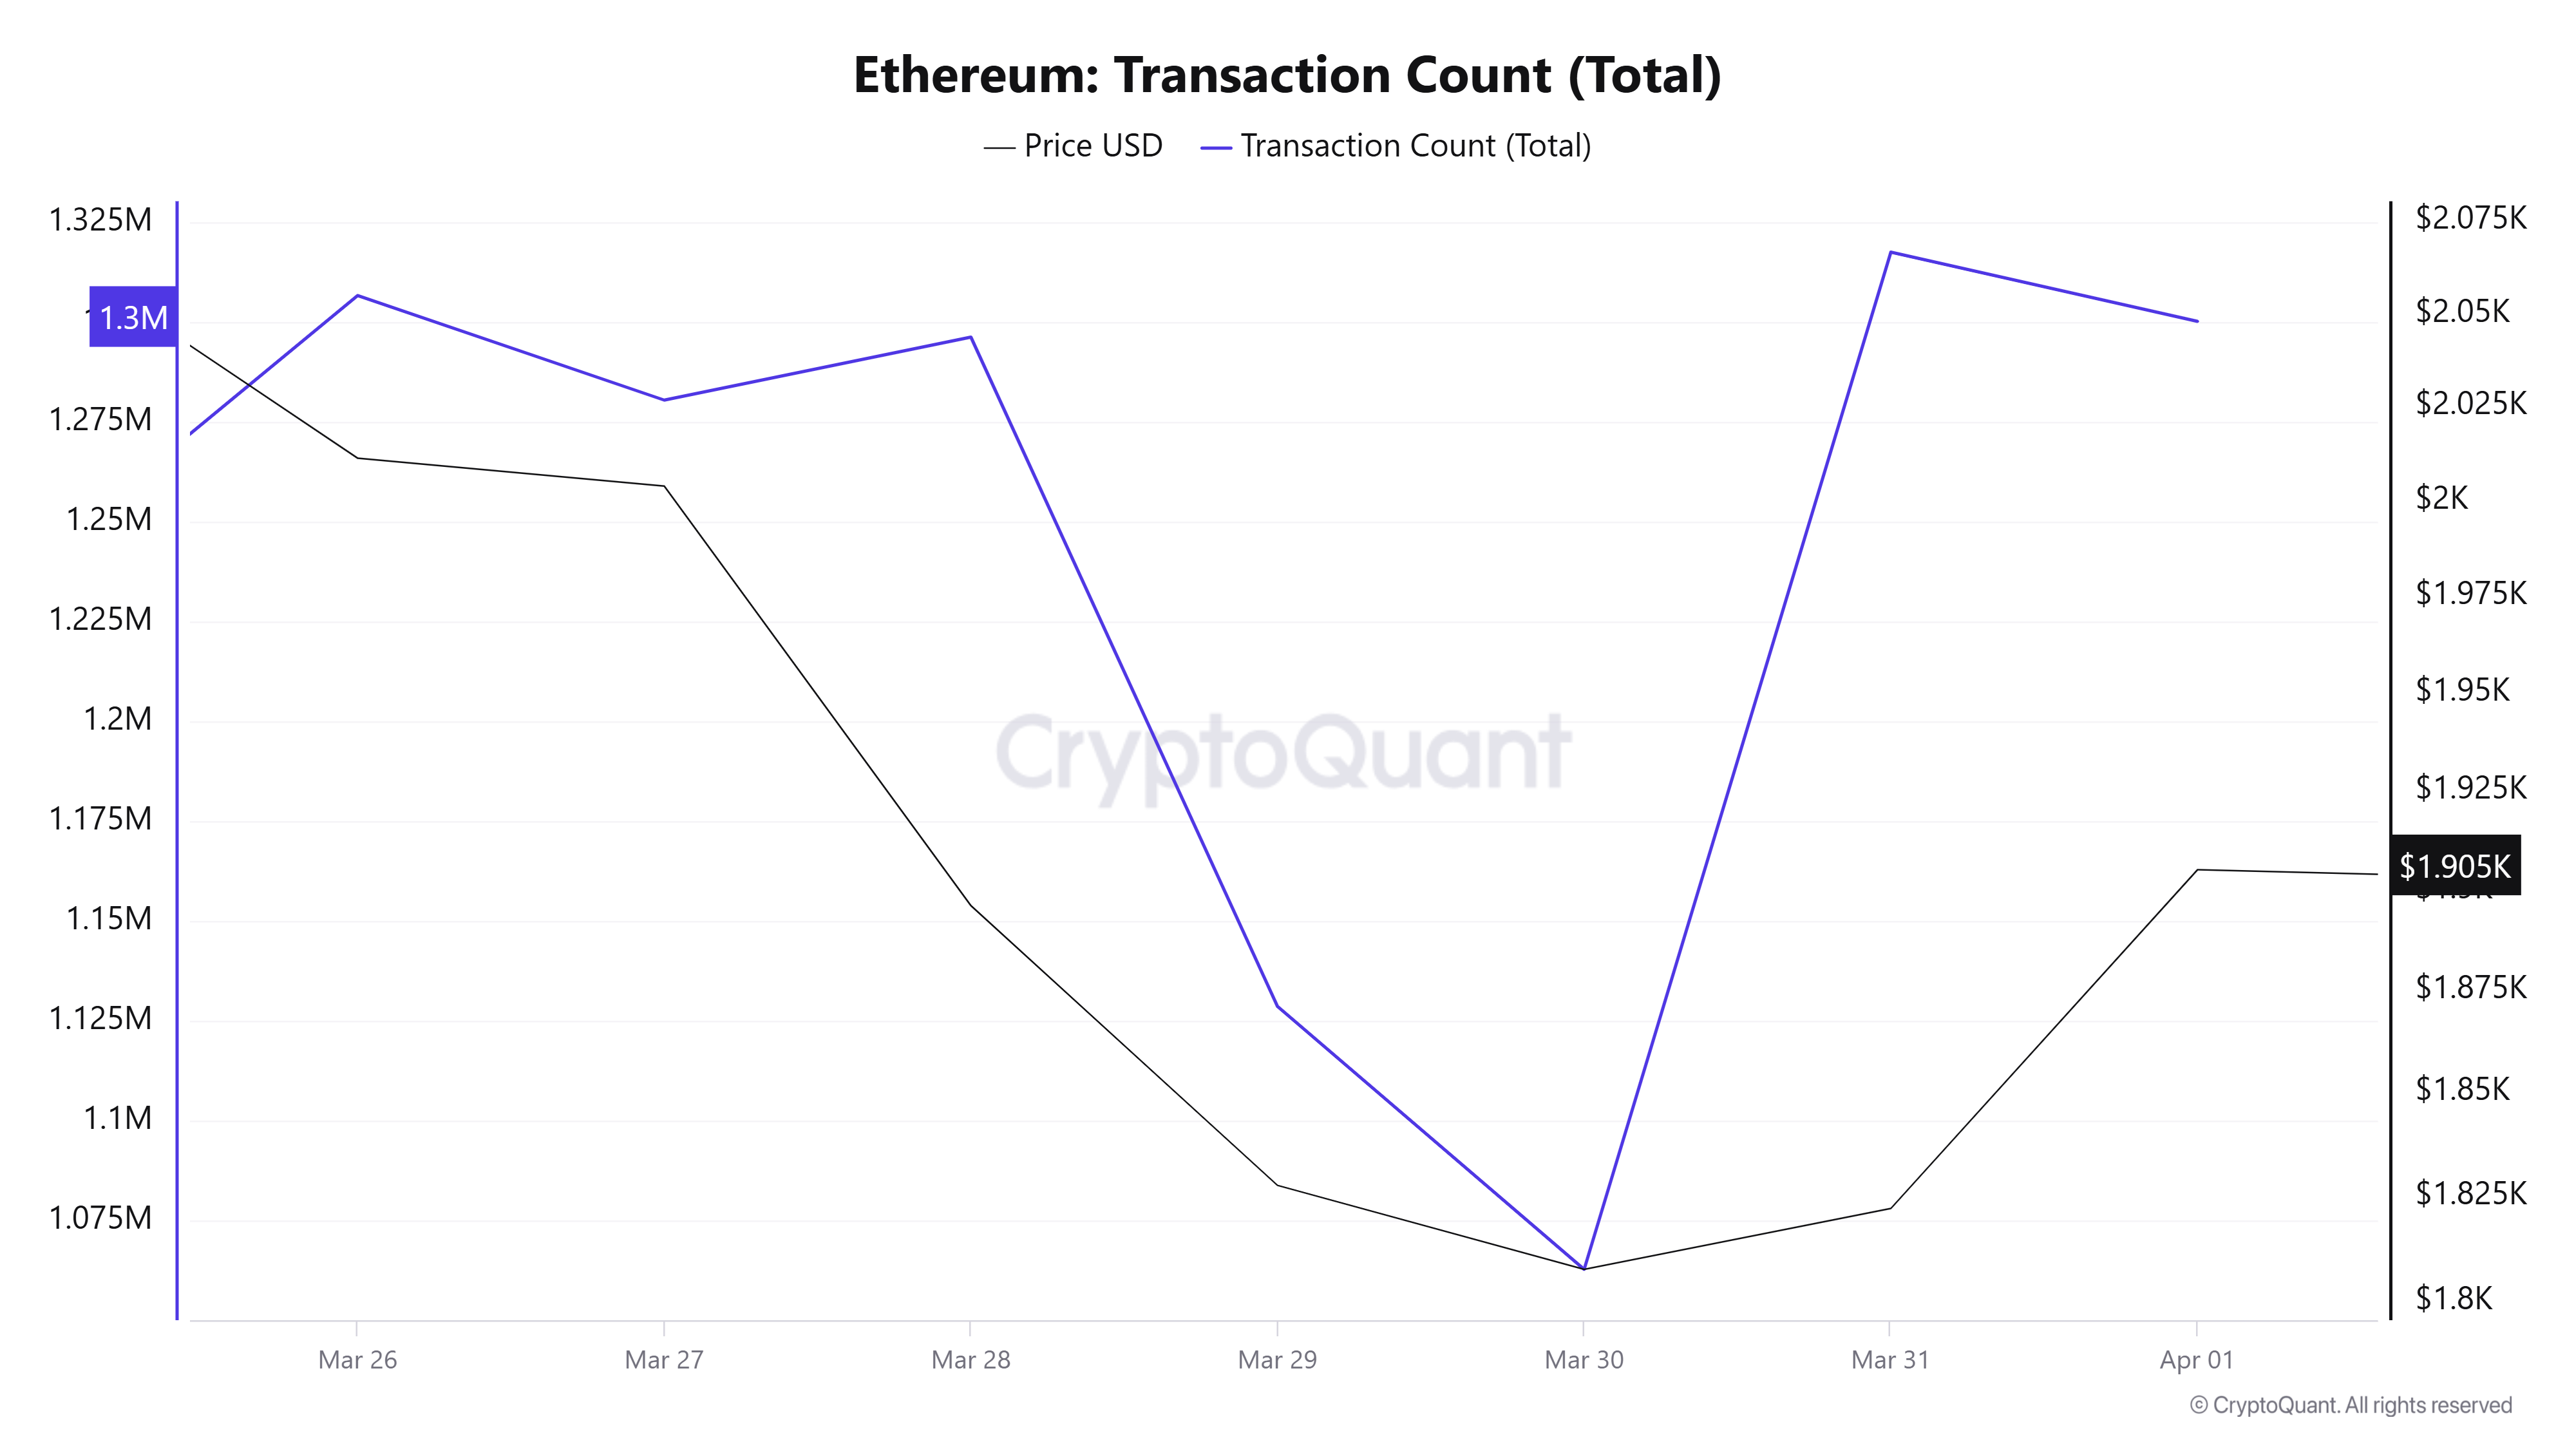 Last week there were 8,039,057 transactions, while this week’s number increased by about 8.14% to 8,693,201. The highest number of transactions was 1,317,669 on March 31, while March 30 saw the lowest number of transactions on the network for the week with 1,062,800 transactions. The increase in the number of transactions compared to last week seems to be quite positive in terms of network utilization. The increase in price and the positive correlation between the number of transfers and price throughout the weekdays should be seen as positive indicators.
Tokens Transferred
While the amount of Ethereum transferred last week was 9,638,895, 9,866,637 Ethereum was transferred this week, an increase of 2.36%. On March 28, 2,349,877 Ethereum transfers were recorded as the highest token transfer amount of the week, while on March 30, 614,570 Ethereum transfers were recorded as the lowest transfer amount of the week.
In addition to the increase in the number of transactions, the increase in the amount of Ethereum transferred also shows that transactions on the network are starting to increase, and the network is moving. This may pave the way for a positive acceleration in the Ethereum price.
Estimated Leverage Ratio
At the beginning of the 7-day period, the metric remained flat and then rose. Towards the end, it has entered a downward trend. ELR (Estimated Leverage Ratio), which had a value of 0.743 at the beginning of the process, rose in the middle of the process and reached 0.762, but retreated from the peak in the last period of the process and is currently at 0.709. The peak in this process was measured as 0.762 on March 29. A higher ELR means that participants are willing to take on more risk and usually indicates bullish conditions or expectations. It should be noted that these rises can also be caused by a decrease in reserves. When we look at Ethereum reserves, there were 18.35 million reserves at the beginning of the process, while this figure continued to decrease towards the end of the process and decreased to 18.31 million. At the same time, Ethereum’s Open Interest is seen as 22.32 billion dollars at the beginning of the process. It declined to 20.80 billion in the middle of this process. It currently stands at 20.55 billion. With all this data, the ELR metric has generally declined. The price of the asset fell from 2,070 to 1,800 dollars in parallel. The fact that the decline in the amount of reserves was smaller than the decline in the open interest rate explains the decline in the ELR ratio. As a result, the decline in both reserves and the open interest rate explains the decline in the ELR metric. This means that pessimism continues in the market and the accumulation decreases with the lack of volume-based transactions, so we can say that the selling pressure continues on the ETH side.
Legal Notice
The investment information, comments and recommendations contained in this document do not constitute investment advisory services. Investment advisory services are provided by authorized institutions on a personal basis, taking into account the risk and return preferences of individuals. The comments and recommendations contained in this document are of a general type. These recommendations may not be suitable for your financial situation and risk and return preferences. Therefore, making an investment decision based solely on the information contained in this document may not result in results that are in line with your expectations.
NOTE: All data used in Bitcoin onchain analysis is based on Cryptoqaunt.
