
Weekly Ethereum Onchain Report
Active Addresses
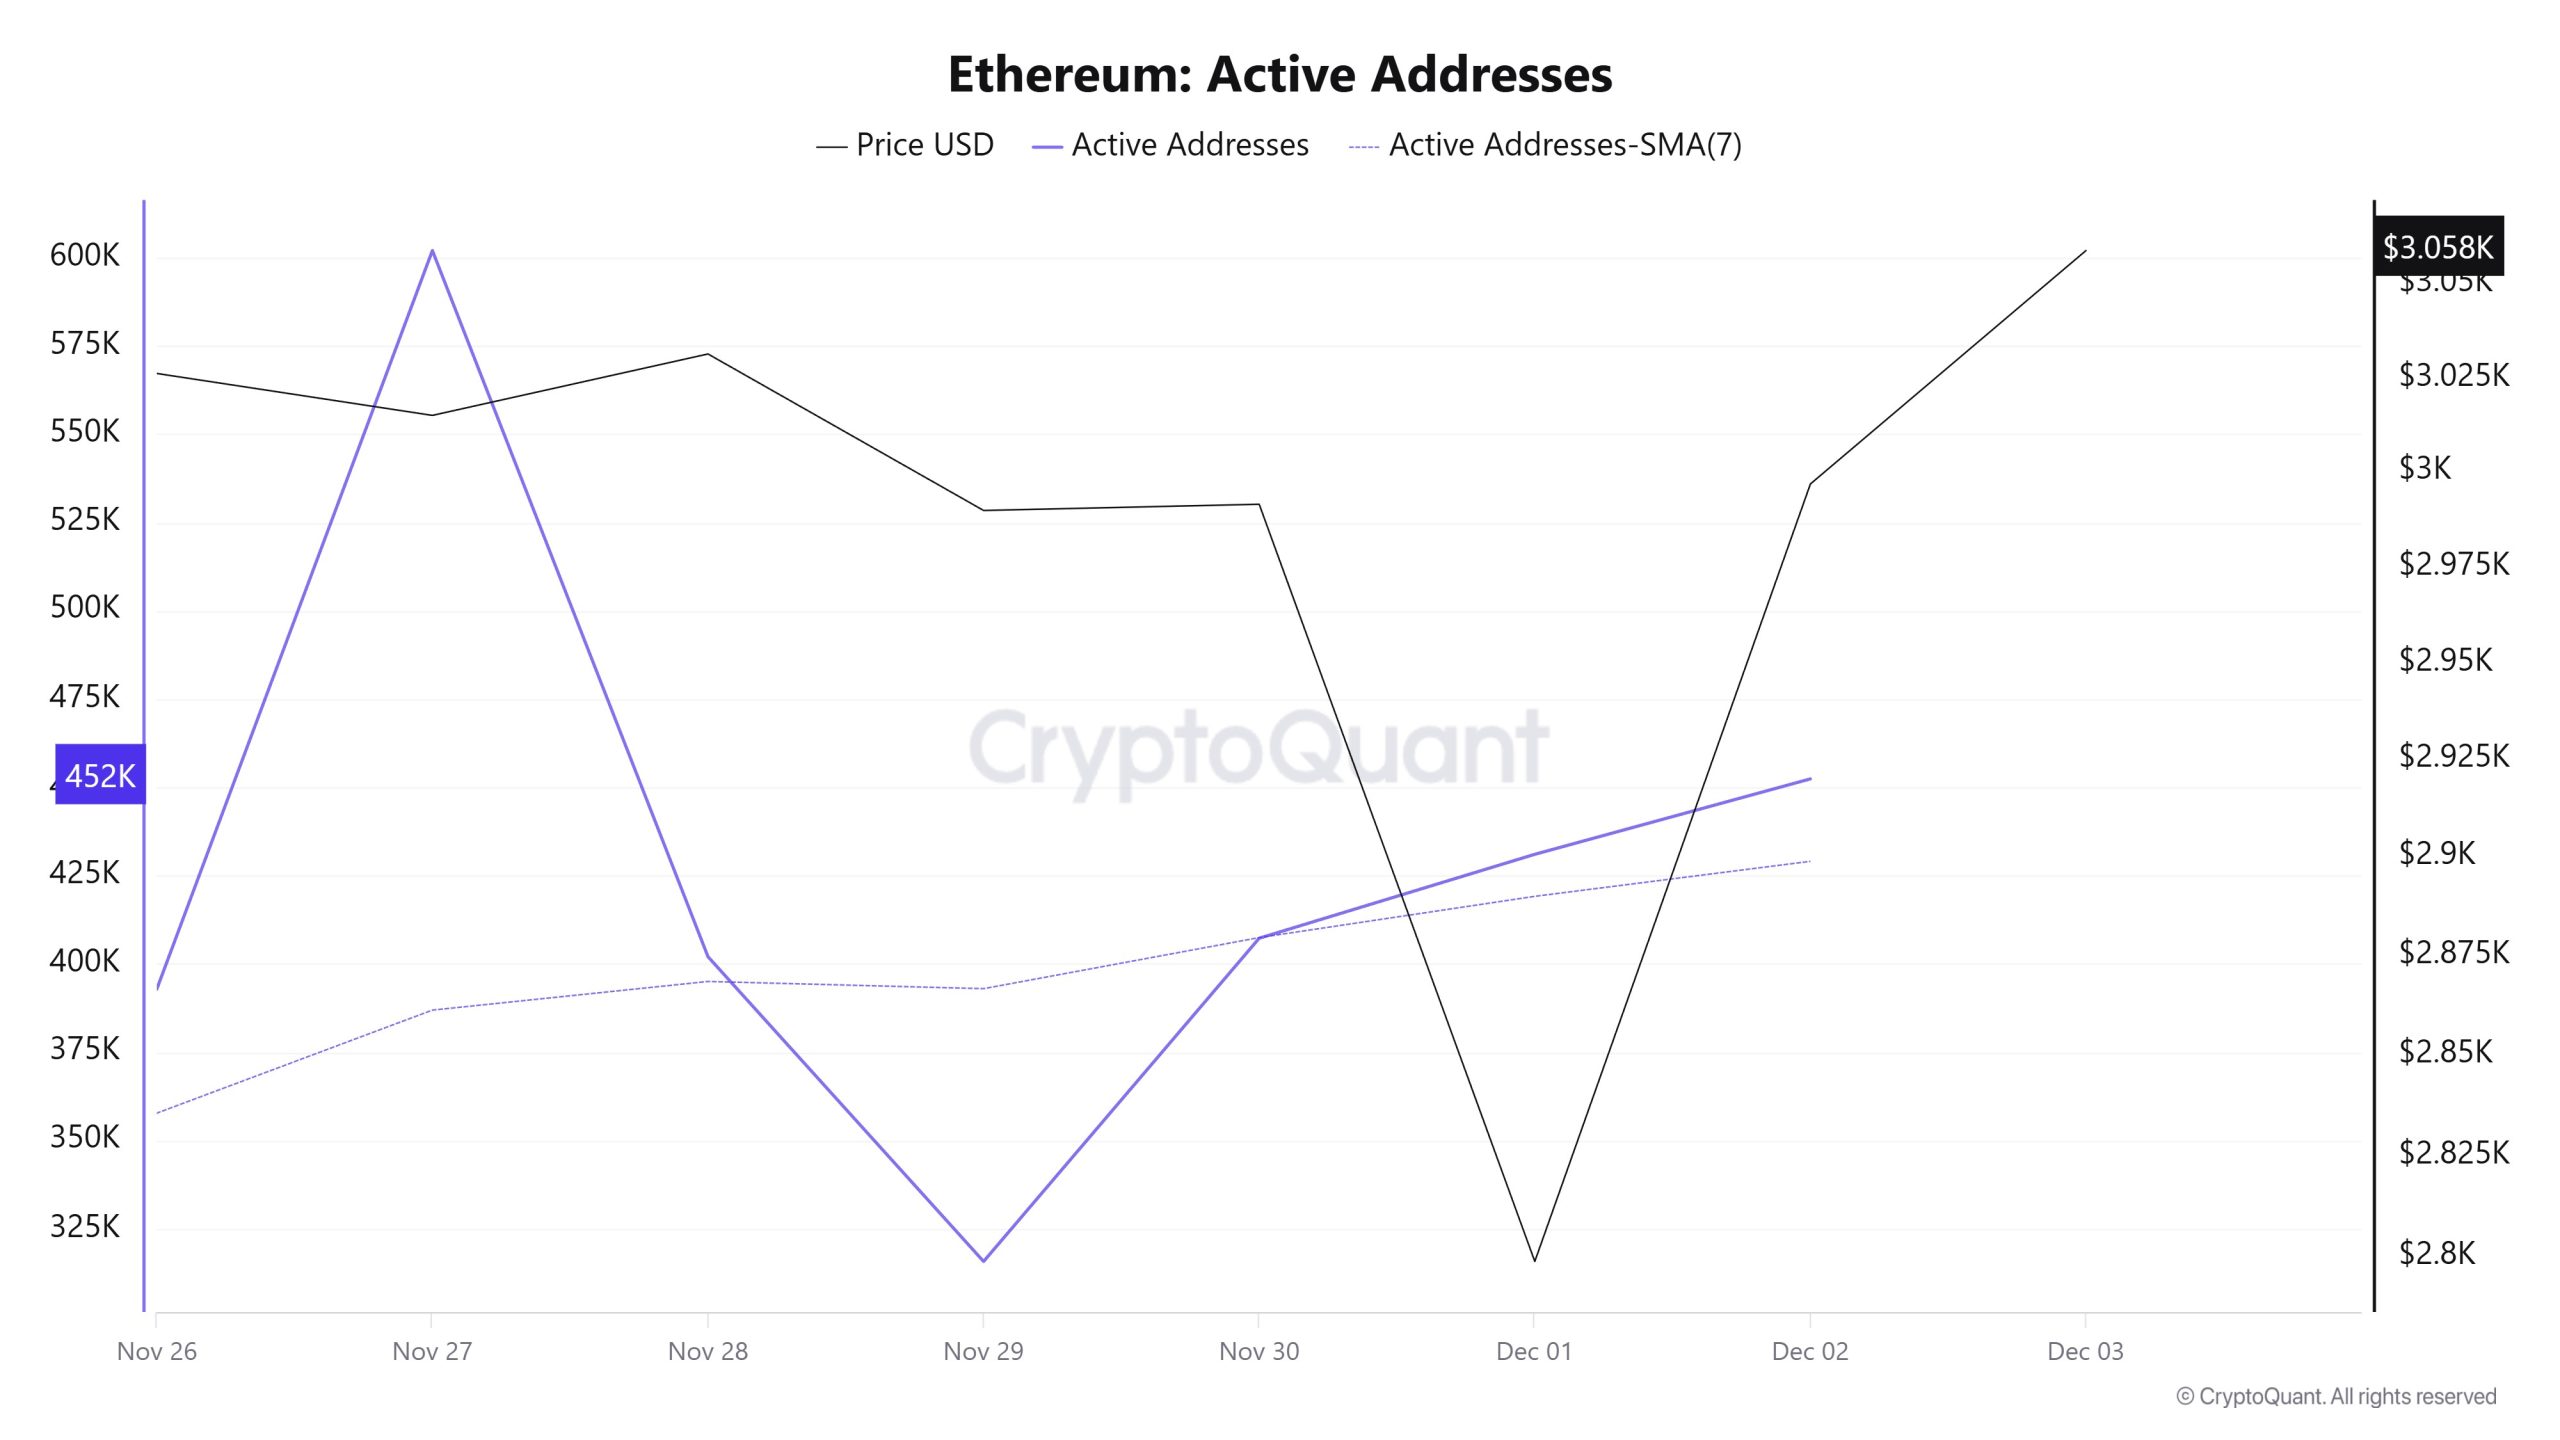
Between November 26 and December 3, a total of 601,993 active addresses were added to the Ethereum network. During this period, the Ethereum price rose from $2,798 to $3,058. Particularly on November 23, when the price reached the active address point, the number of active addresses increased, and a correlated rise was observed at the price point. When examining the 7-day simple moving average (SMA), the Ethereum price is generally seen to be moving sideways.
Active Sending Addresses
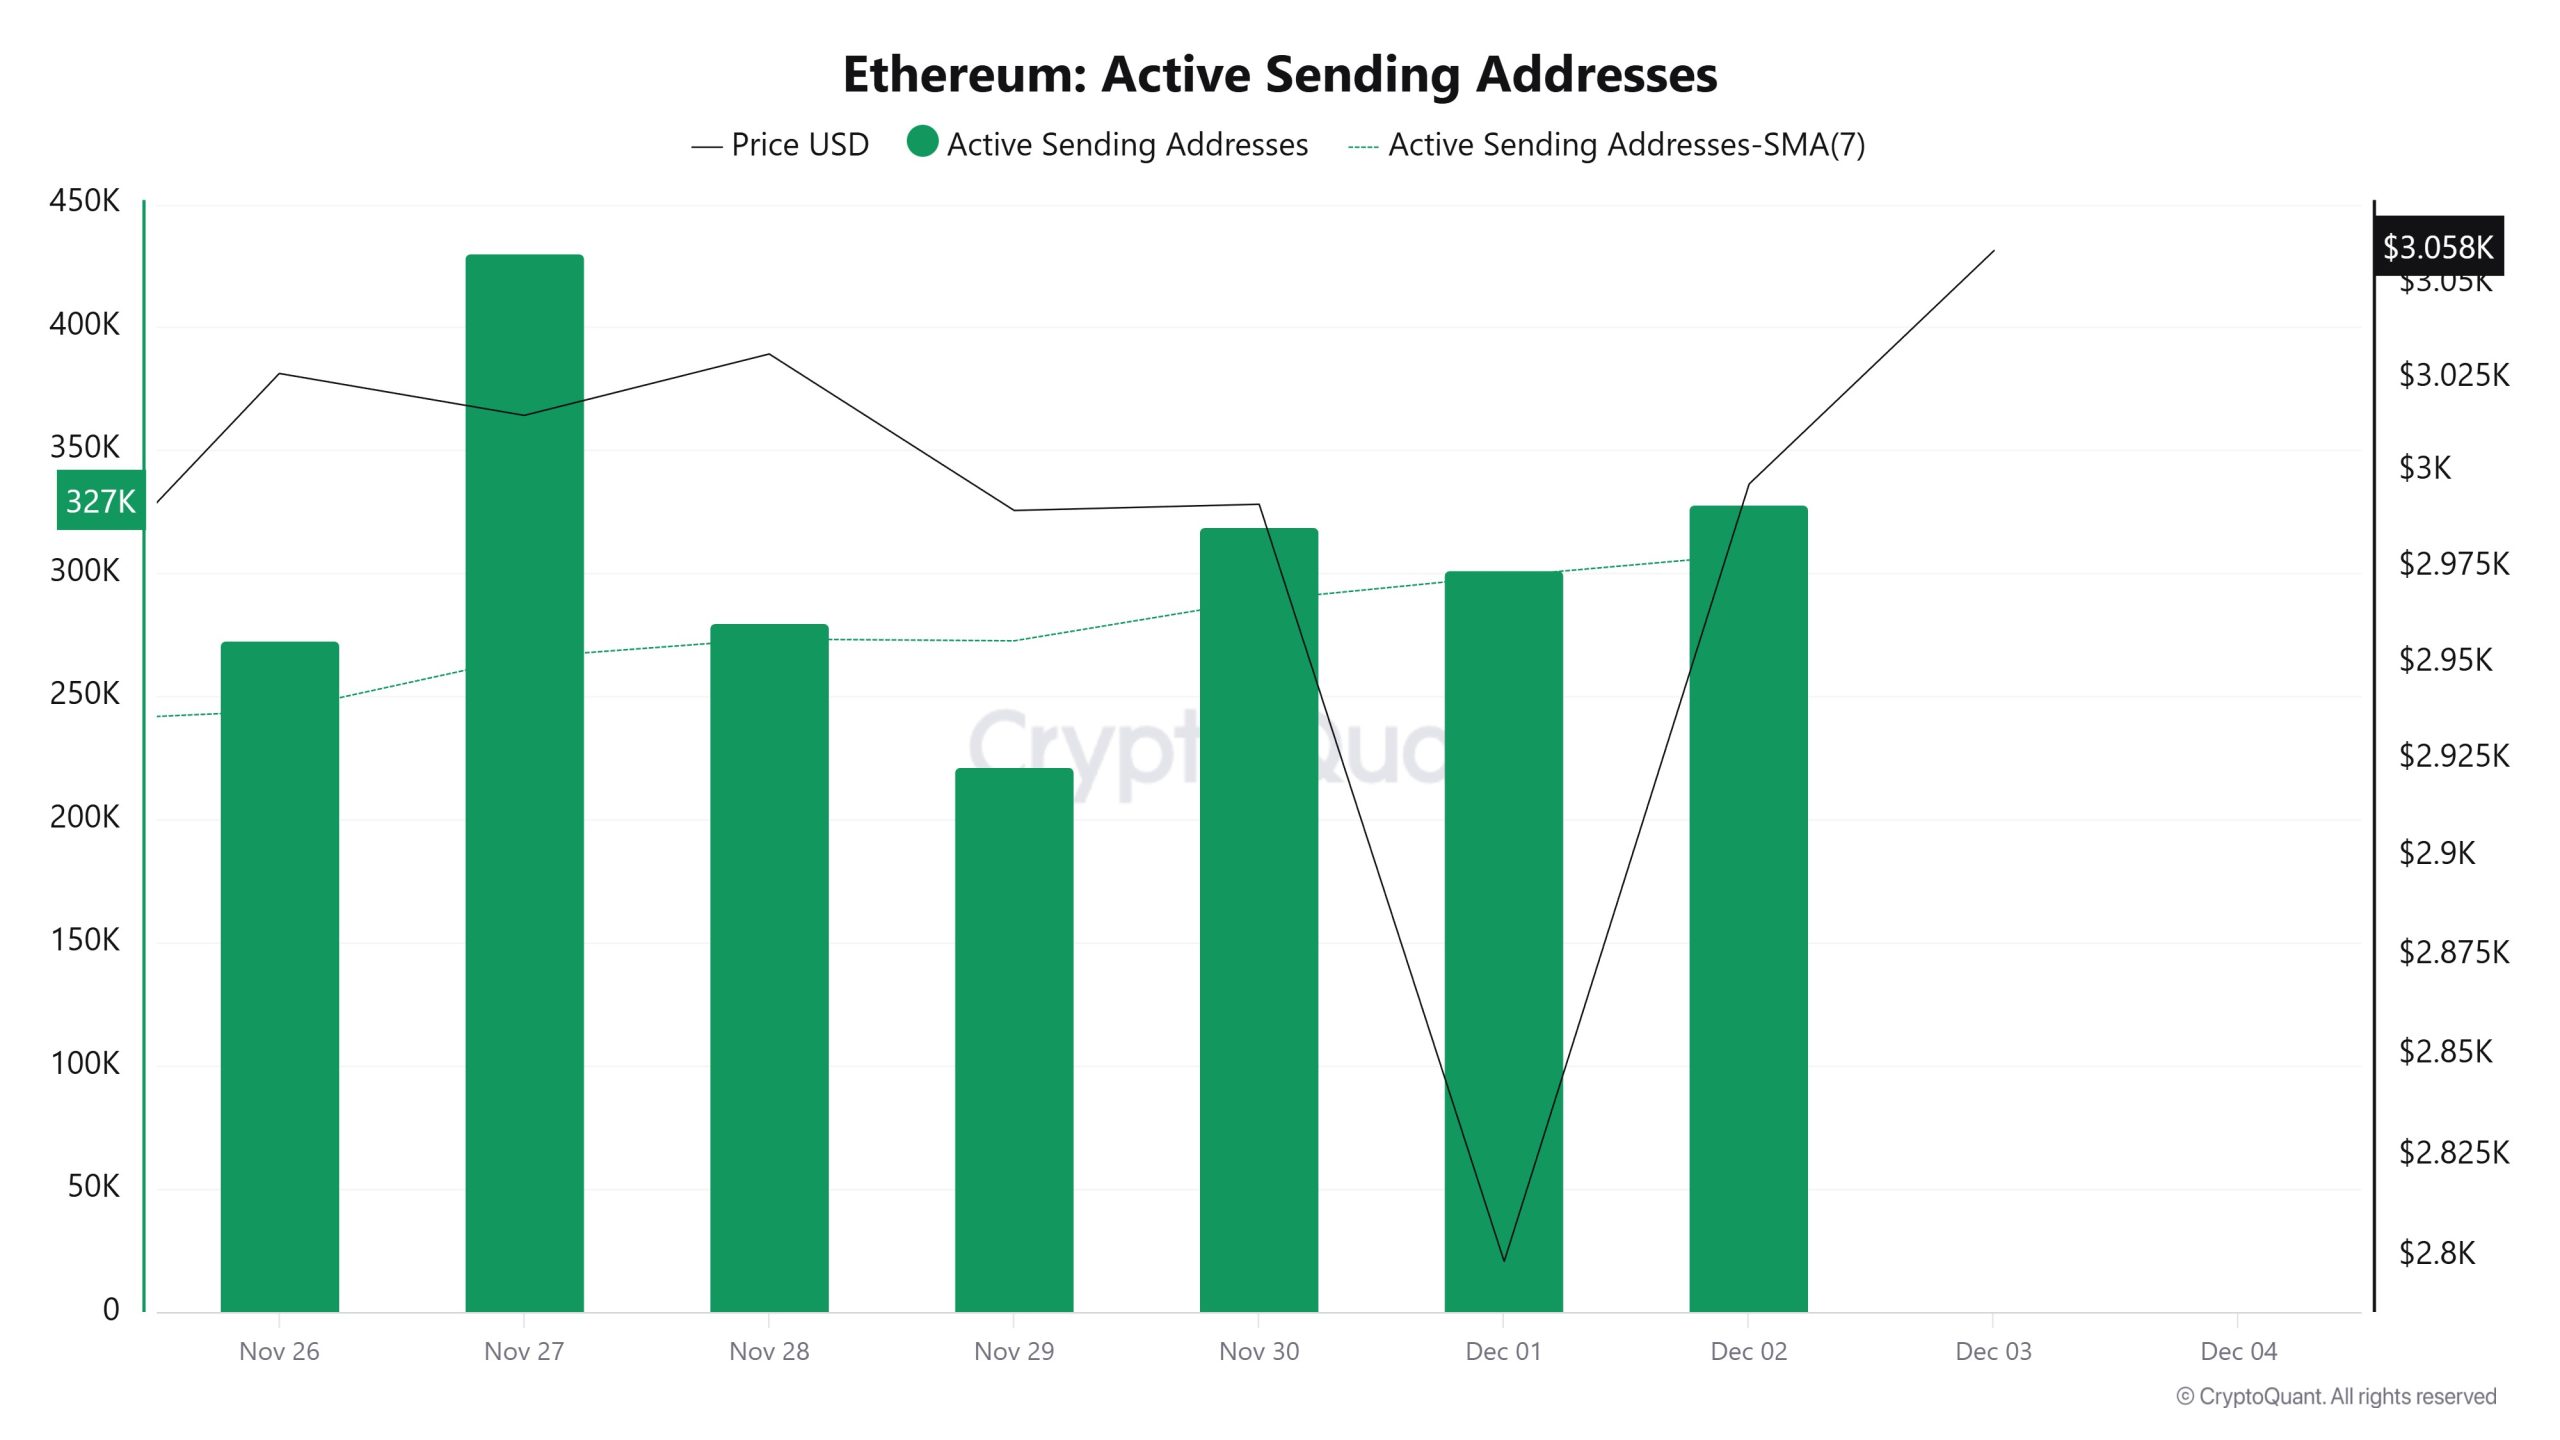
Between November 26 and December 3, high levels of active sending activity were observed at active sending addresses along with the Black Line (price line). On the day the price reached its highest level on a weekly basis, active sending addresses reached 430,122.
Active Receiving Addresses
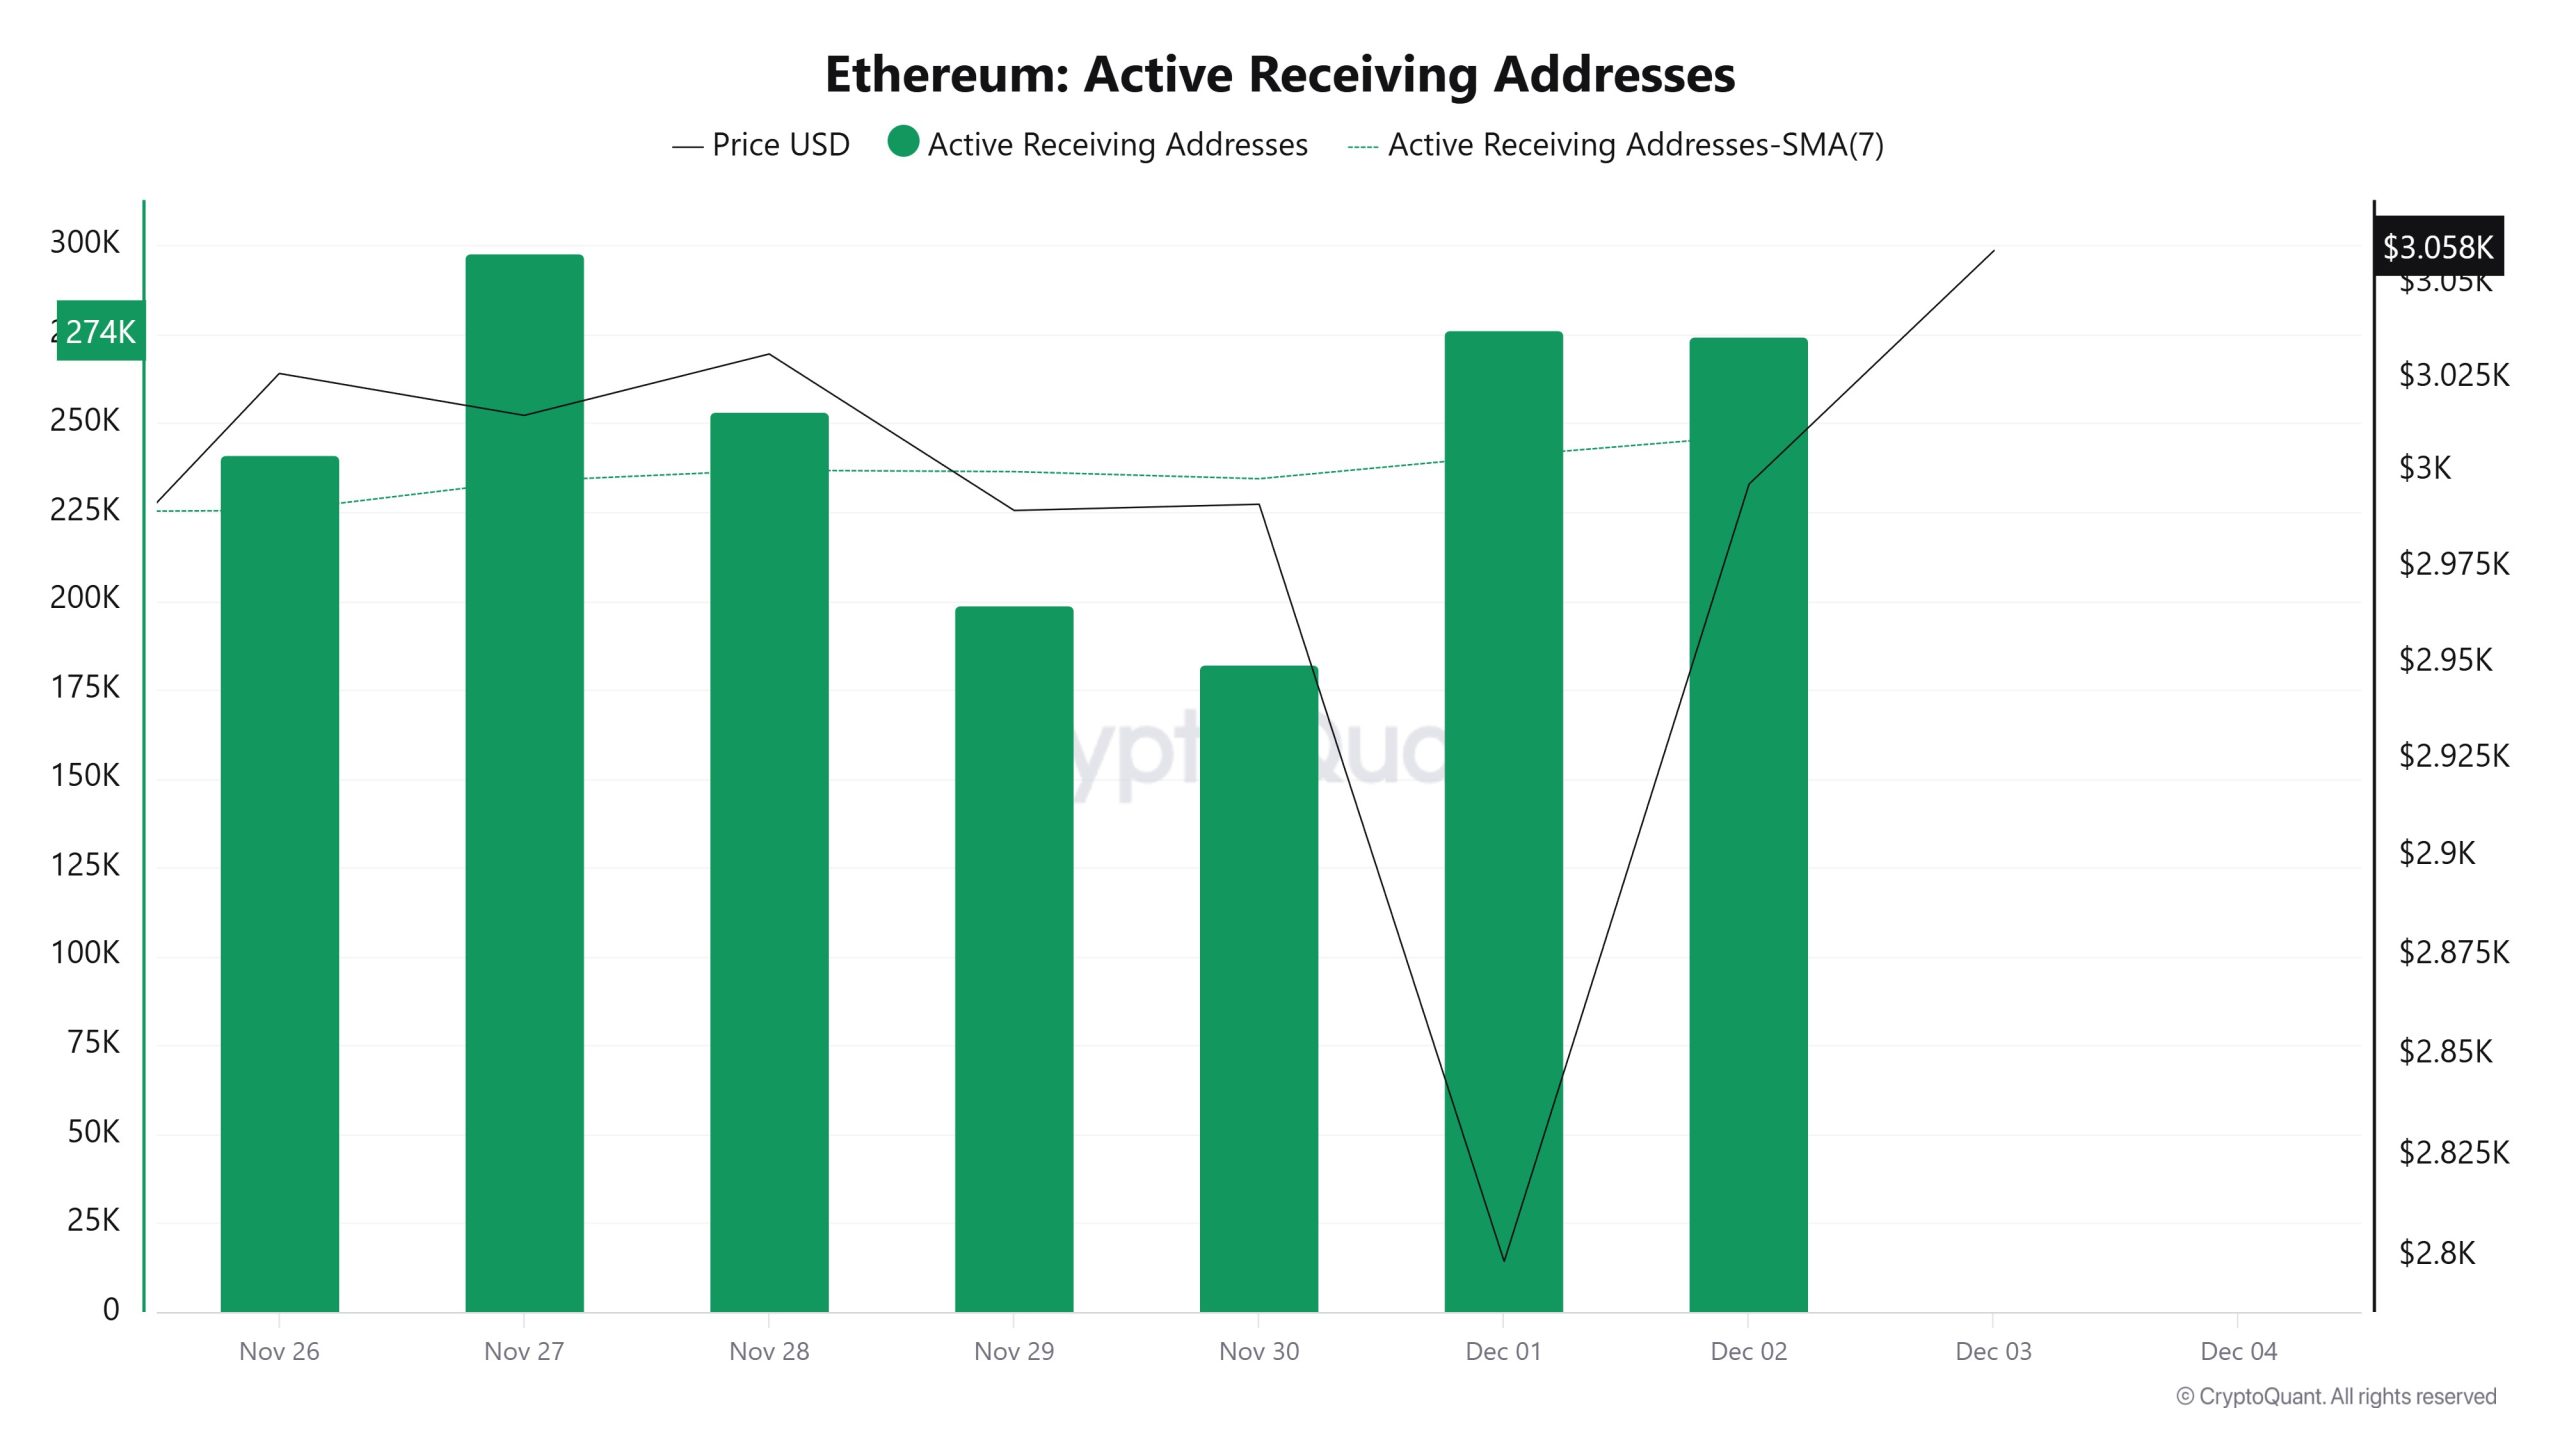
Between November 26 and December 3, while there was no significant increase in active receiving addresses, the price was seen to move downward. On the day the price reached its highest level, active receiving addresses reached 297,879, indicating an increase in purchases.
Total Value Staked
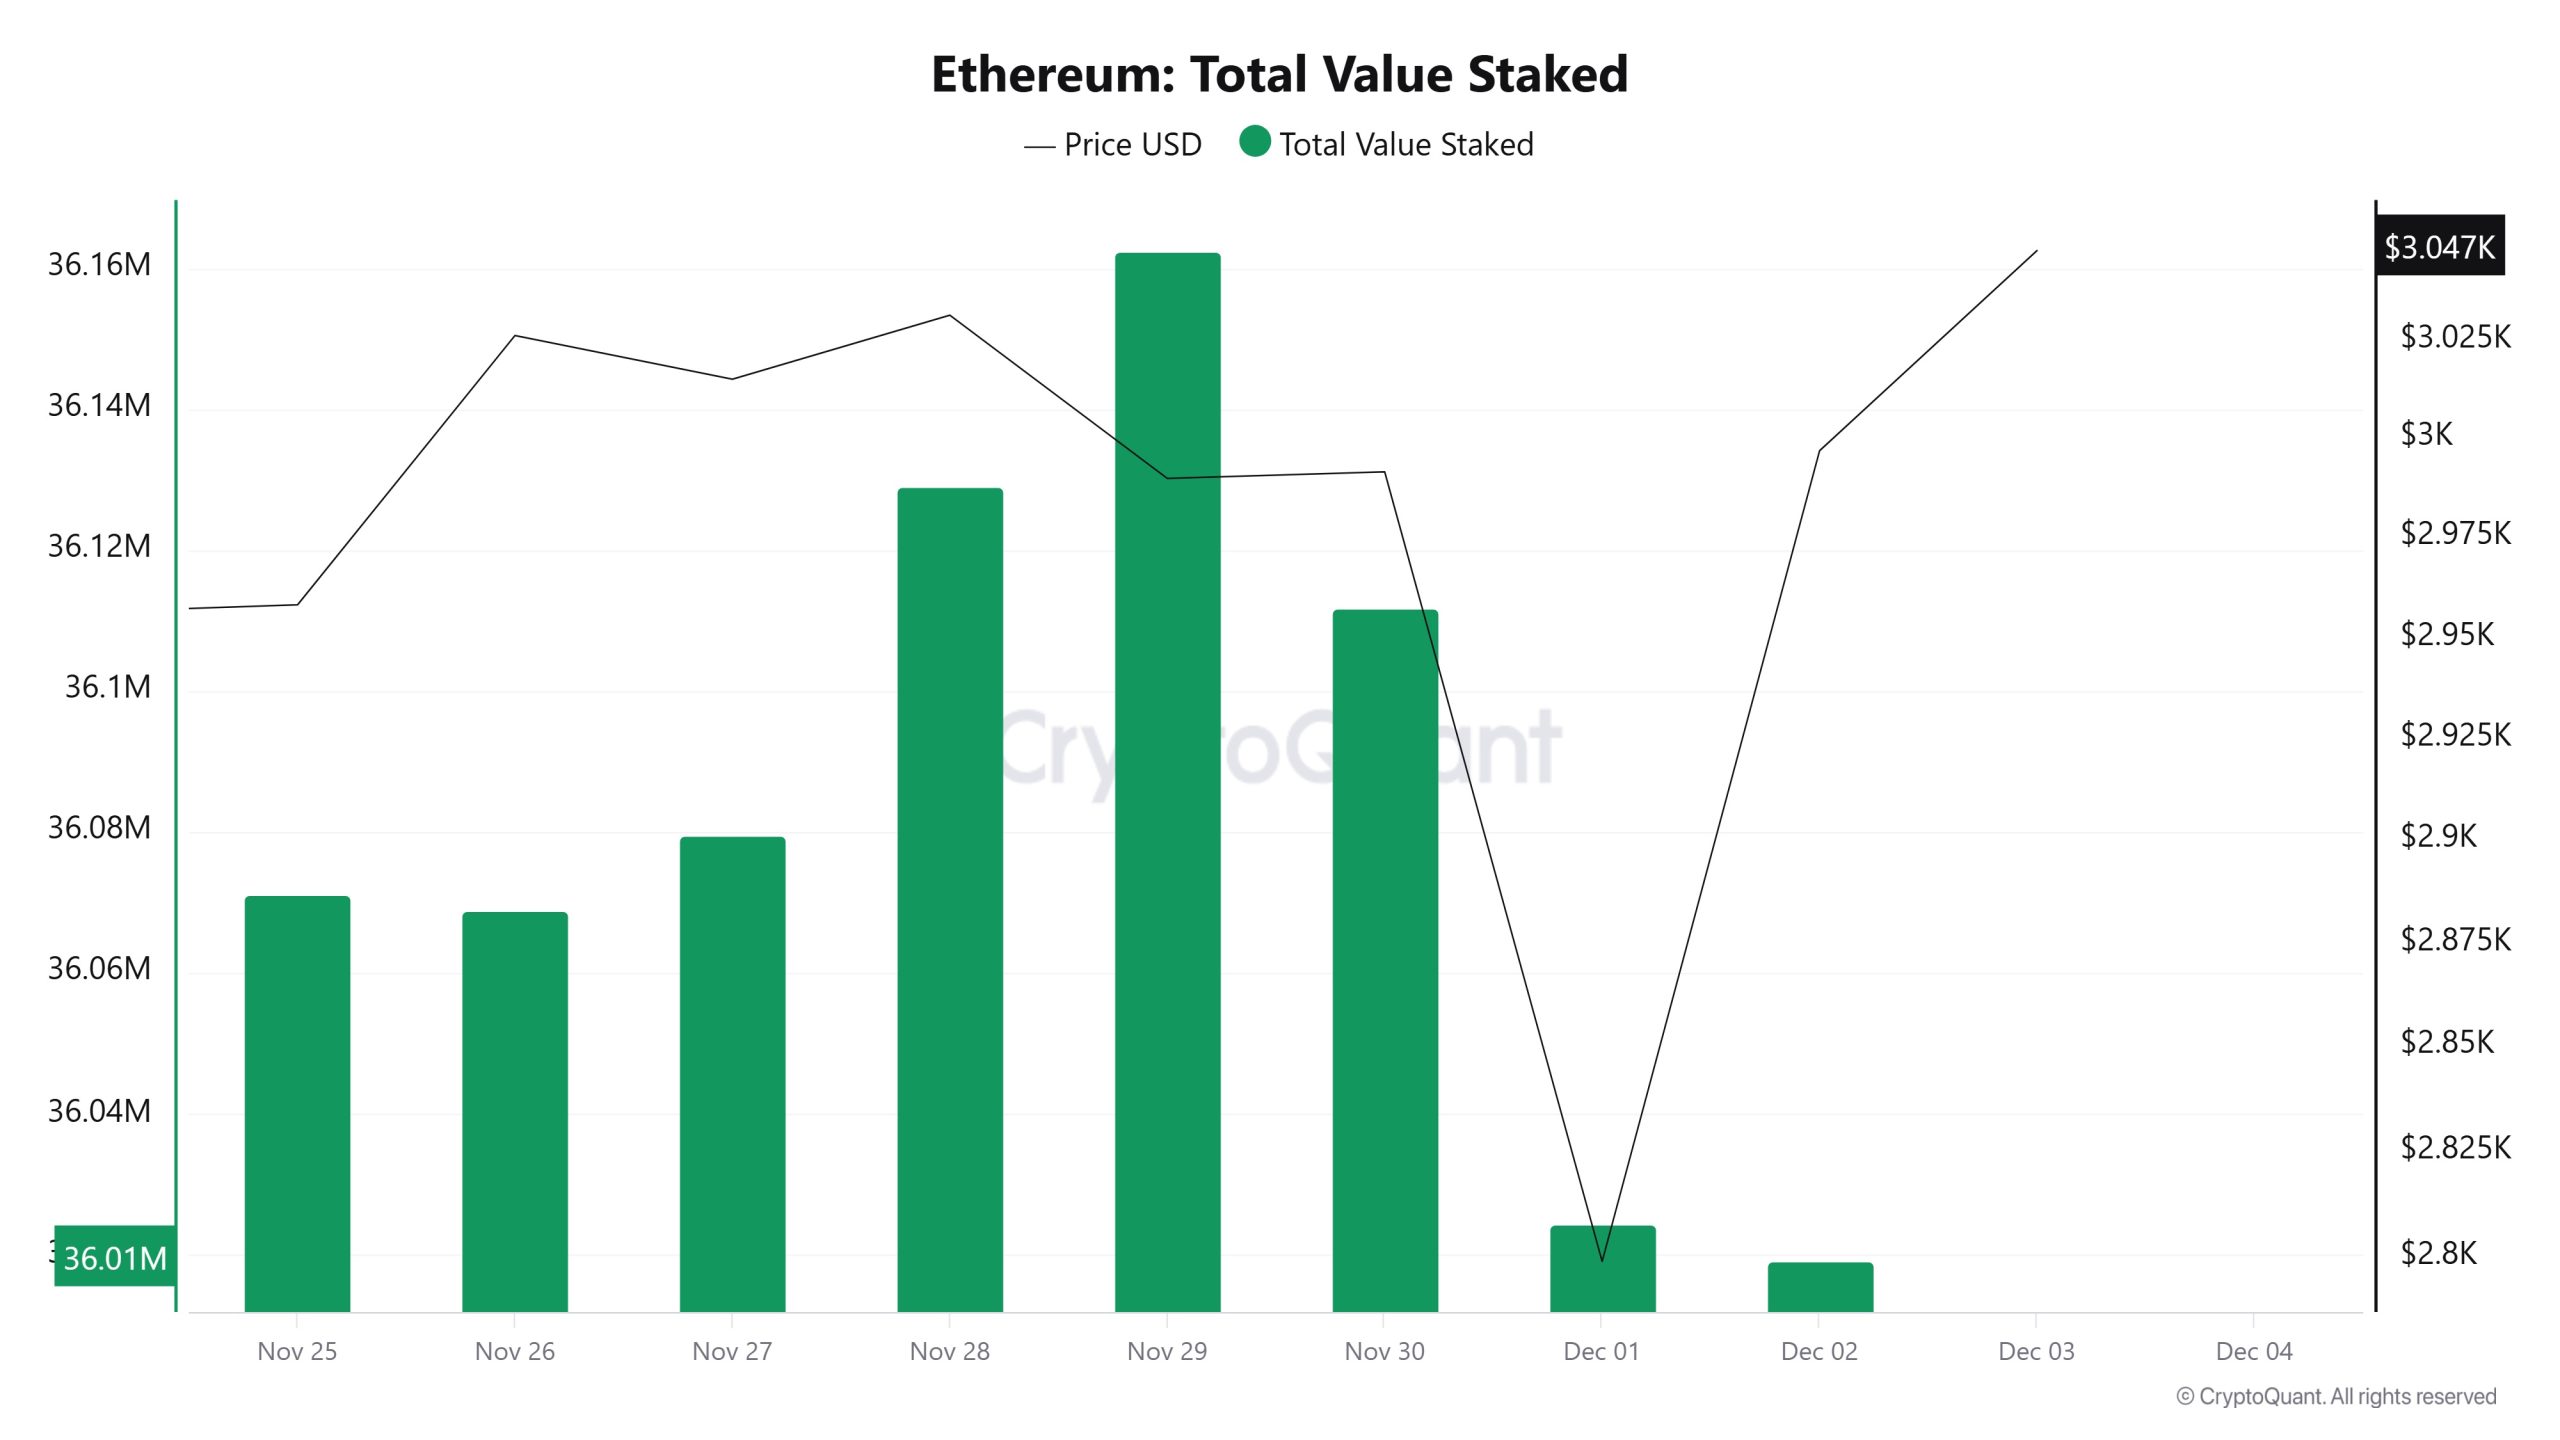
On November 26, while the ETH price was trading at $3,026, the Total Value Staked was at 36,068,917. As of December 2, while the ETH price fell to $2,996, the Total Value Staked dropped to 36,019,086, recording a 0.14% decline.
Staking Inflows
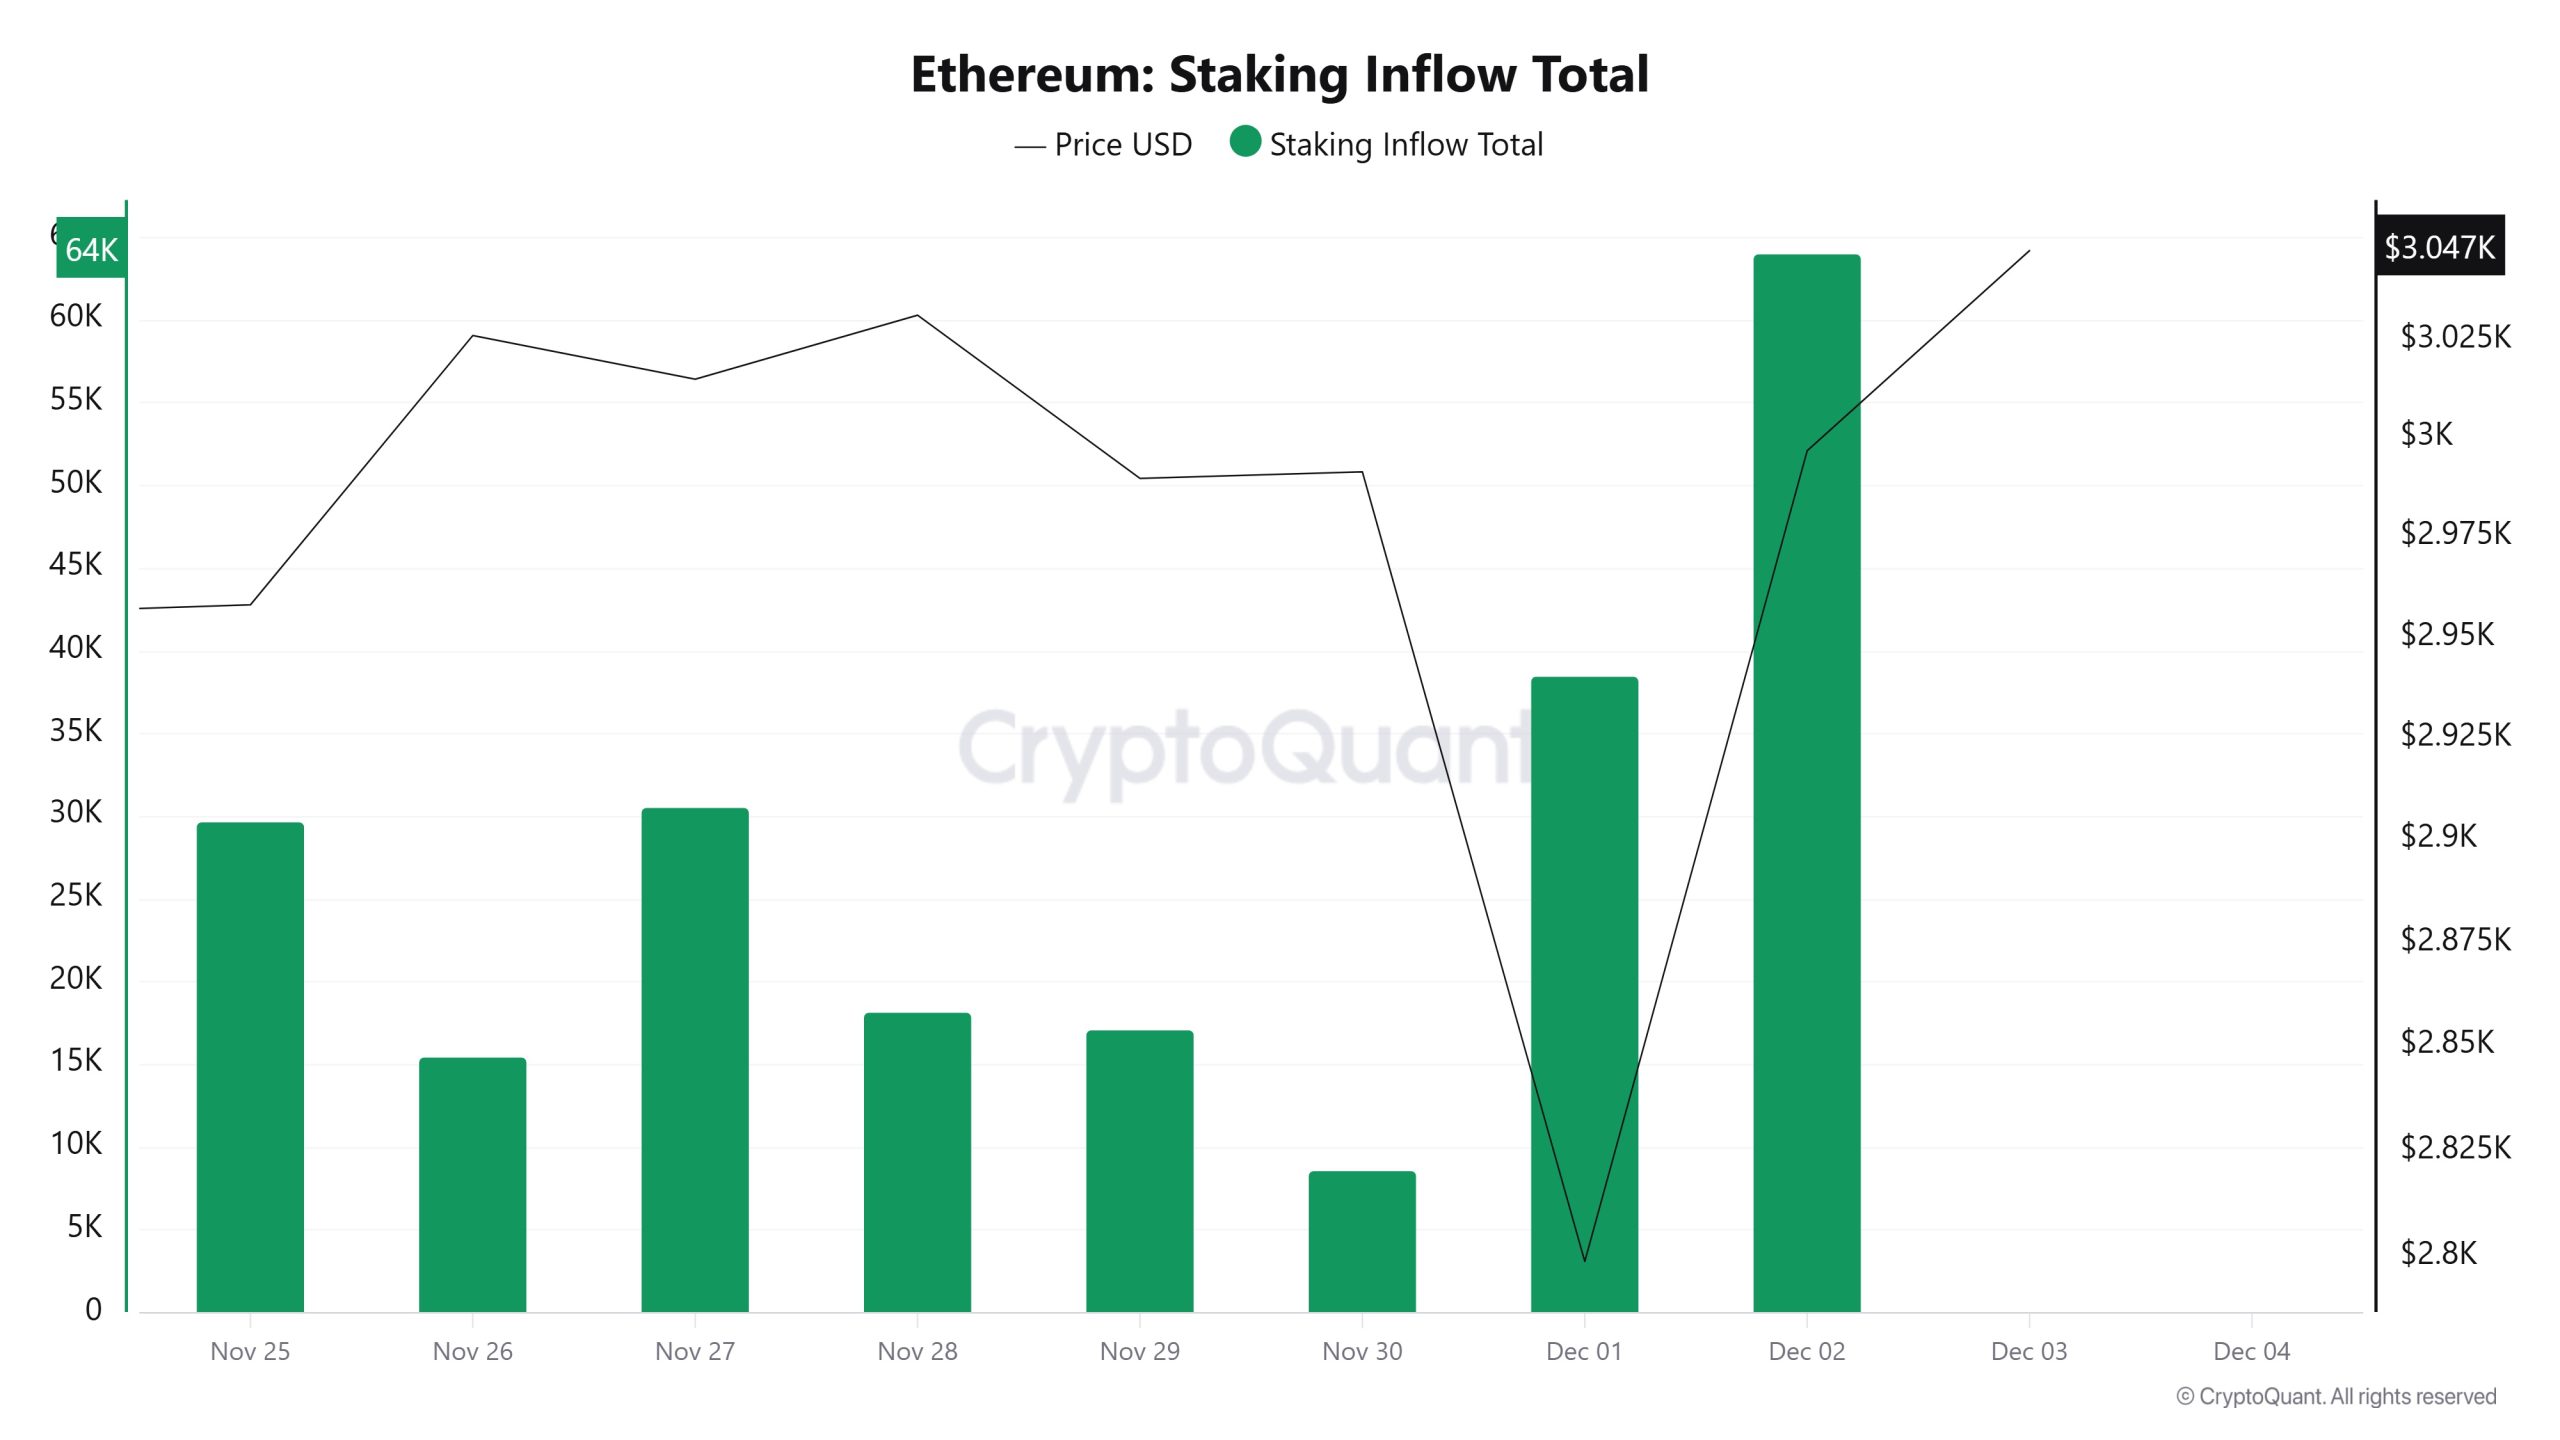
On November 26, while the ETH price was trading at $3,026, Staking Inflow was at 15,517. As of December 2, while the ETH price fell to $2,996, Staking Inflow rose to 64,032, recording a 312.66% increase.
Derivatives
Open Interest
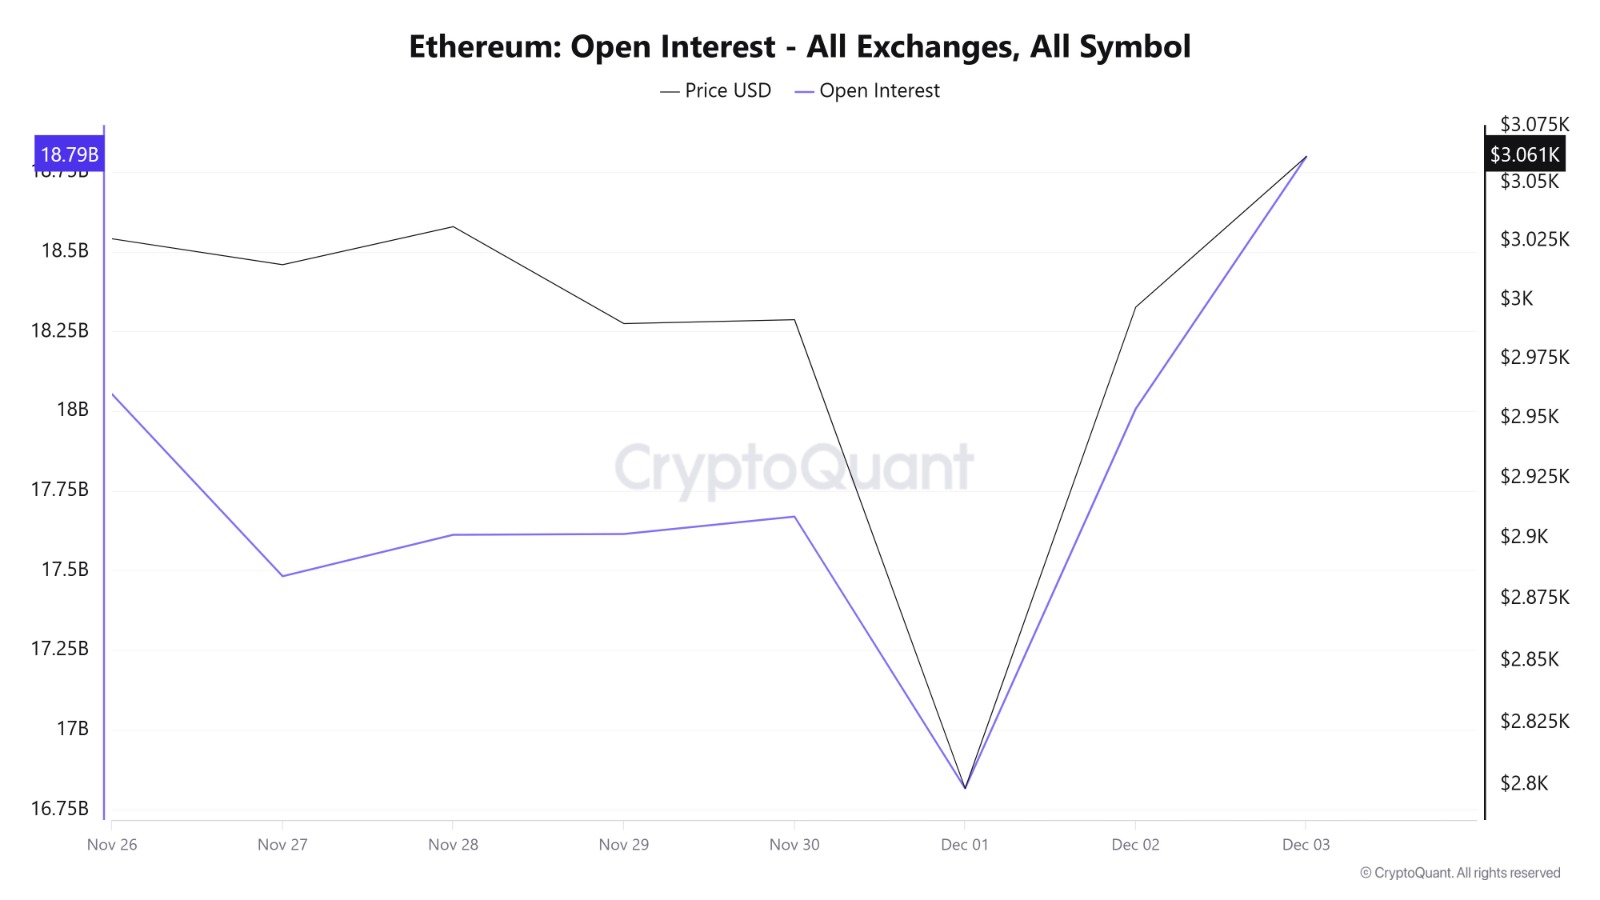
On November 26, when the price was at $3,026, open interest was approximately $18.05 billion. On November 27-28, while the price ranged between $3,014 and $3,031, open interest gradually declined to $17.48 billion. During the November 29-30 period, the price remained flat in the $2,989–$2,991 range, while open interest stabilized around $17.61–$17.66 billion. On December 1, as the price fell to $2,798, open interest experienced a significant decline, dropping to $16.81 billion. On December 2, there was a strong recovery in both price and open interest. The ETH price rose to $2,996, while open interest climbed back to the $18.0 billion level. Overall, the chart shows that position closures increased on down days and that open interest moved in line with the price.
Funding Rate
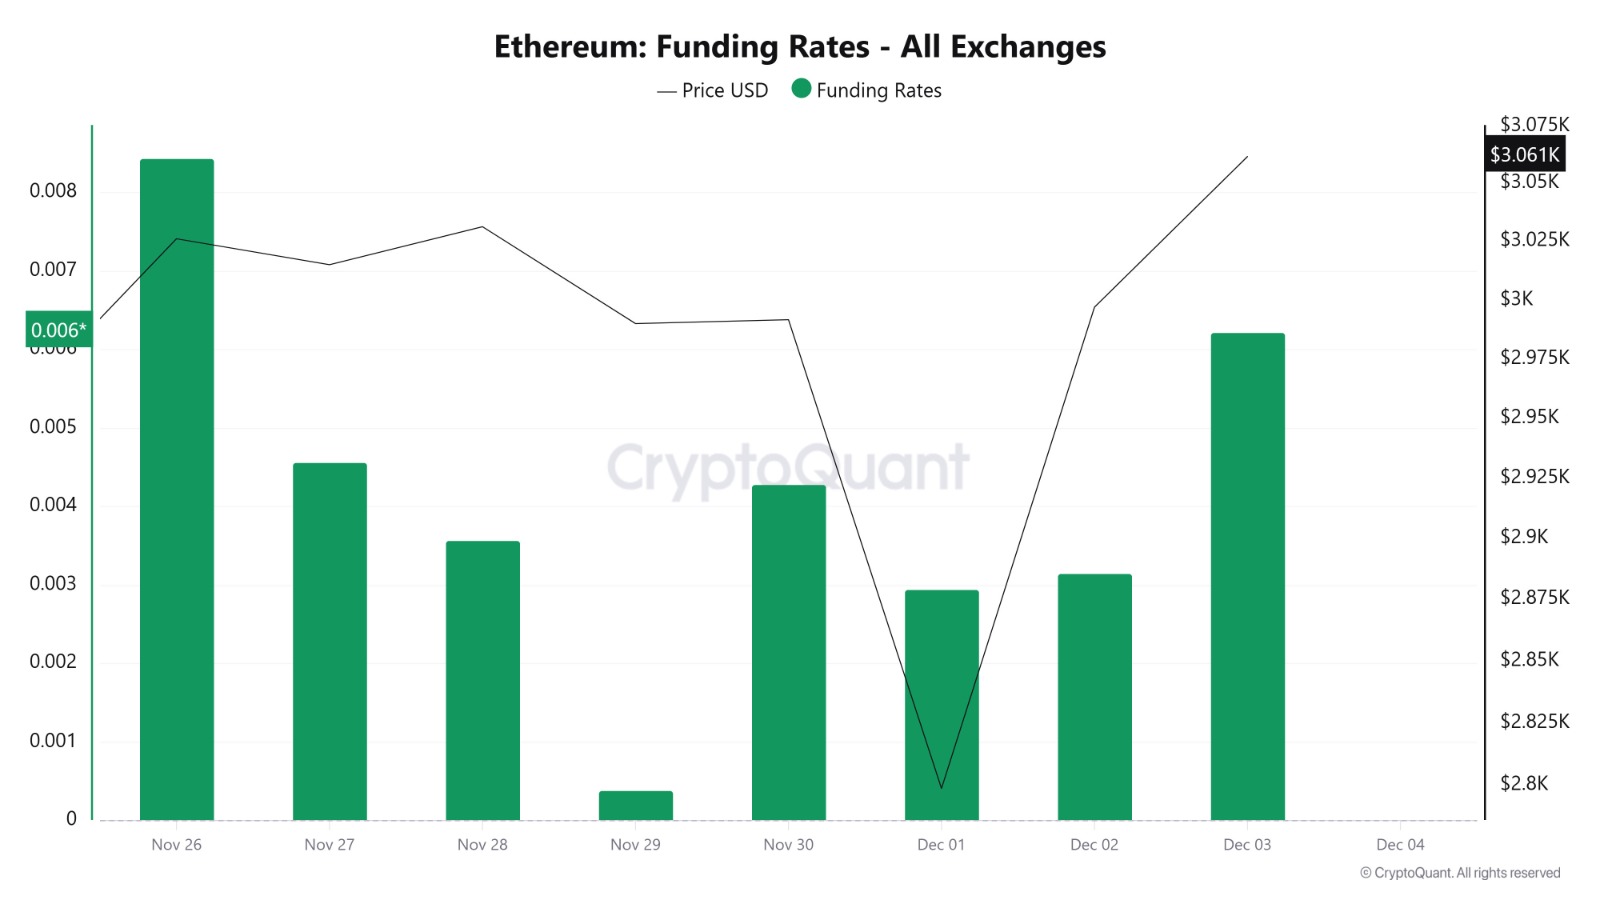
Looking at Ethereum’s funding rate data, on November 26, rates rose to 0.0084 while the ETH price traded at $3,026. Although the funding rate remained positive on November 27-28, it declined to the 0.0035-0.0045 range, and the ETH price traded in the $3,014-3,031 range. On November 29, the funding rate fell significantly to 0.00038, but the price remained flat at around $2,989. On November 30, the funding rate strengthened again, rising to 0.0042, while the price rose to $2,991. During the December 1-2 period, the funding rate remained positive, stabilizing in the 0.0029-0.0031 range. During the same period, the price rose from $2,798 to $2,996. The overall picture showed that the positive trend in the funding rate indicated sustained long-term demand, that market sentiment remained largely intact even during short-term declines, and that changes in the funding rate progressed in line with price movements.
Long & Short Liquidations
With the ETH price falling from $3,026 to $2,798, a total of approximately $272.7 million in long positions were liquidated. During the same time period, nearly $278 million in short positions were also liquidated.
| Date | Long Volume (Million $) | Short Volume (Million $) |
|---|---|---|
| November 26 | 19.05 | 41.12 |
| November 27 | 18.53 | 18.71 |
| November 28 | 36.75 | 42.74 |
| November 29 | 24.65 | 6.18 |
| November 30 | 16.15 | 18.42 |
| December 1 | 138.28 | 43.13 |
| December 2 | 19.36 | 107.78 |
| Total | 272.77 | 278.08 |
Supply Distribution
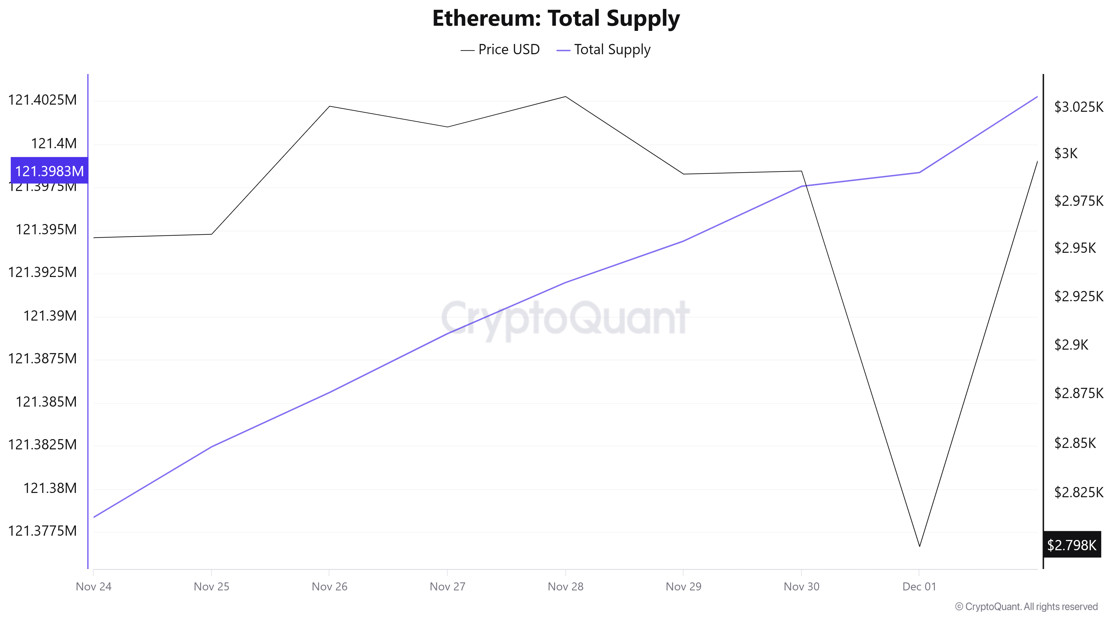
Total Supply: Reached 121,378,359 units, an increase of approximately 0.01648% compared to last week.
New Supply: The amount of ETH produced this week was 20,004.
Velocity: Last week’s velocity of 10.07 was 10.05 as of December 1.
| Wallet Category | 11/24/2025 | 12/01/2025 | Change (%) |
|---|---|---|---|
| 100 – 1k ETH | 8.4106M | 8.5197M | 1.2969 |
| 1k – 10k ETH | 11.9204M | 12.0636M | 1.2016 |
| 10k – 100k ETH | 21.0555M | 20.9975M | −0.2755% |
| 100k+ ETH | 4.3046M | 4.5704M | 6.1755 |
According to the latest weekly data, the Ethereum wallet distribution presented a mixed picture. The total balance of wallets in the 100–1k ETH range increased, indicating a slight accumulation trend in this segment. Similarly, addresses in the 1k–10k ETH range also saw an increase, recording a limited rise in this group. In contrast, wallets in the 10k–100k ETH band experienced a slight decline, drawing attention to a partial unwinding in this segment. The strongest movement was seen in large wallets holding 100k+ ETH; the significant increase in this group indicates that high-volume investors are buying. The overall picture suggests that, despite movements in different directions across segments, the general trend is neutral.
Exchange Supply Ratio
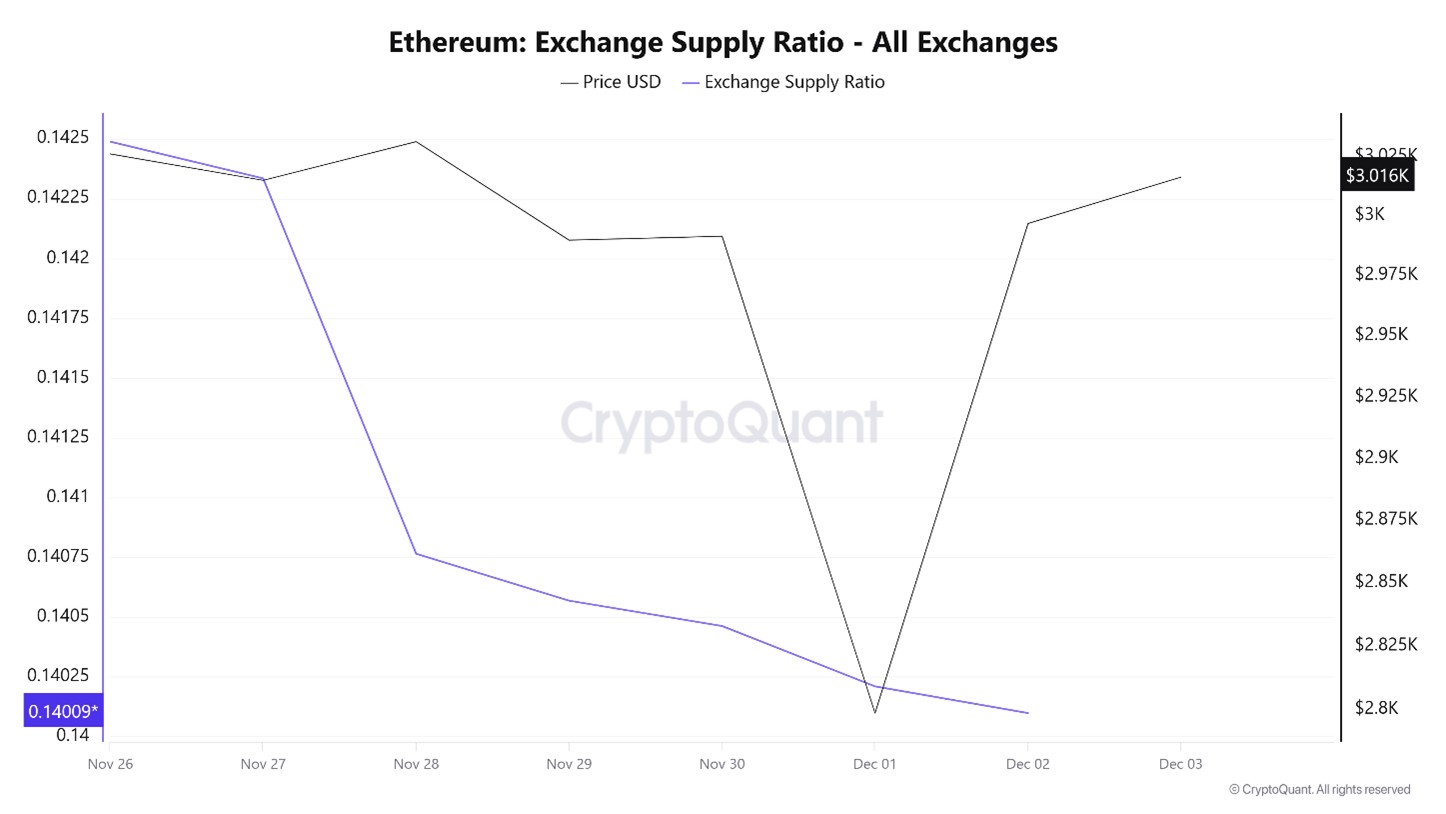
Between November 26 and December 3, the Ethereum Exchange Supply Ratio fell from 0.14076462 to 0.14020965. During this period, the price of Ethereum fell from $3.014 to $2.996. Particularly between December 1 and December , when the price and Exchange Supply Ratio intersected, the correlation between the price and Exchange Supply Ratio turned positive. Along with the price decline, the amount of Ethereum supplied to exchanges decreased, possibly indicating that long-term investors are turning to selling their Ethereum holdings. It appears that a general decline in the Ethereum price may prevail.
Exchange Reserve
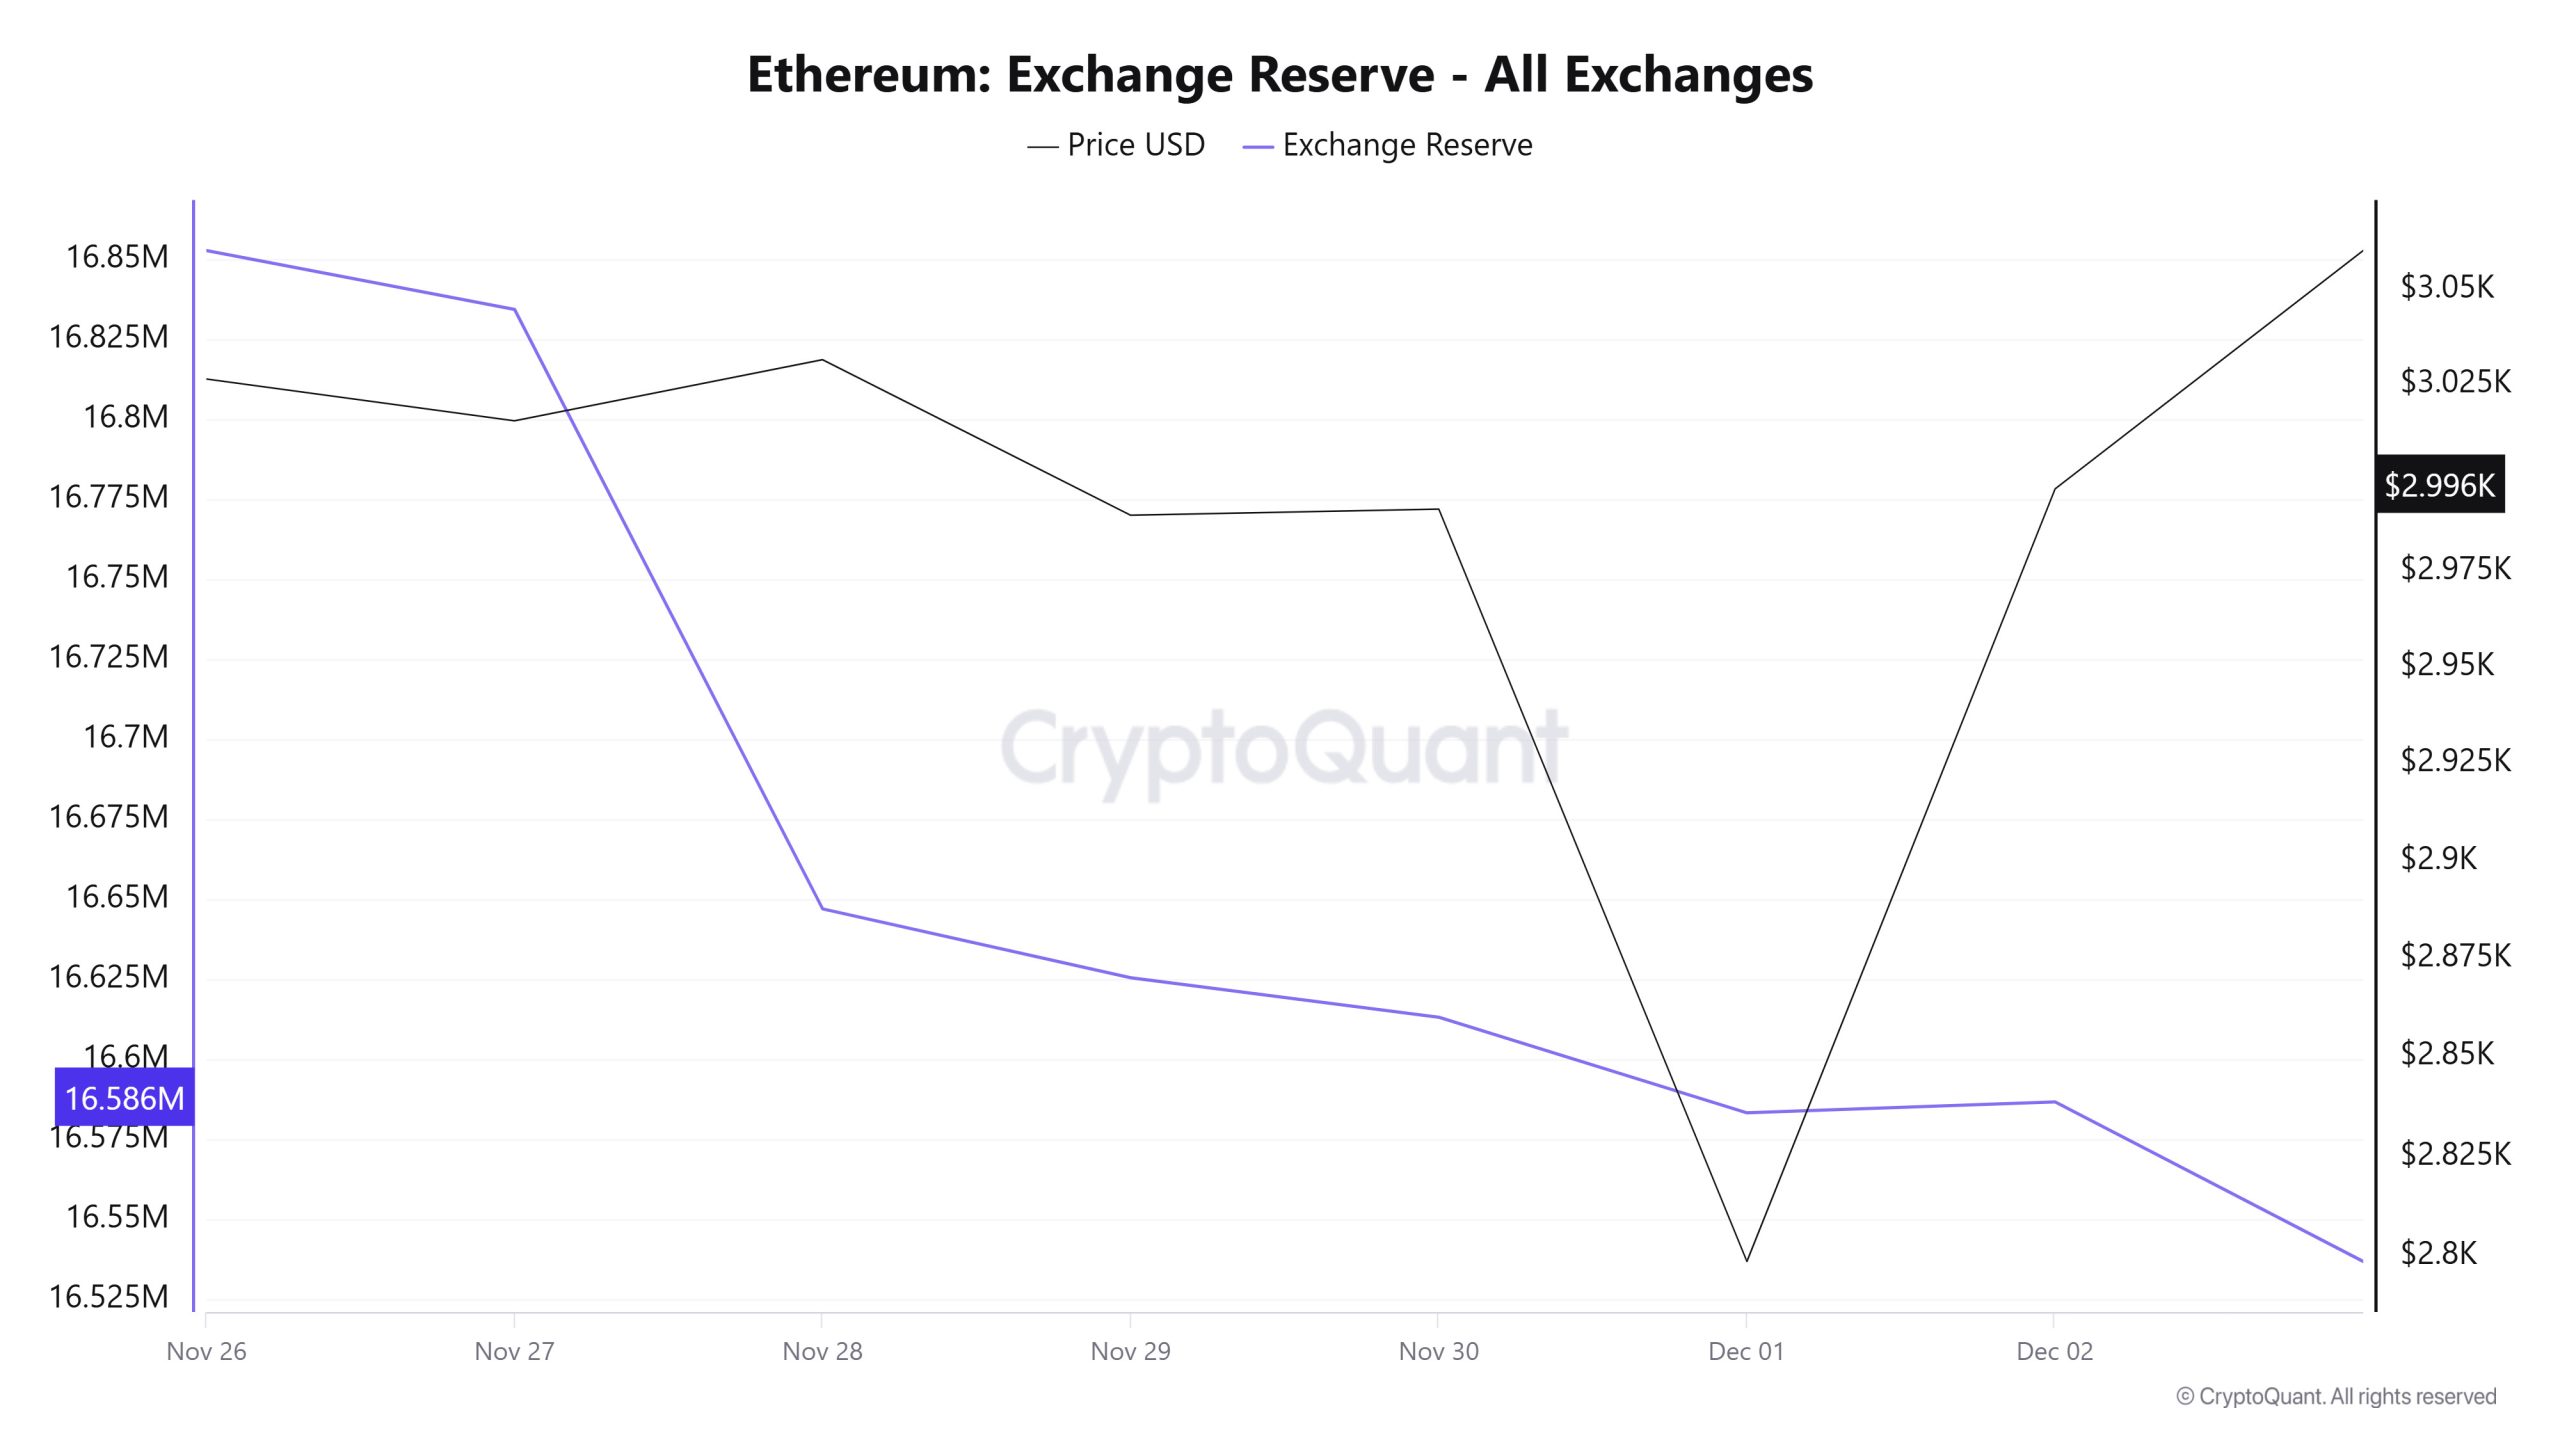
Between November 26 and December 2, 2025, Ethereum reserves on exchanges fell from 16,821,342 ETH to 16,586,586 ETH, resulting in a net outflow of 234,756 ETH. During this period, reserves decreased by approximately 1.40%, while the ETH price rose from $2,958 to $2,997, gaining approximately 1.3% in value. Despite the rise in the ETH price, the continued decline in reserves indicated that investors continued to withdraw their ETH from exchanges rather than sell. The acceleration of withdrawals, especially as the ETH price approached the $2,800 level, showed that the decline did not create selling pressure on investors. Price fluctuations may continue in the short term, but as the decline in reserves continues to reduce supply, this situation may support the ETH price.
| Date | November 26 | November 27 | November 28 | November 29 | November 30 | 01-Dec | 02-Dec |
|---|---|---|---|---|---|---|---|
| Exchange Inflow | 880,214 | 504,596 | 728,263 | 393,507 | 189,567 | 1,152,491 | 921,854 |
| Exchange Outflow | 848,972 | 522,989 | 915,570 | 415,019 | 201,904 | 1,182,359 | 918,434 |
| Exchange Netflow | 31,241 | -18,393 | -187,307 | -21,512 | -12,337 | -29,868 | 3,420 |
| Exchange Reserve | 16,852,584 | 16,834,191 | 16,646,884 | 16,625,371 | 16,613,034 | 16,583,166 | 16,586,586 |
| ETH Price | 2,958 | 3,015 | 3,031 | 2,990 | 2,991 | 2,799 | 2,997 |
Fees and Revenues
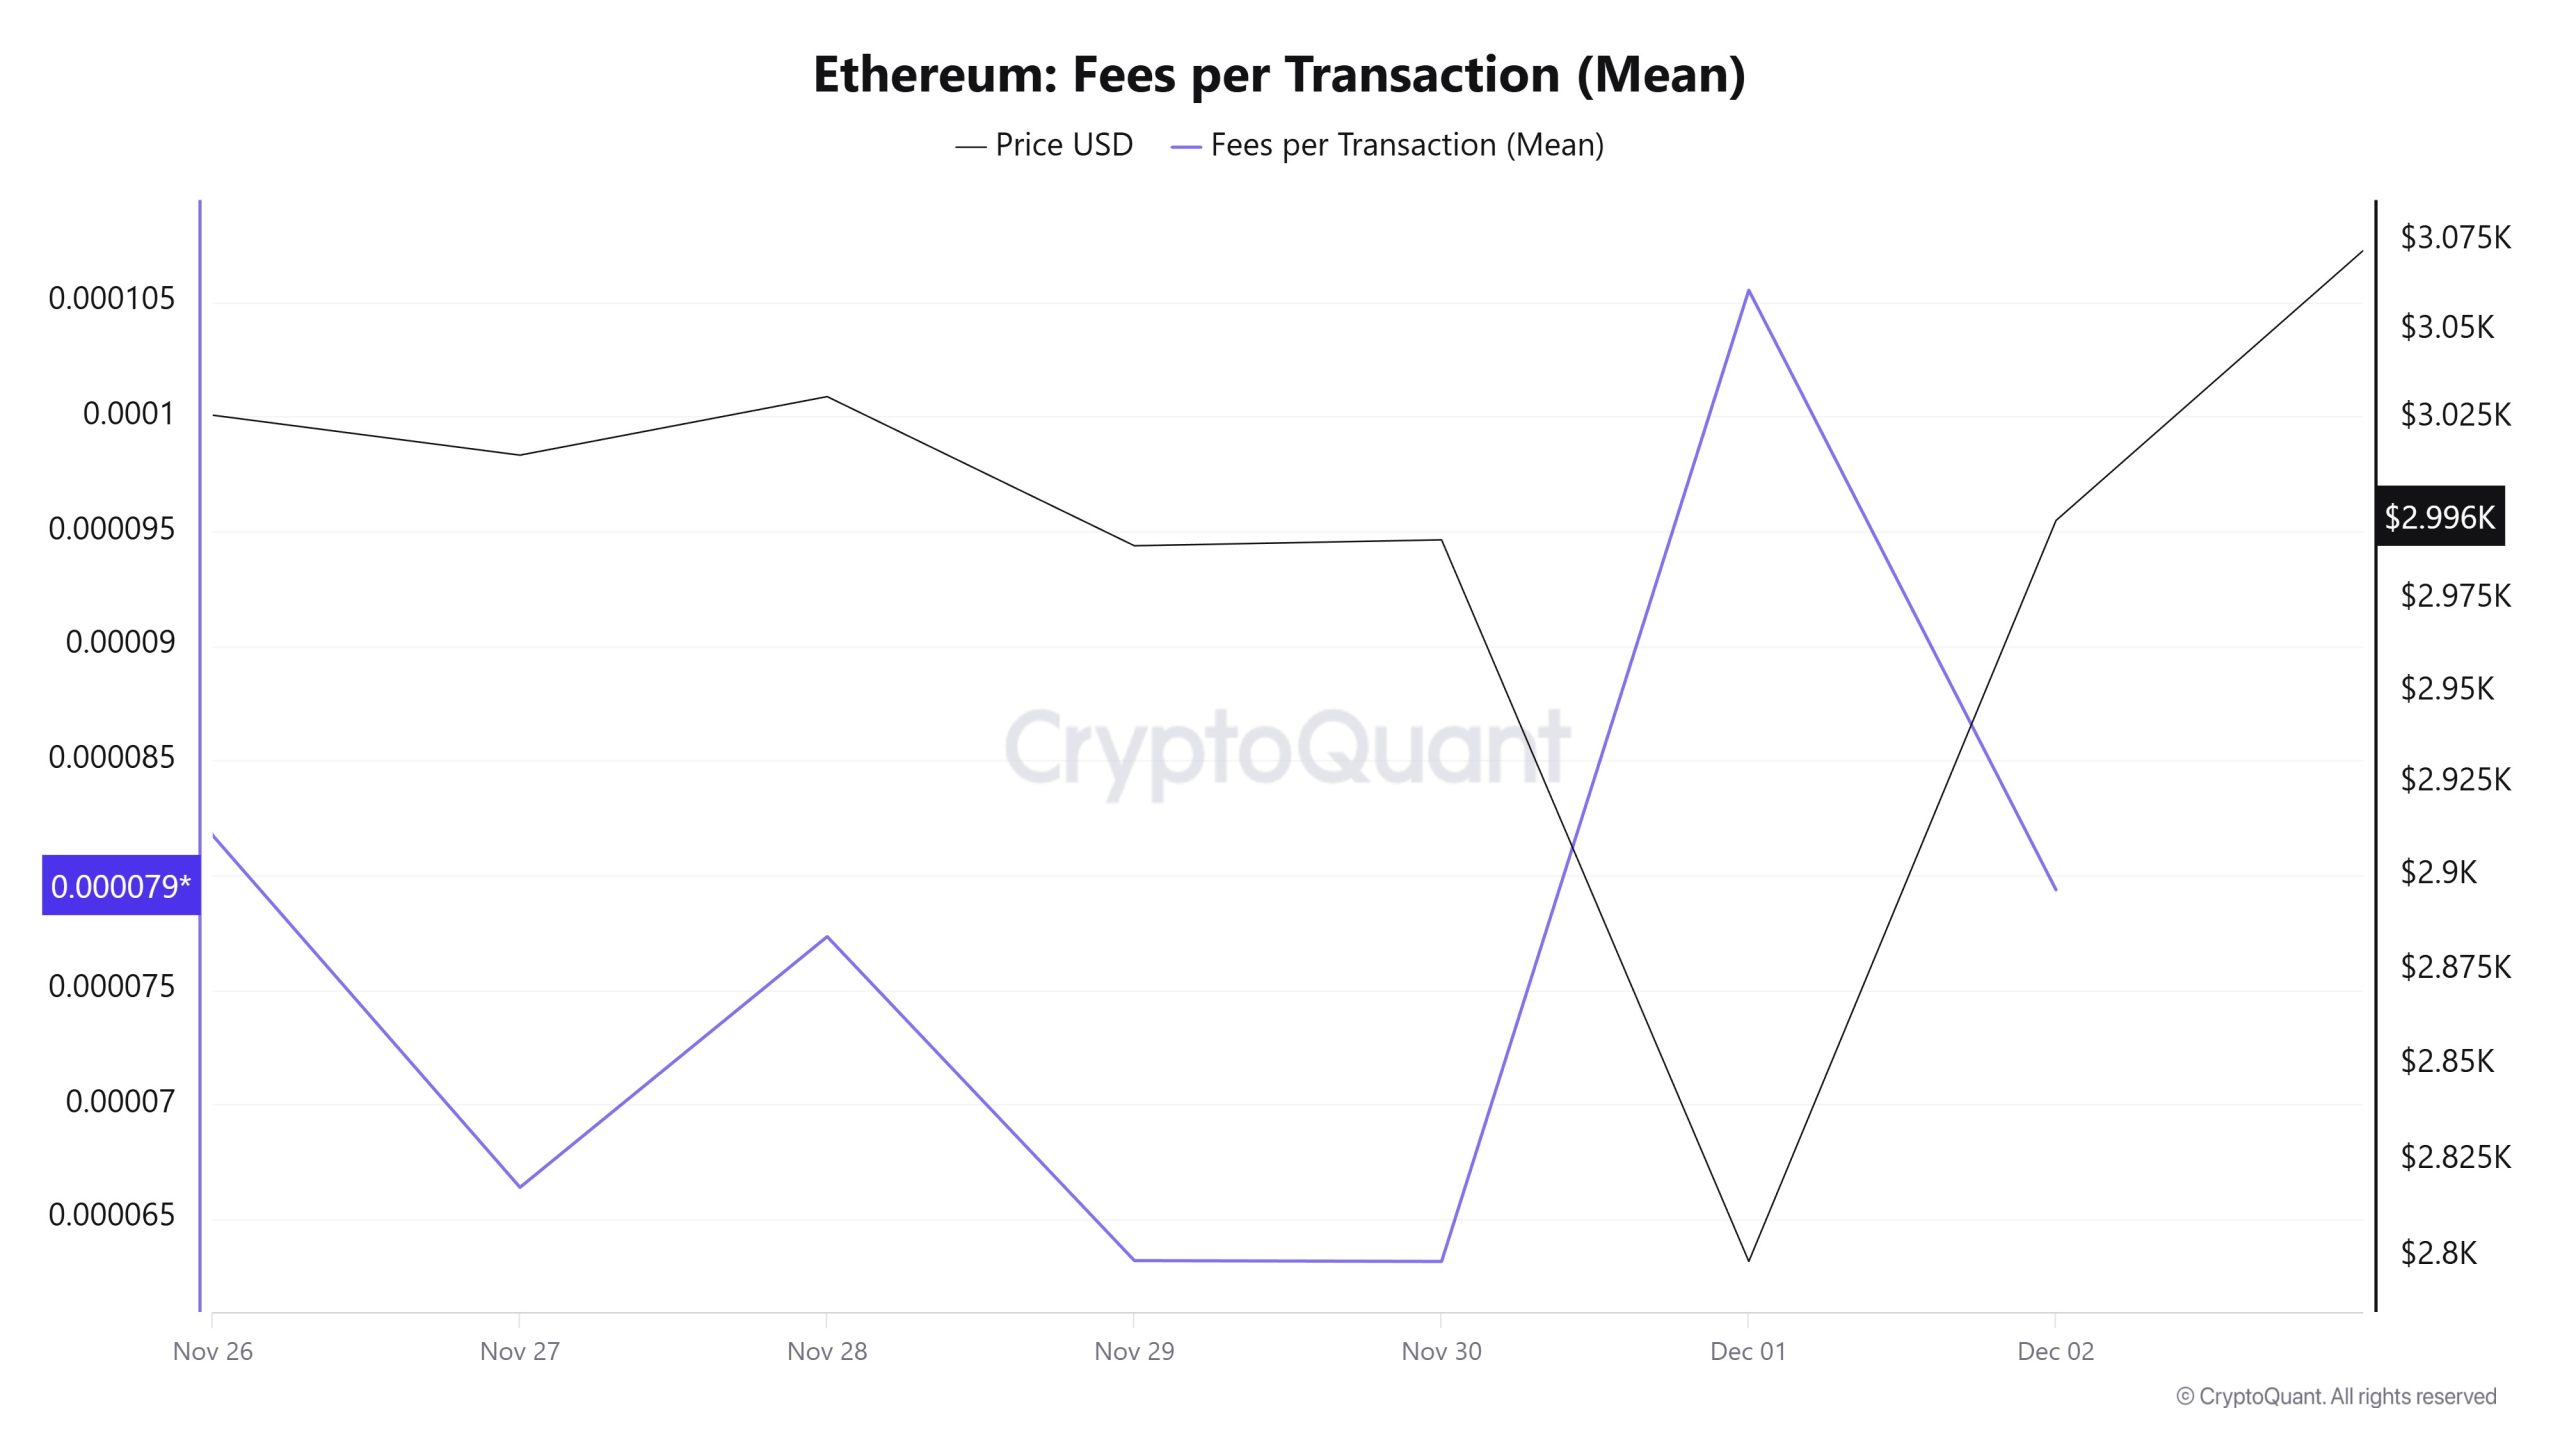
When examining the Ethereum Fees per Transaction (Mean) data between November 26 and December 2, it is seen that on November 26, the first day of the week, the indicator stood at 0.000081723710062835.
A fluctuating trend was observed until November 30, and on that date, the indicator recorded the week’s lowest value at 0.000063141134248672.
In this context, as a result of the increase in Ethereum price volatility as of November 30, the indicator regained momentum and followed a positive trend due to the impact of price volatility.
On December 2, the last day of the weekly period, the indicator closed the week at 0.000079354964580112.
Ethereum: Fees (Total)
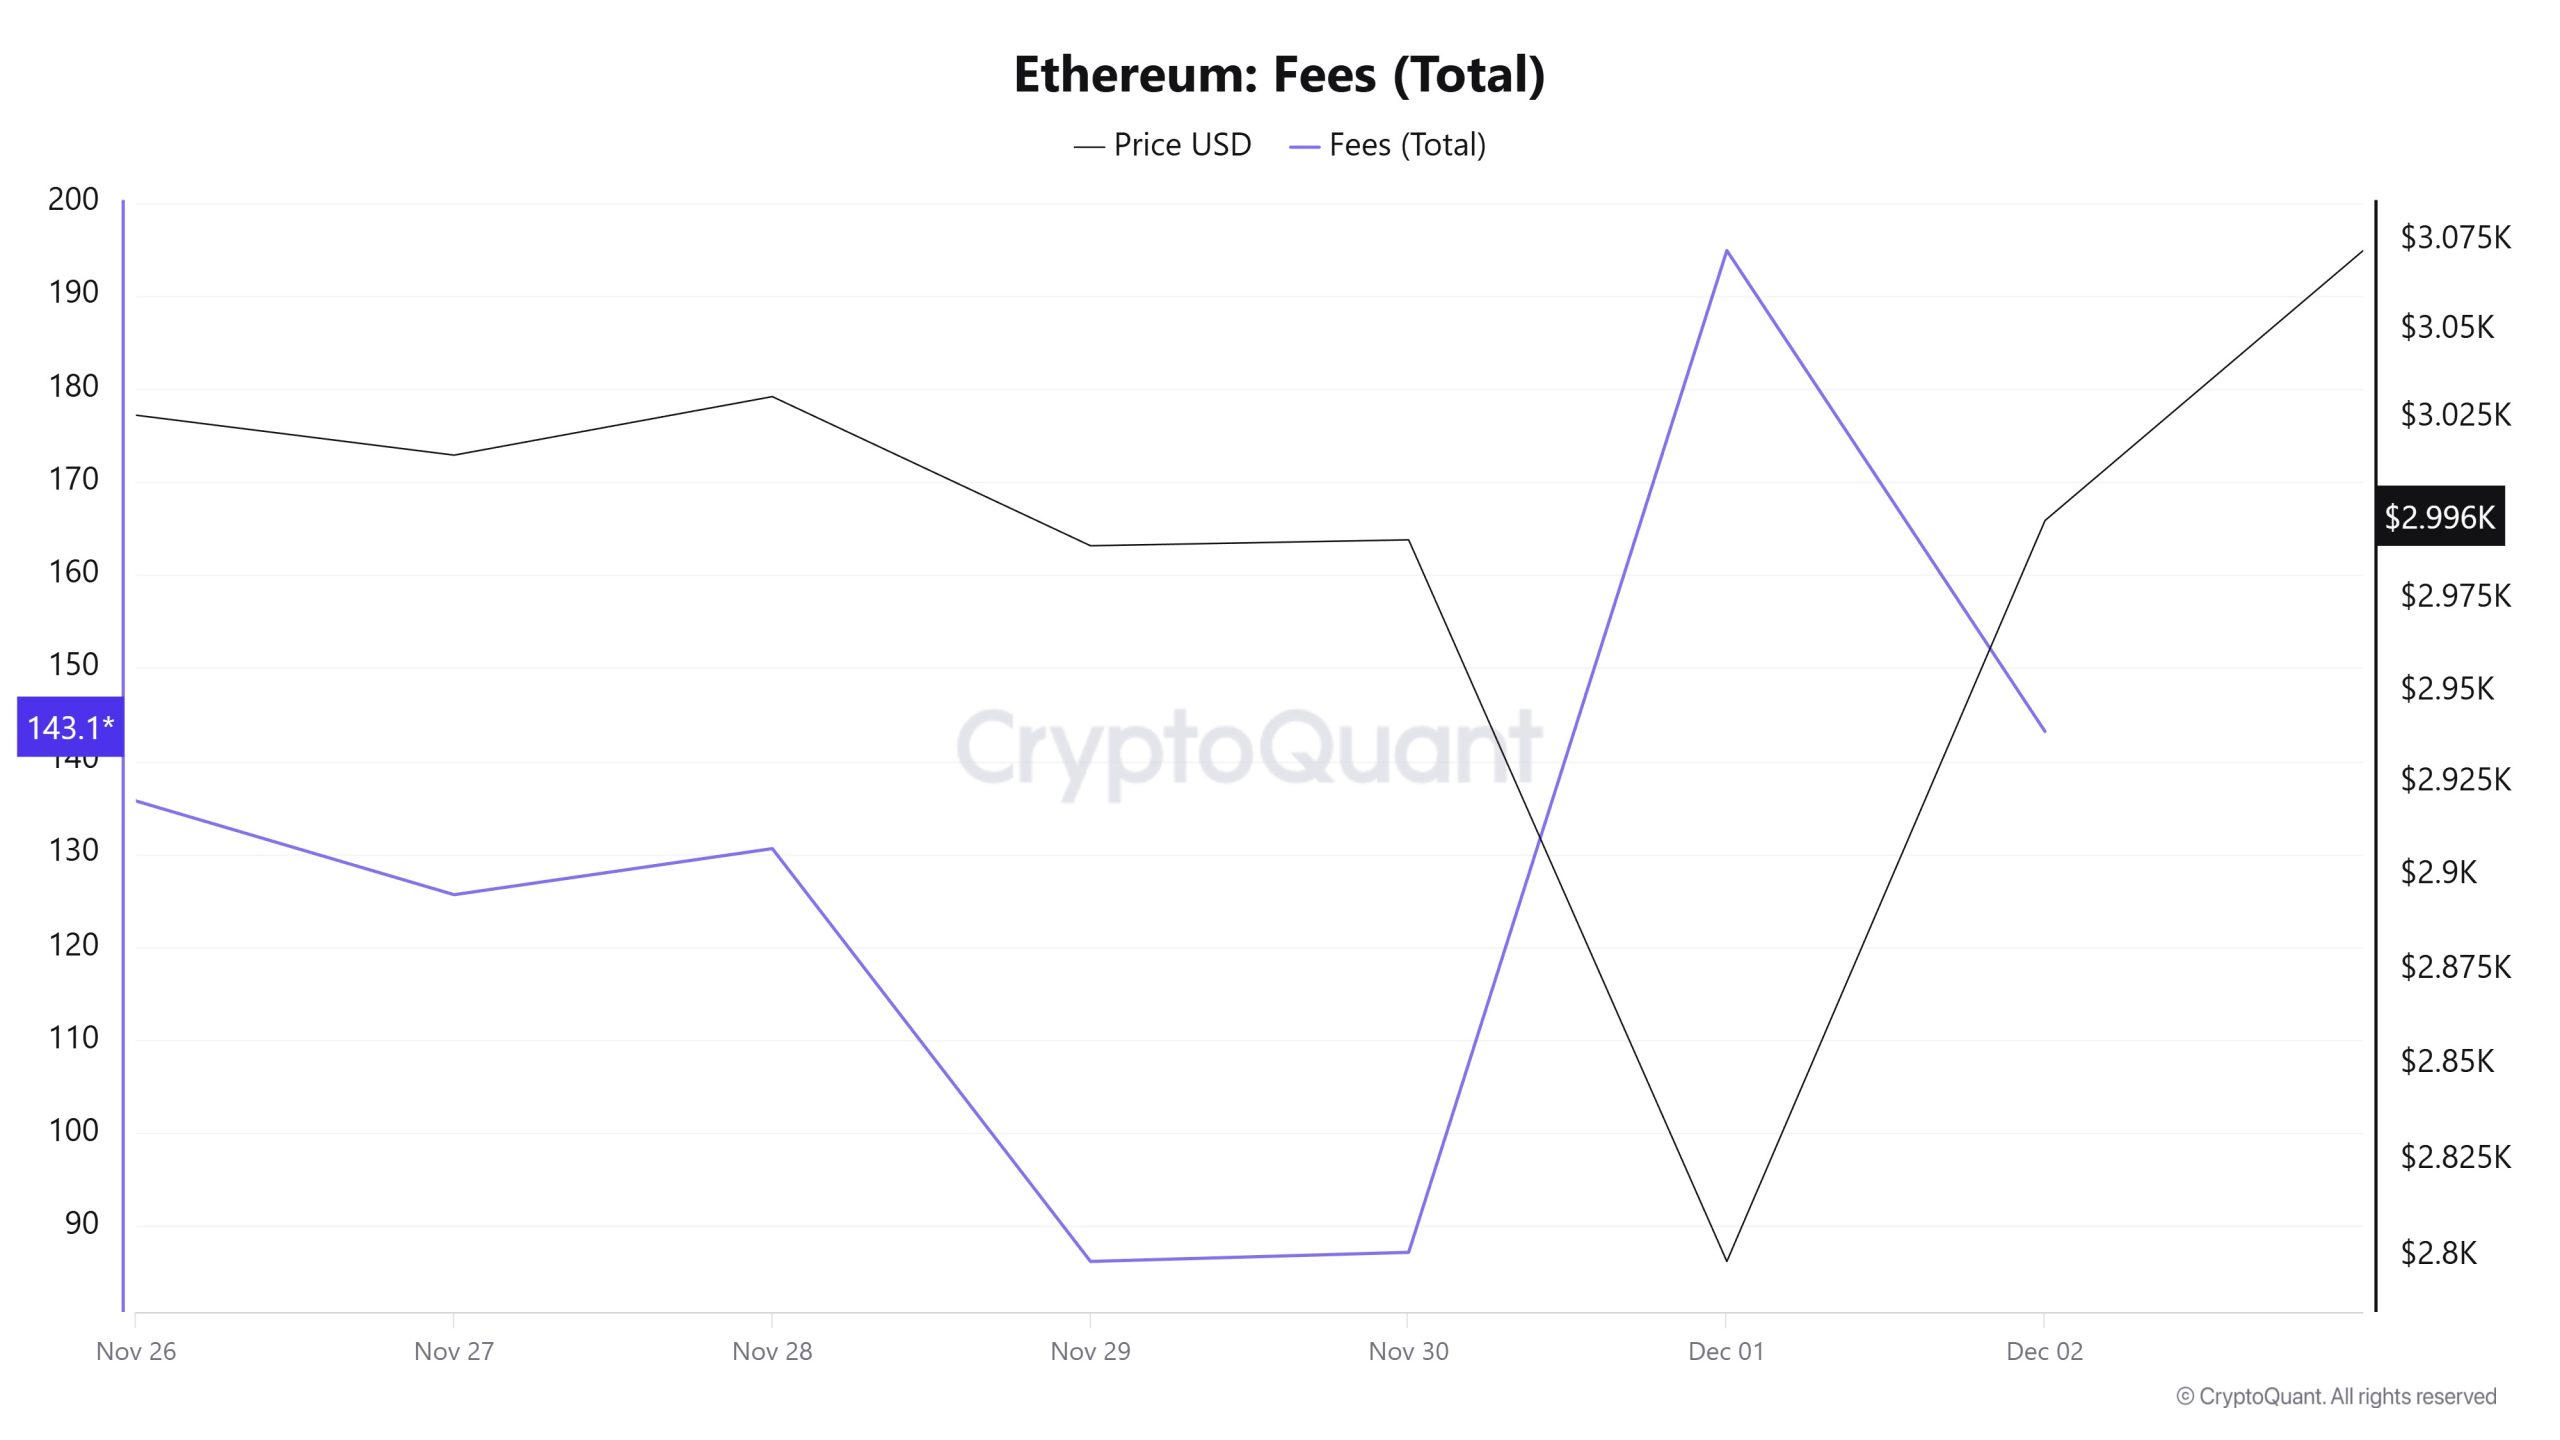
Similarly, when examining the Ethereum Fees (Total) data between November 26 and December 2, it is observed that on November 26, the first day of the week, the indicator reached 135.702629177888.
A fluctuating trend was observed until November 30, and on this date, the indicator recorded the week’s lowest value at 87.19746440947631.
In this context, as a result of the increase in Ethereum price volatility as of November 30, the indicator regained momentum and followed a positive trend due to the impact of price volatility.
On December 2, the last day of the weekly period, the indicator closed the week at 143.1692116067832.
Blocks Mined
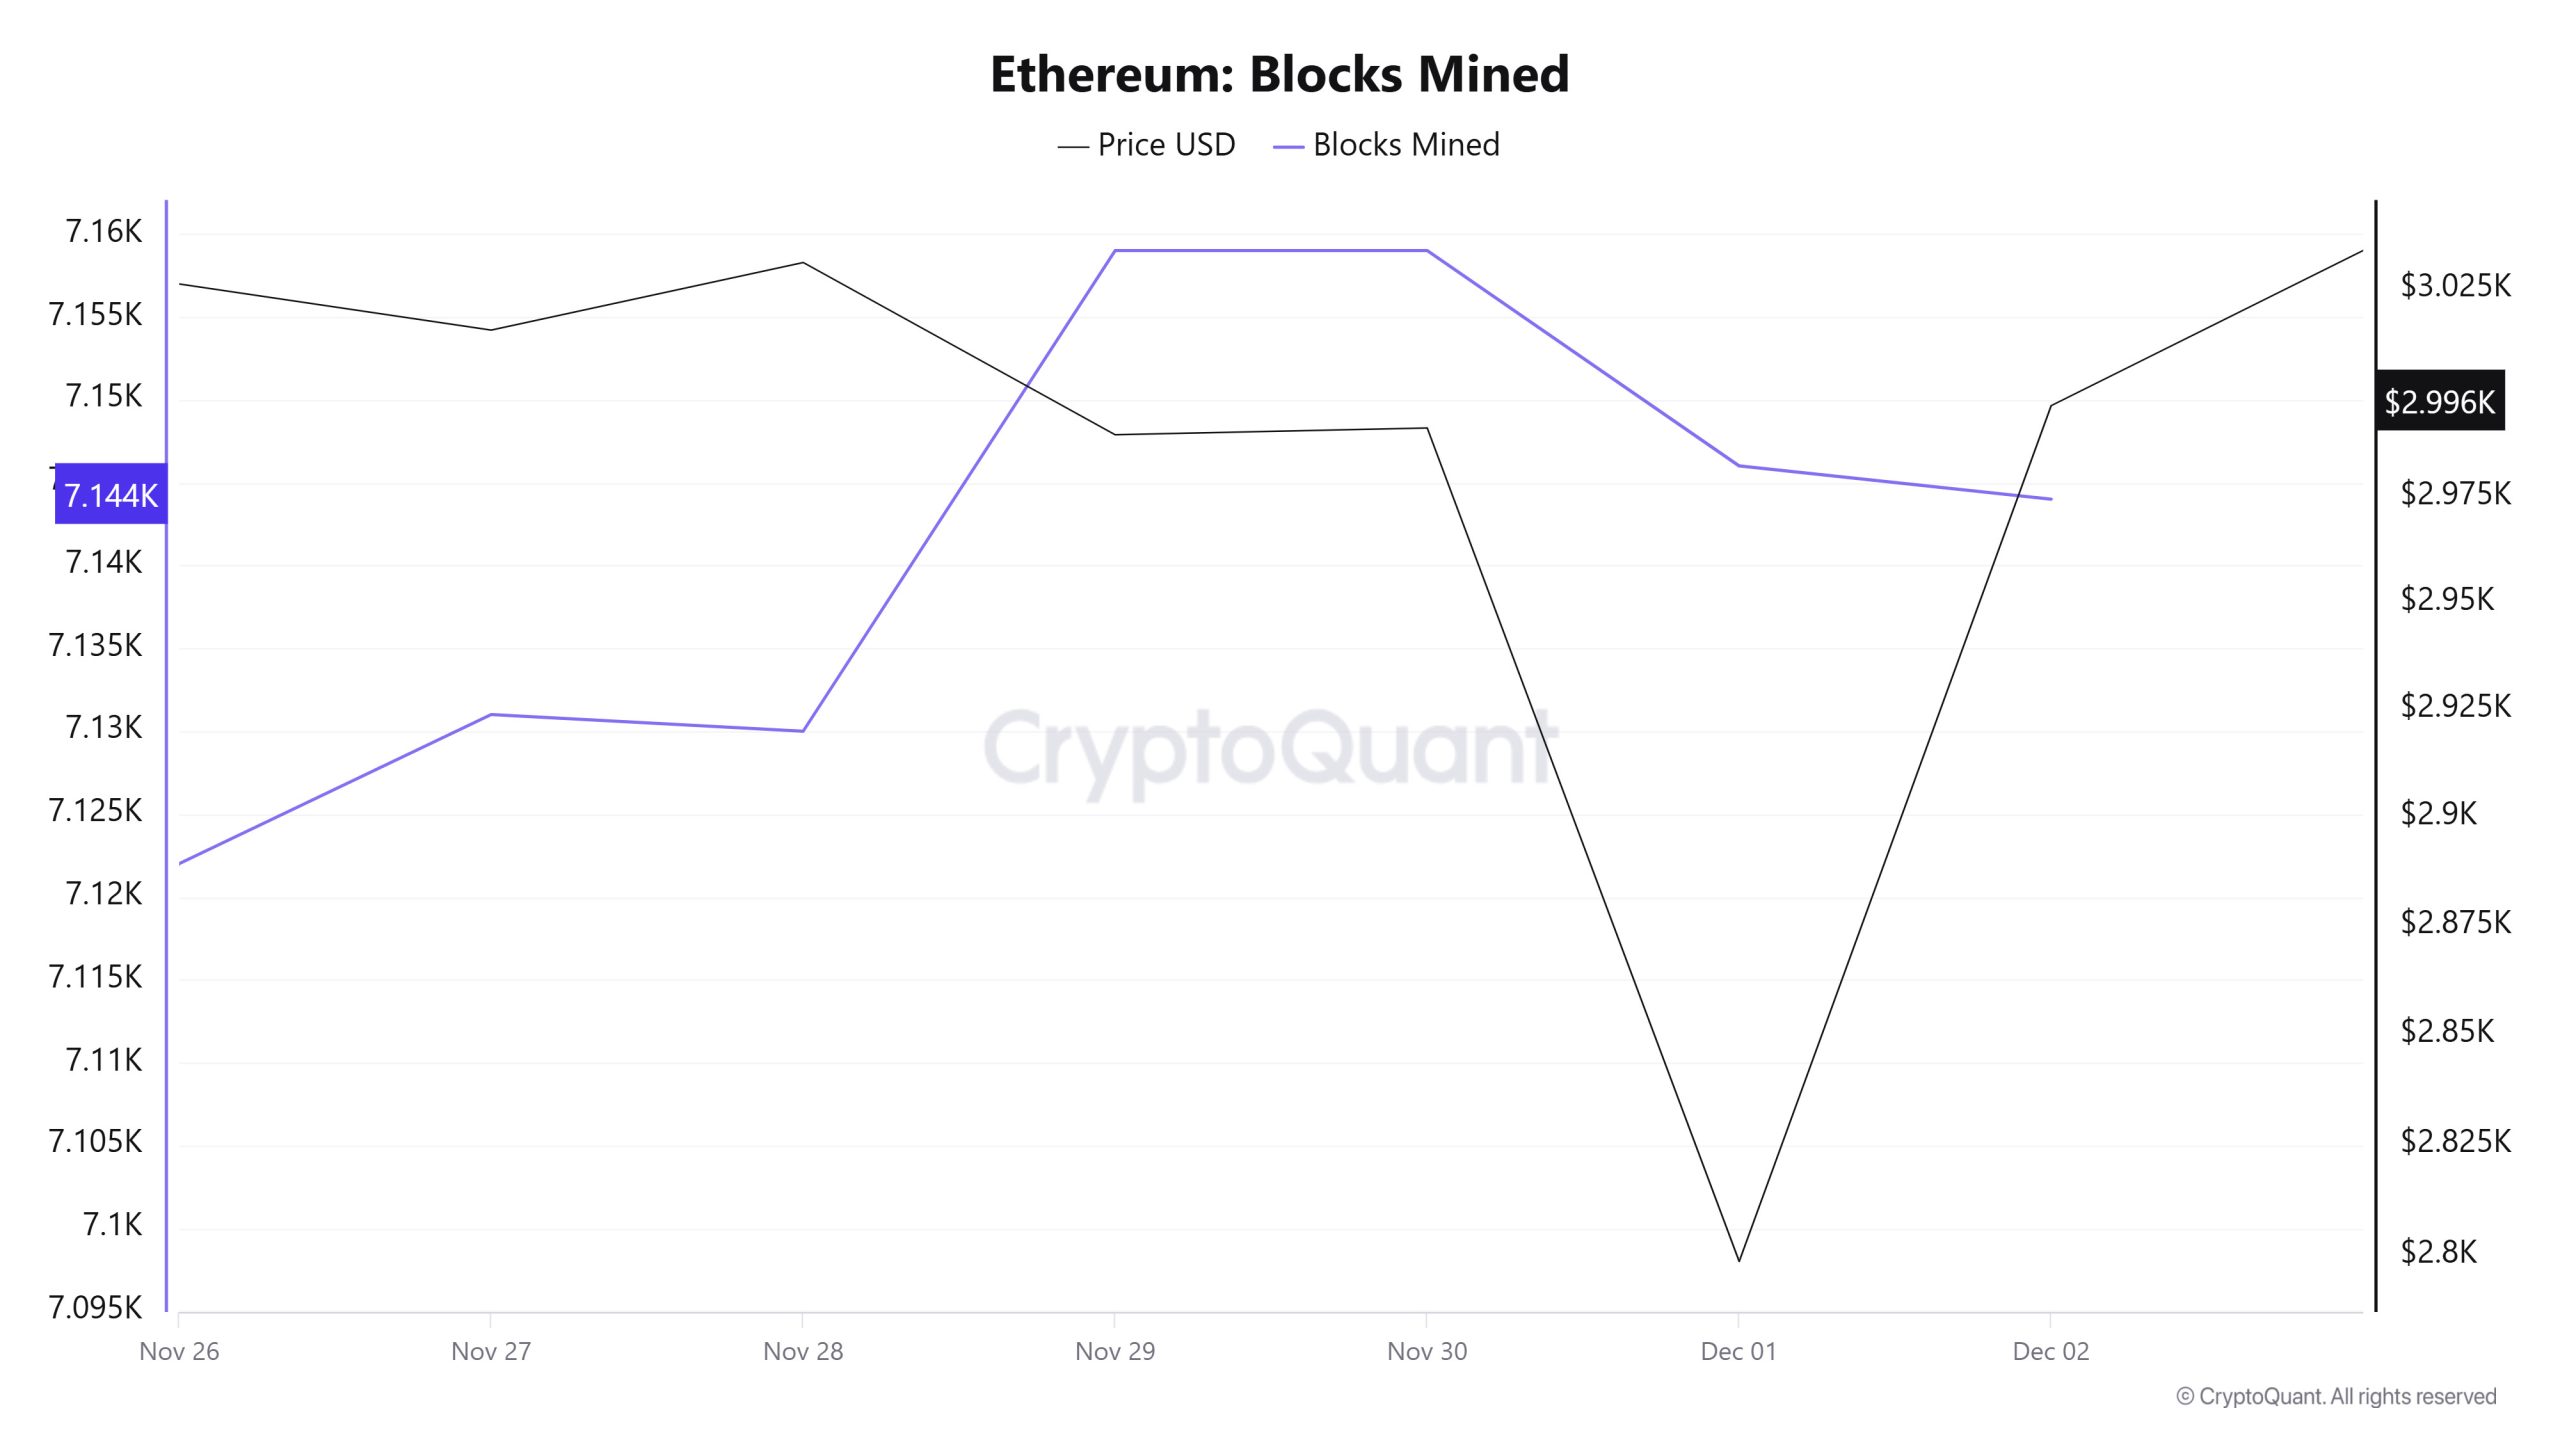
When examining Ethereum block production data between November 26 and December 2, an increase was observed throughout the week. While 7,122 blocks were produced on November 26, this number rose to 7,144 as of December 2.
During the period in question, a time-dependent correlation structure was observed between the Ethereum price and the number of blocks produced. However, the general trend reveals that a negative correlation between these two variables is dominant.
Block Size
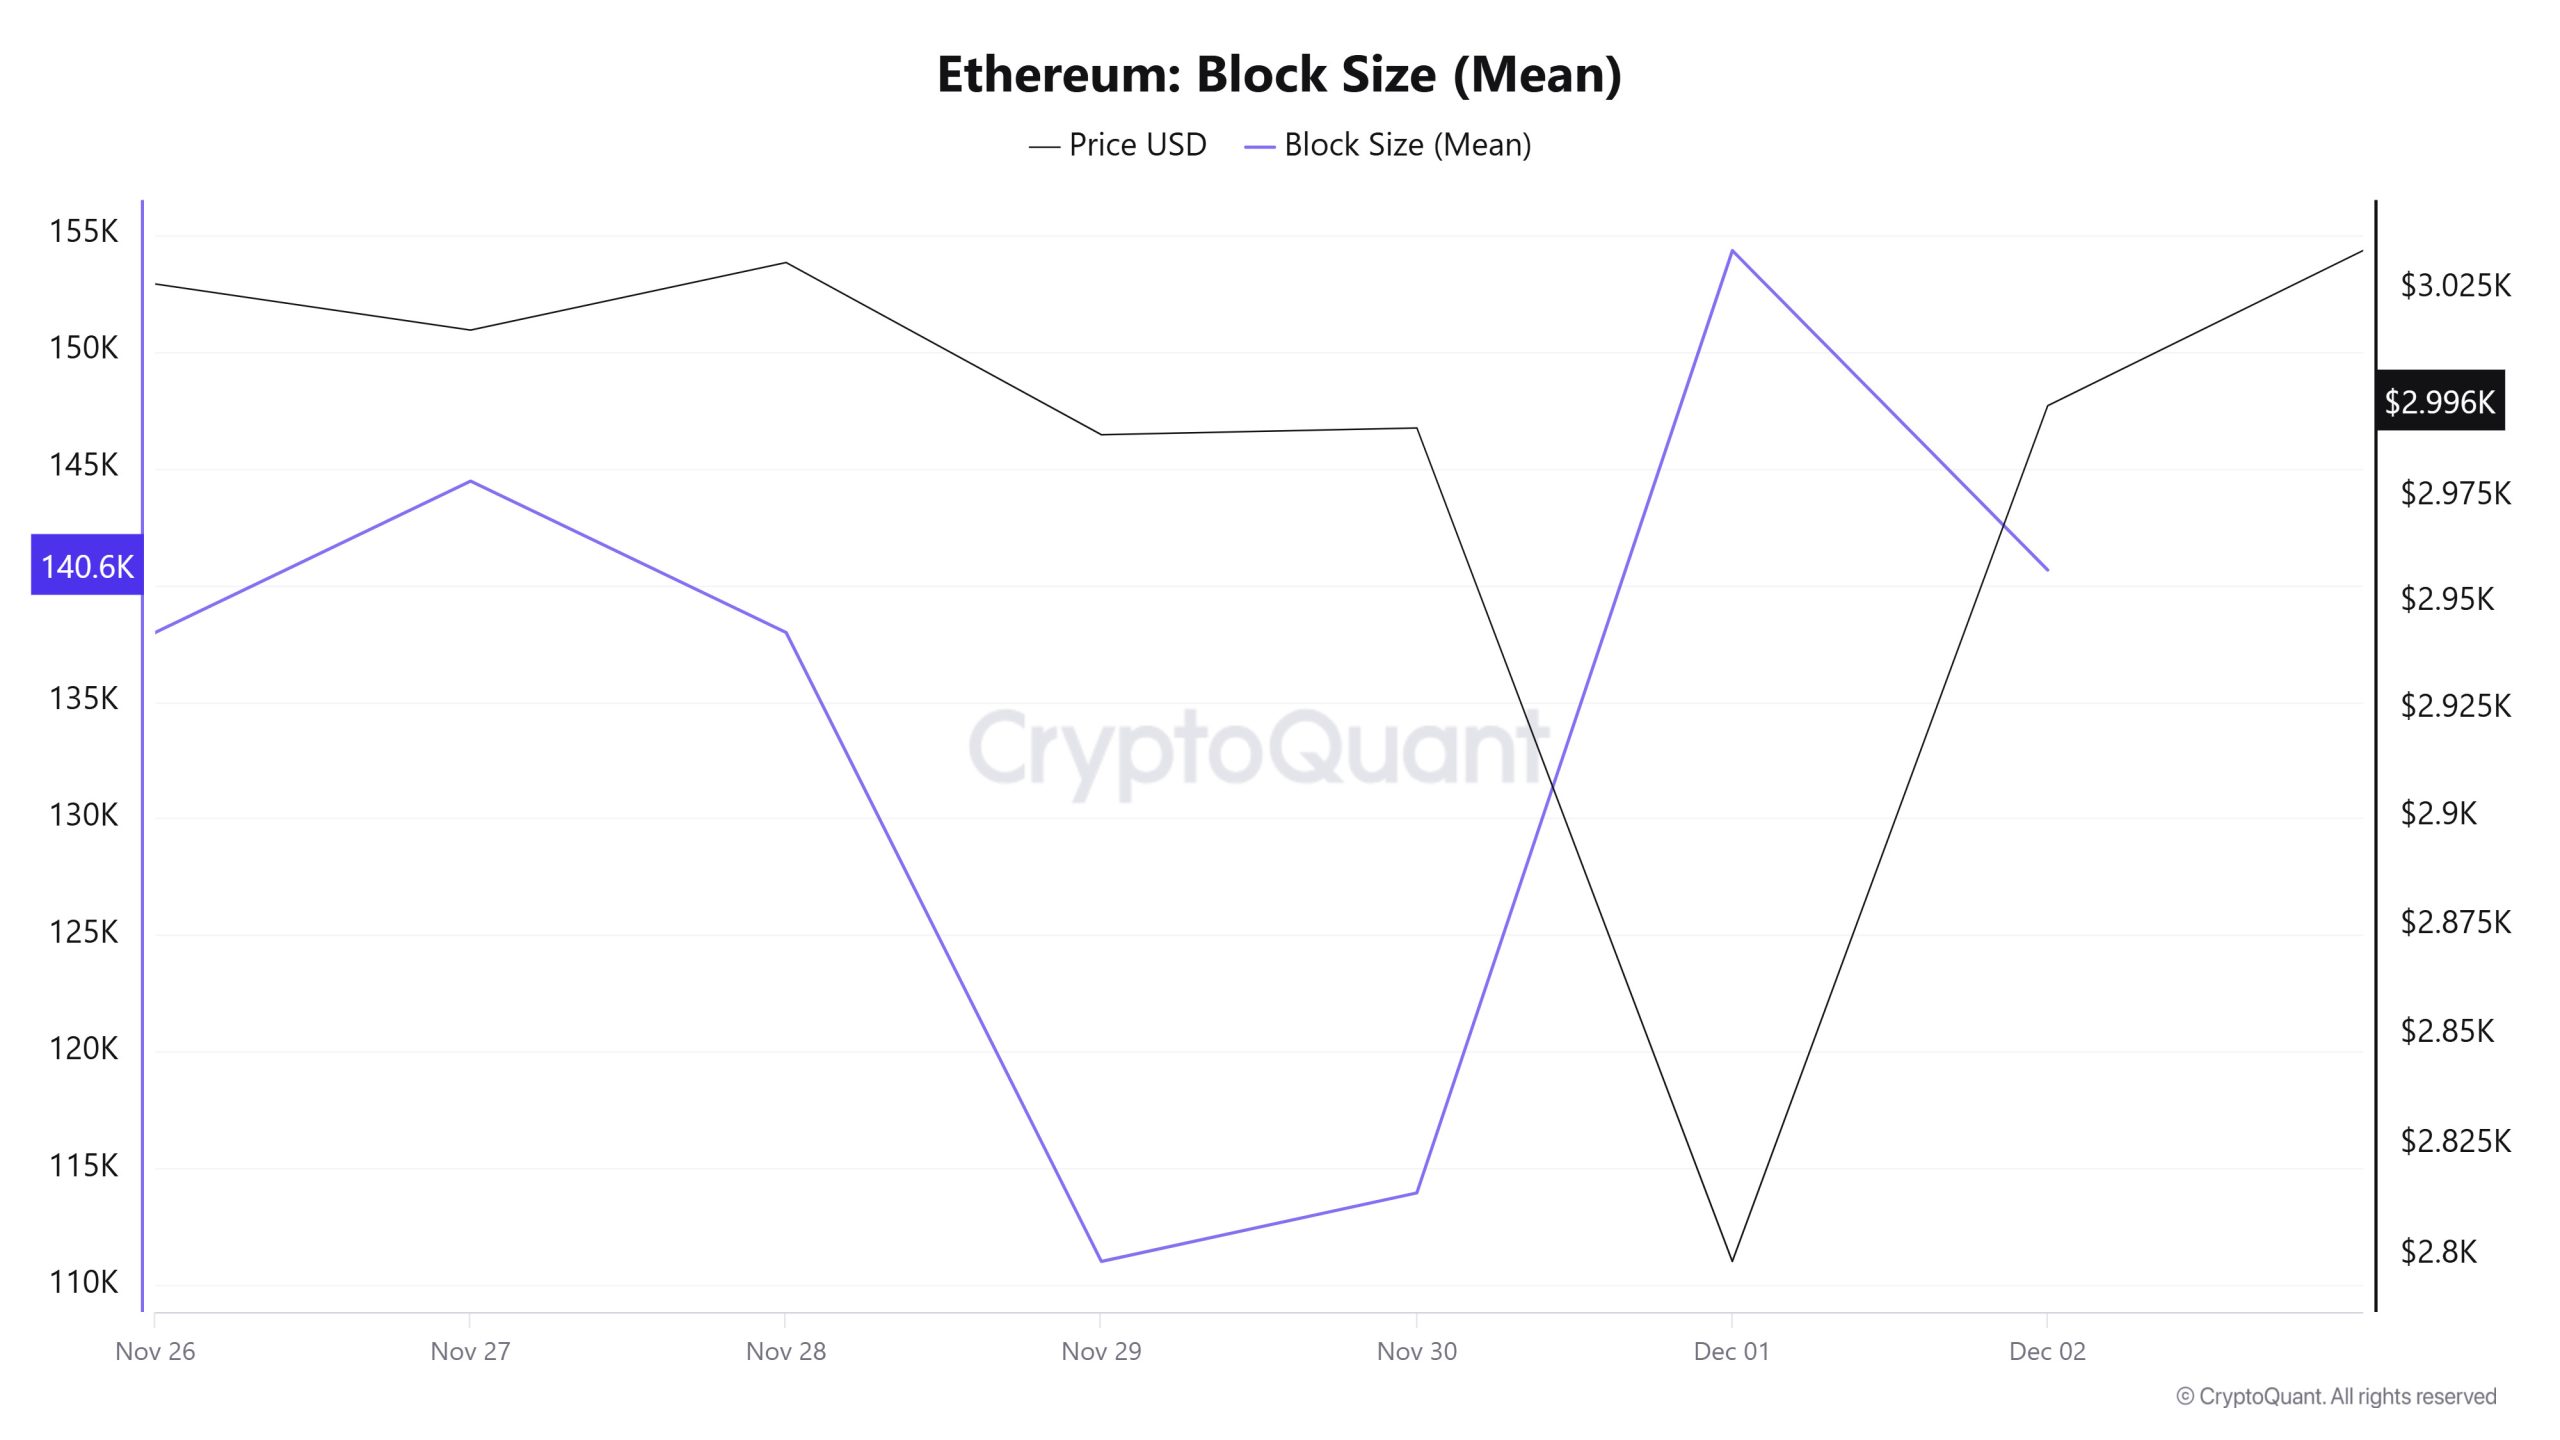
When examining Ethereum block size data between November 26 and December 2, an increase was observed throughout the week. While the average block size was measured at 137,965 bytes on November 26, this value rose to 140,641 bytes as of December 2.
During the relevant period, a time-dependent correlation structure was observed between block size and Ethereum price. However, the general trend reveals that a negative correlation between these two variables is dominant.
Block Interval
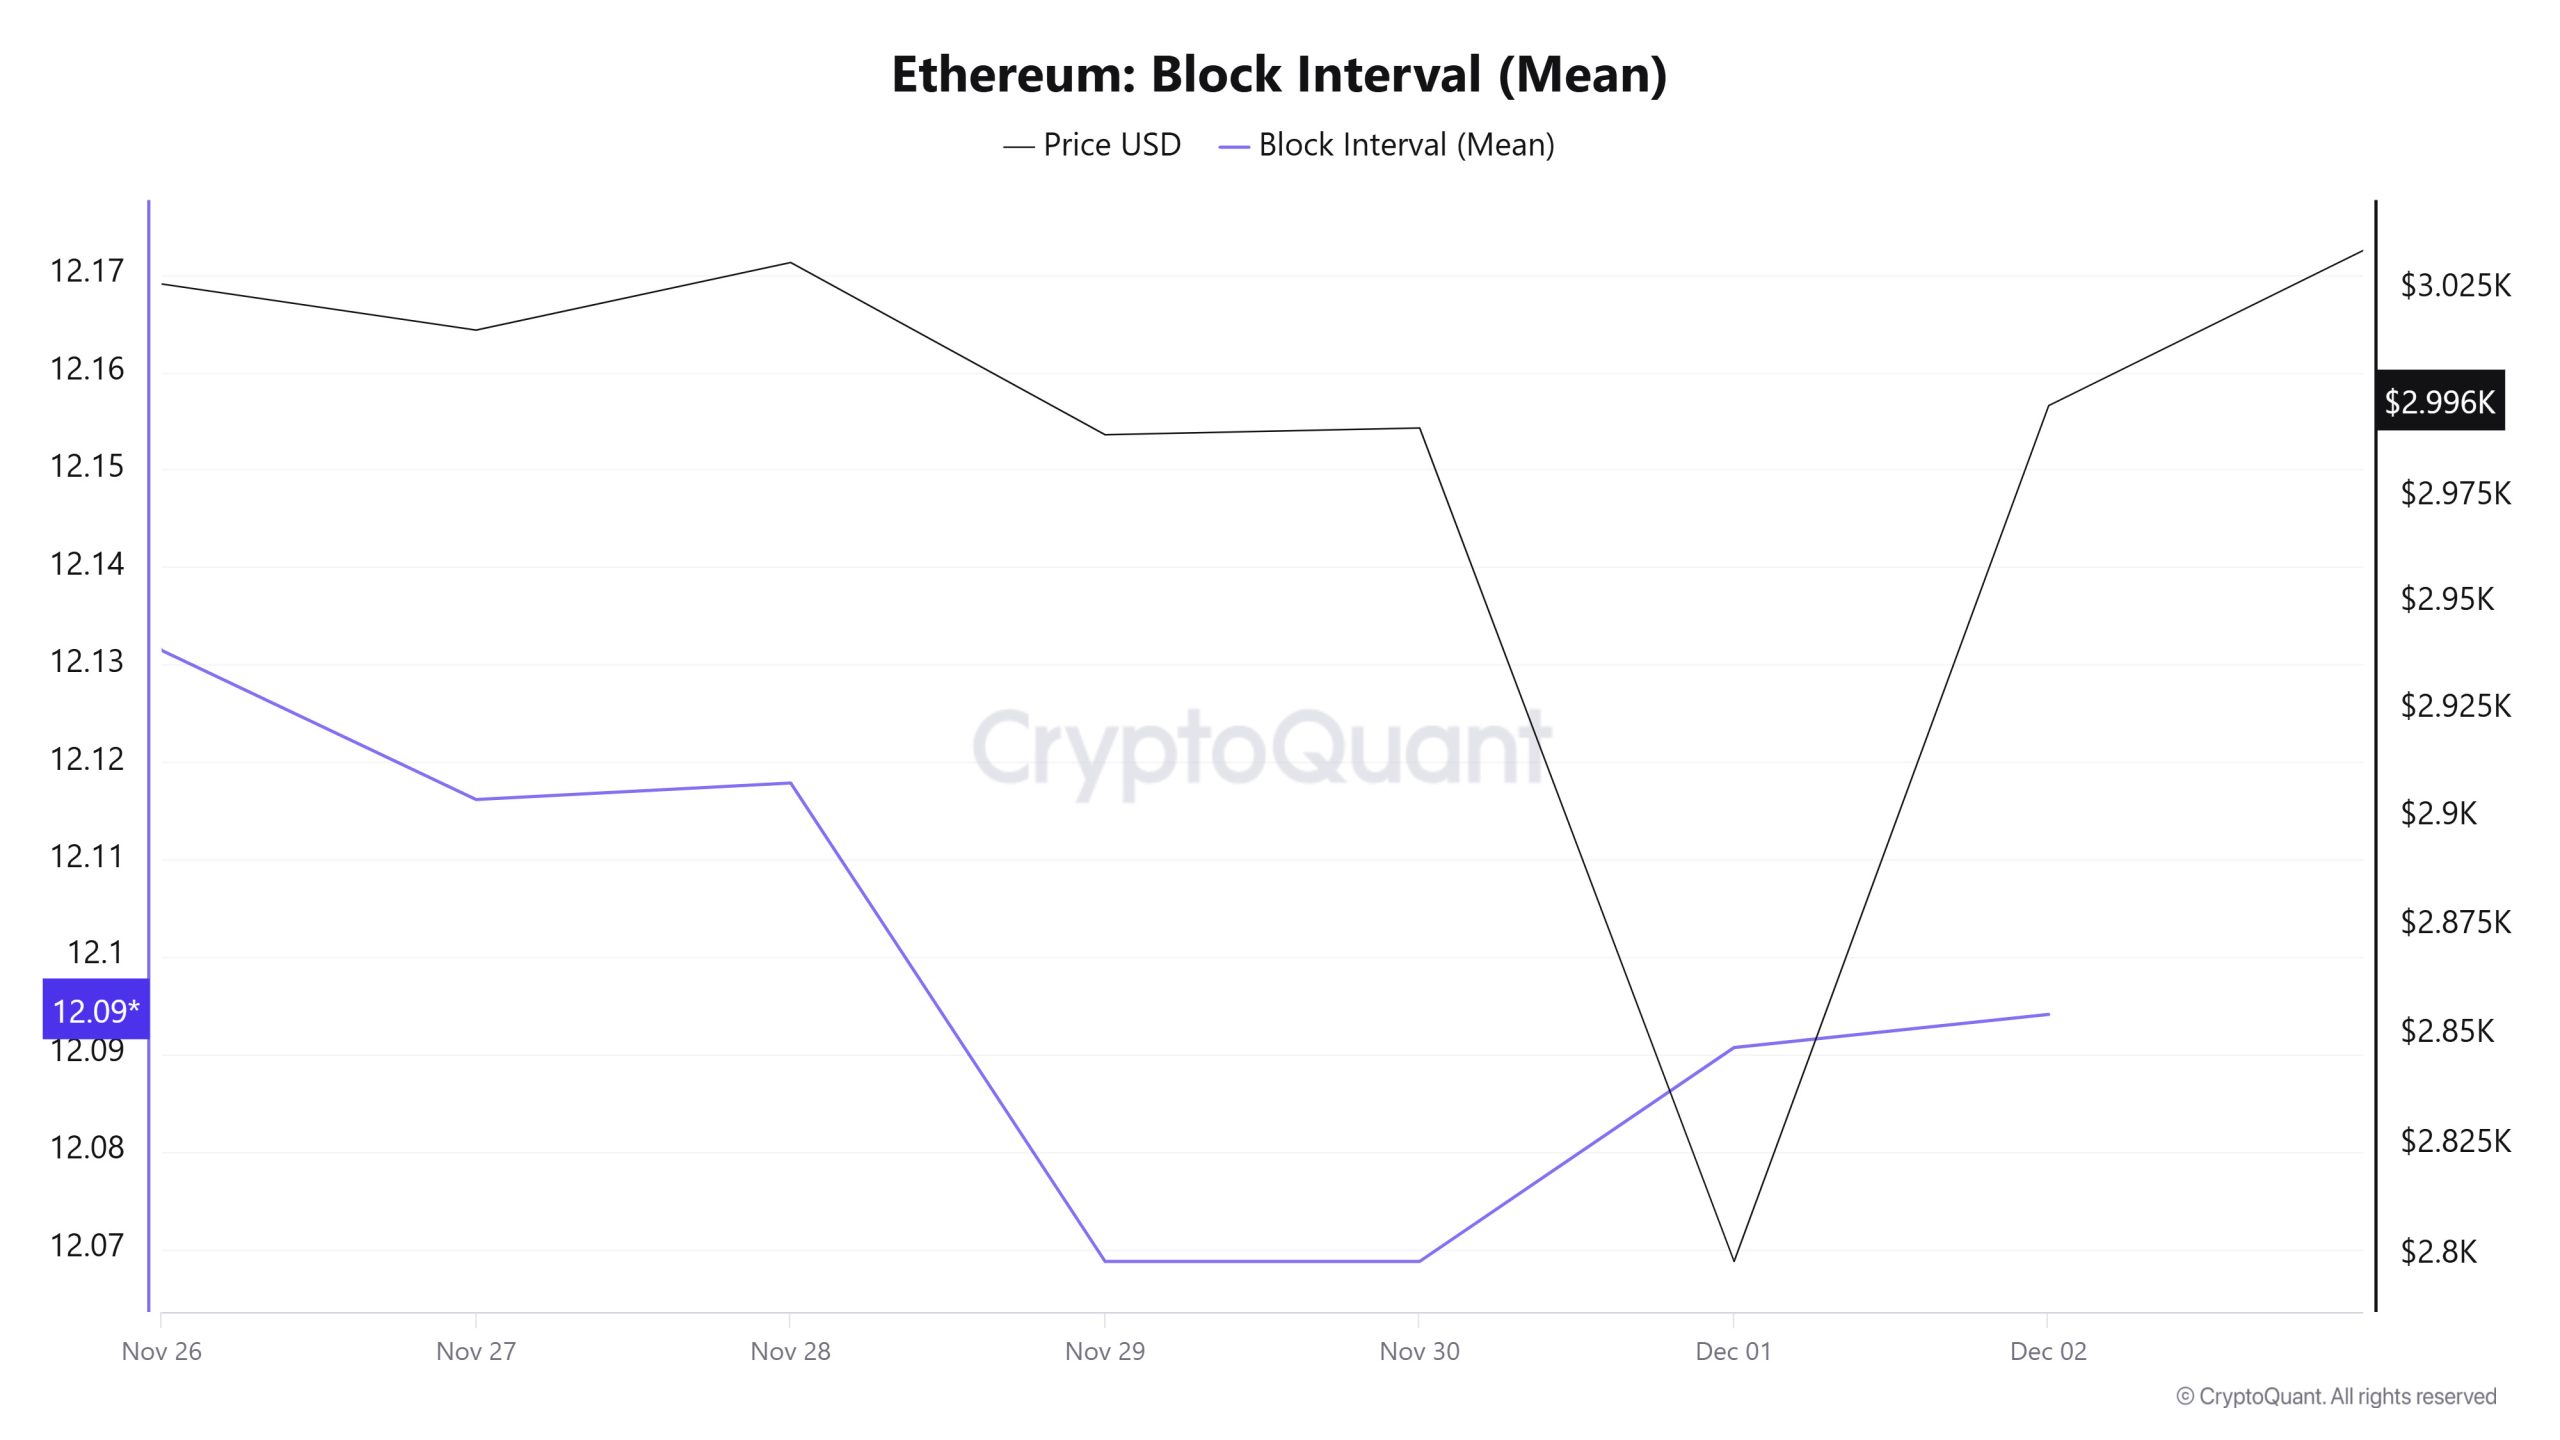
When examining the Ethereum block time between November 26 and December 2, a decrease was observed throughout the week. While the average block time was recorded as 12.13 seconds on November 26, this time decreased to 12.09 seconds as of December 2.
During the period in question, a time-dependent correlation structure was observed between Ethereum block time and price movement. However, the general trend indicates that a positive correlation between these two variables is dominant.
Transaction
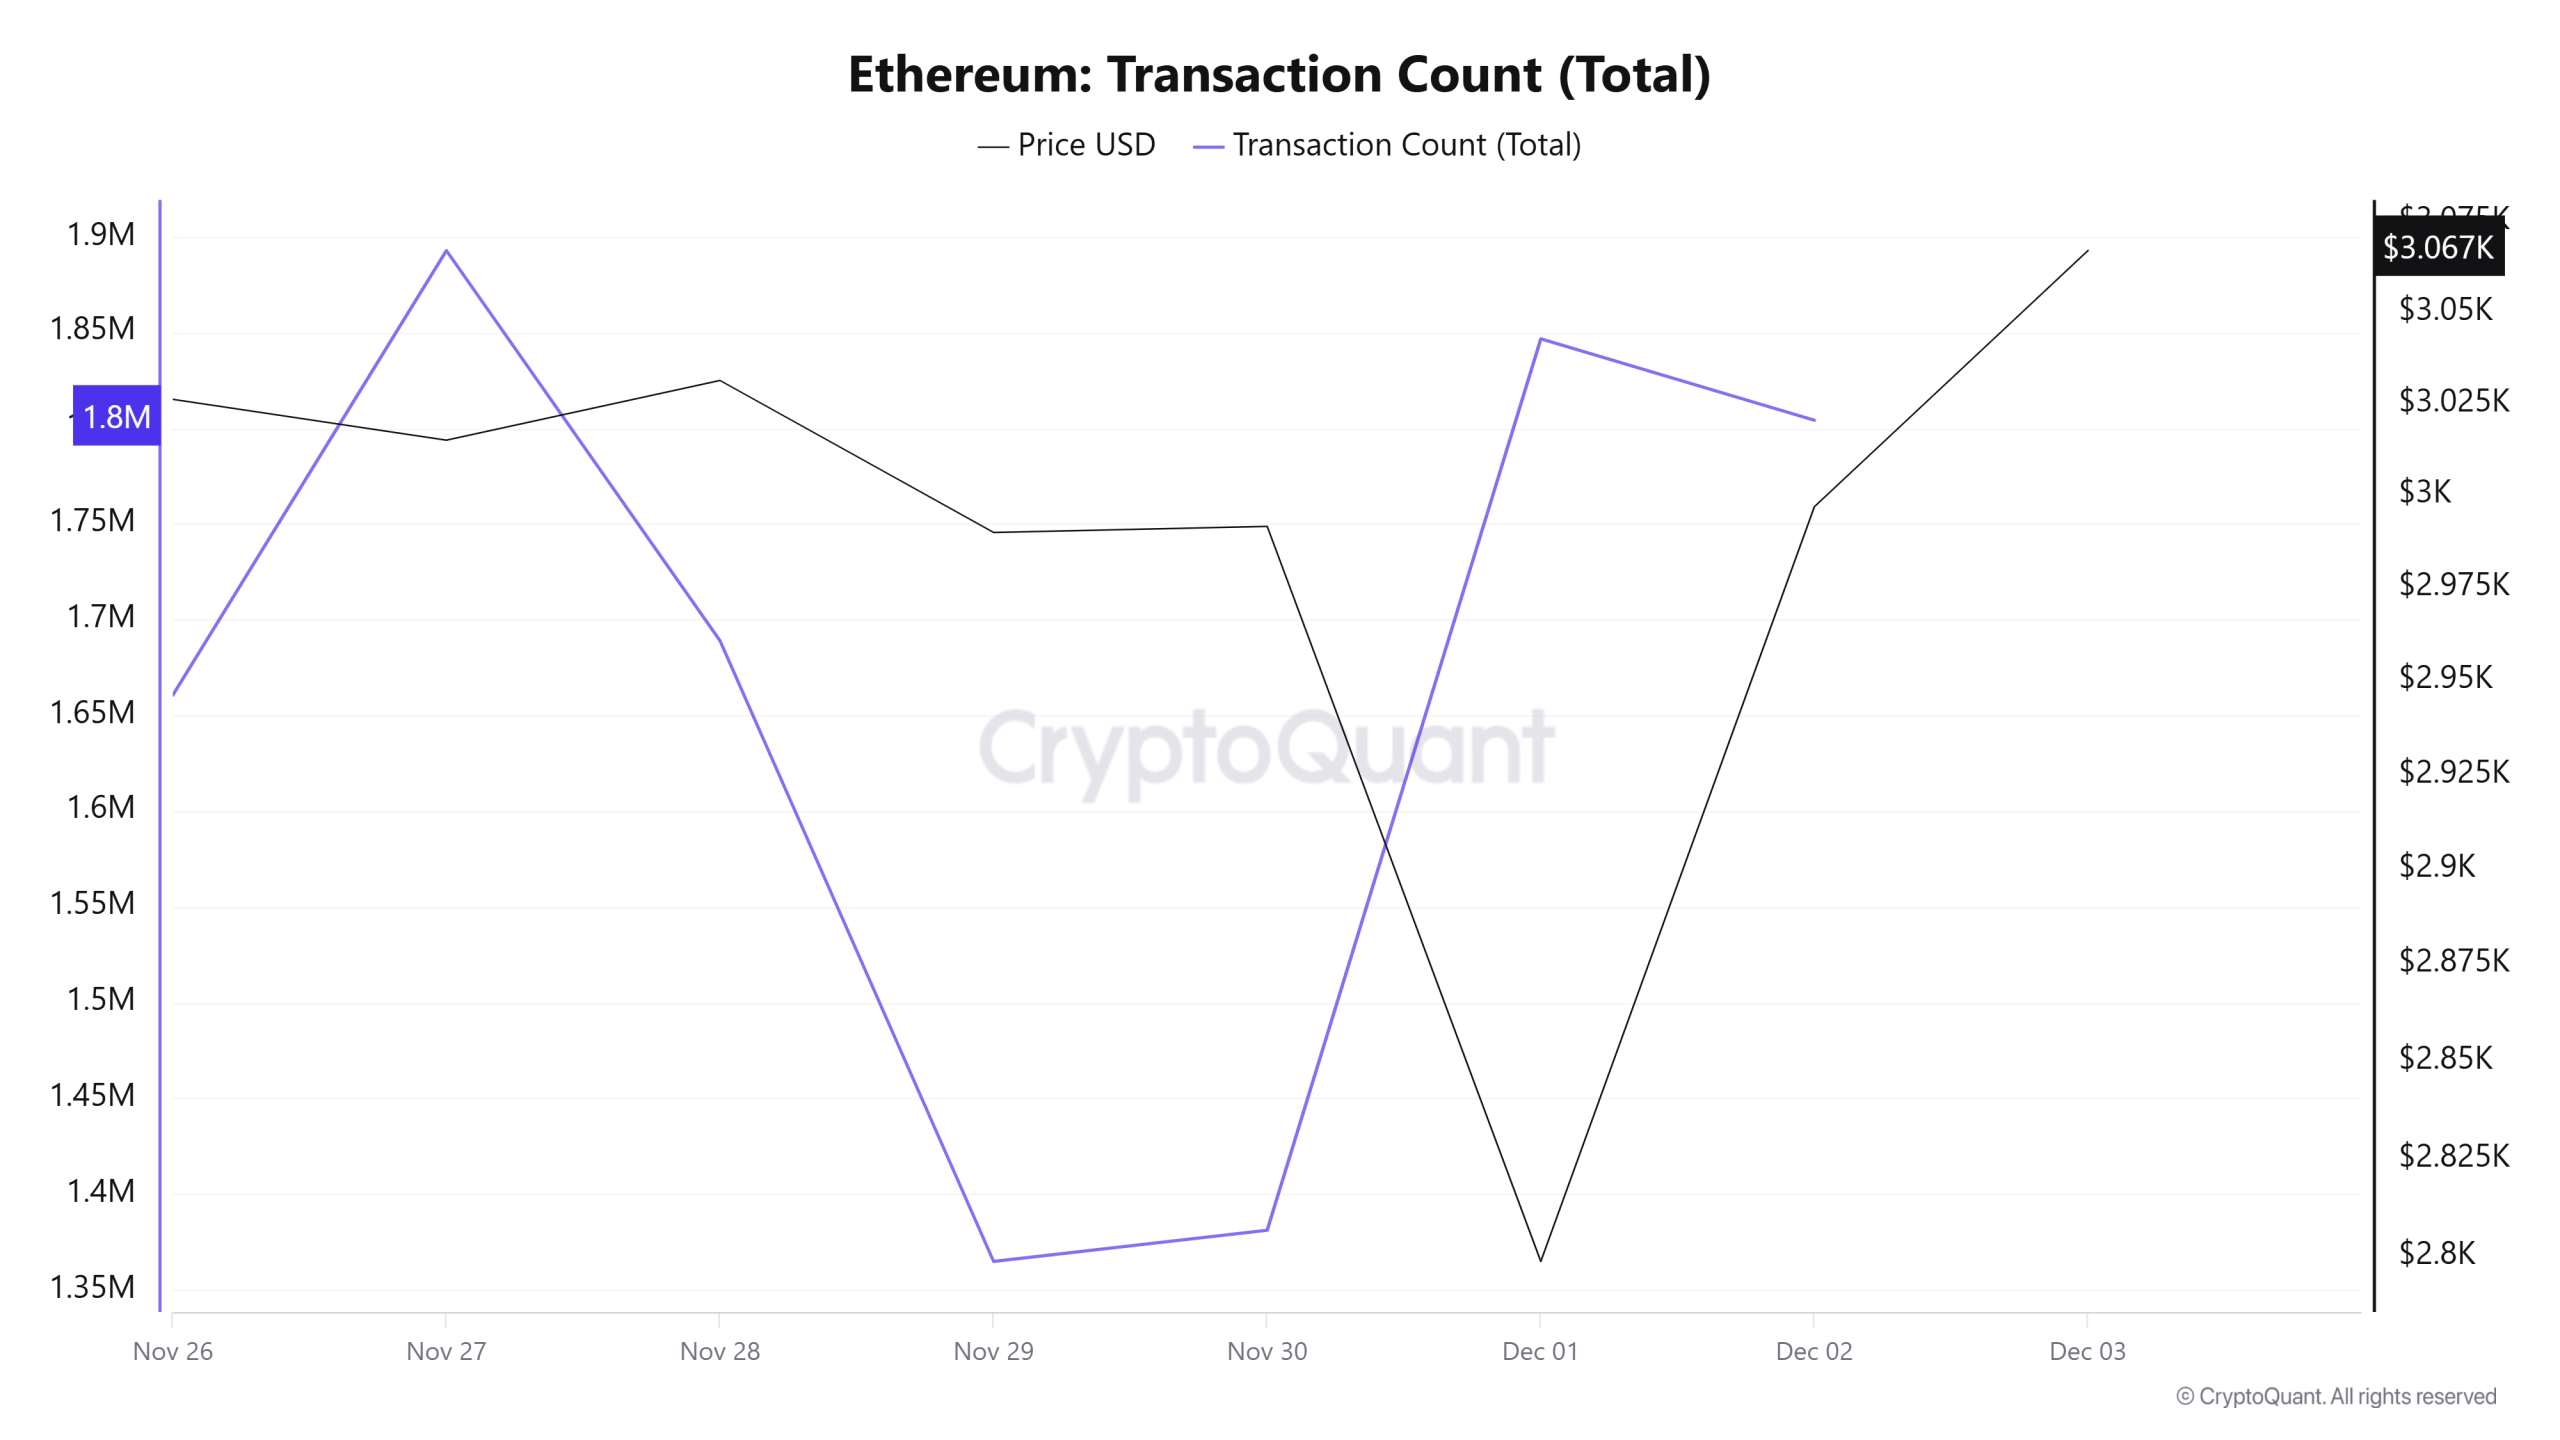
Last week, a total of 10,353,621 transactions were executed on the Ethereum network, while this week the number of transactions increased by approximately 12.4% to 11,638,824. The highest weekly transaction count was recorded on November 27 at 1,892,795, while the lowest was on November 29 at 1,364,687. The correlation between transaction volume and price showed mixed progress throughout the week but maintained a balanced outlook. Meanwhile, the high network activity compared to the previous period indicates a pattern that is boosting transaction momentum on the Ethereum network.
Tokens Transferred
The total amount of ETH transferred last week was 17,416,974, while this week that figure fell to 10,465,681 ETH, marking a decline of approximately 40%. The highest transfer volume during the period was 2,444,330 ETH on December 1, while the lowest value was 500,931 ETH on November 30.
The fluctuations of up to 500% seen in daily transfers, when evaluated alongside the increase in transaction volume, reveal that the amount of ETH moving per average transaction has significantly decreased. This picture, combined with declining transfer volumes, rising transaction numbers, and a decrease in the average ETH transferred per transaction, shows that the network has shifted this week to a profile dominated by small investors rather than large players.
When this data structure is considered alongside intra-period price movements, it reinforces the interpretation that the price is still in a downward trend.
Estimated Leverage Ratio
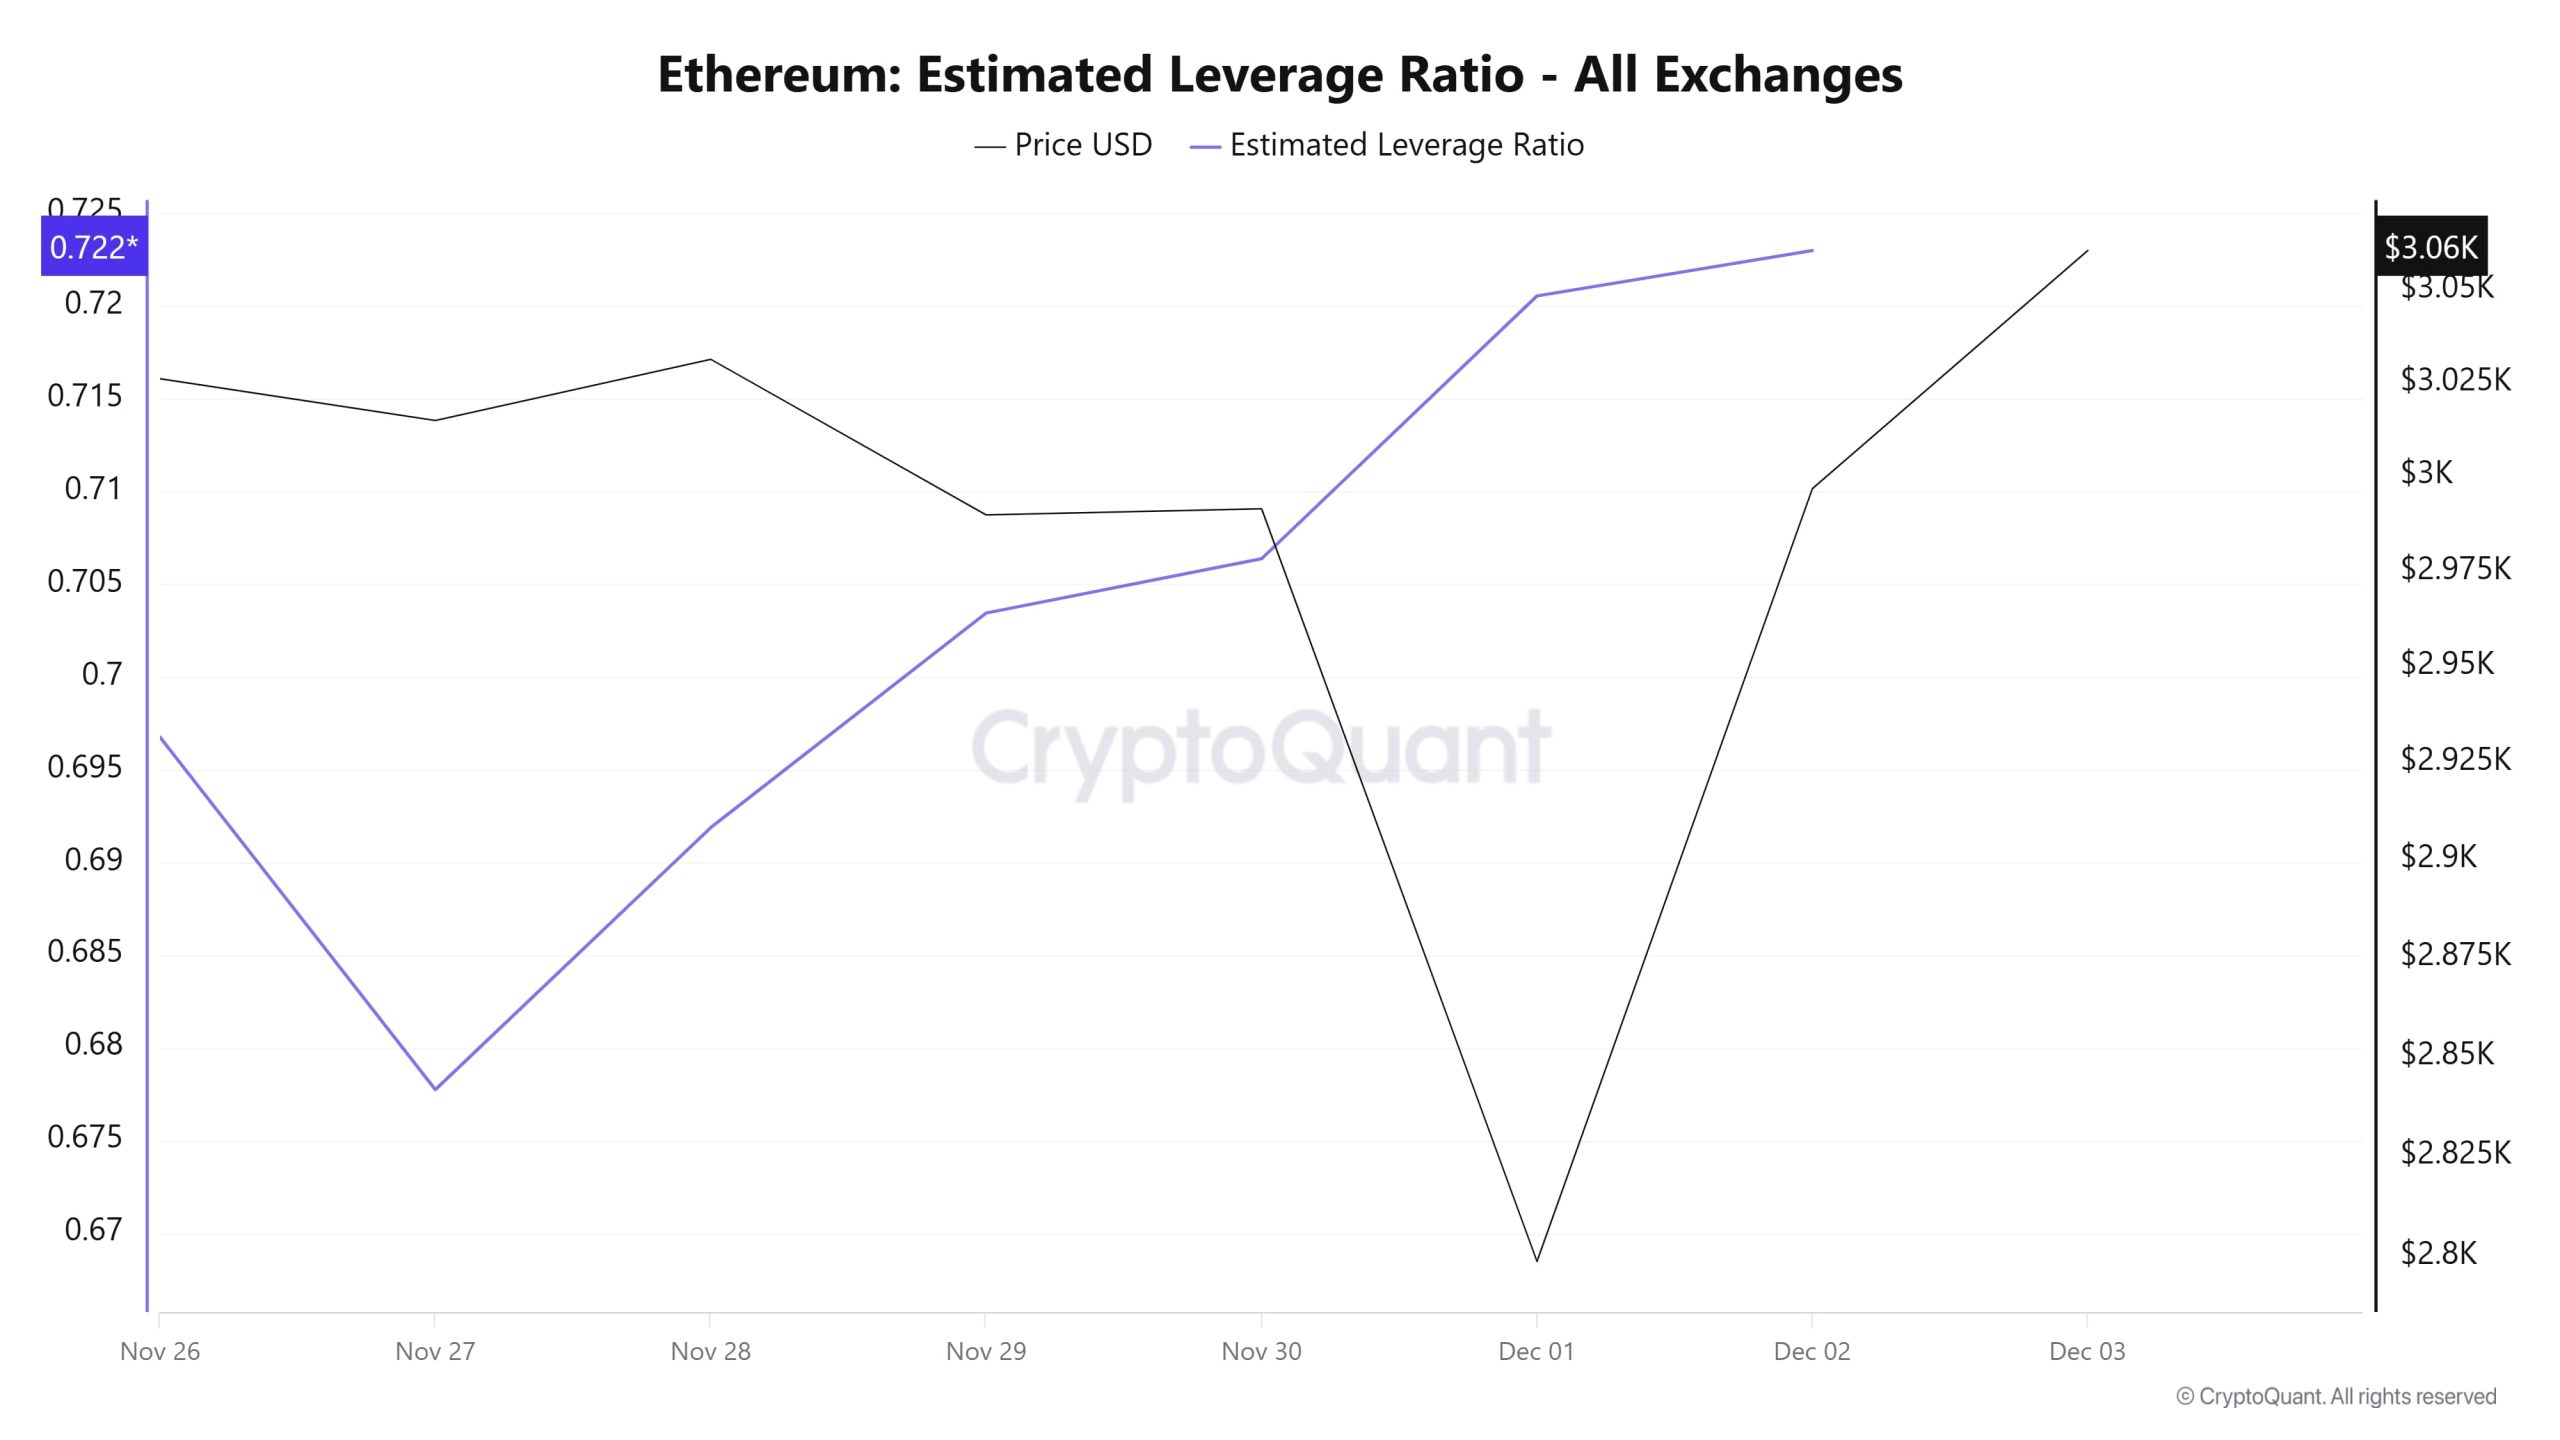
The metric showed an upward trend over the 7-day period, excluding the first day of the process. The ELR (Estimated Leverage Ratio), which stood at 0.696 on November 26, the start of the process, then showed a slight decline, reaching the lowest point of the process on November 27 and falling to 0.677. At the time of writing, the metric stands at 0.722, which also marks the peak of the process and indicates increased investor appetite. A higher ELR means participants are more willing to take on risk and generally indicates bullish conditions or expectations. It should be noted that these increases may also stem from a decrease in reserves. Looking at Ethereum reserves, there were 16.85 million reserves at the beginning of the process, but this figure declined further during the remainder of the process and currently stands at 16.53 million. At the same time, Ethereum’s Open Interest was $35.23 billion at the beginning of the process. As of now, the volume has remained stable throughout the process, and the open interest value has reached $35.87 billion, moving within a narrow band. With all this data, the ELR metric has risen steadily throughout the process. The price of the asset, along with all this data, fluctuated between $2,730 and $3,060. As of now, investors’ and traders’ risk appetite appears to have increased. Consequently, the stable open interest data observed throughout the process, coupled with the decline in reserves, indicated an artificial increase in risk appetite. Although the rise in the ELR ratio shows that reserves have decreased and fear prevails in the market, the situation appears to be balanced.
ETH Onchain Overall
| Metric | Positive 📈 | Negative 📉 | Neutral ➖ |
|---|---|---|---|
| Active Addresses | ✓ | ||
| Total Value Staked | ✓ | ||
| Derivatives | ✓ | ||
| Supply Distribution | ✓ | ||
| Exchange Supply Ratio | ✓ | ||
| Exchange Reserve | ✓ | ||
| Fees and Revenues | ✓ | ||
| Blocks Mined | ✓ | ||
| Transaction | ✓ | ||
| Estimated Leverage Ratio | ✓ |
*The metrics and guidance provided in the table do not alone explain or imply any expectation regarding future price changes in any asset. Digital asset prices can fluctuate based on numerous variables. The on-chain analysis and related guidance are intended to assist investors in their decision-making process, and basing financial investments solely on the results of this analysis may lead to unfavorable outcomes. Even if all metrics produce positive, negative, or neutral results simultaneously, the expected outcomes may not materialize depending on market conditions. It would be beneficial for investors reviewing the report to take these warnings into consideration.
Legal Notice
The investment information, comments, and recommendations contained in this document do not constitute investment advisory services. Investment advisory services are provided by authorized institutions on a personal basis, taking into account the risk and return preferences of individuals. The comments and recommendations contained in this document are of a general nature. These recommendations may not be suitable for your financial situation and risk and return preferences. Therefore, making an investment decision based solely on the information contained in this document may not result in outcomes that align with your expectations.
NOTE: All data used in Ethereum on-chain analysis is based on CryptoQuant.
