
Active Addresses
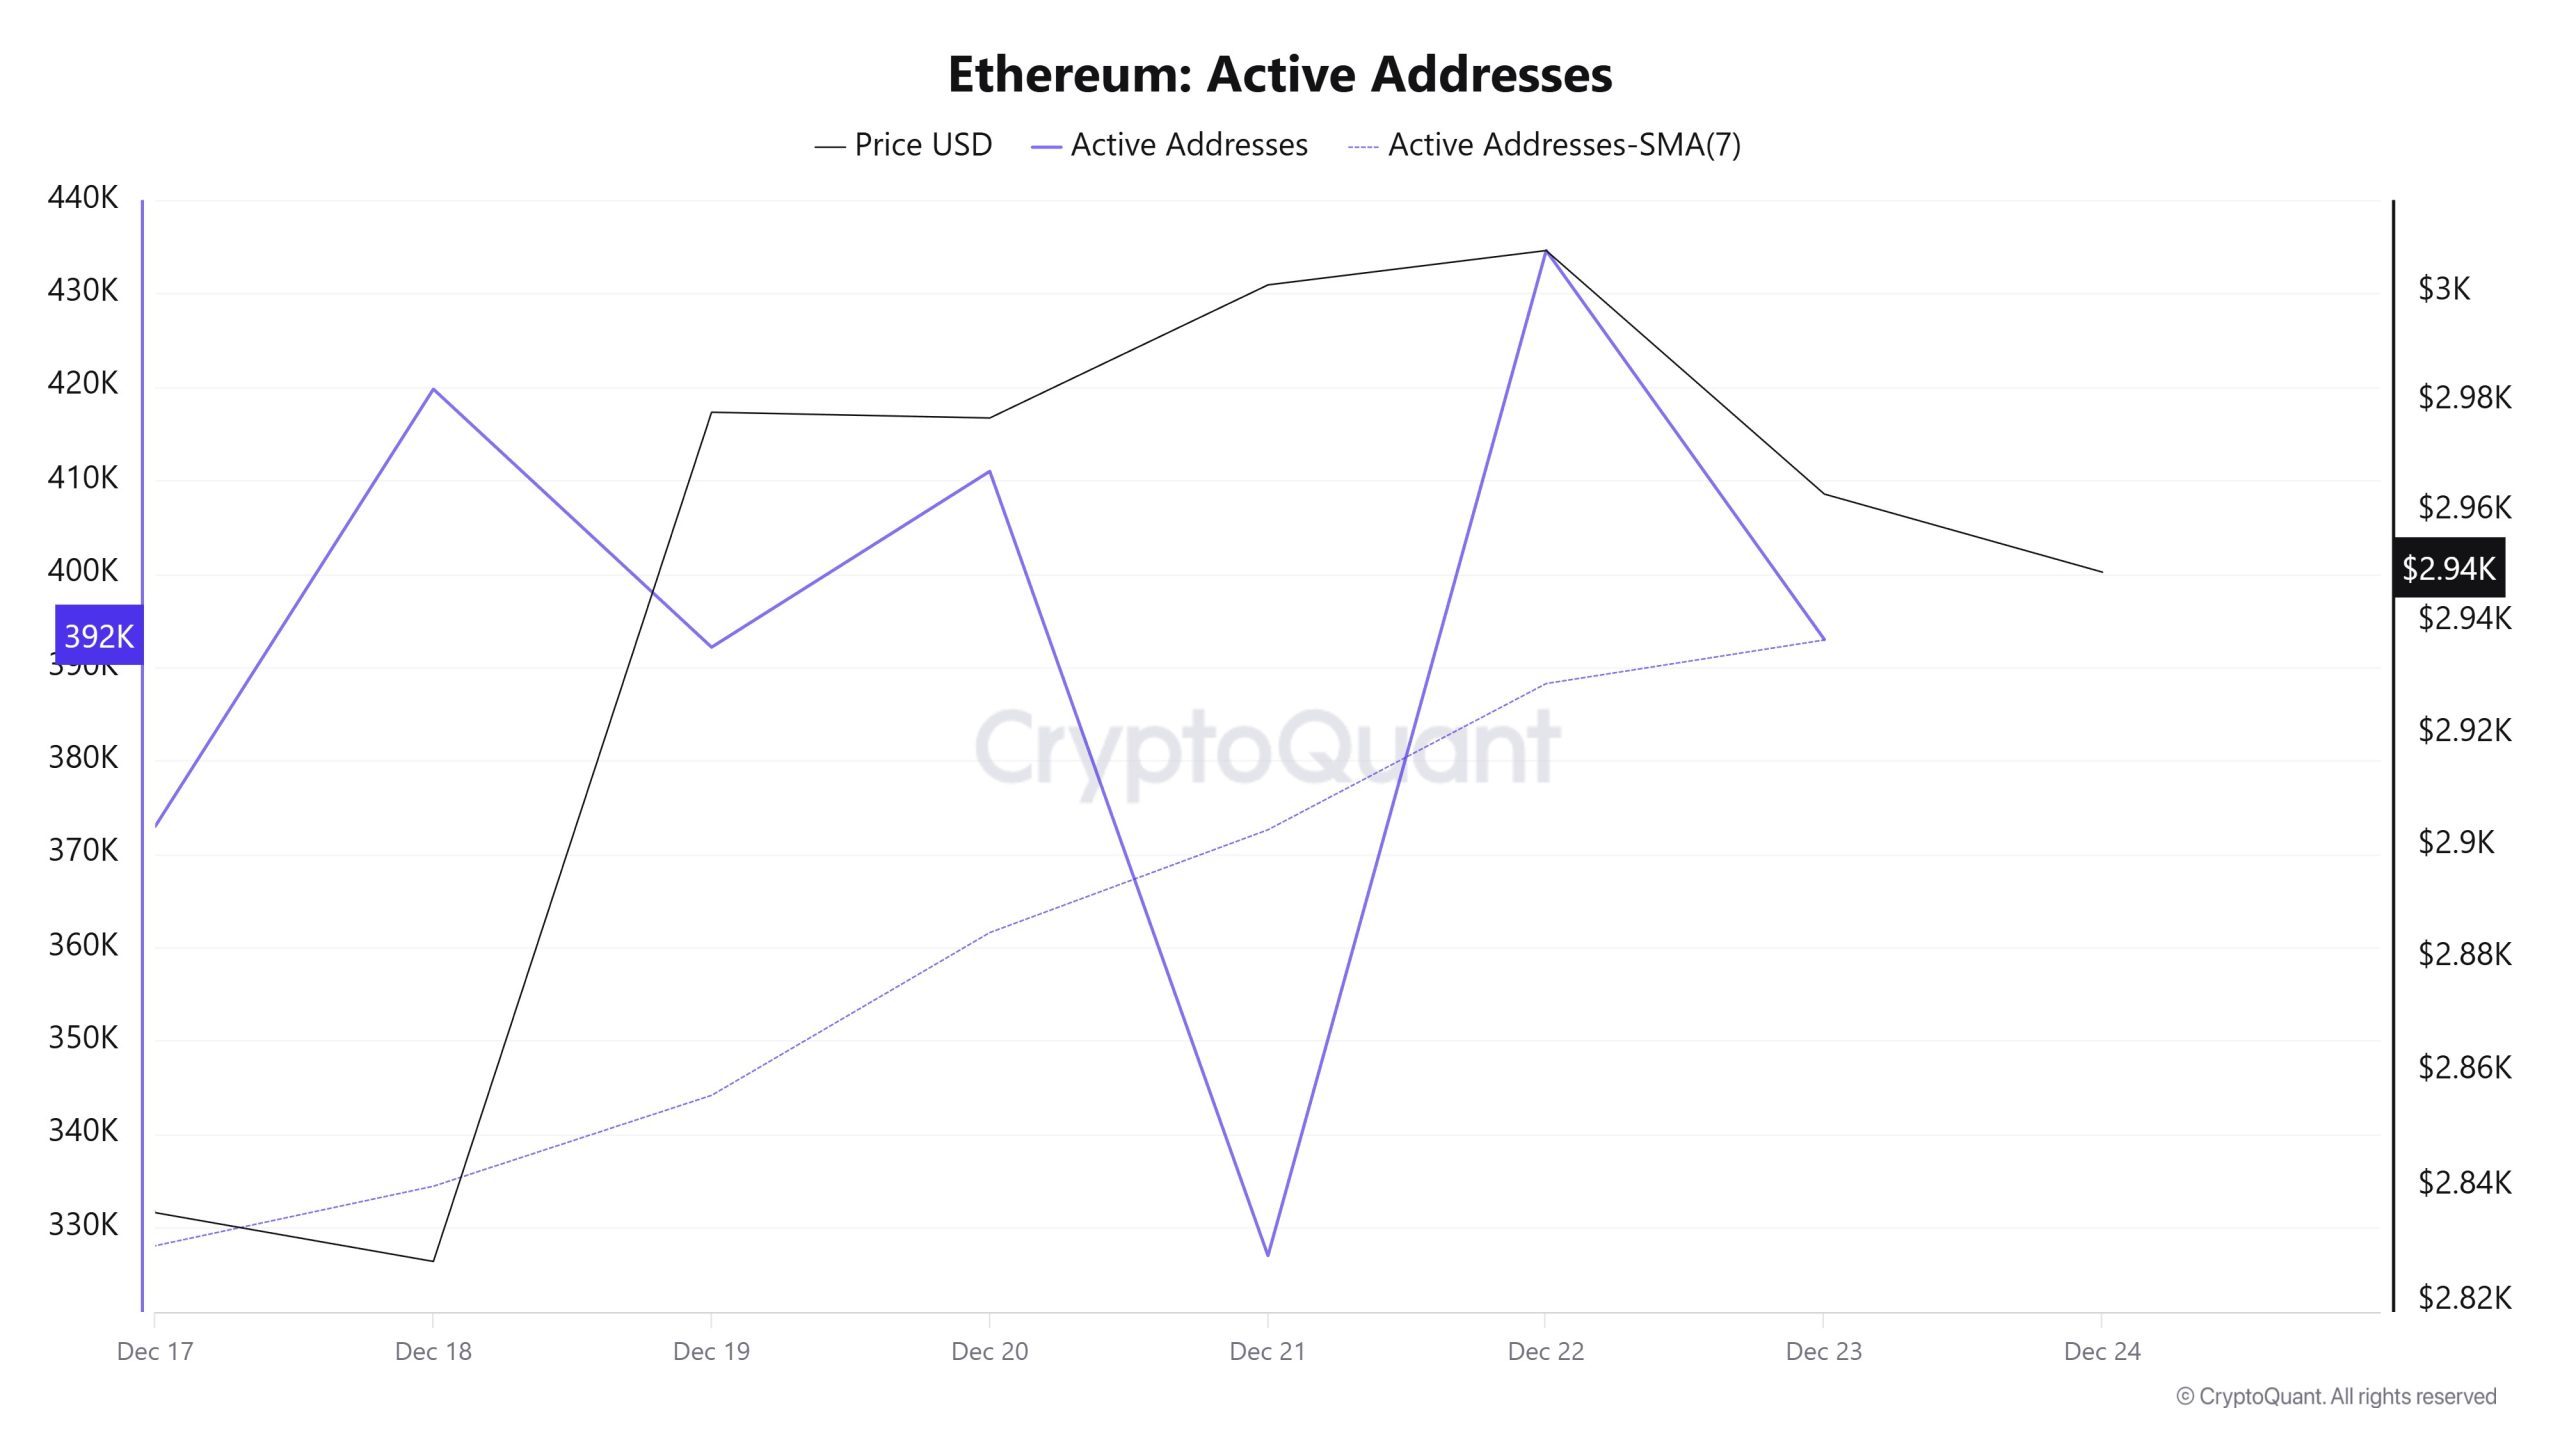
Between December 17 and December 24, a total of 434,598 active addresses were added to the Ethereum network. During this period, the Ethereum price fell from $3,324 to $2,964. On December 22, in particular, when the price hit the active address, a certain decline was observed in both the active address count and the price point. When examining the 7-day simple moving average (SMA), it can be seen that the Ethereum price is generally trending downward.
Active Sending Addresses
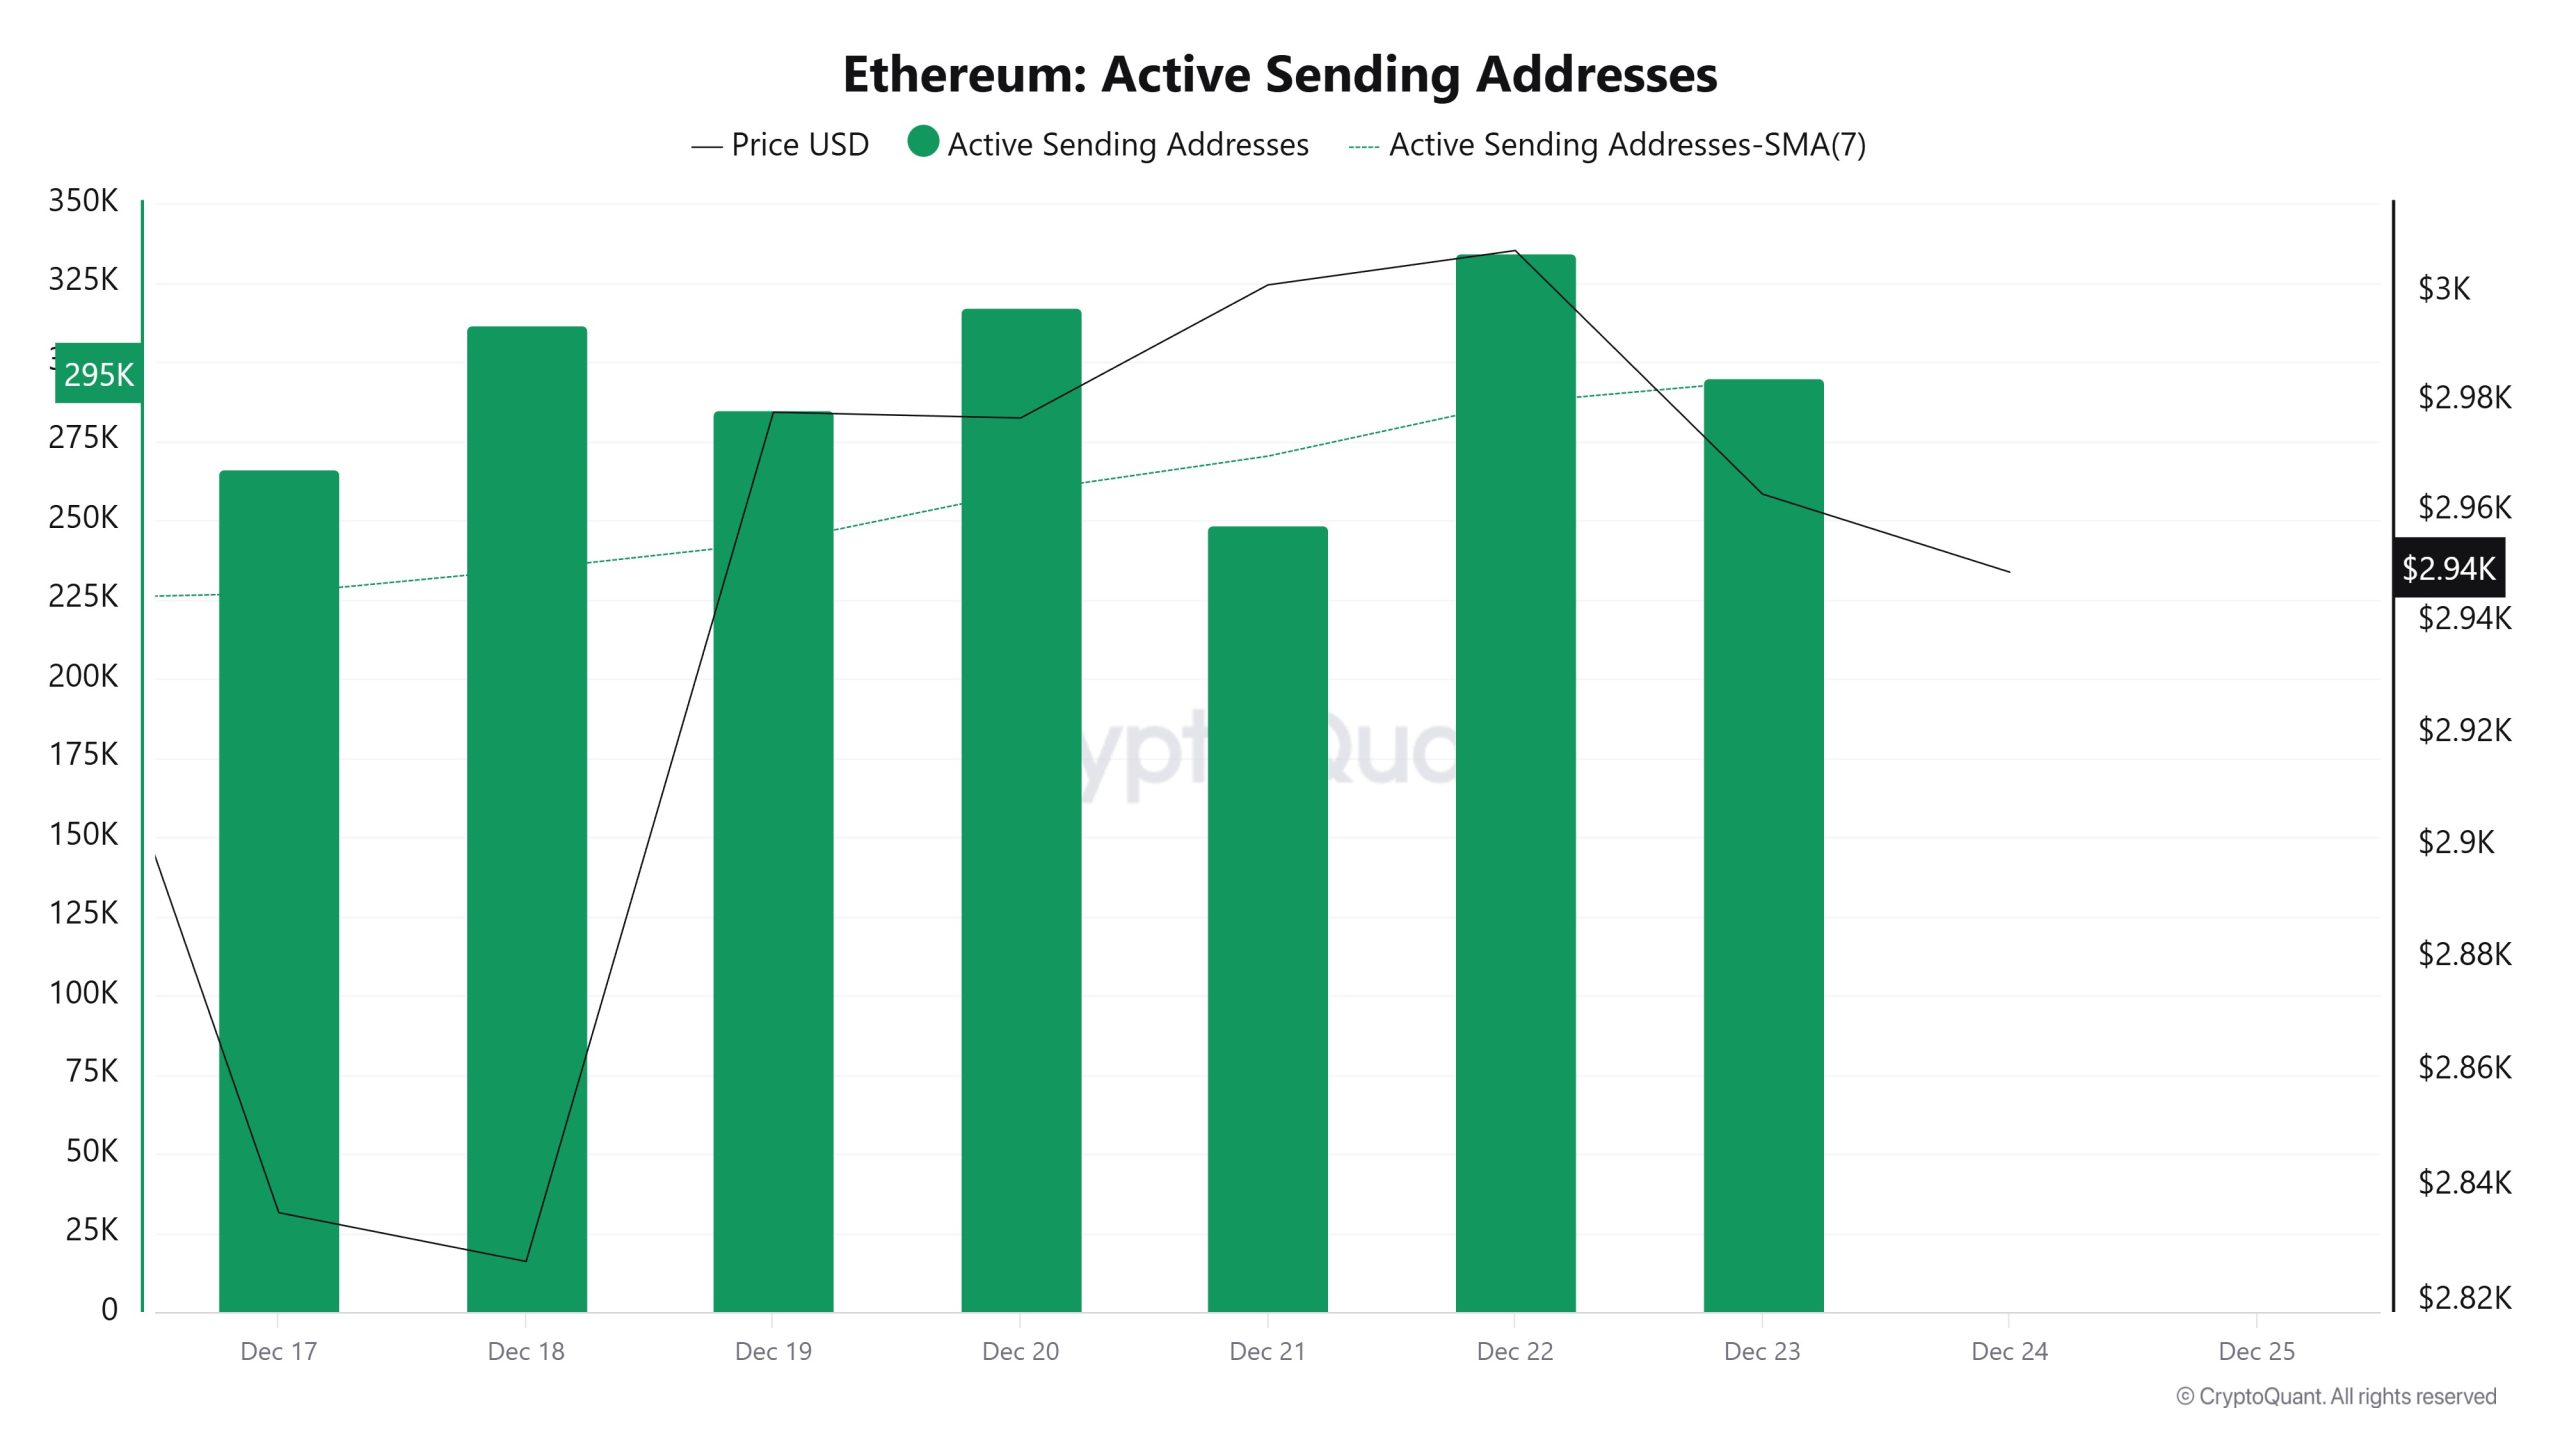
Between December 17 and December 24, high levels of active sending activity were observed in active sending addresses along with the Black Line (price line). On the day the price reached its highest level on a weekly basis, active sending addresses reached 334,426.
Active Receiving Addresses
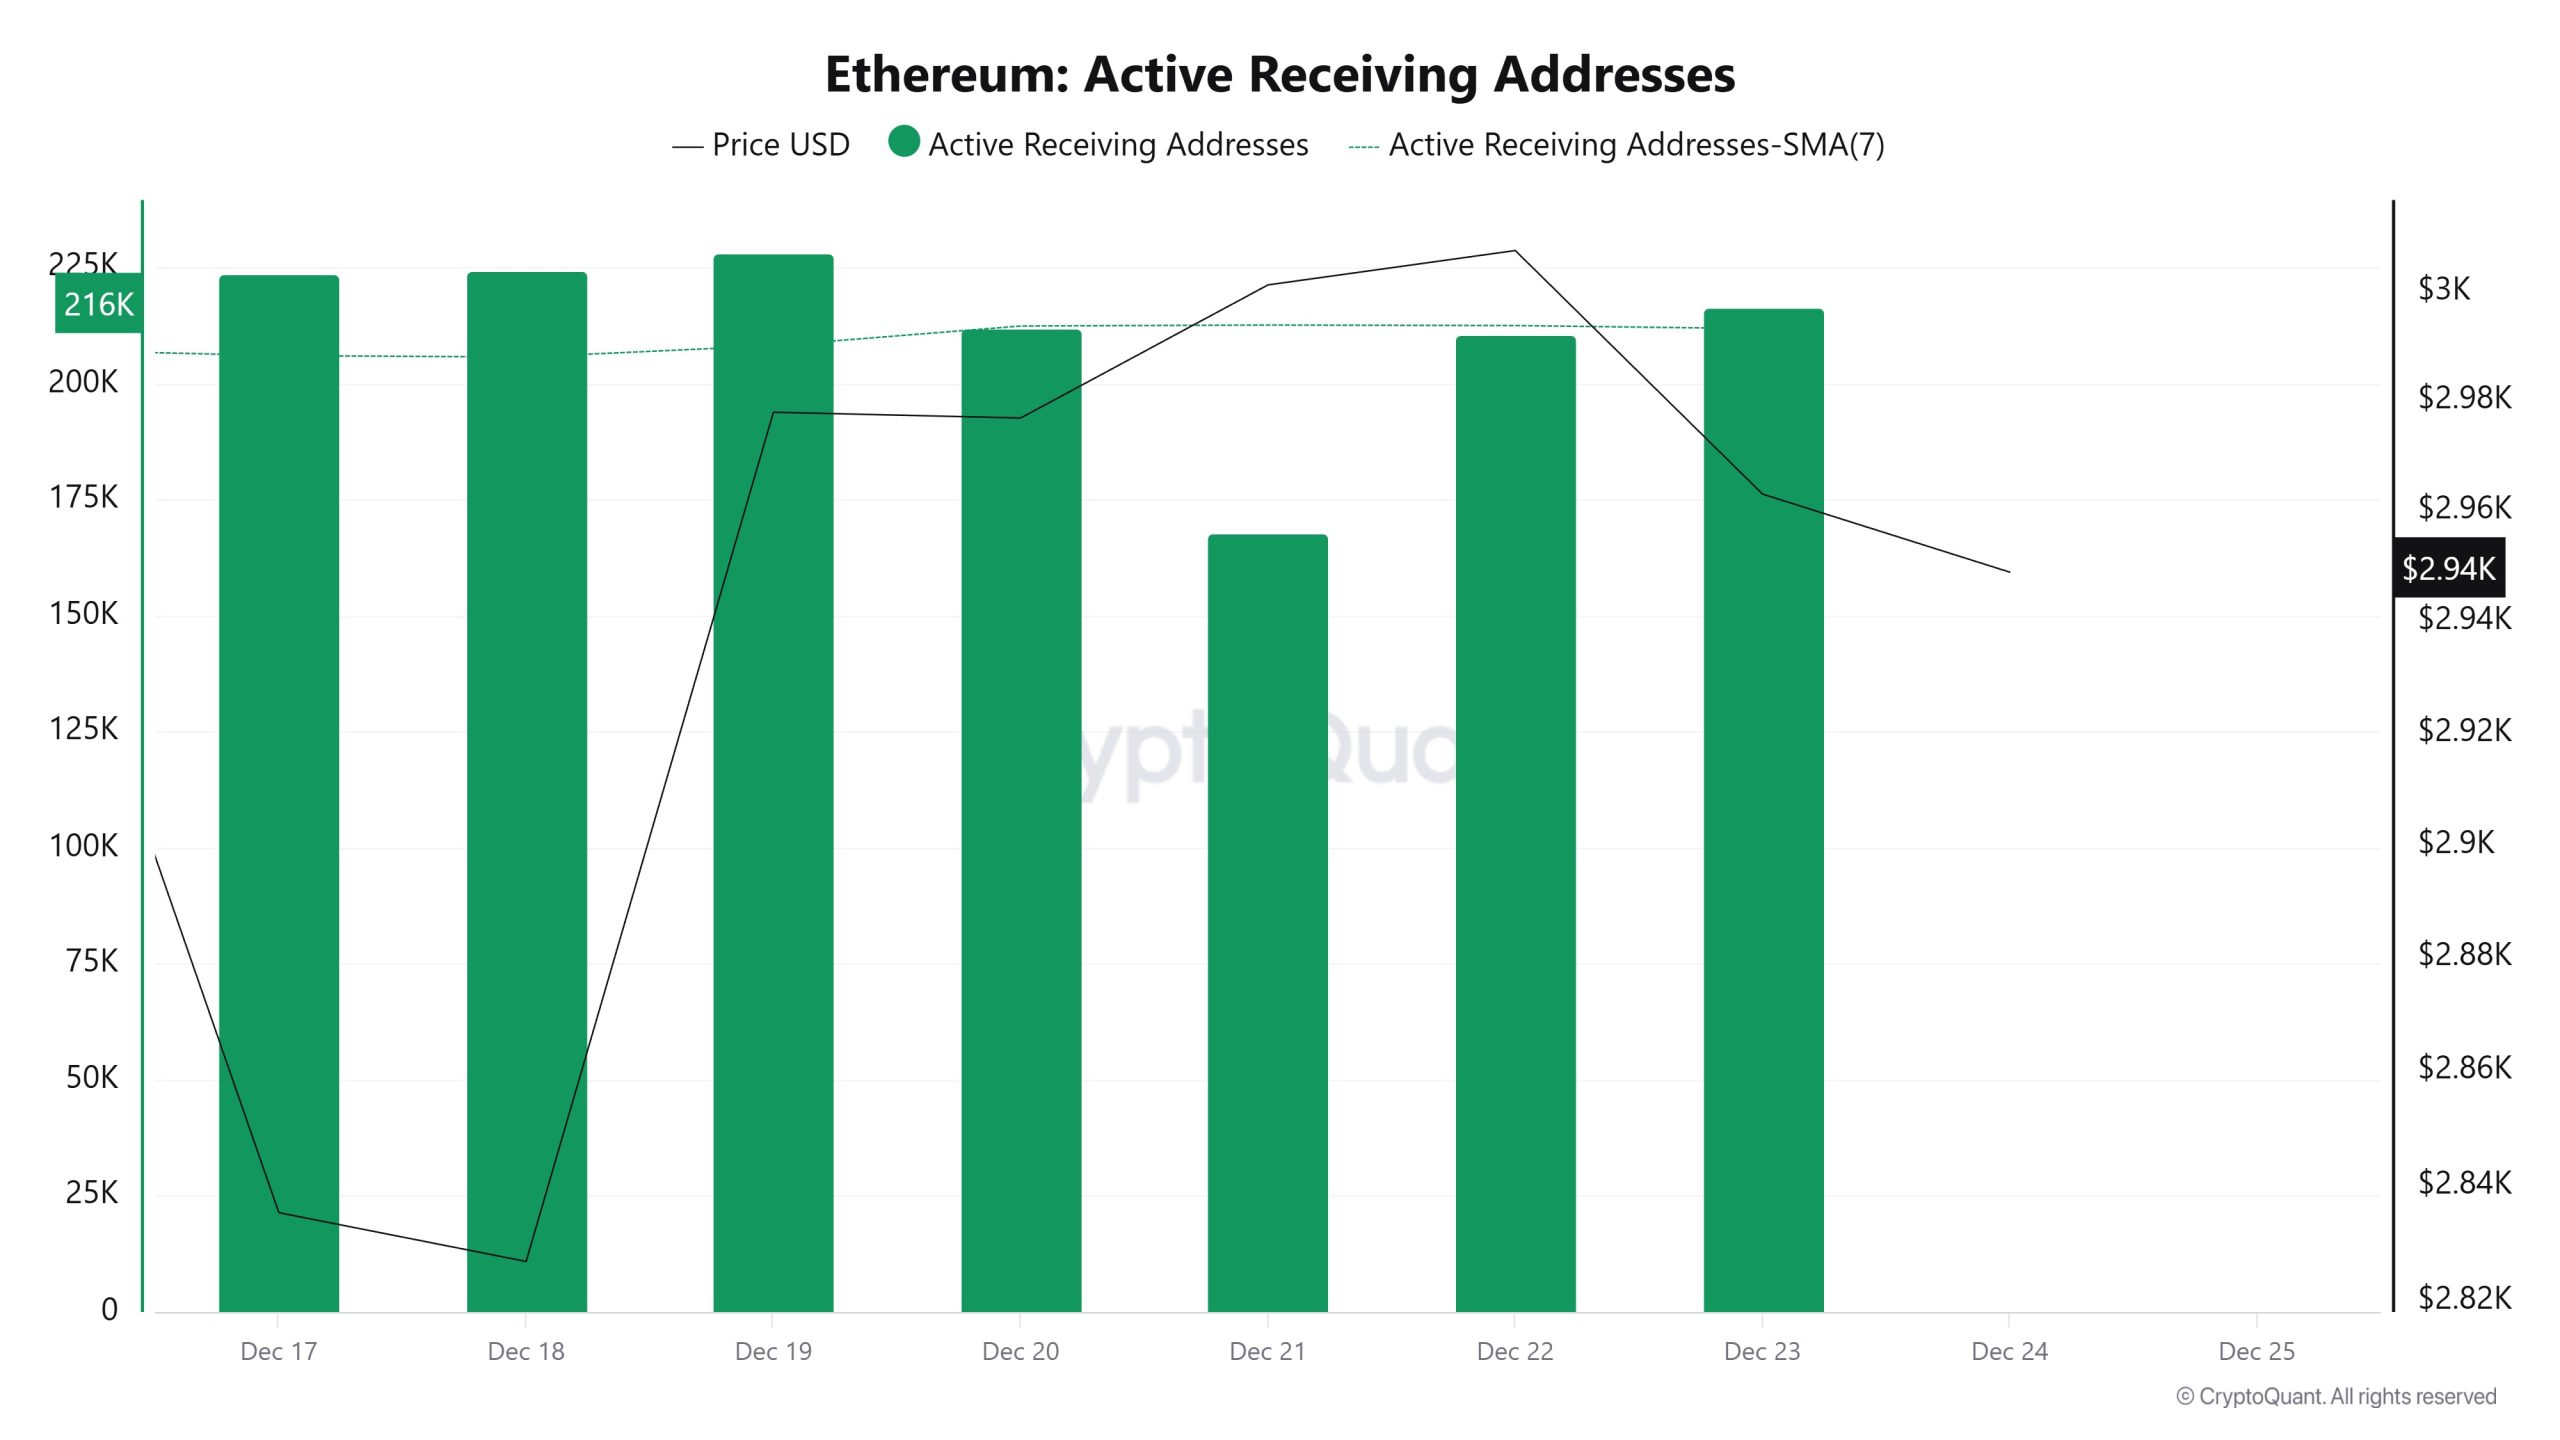
Between December 17 and December 24, while there was no significant increase in active receiving addresses, the price was seen to move downward. On the day the price reached its highest level, active receiving addresses reached 210,810, indicating an increase in purchases.
Total Value Staked
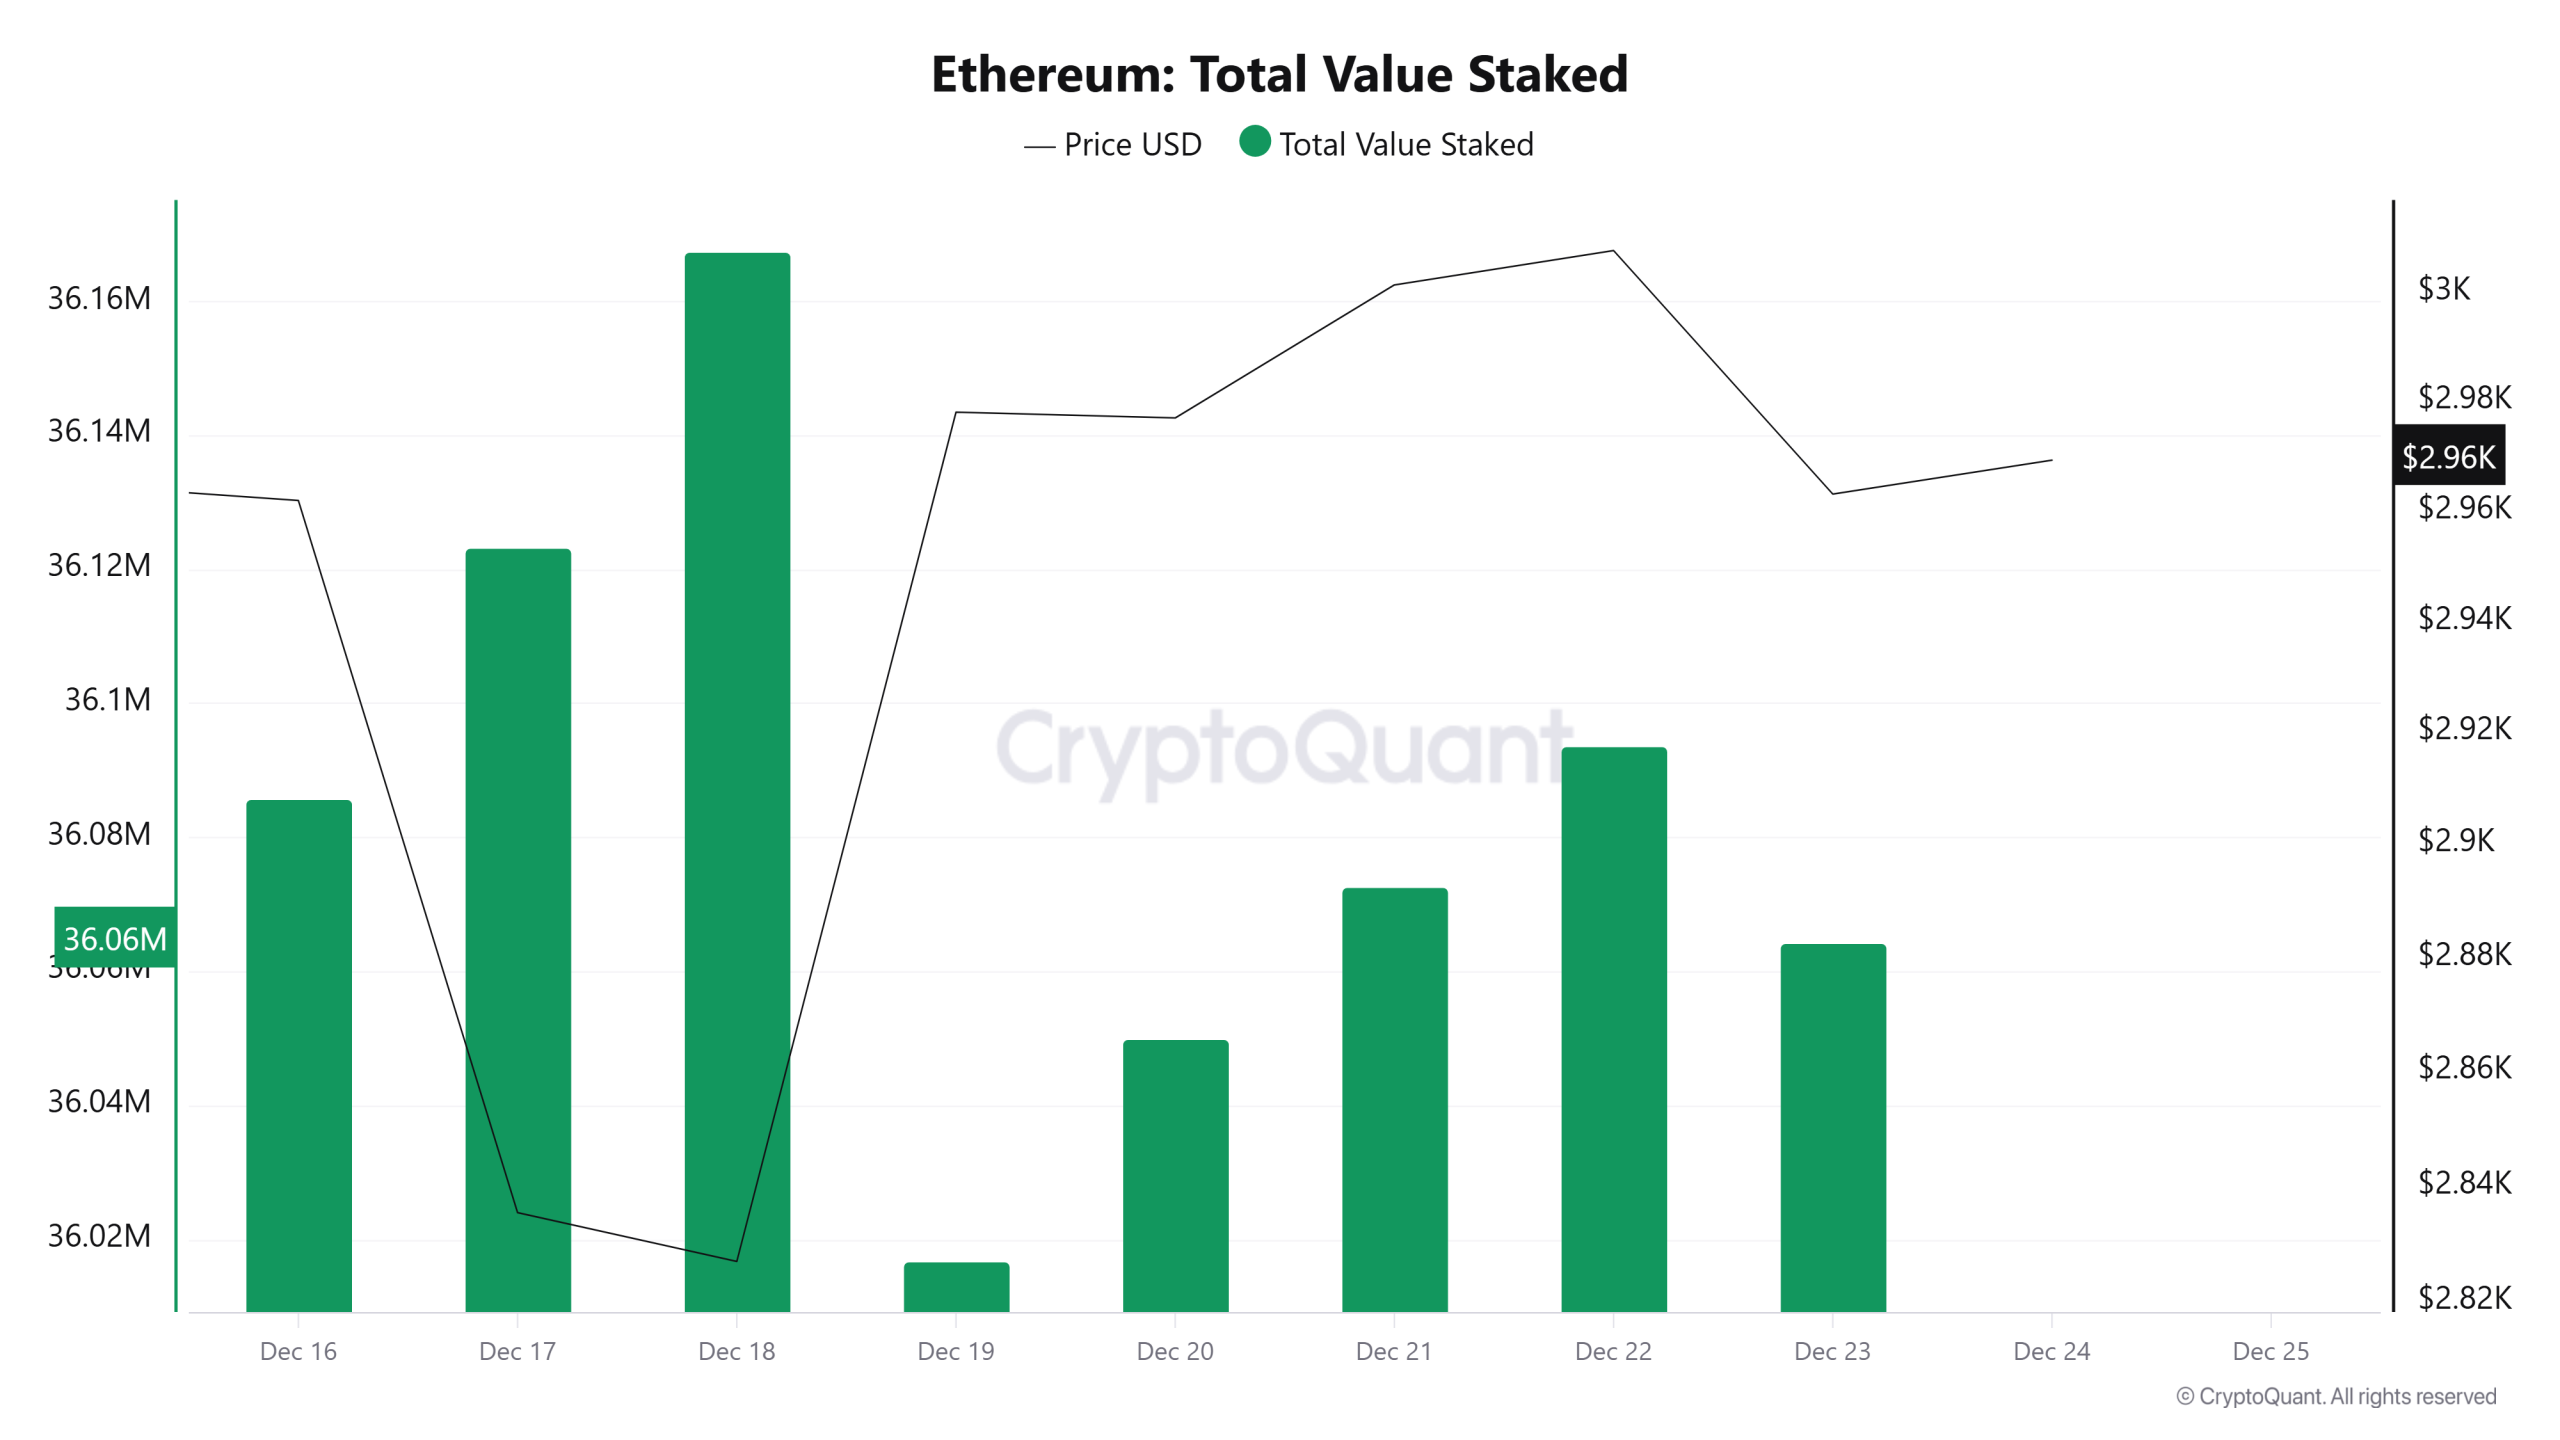
On December 17, while the ETH price was trading at $2,835, the Total Value Staked was at 36,123,232. As of December 23, the ETH price rose to $2,963, recording a 4.52% increase, while Total Value Staked fell to 36,064,231, recording a 0.16% decline.
Staking Inflows
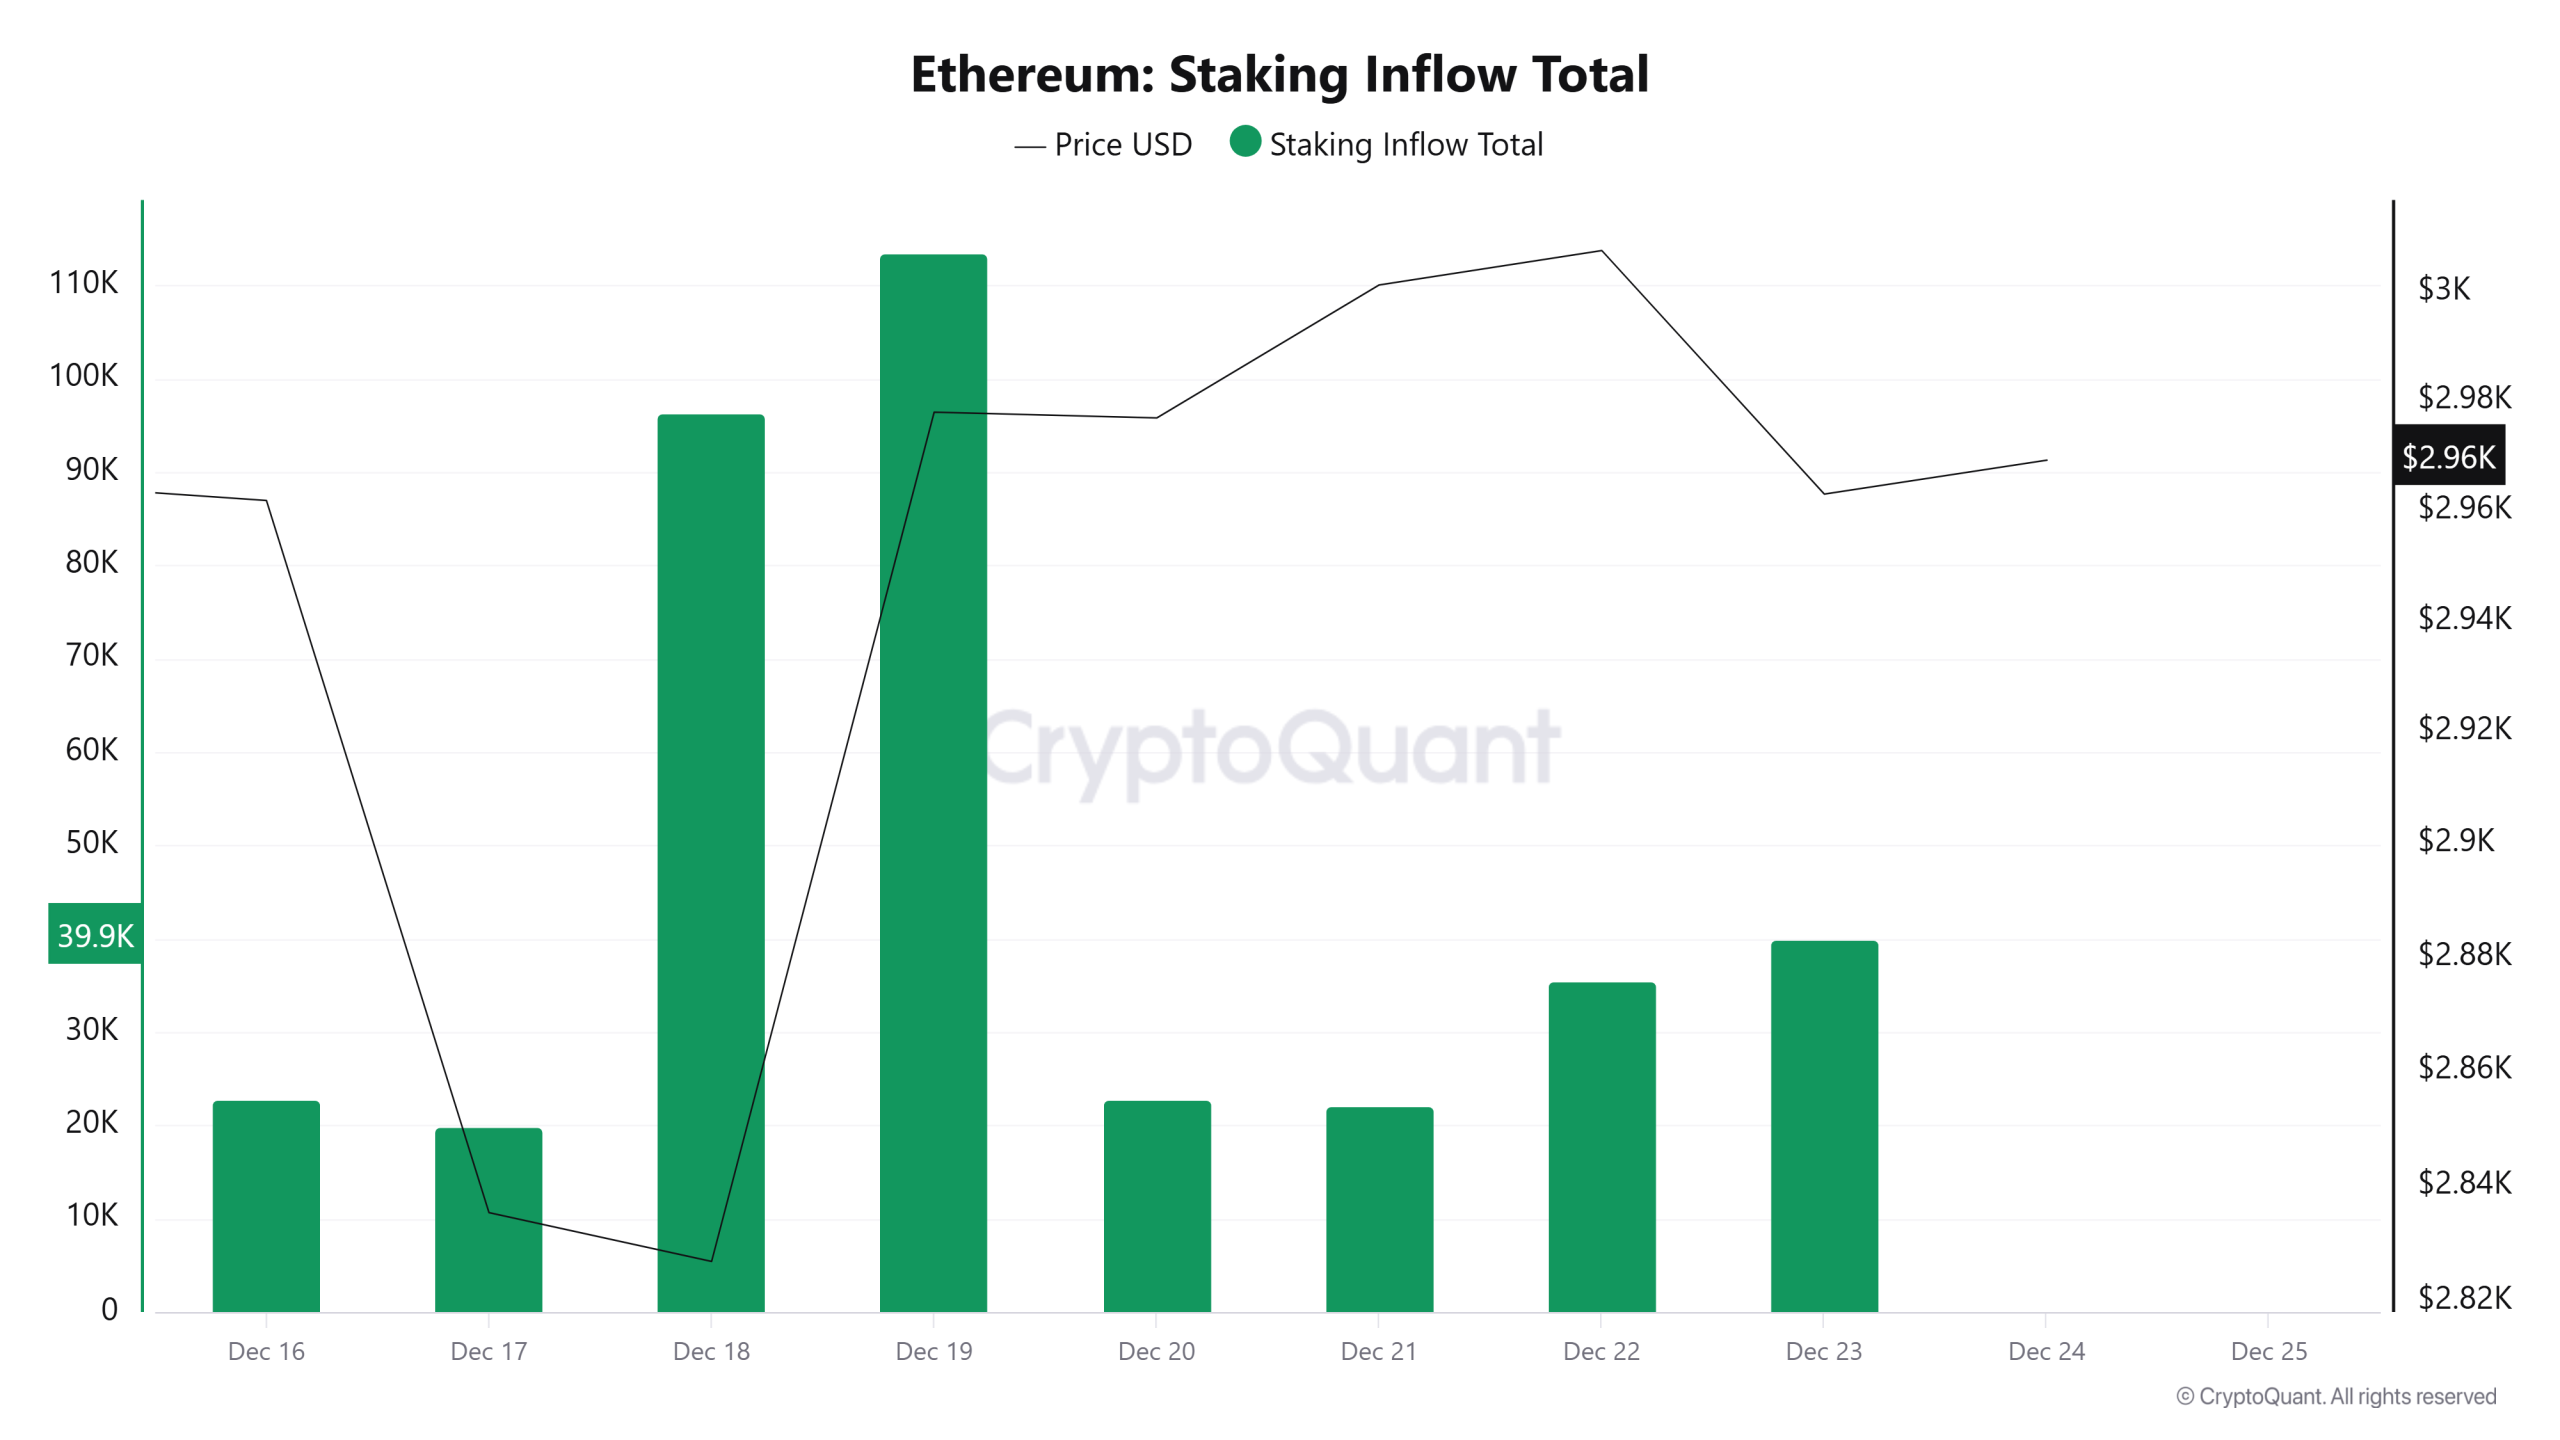
On December 17, while the ETH price was trading at $2,835, Staking Inflow was at 19,890. As of December 23, while the ETH price rose to $2,963, Staking Inflow rose to 39,971, recording a 100.96% increase.
Derivatives
Open Interest
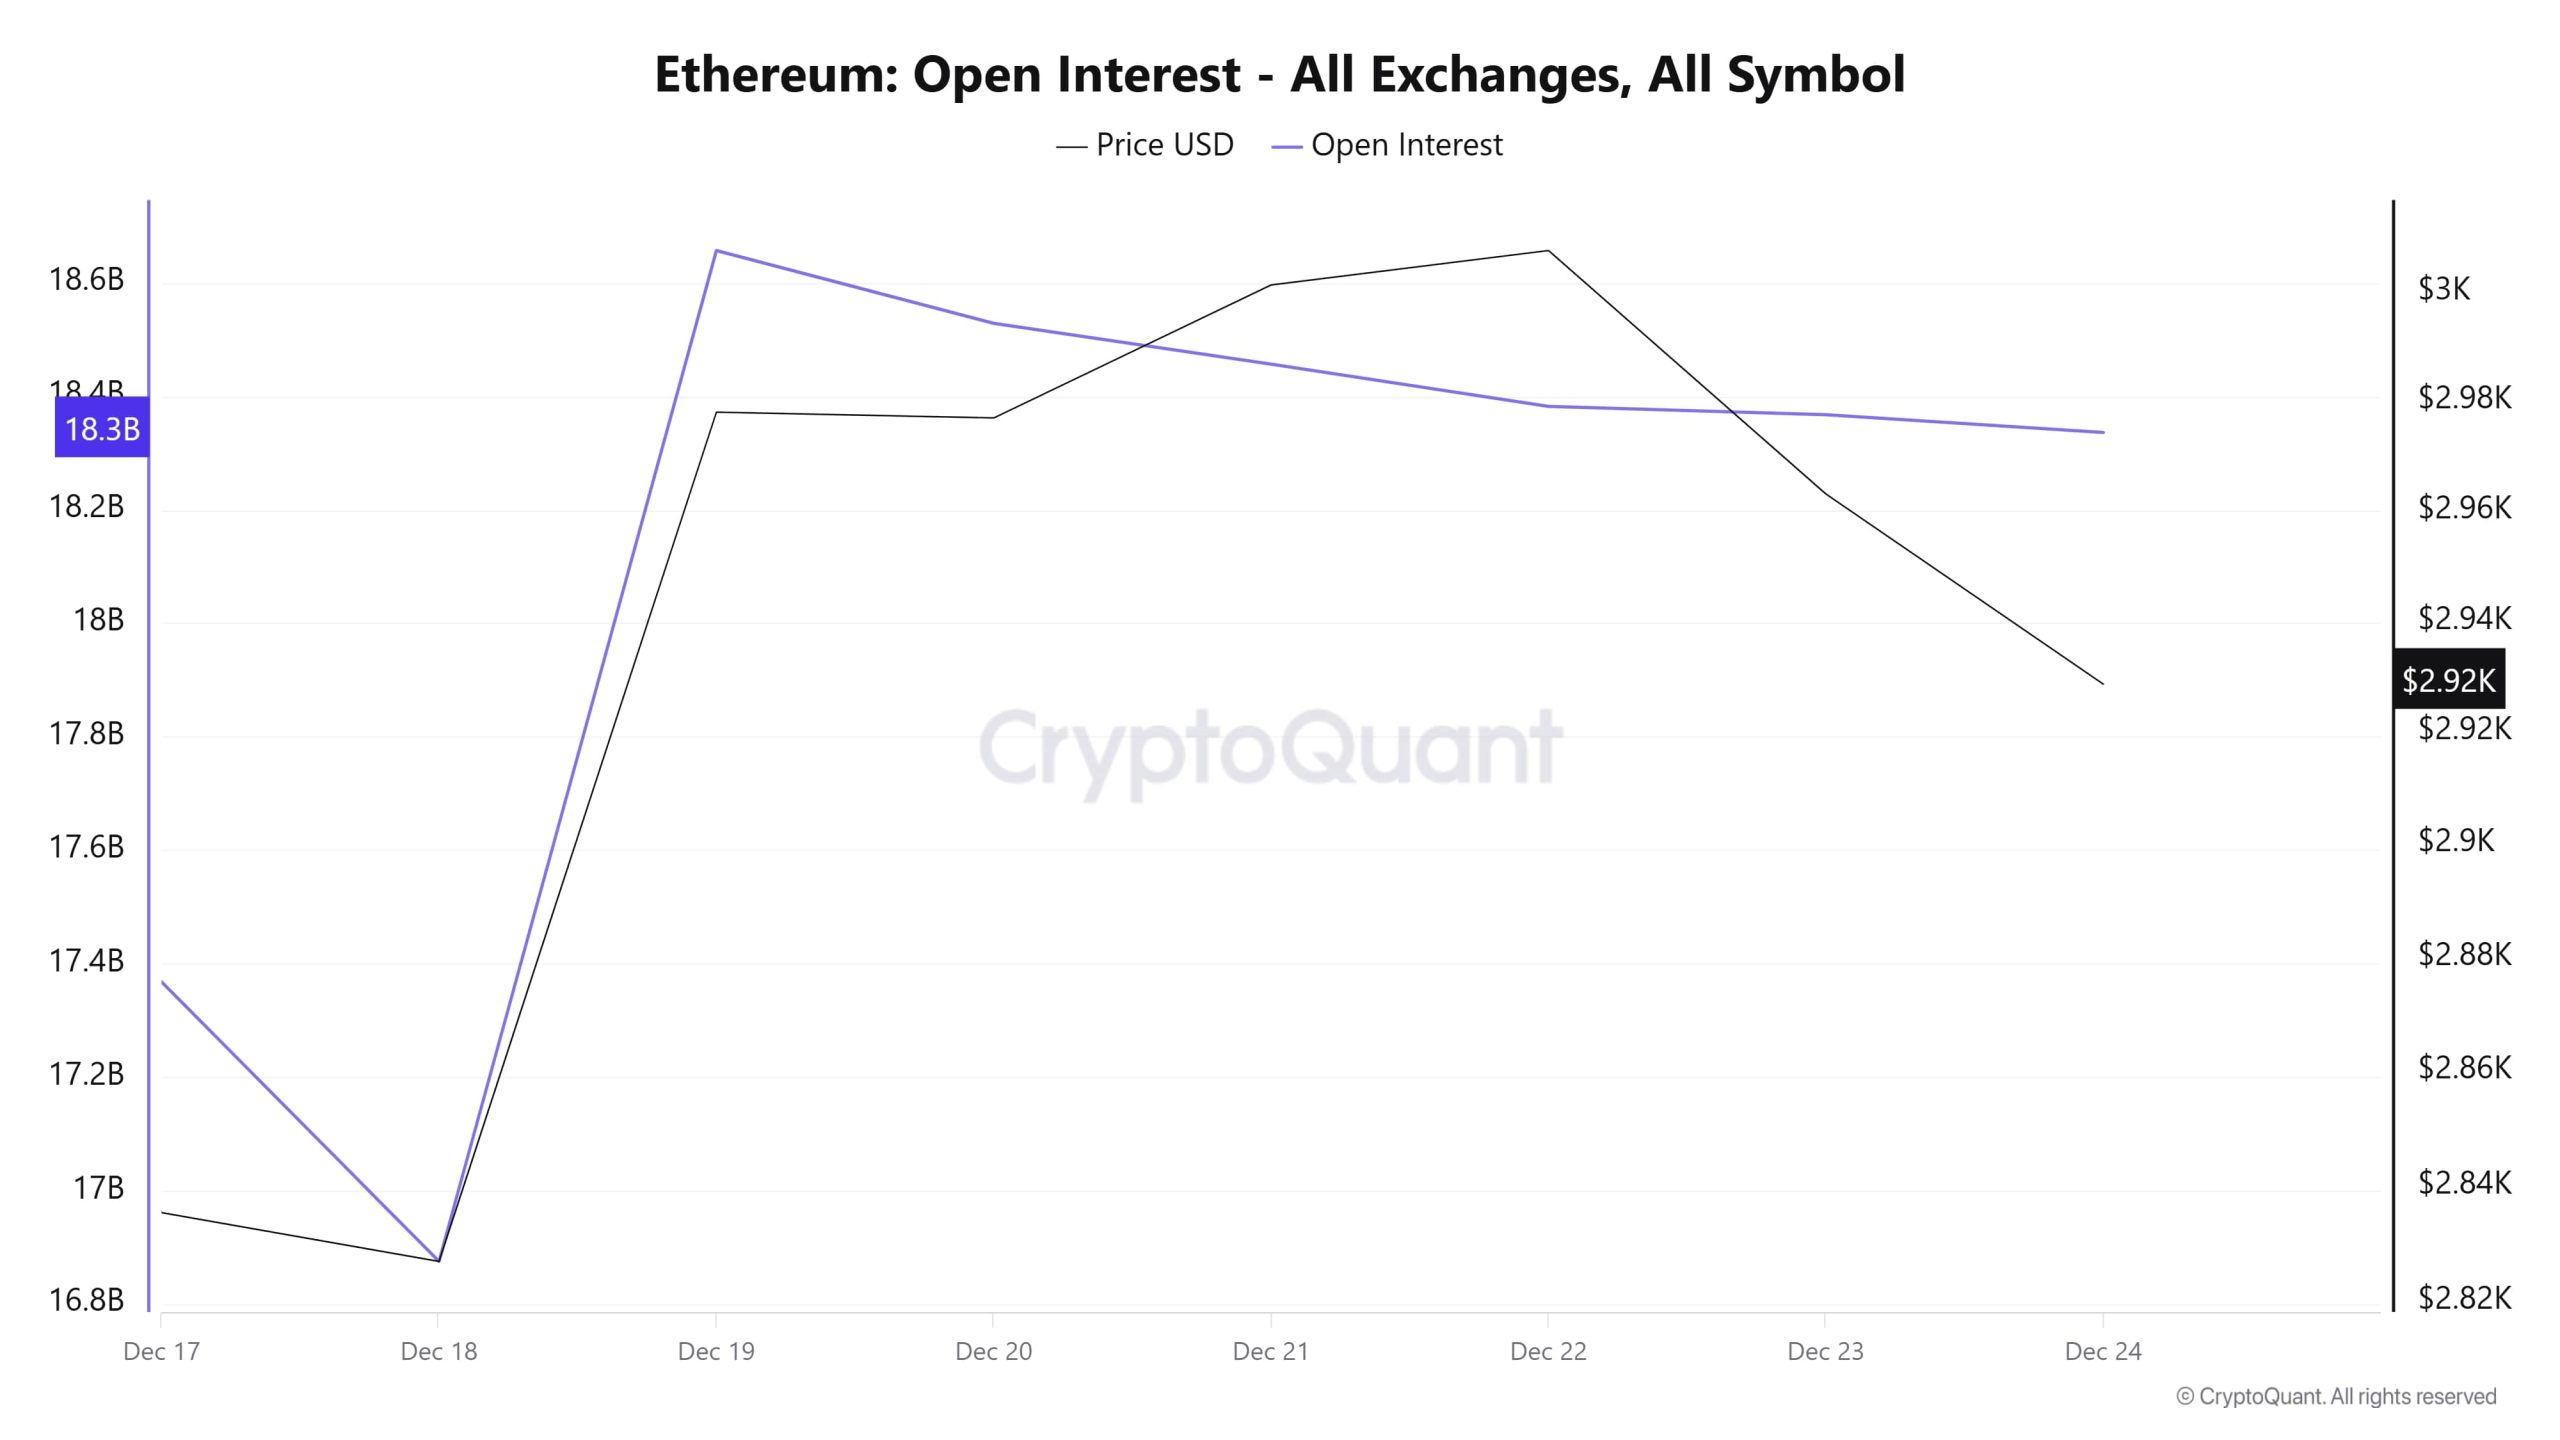
Both open interest and the sharp price increase up to December 19 are noteworthy. It appears that previously closed positions have been reopened and interest in ETH has increased.
Although the horizontal trend continues until December 22, open interest remains stable even if the price declines afterwards. This divergence indicates that despite positions being largely preserved, weakness has begun on the price side.
The overall picture reveals that Ethereum is still heavily leveraged and that the price is sensitive in the short term due to this position load.
Funding Rate
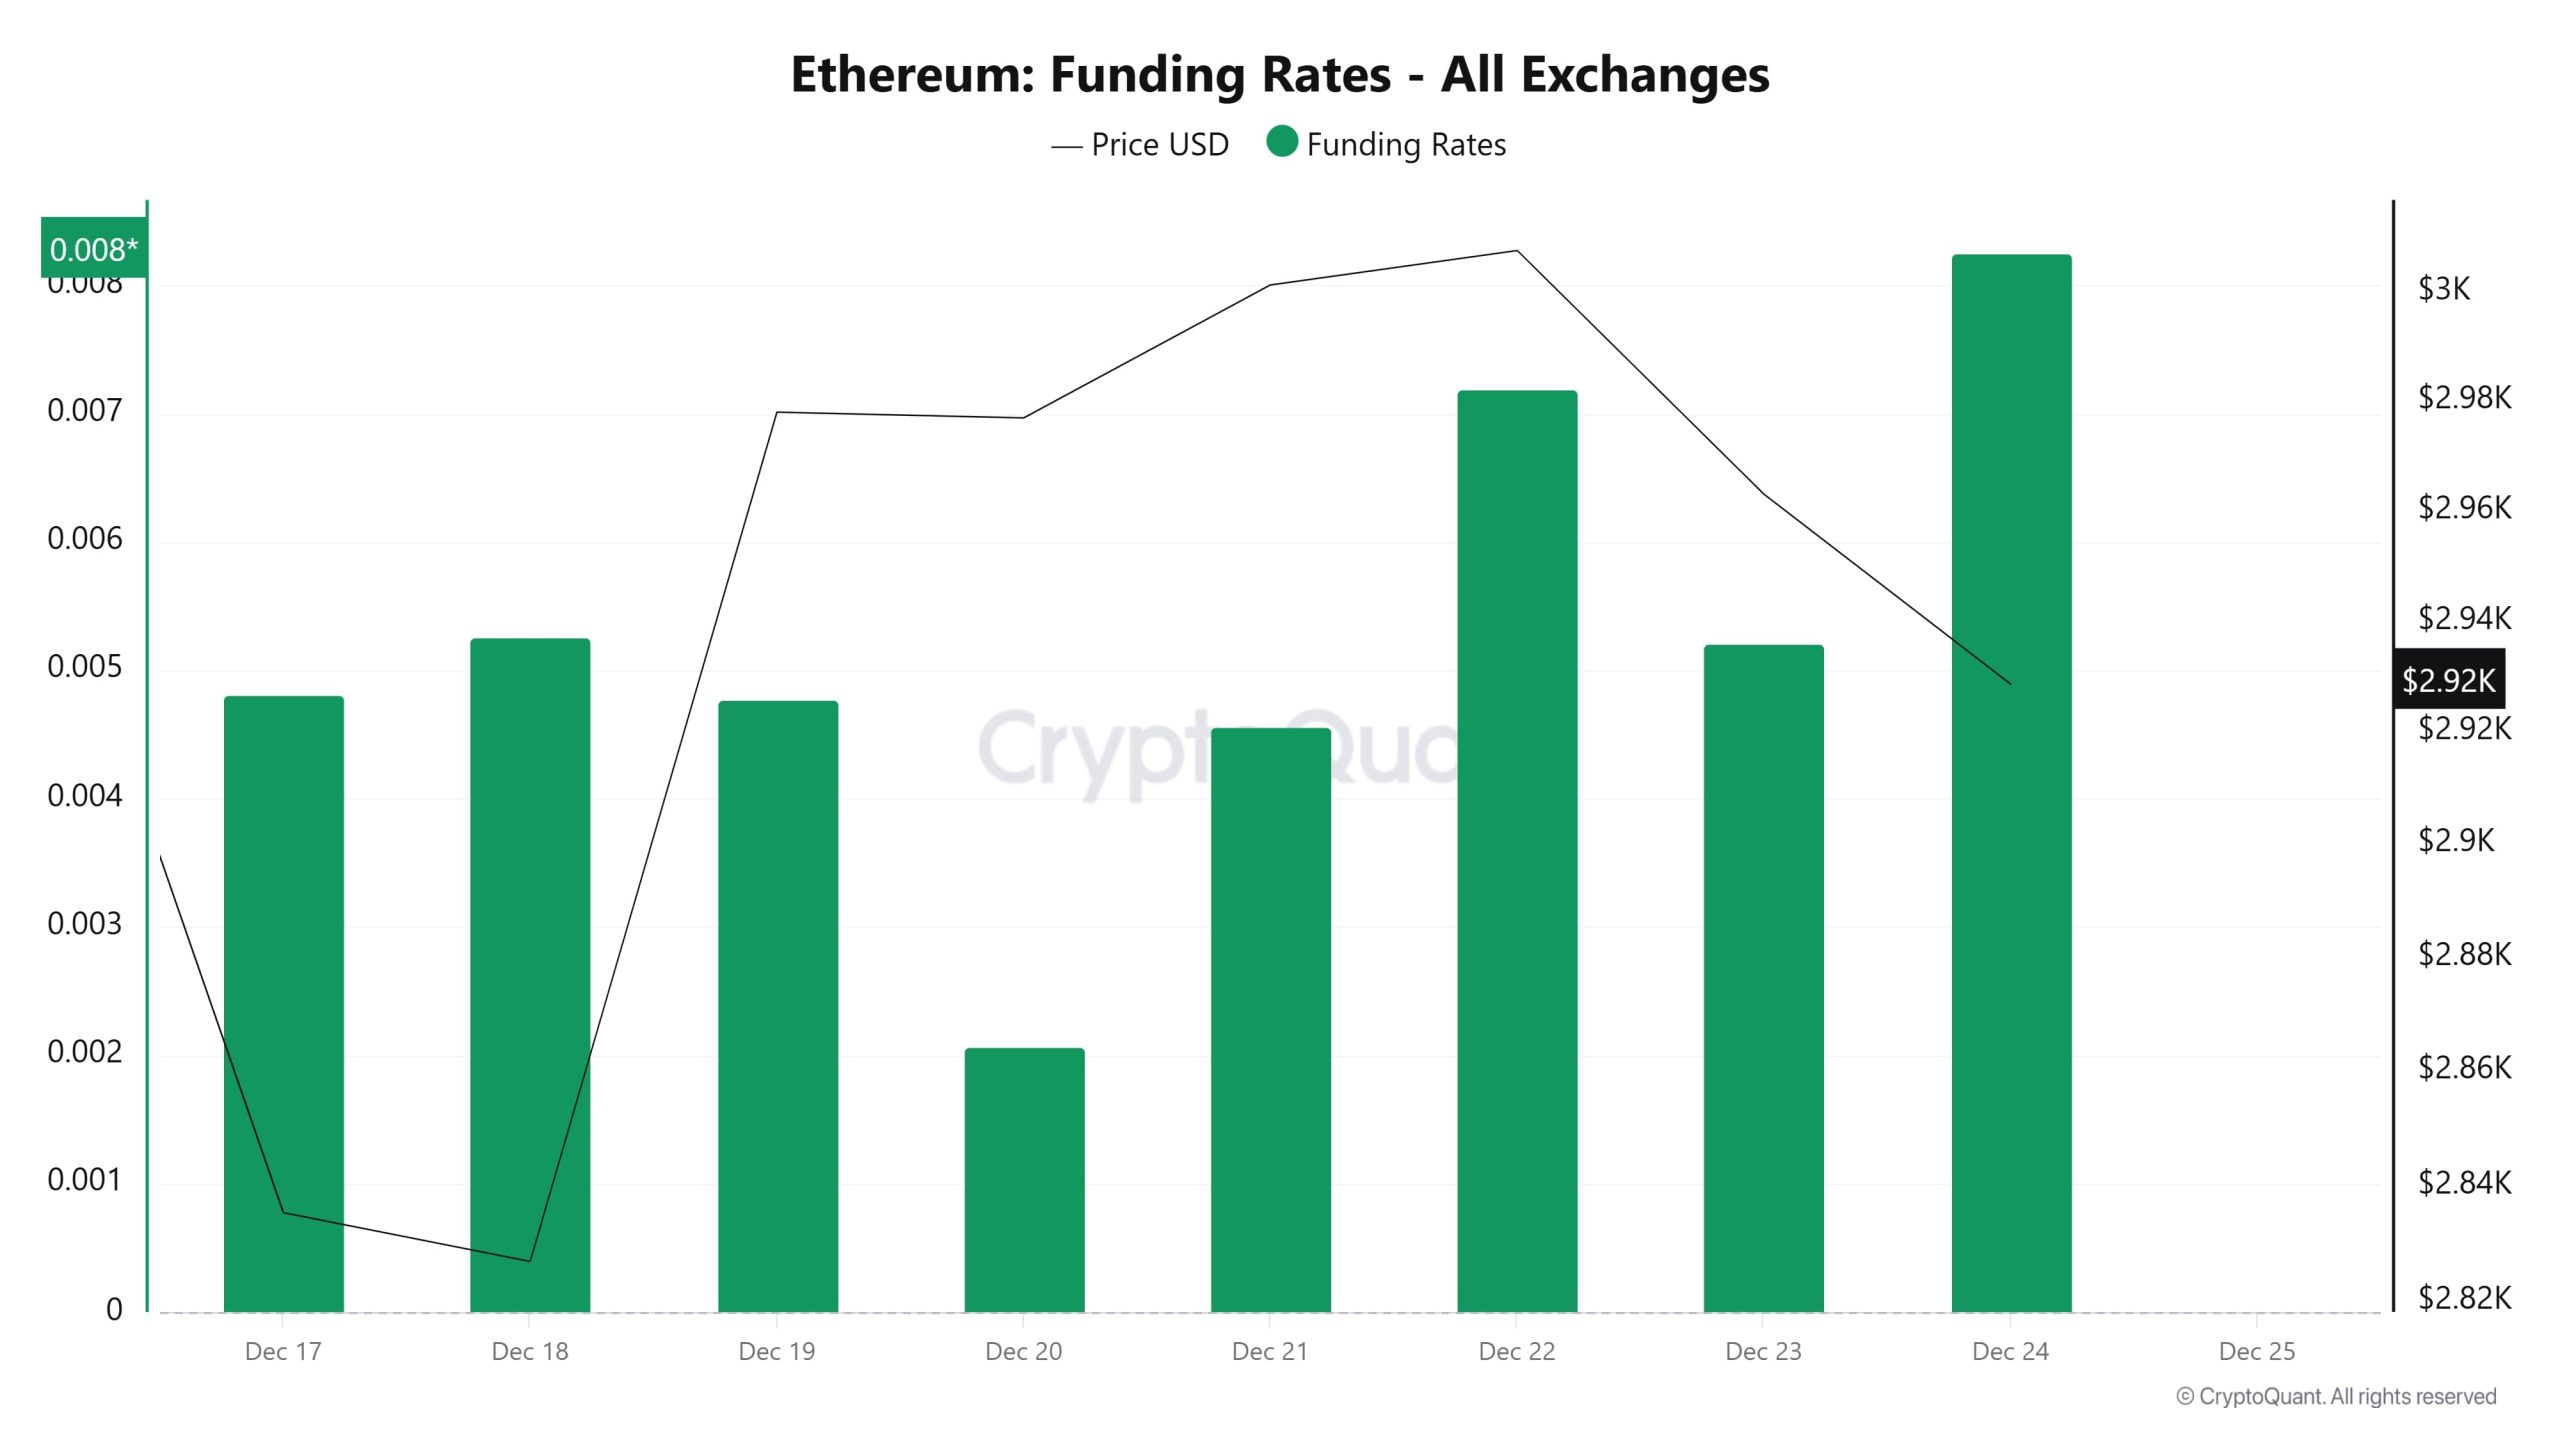
The chart shows that Ethereum funding rates remain in positive territory and that long positions dominate the market. Despite short-term pullbacks, the rates are rising again, suggesting that buying appetite is intact.
However, there is a pullback on the price side after the peak. The weakening of the price while the funding rate rises indicates that leveraged long positions have increased but these positions are struggling to carry the price. A volatile outlook is at the forefront in the short term.
Long & Short Liquidations
With the ETH price falling from around $3,020 to $2,775, approximately $285 million worth of long positions were liquidated. During the same period, nearly $308 million worth of short positions were also liquidated.
| Date | Long Amount (Million $) | Short Amount (Million $) |
|---|---|---|
| December 17 | 72.85 | 38.40 |
| December 18 | 71.14 | 126.33 |
| December 19 | 24.09 | 64.06 |
| December 20 | 1.72 | 1.76 |
| December 21 | 12.02 | 17.60 |
| December 22 | 39.50 | 43.60 |
| December 23 | 63.91 | 16.68 |
| Total | 285.23 | 308.43 |
Supply Distribution
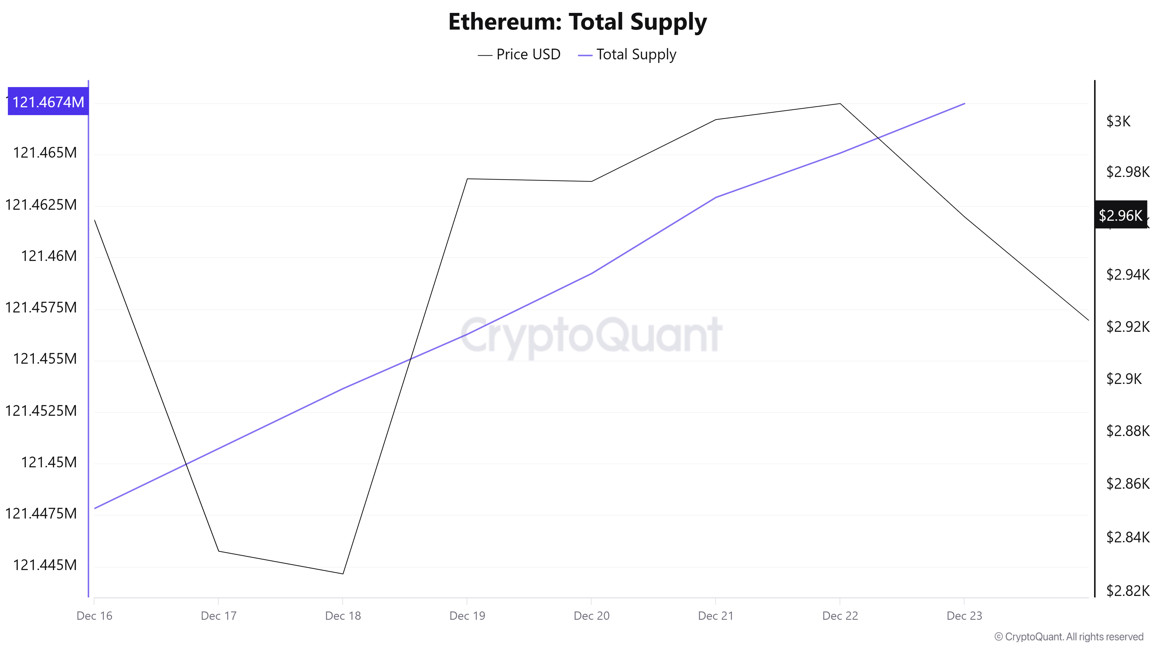
Total Supply: Reached 121,447,820 units, an increase of approximately 0.01617% compared to last week.
New Supply: The amount of ETH produced this week was 19,642.
Velocity: The velocity, which was 9.99 last week, reached 9.96 as of December 23.
| Wallet Category | 12/16/2025 | December 23, 2025 | Change (%) |
|---|---|---|---|
| 100 – 1k ETH | 8.3631M | 8.3721M | 0.11 |
| 1k – 10k ETH | 12.1182M | 12.2485M | 1.08 |
| 10k – 100k ETH | 22.2843M | 22.2719M | -0.06% |
| 100k+ ETH | 4.5149M | 4.3695M | -3.22% |
While a limited pullback is observed in the 10k–100k ETH range, we see no clear buying appetite forming in this segment. In contrast, the strong increase recorded in the 1k–10k ETH group indicates that mid-sized investors are clearly positioned on the buy side for Ethereum. On the other hand, the decline in the largest wallets holding 100k+ ETH suggests that major players are remaining cautious and may be inclined toward partial distribution.
Exchange Supply Ratio
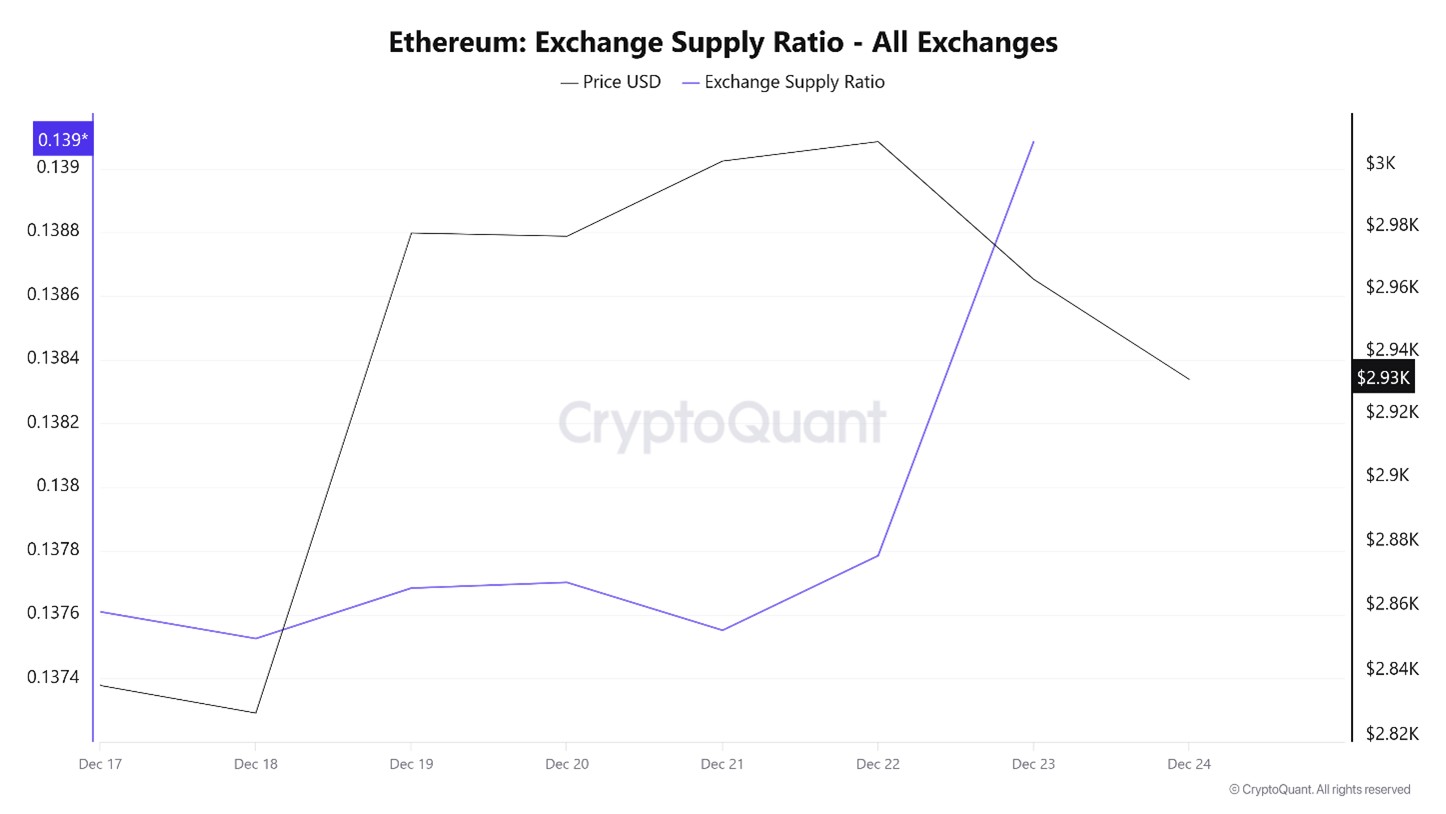
Between December 10 and December 17, the Ethereum Exchange Supply Ratio rose from 0.13752255 to 0.13778532. During this period, the Ethereum price rose from $2,826 to $2,923. Since December 23, at the point where the price and the Exchange Supply Ratio intersect, the correlation between the price and the Exchange Supply Ratio has turned positive. This indicates that the price has fallen while the amount of Ethereum supplied to exchanges has increased, and that long-term investors are likely turning to buying Ethereum. It appears that the Ethereum price may generally rise.
Exchange Reserve
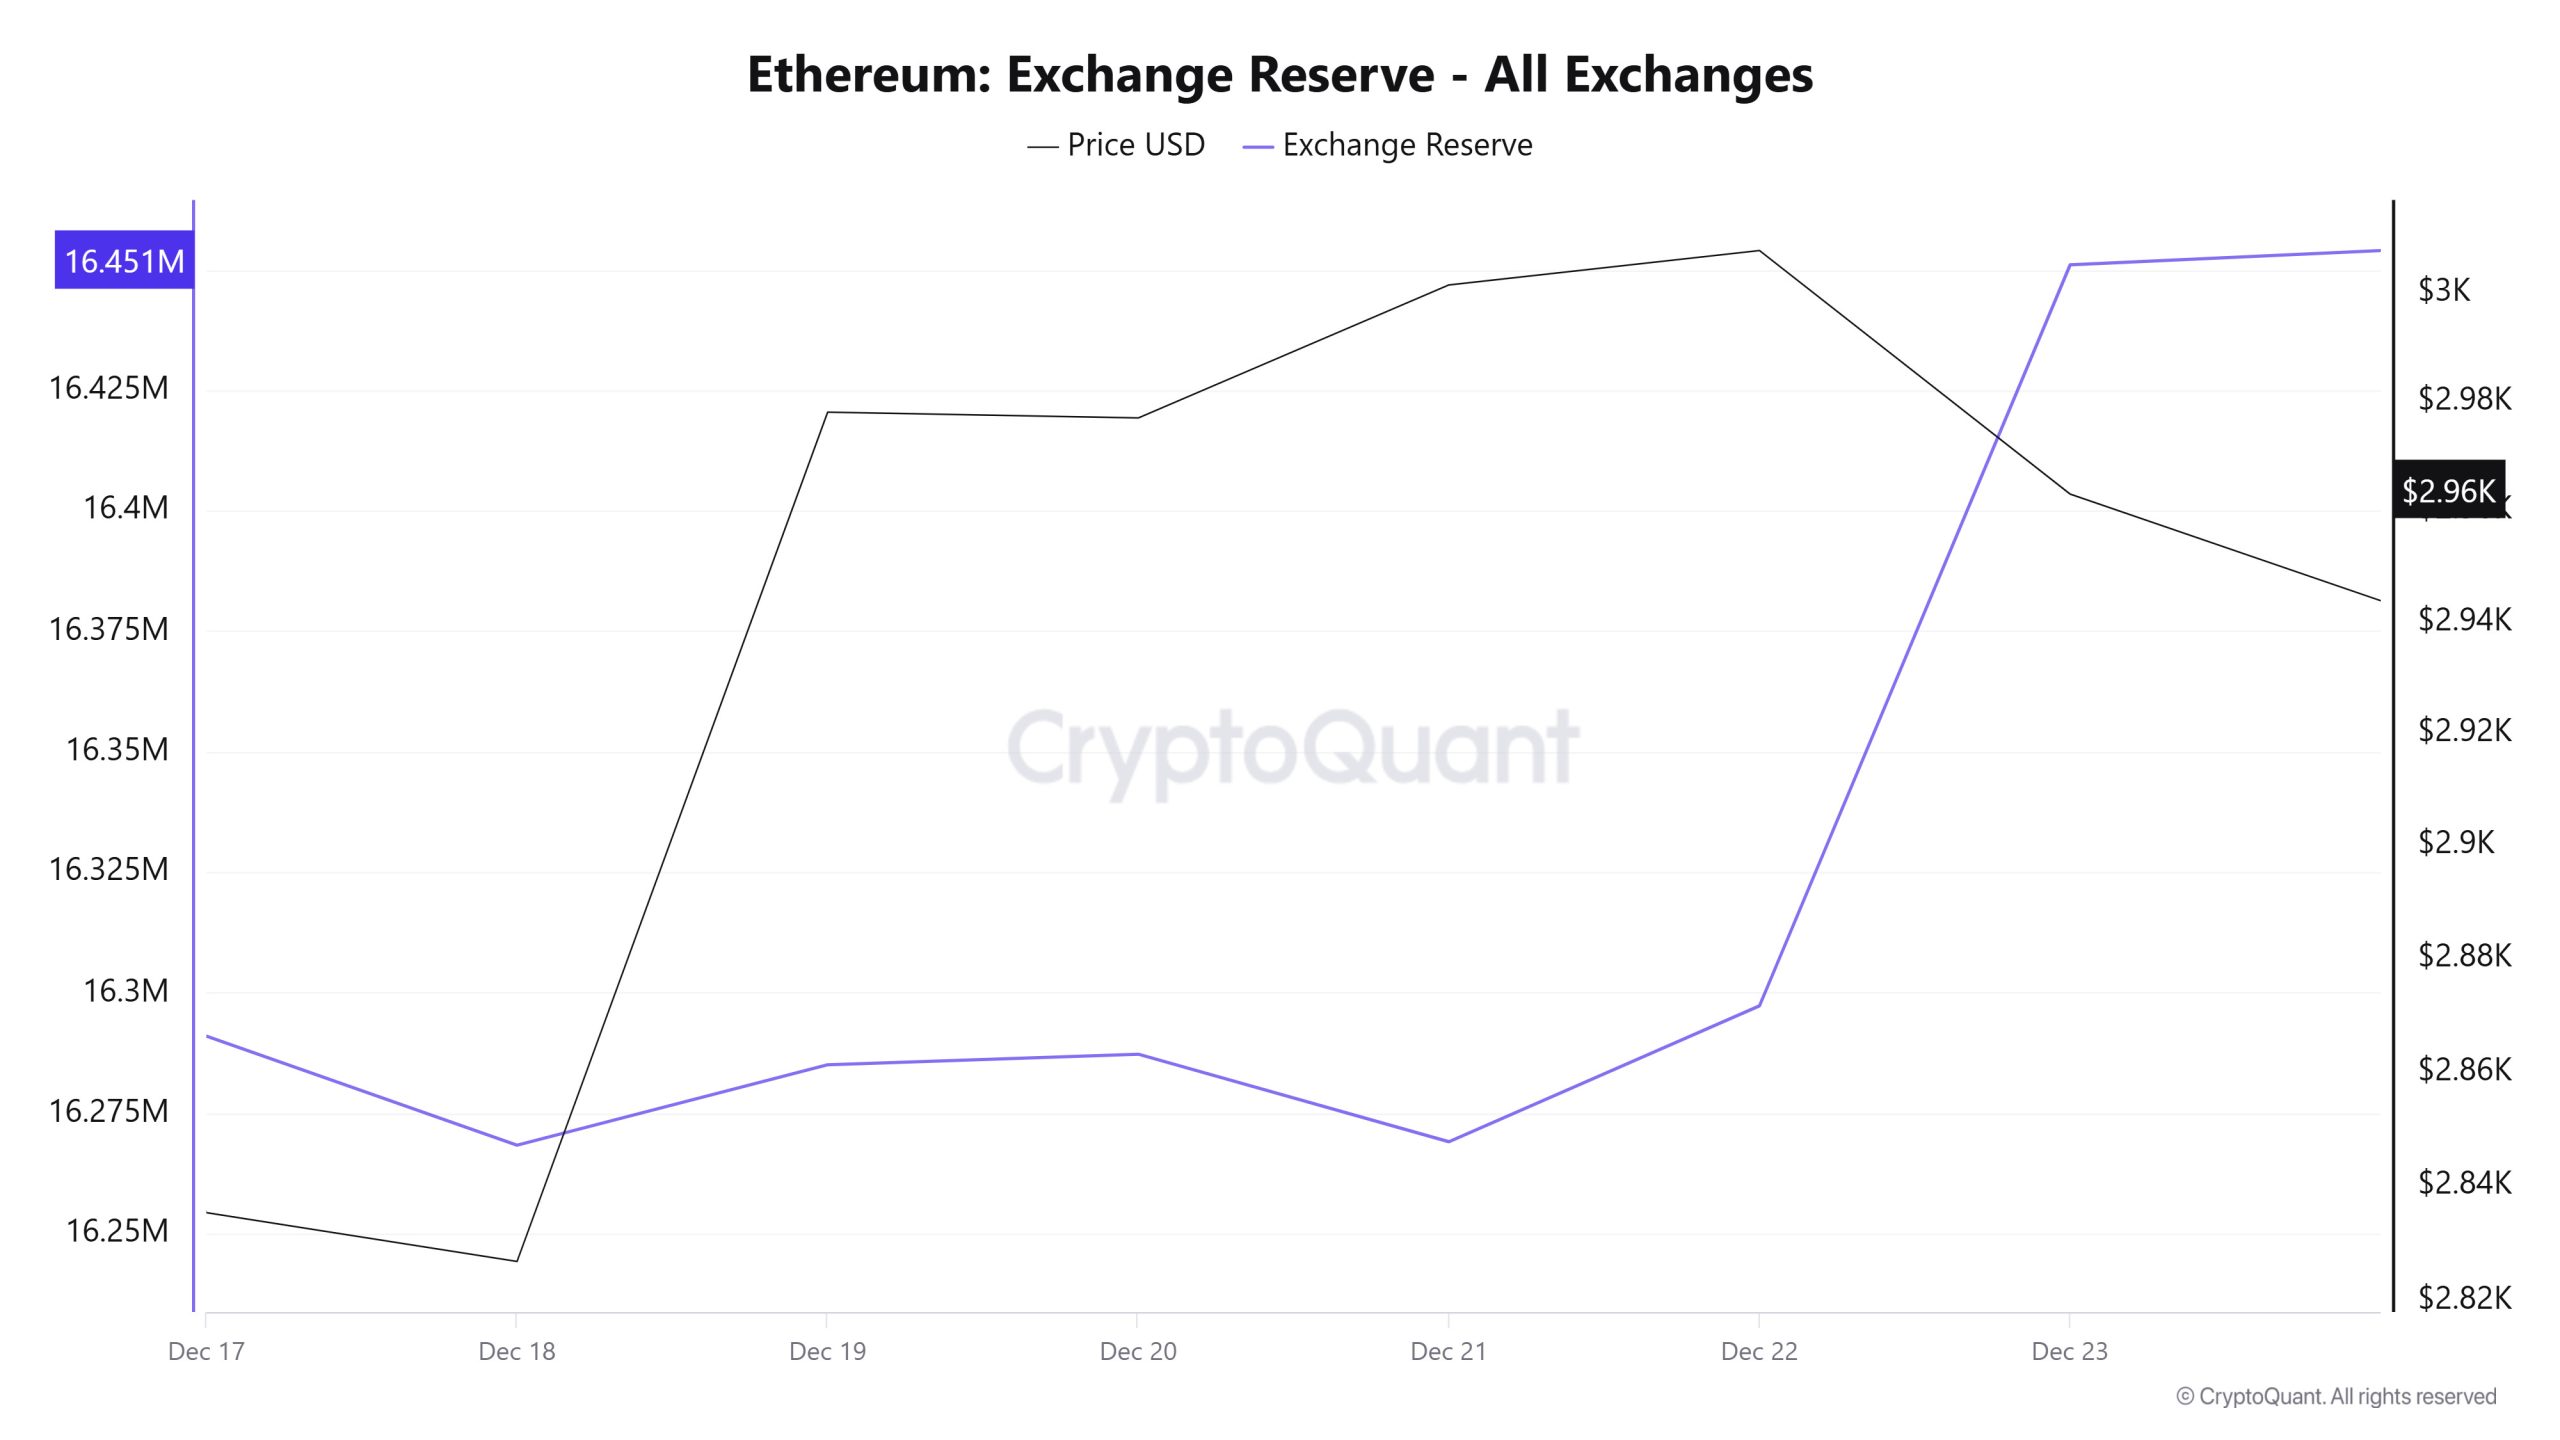
Between December 17-23, 2025, Ethereum reserves on exchanges rose from 16,244,176 ETH to 16,451,026 ETH. There was a net inflow of 206,849 ETH into exchange reserves, increasing exchange reserves by approximately 1.27%. While the ETH price remained flat during this period, ETH opened at $2,962 and closed at $2,963. Although the ETH price remained flat, the increase in the amount of ETH entering exchanges showed that investors were cautious at these levels. In particular, the strong net inflow seen on the last day of this period indicated a tendency toward short-term profit-taking. In the short term, the increase in exchange reserves may put pressure on the price.
| Date | 17-Dec | 18-Dec | 19-Dec | 20-Dec | December 21 | December 22 | 23-Dec |
|---|---|---|---|---|---|---|---|
| Exchange Inflow | 930,519 | 864,003 | 1,386,061 | 226,195 | 309,071 | 764,649 | 1,008,141 |
| Exchange Outflow | 883,750 | 886,652 | 1,369,353 | 224,011 | 327,244 | 736,442 | 854,337 |
| Exchange Netflow | 46,769 | -22,649 | 16,708 | 2,184 | -18,173 | 28,207 | 153,804 |
| Exchange Reserve | 16,290,945 | 16,268,296 | 16,285,004 | 16,287,188 | 16,269,015 | 16,297,222 | 16,451,026 |
| ETH Price | 2,962 | 2,827 | 2,978 | 2,977 | 3,001 | 3,008 | 2,963 |
Fees and Revenues
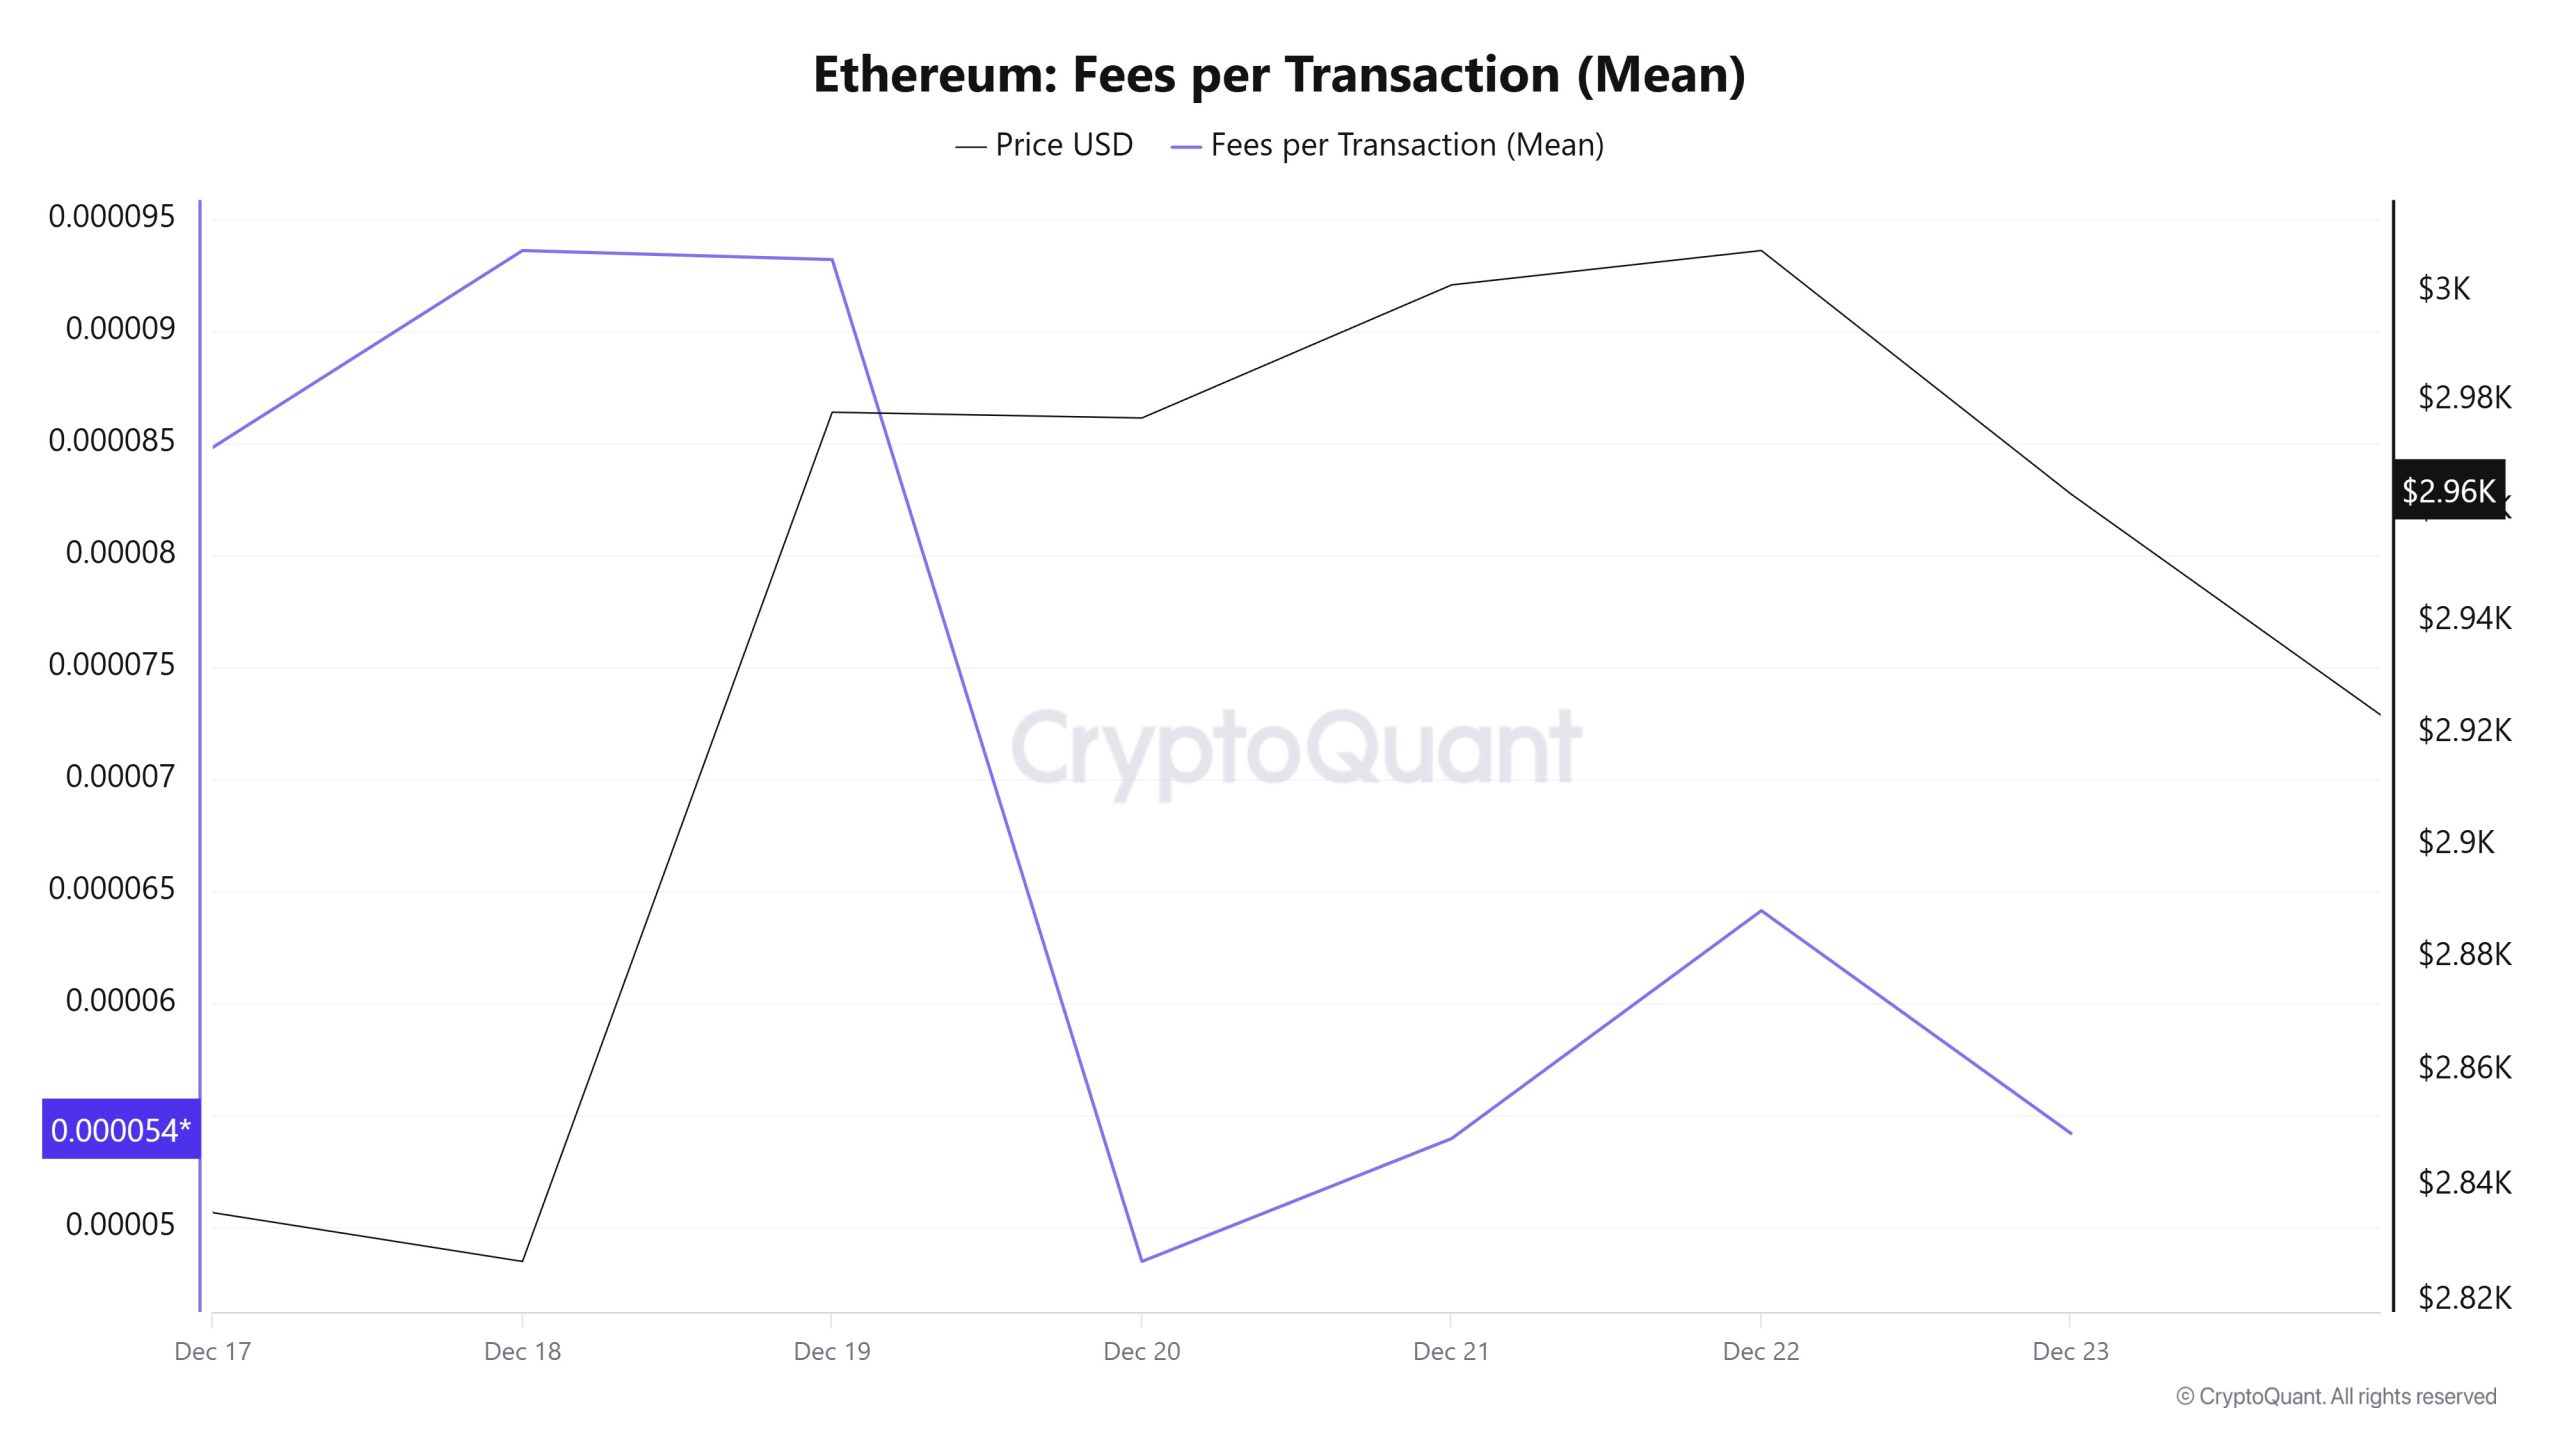
When examining the Ethereum Fees per Transaction (Mean) data for the period between December 17 and 23, it is observed that on December 17, the first day of the week, the indicator stood at 0.000084831496446419.
A fluctuating trend was observed until December 20, and on this date, the indicator recorded the week’s lowest value at 0.00004849728139366.
In this context, as of December 20, Ethereum the indicator regained momentum as a result of increased price volatility and followed a positive trend due to the impact of price volatility.
On December 23, the last day of the weekly period, the indicator closed the week at 0.000054208099390429.
Ethereum: Fees (Total)
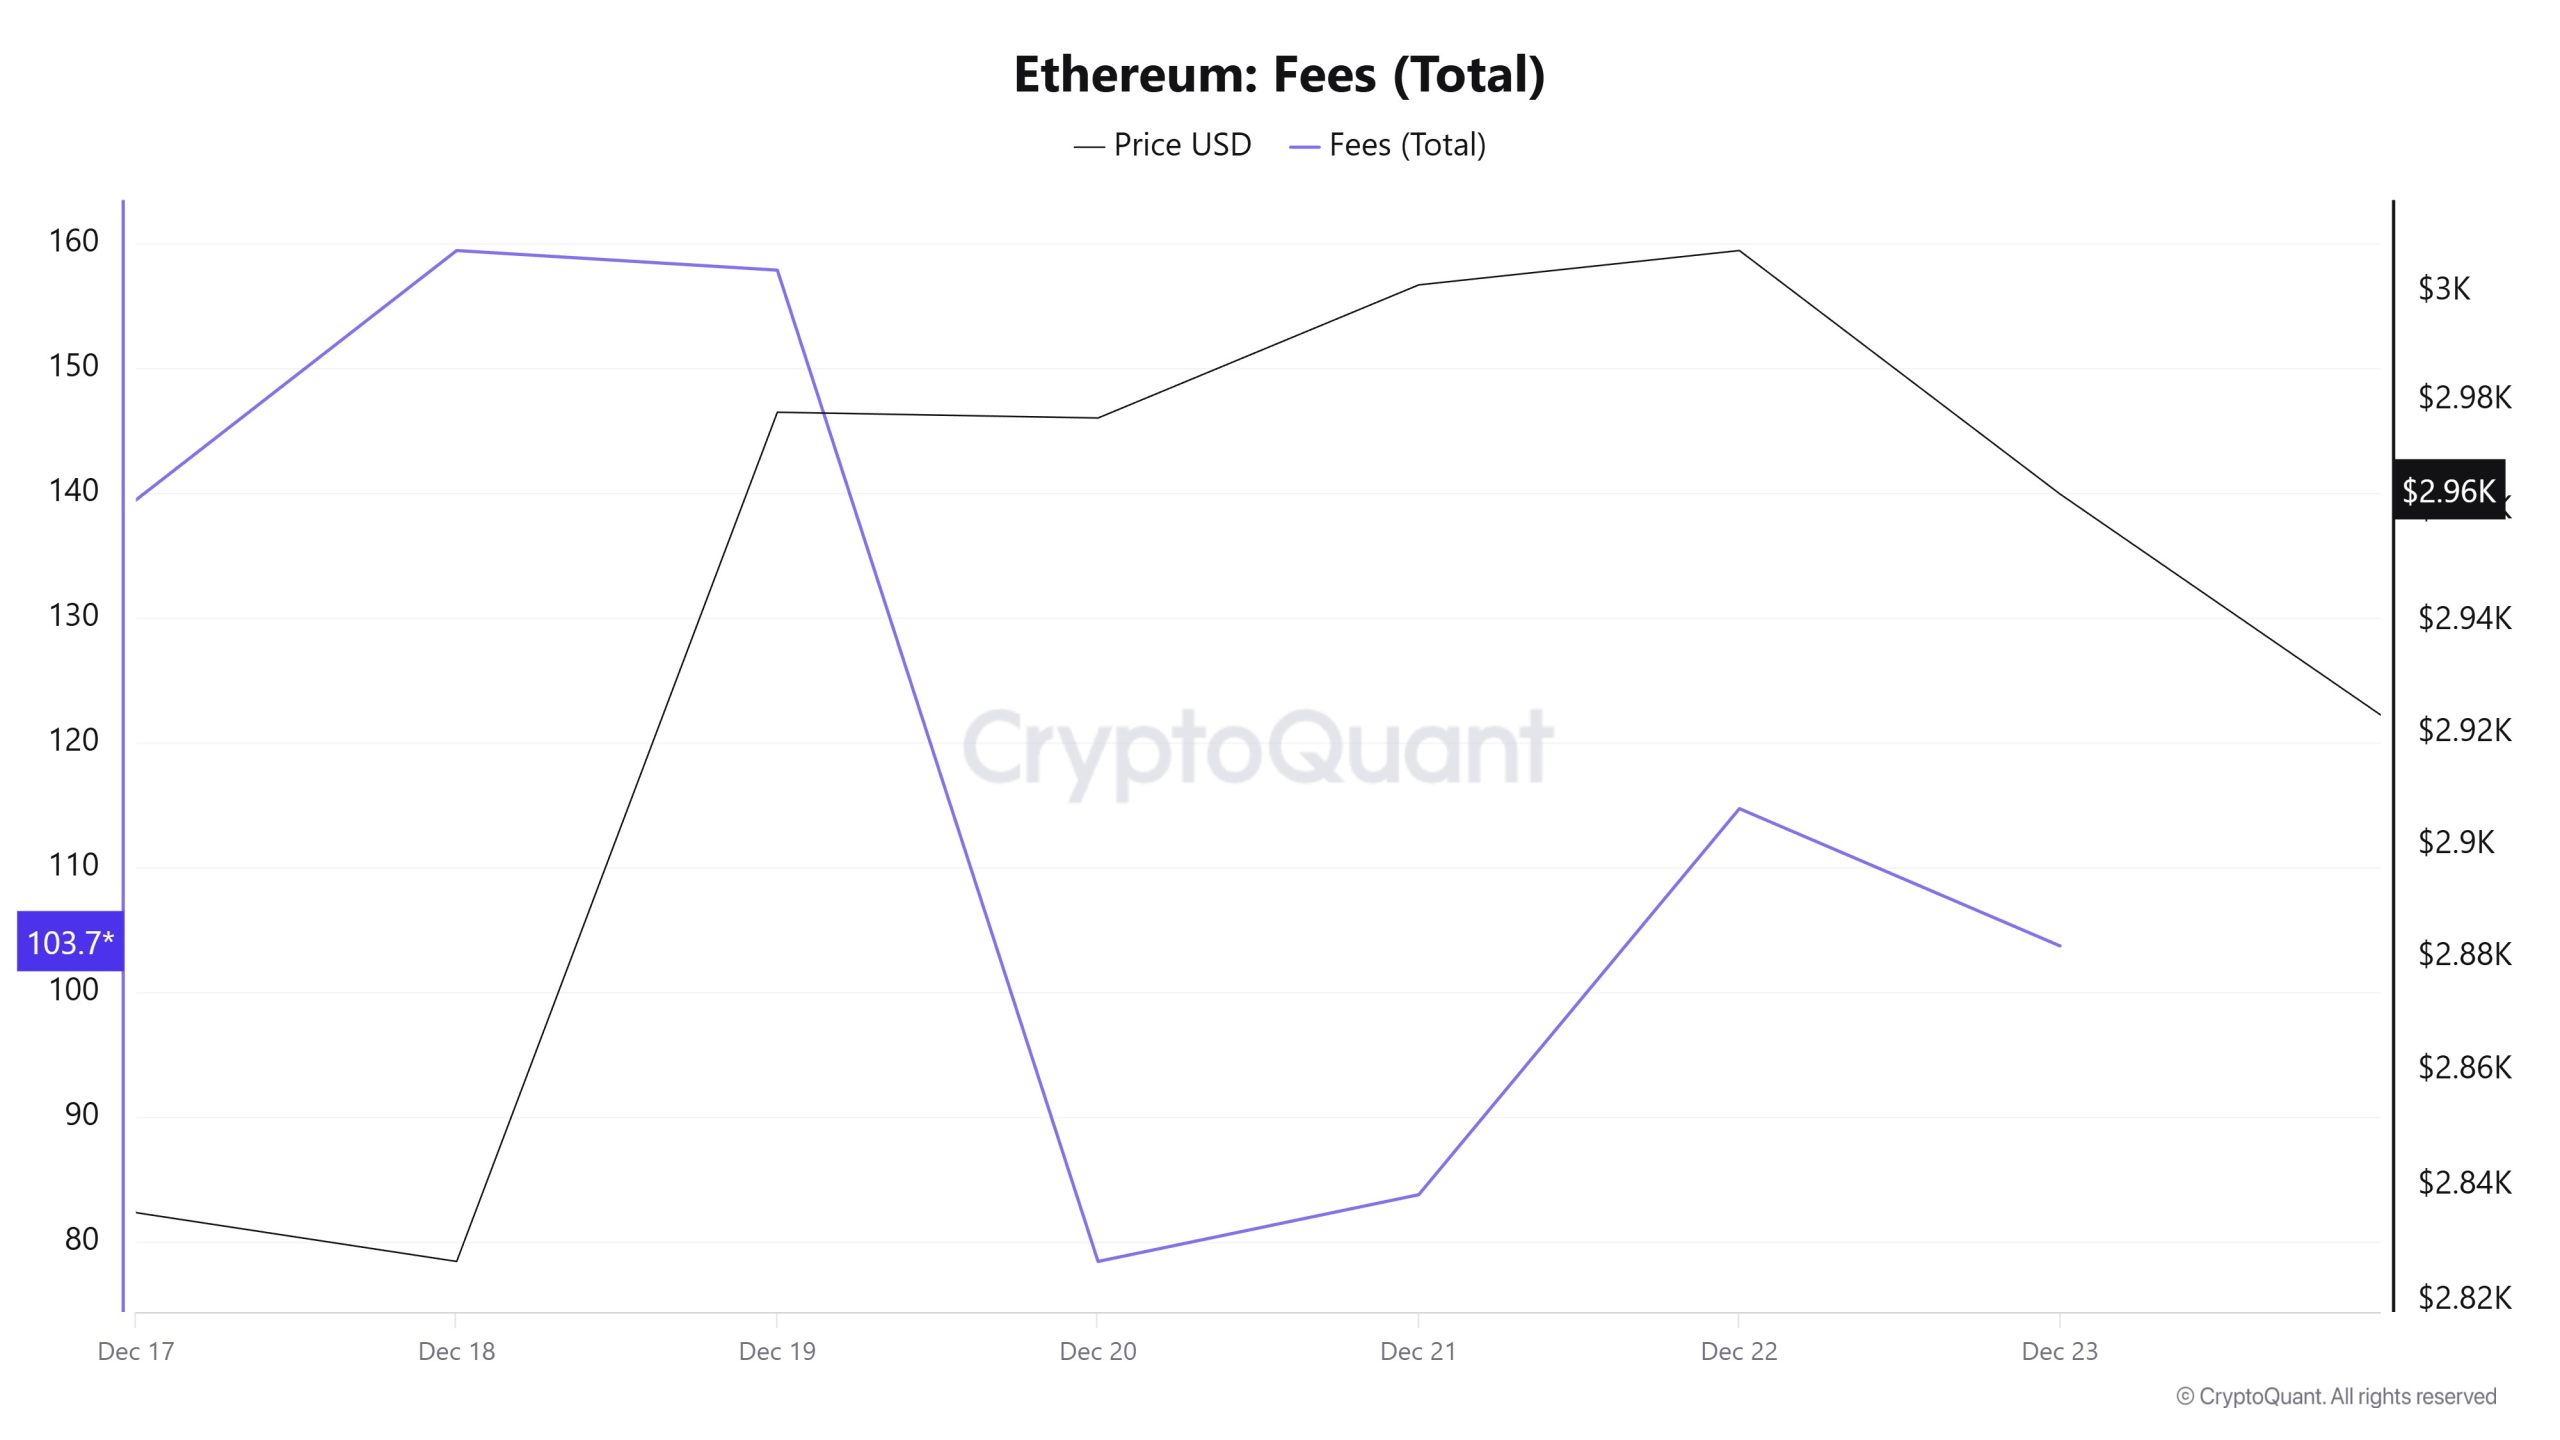
Similarly, when examining the Ethereum Fees (Total) data for December 17-23, it is seen that on December 17, the first day of the week, the indicator stood at 139.4657795972959.
A fluctuating trend was observed until December 20, and on this date, the indicator recorded the week’s lowest value at 78.44532259987359.
In this context, as a result of the increase in Ethereum price volatility as of December 20, the indicator regained momentum and followed a positive trend due to the impact of price volatility.
On December 23, the last day of the weekly period, the indicator closed the week at 103.72616822969697.
Blocks Mined
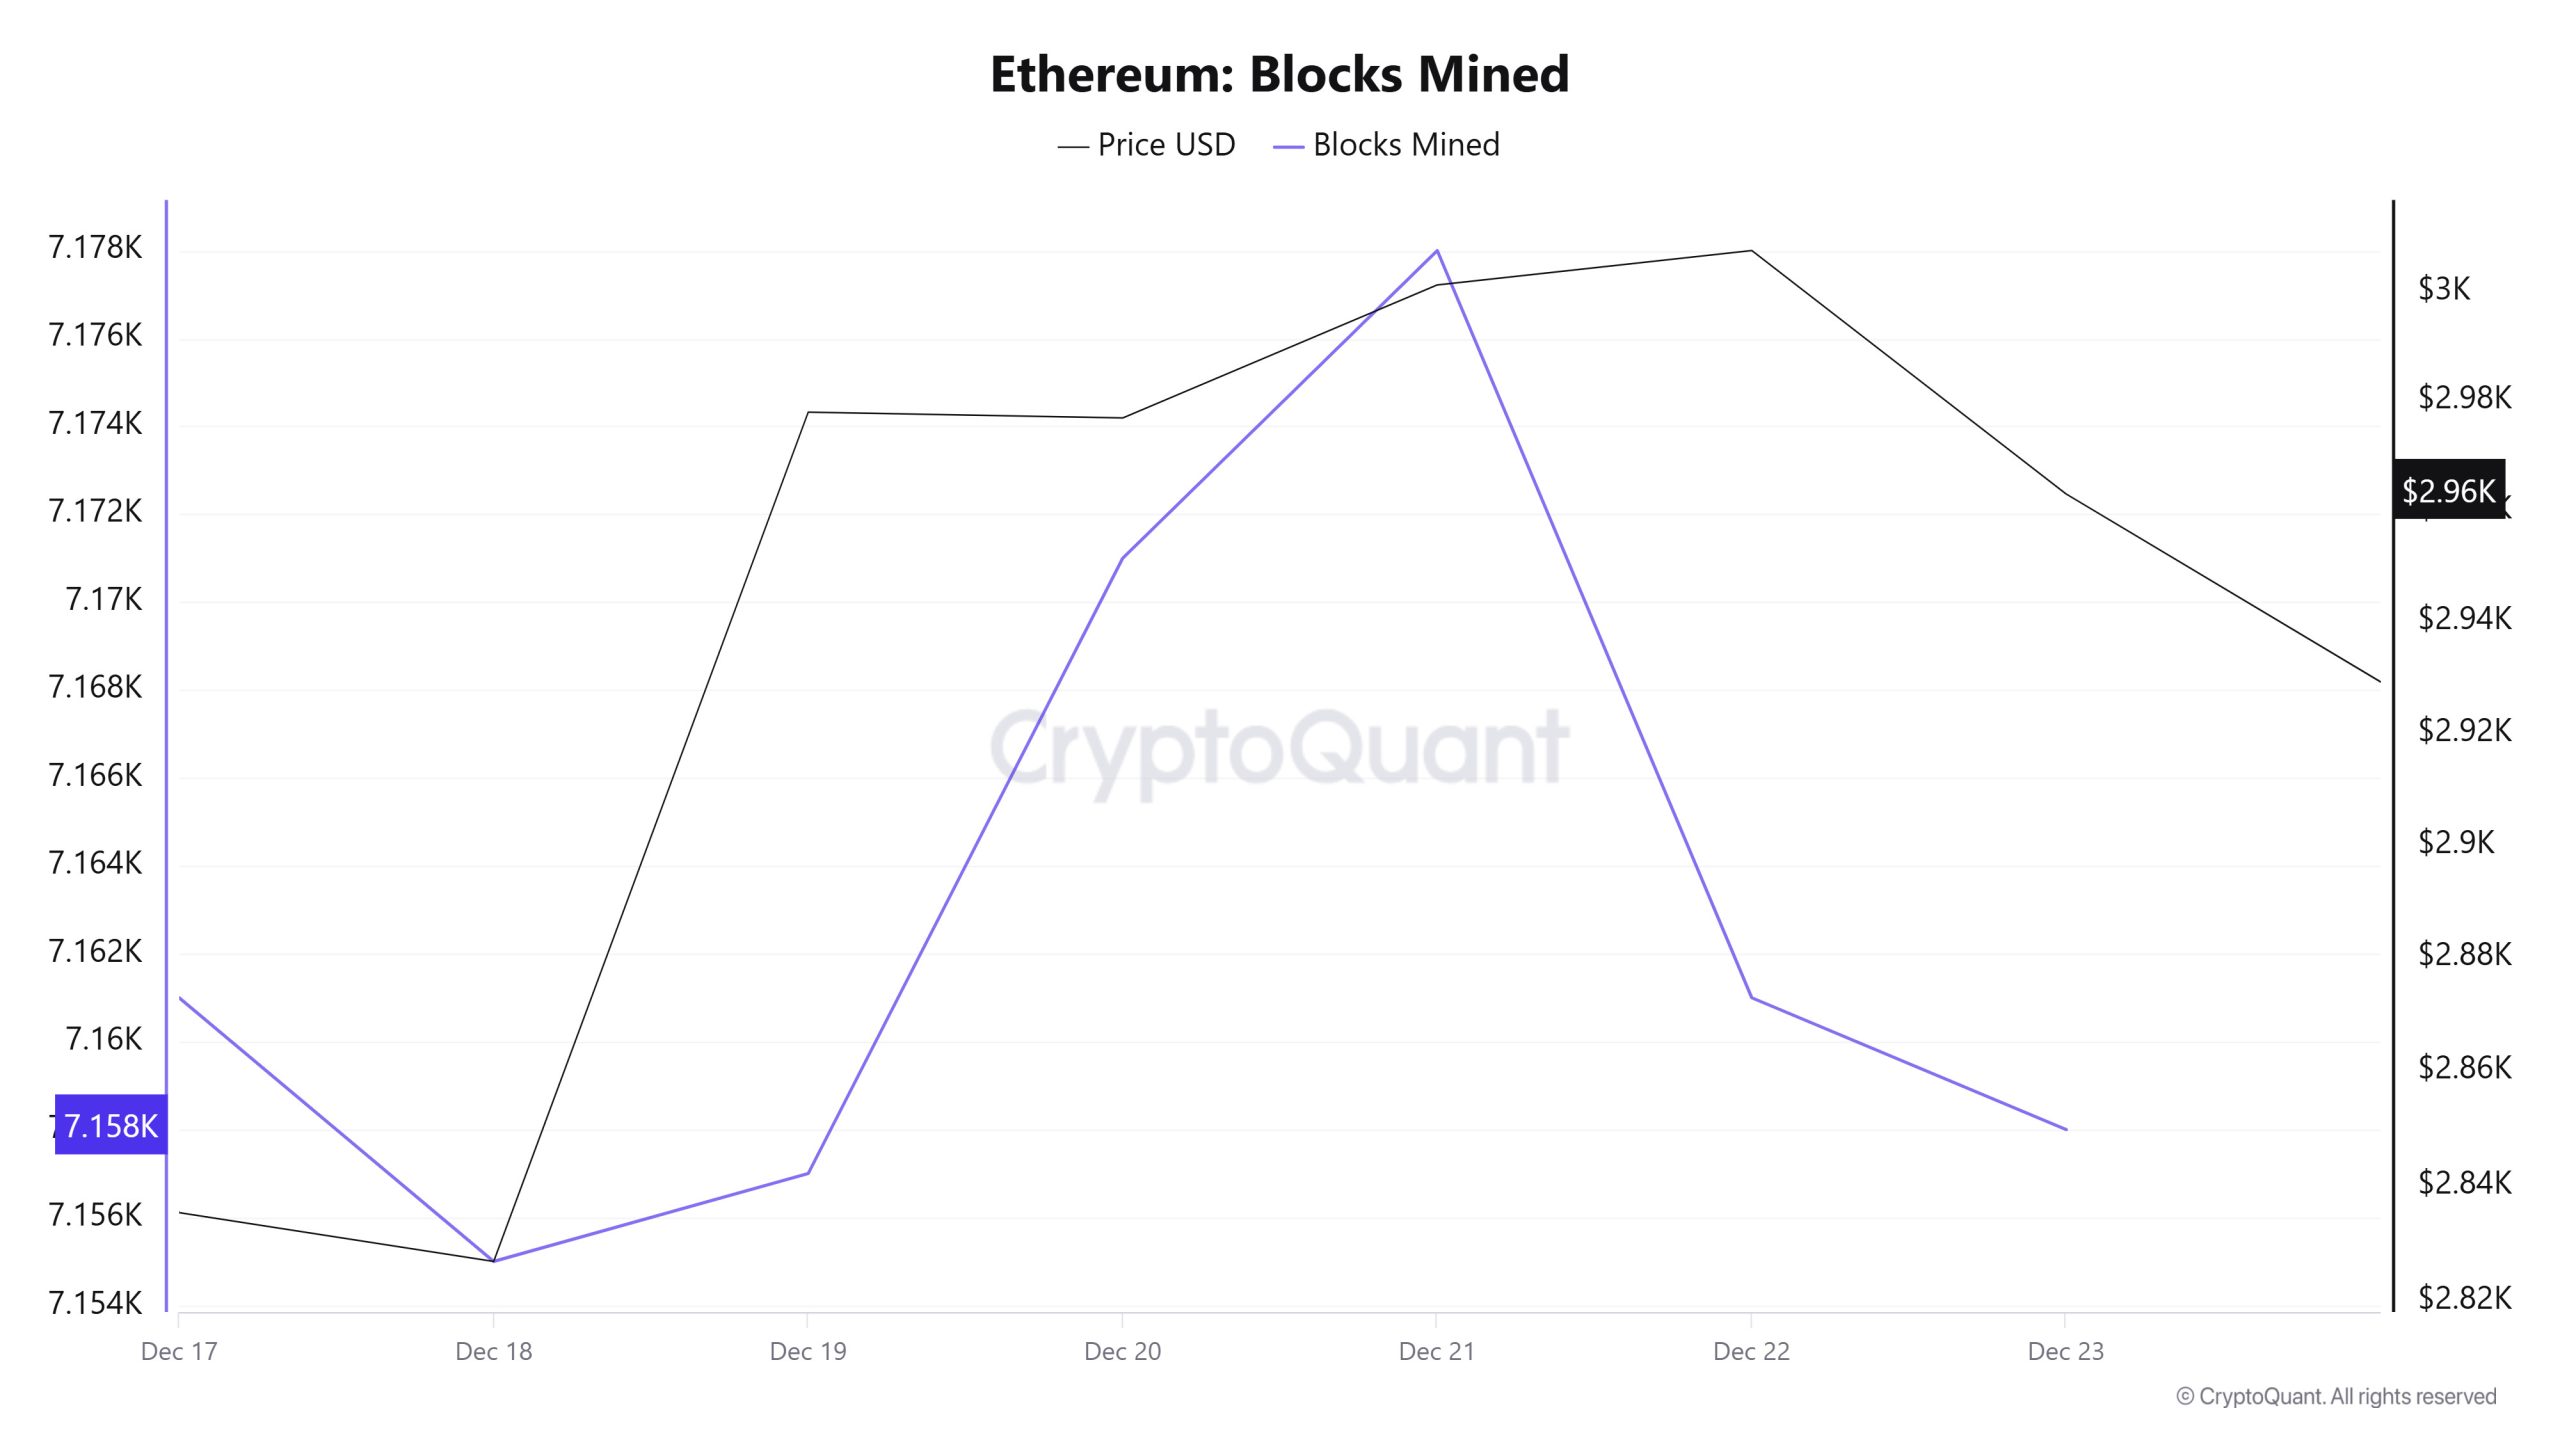
When examining Ethereum block production data between December 17 and 23, a decrease was observed throughout the week. While 7,161 blocks were produced on December 17, this number declined to 7,158 by December 23.
During the period in question, a time-dependent correlation structure was observed between the Ethereum price and the number of blocks produced. However, the general trend shows that a positive correlation between these two variables is dominant.
Block Size
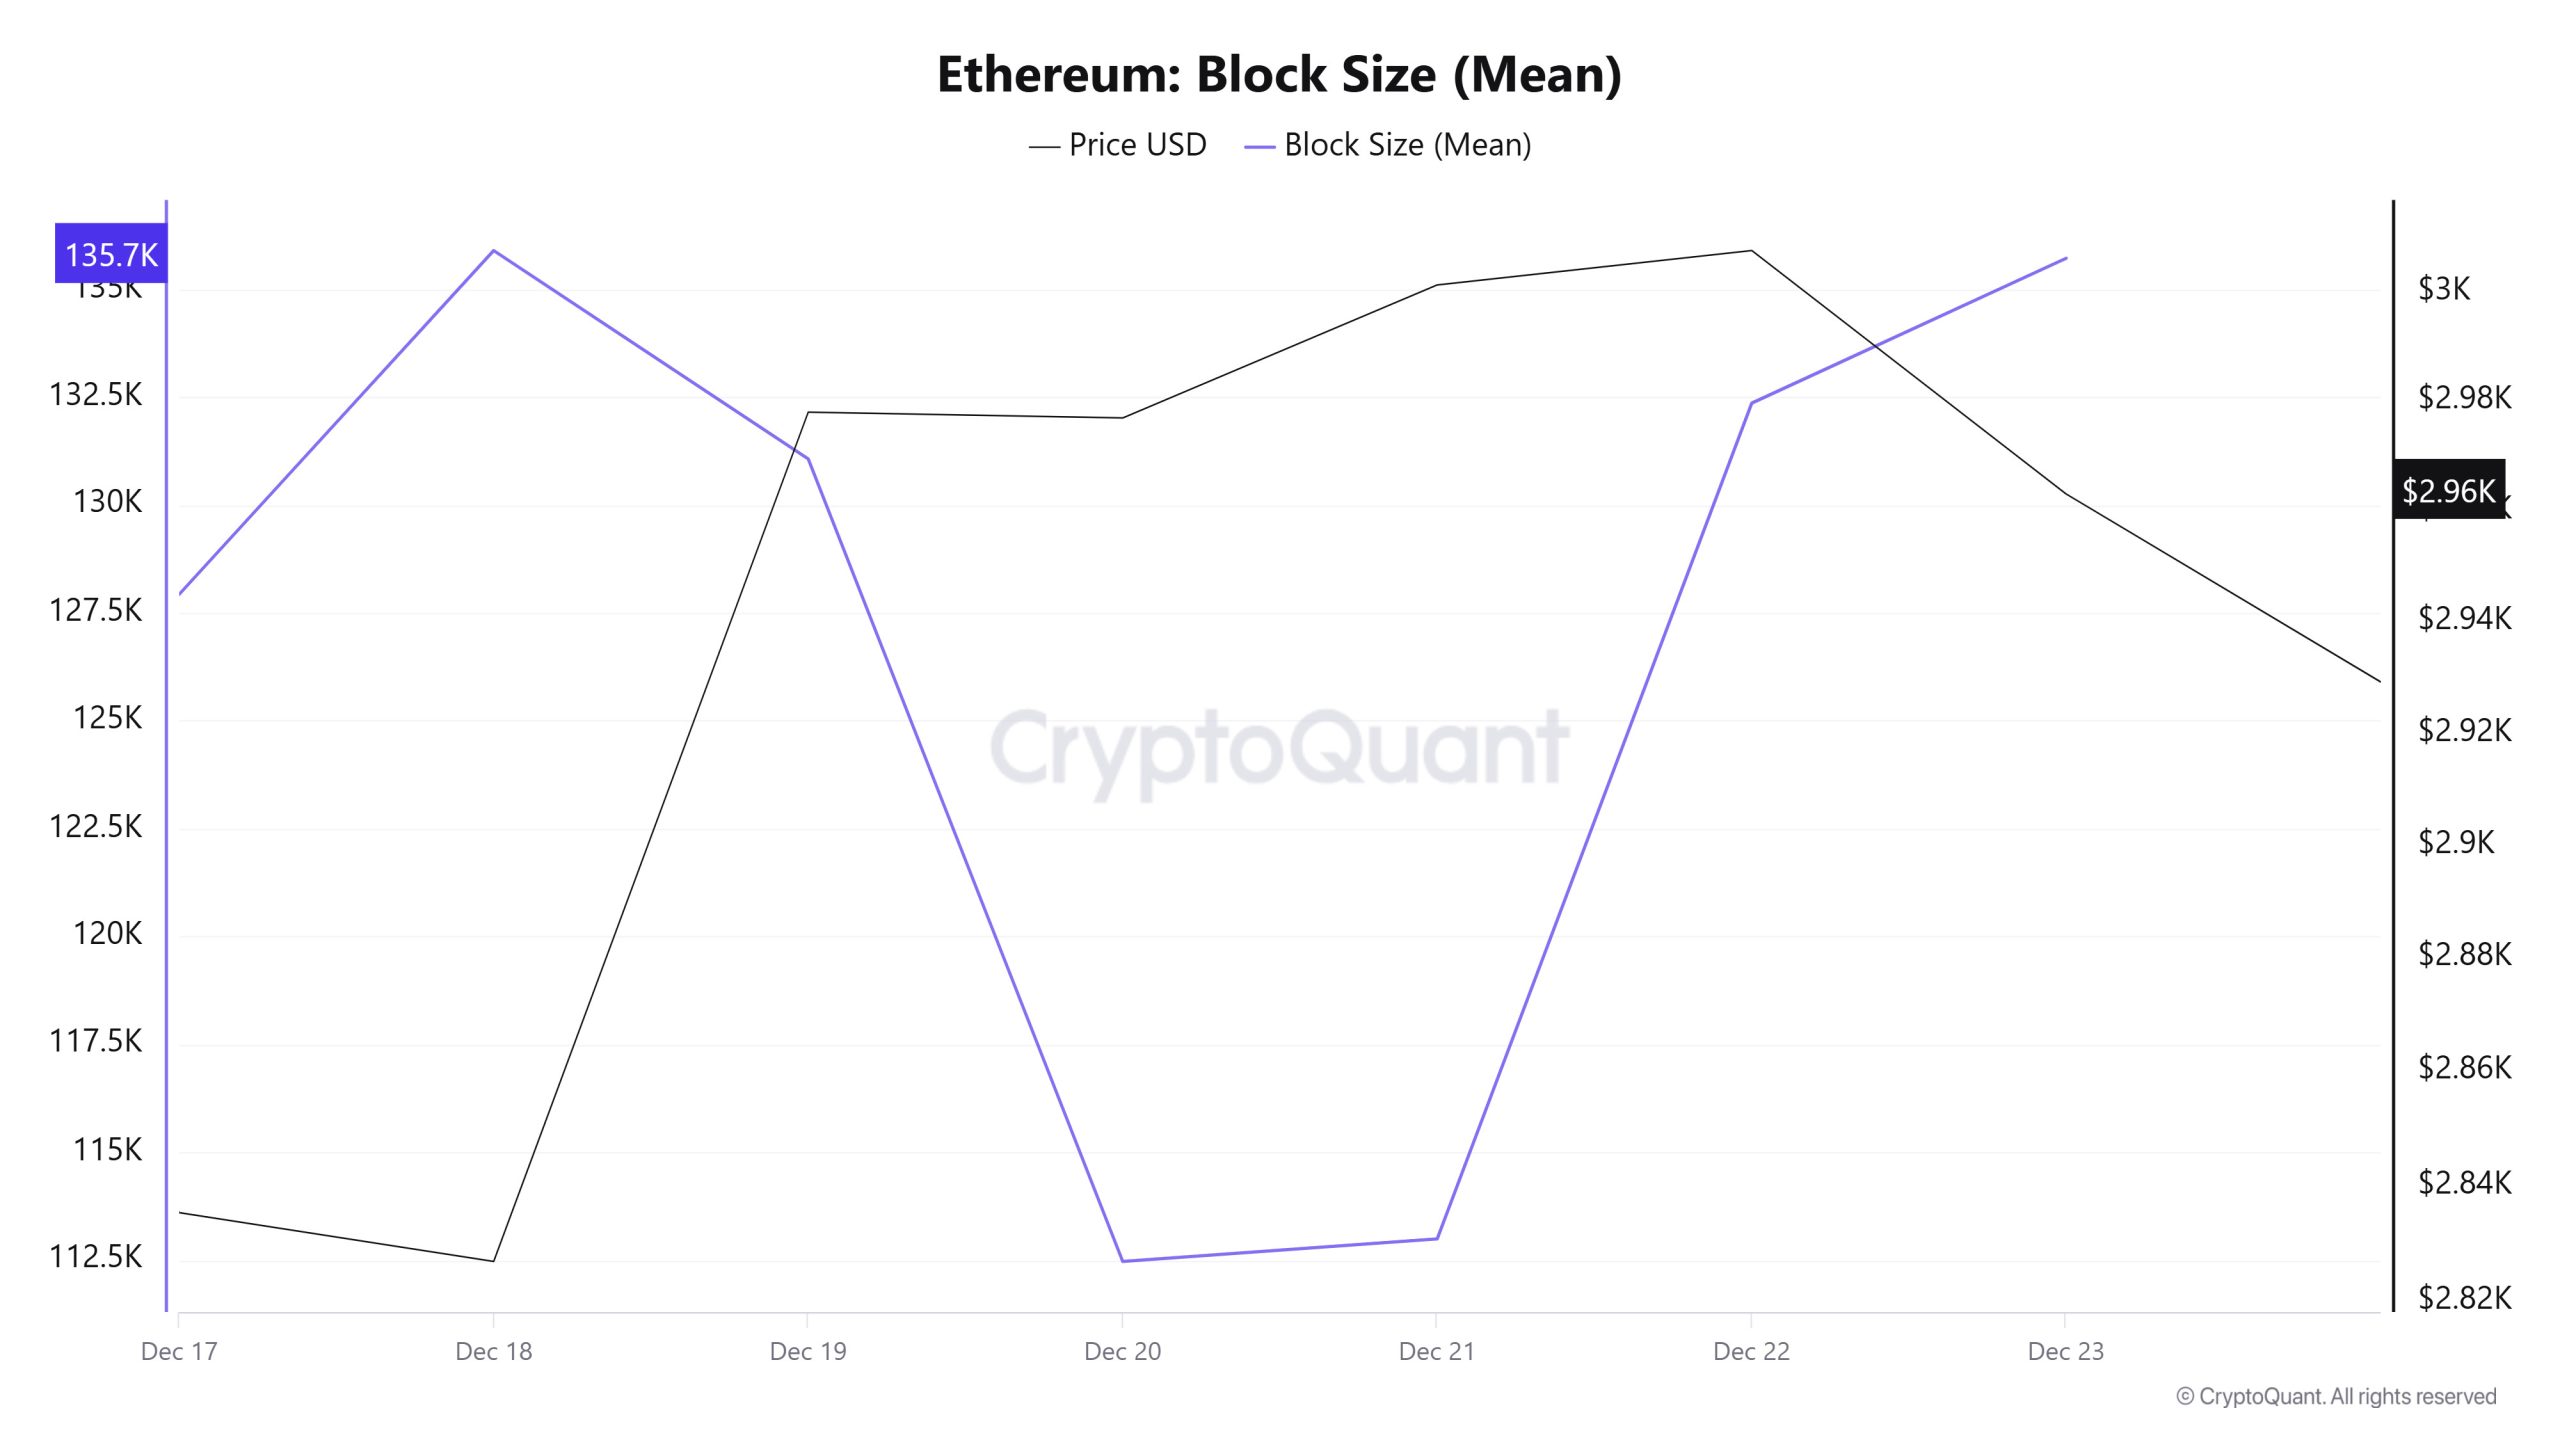
When examining Ethereum block size data between December 17 and 23, an increase was observed throughout the week. While the average block size was measured at 127,931 bytes on December 17, this value rose to 135,720 bytes as of December 23.
During the relevant period, a time-dependent correlation structure was observed between block size and Ethereum price. However, the general trend indicates that a negative correlation between these two variables is dominant.
Block Interval
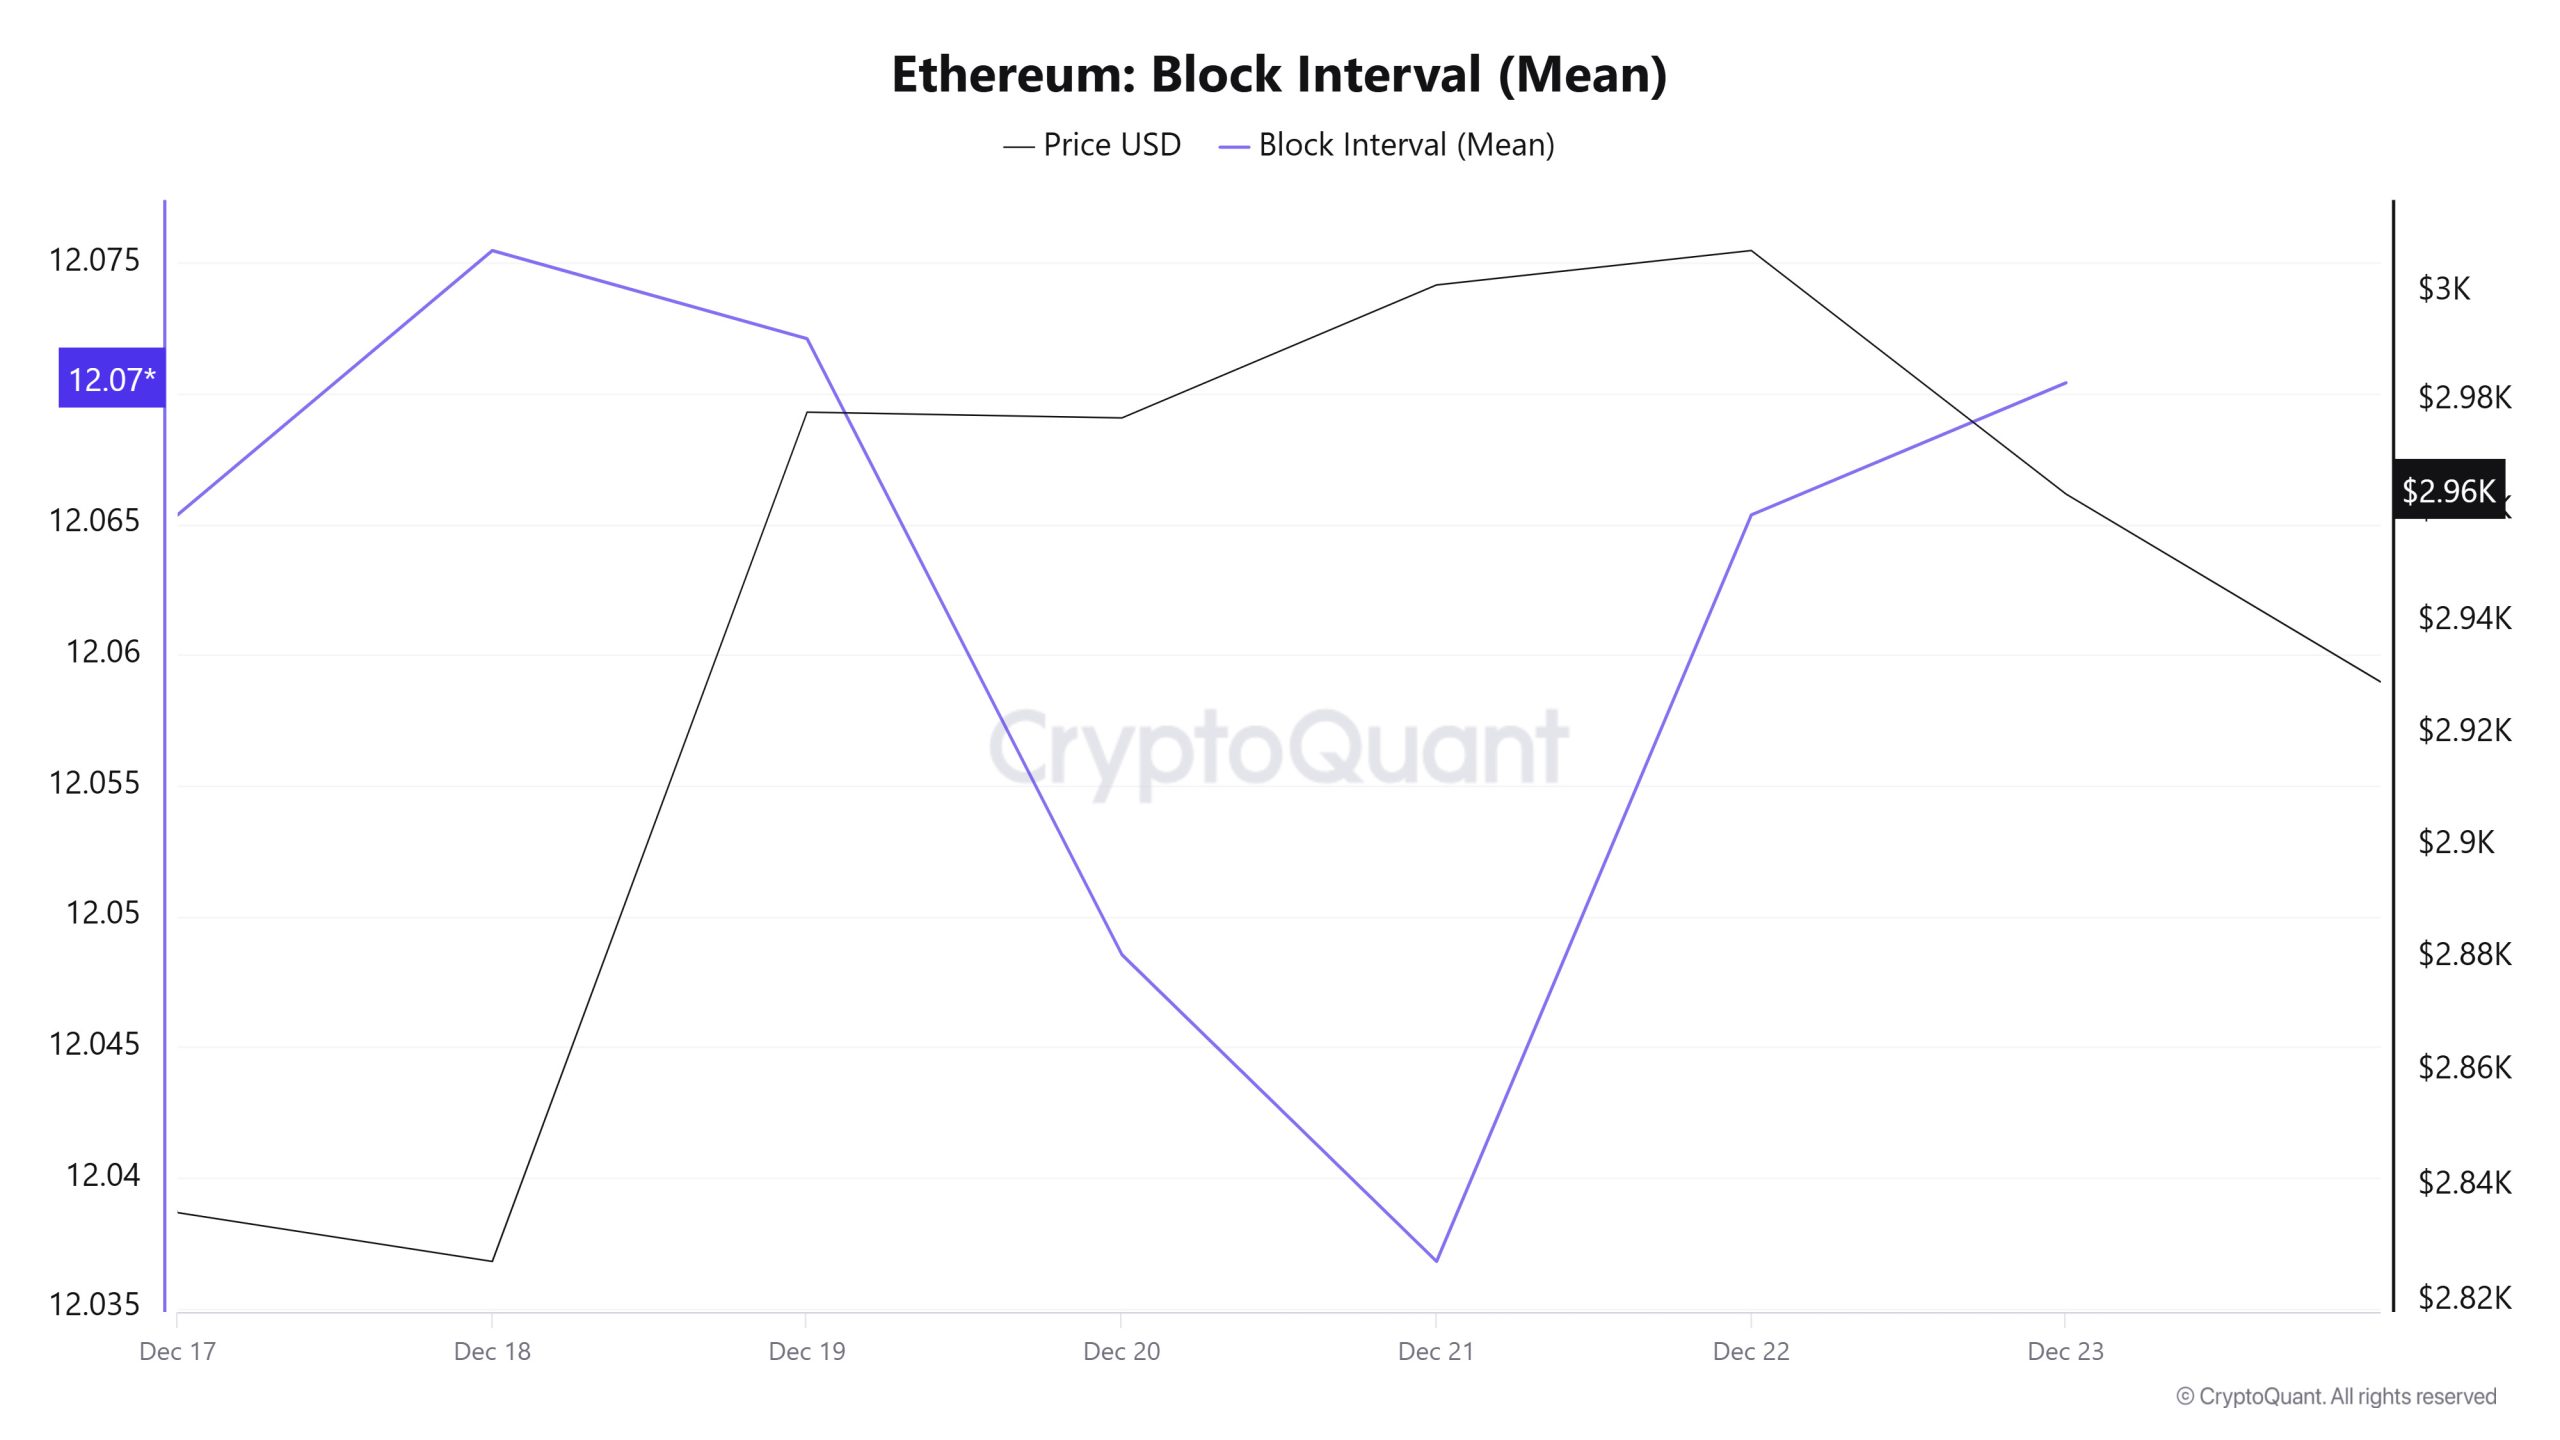
When examining the Ethereum block time between December 17 and 23, an increase was observed throughout the week. While the average block time was recorded as 12.06 seconds on December 17, this time increased to 12.07 seconds as of December 23.
During this period, a time-dependent correlation structure was observed between the Ethereum block time and price movement. However, the general trend indicates that a negative correlation between these two variables is dominant.
Transaction
![]()
Last week, 10,357,973 transactions were executed on the Ethereum network, while this week the number of transactions increased by approximately 15% to 11,912,532. The highest transaction volume of the week was recorded on December 23 at 1,931,481, while the lowest transaction volume was recorded on December 21 at 1,552,206. Although the correlation between transaction volume and price showed mixed results throughout the week, a negative trend appears to be dominant overall. However, the acceleration in network activity compared to the previous period indicates a clear recovery in transaction momentum on the Ethereum side.
Tokens Transferred
The total amount of ETH transferred last week was 12,093,526 ETH, while this week the value fell to 11,673,064 ETH, recording a decline of approximately 3.48%. The highest transfer volume during the period was 2,681,378 ETH on December 17, while the lowest value was 473,863 ETH on December 20.
When considering the fluctuations of up to 500% in daily transfers, the increase in the number of transactions, and the decline in the average amount of Ethereum per transaction, it appears that a structure has been formed that could increase volatility on the network. This outlook indicates that more small-scale investors have become active compared to the previous period, creating a positive environment for network health but one that carries short-term risks in terms of pricing. At this stage, the revival in network activity alone does not produce a sufficient positive signal. Unless large-volume transfers regain strength, the price may remain volatile. In the short term, the chain is active, but the market remains cautious.
Estimated Leverage Ratio

The metric rose until the middle of the 7-day period. On December 17, the first day of the period, the metric was 0.743, but it fell the next day, reaching the lowest point of the period at 0.722. It then rose until December 19, reaching its peak at 0.761. At the time of writing, the metric is declining, standing at 0.737, indicating a steady decline in investor appetite compared to the rest of the period. A higher ELR means participants are more willing to take on risk and generally indicates bullish conditions or expectations. Uptrends can also stem from a decrease in reserves. Looking at Ethereum reserves, there were 16.29 million reserves at the beginning of the process, and this figure rose during the rest of the process and currently stands at 16.48 million. At the same time, Ethereum’s Open Interest was $37.19 billion at the beginning of the process. As of now, the volume has remained flat during the process, and the open interest value has stayed at $37.72 billion. With all this data, the ELR metric fluctuated throughout most of the process. The asset’s price fluctuated between $3,071 and $2,771 alongside all this data. Consequently, the flat movement of the open interest data seen throughout the process, coupled with the steady rise in reserves, indicated that the ELR metric showed an artificial decline, signaling an increase rather than a decrease in risk appetite.
ETH Onchain Overall
| Metric | Positive 📈 | Negative 📉 | Neutral ➖ |
|---|---|---|---|
| Active Addresses | ✓ | ||
| Total Value Staked | ✓ | ||
| Derivatives | ✓ | ||
| Supply Distribution | ✓ | ||
| Exchange Supply Ratio | ✓ | ||
| Exchange Reserve | ✓ | ||
| Fees and Revenues | ✓ | ||
| Blocks Mined | ✓ | ||
| Transaction | ✓ | ||
| Estimated Leverage Ratio | ✓ |
- The metrics and guidance provided in the table do not alone explain or imply any expectation regarding future price changes in any asset. The prices of digital assets can fluctuate based on numerous different variables. The on-chain analysis and related guidance are intended to assist investors in their decision-making process, and basing financial investments solely on the results of this analysis may lead to unfavourable outcomes. Even if all metrics simultaneously produce positive, negative, or neutral results, the expected outcomes may not materialize depending on market conditions. It would be beneficial for investors reviewing the report to take these warnings into consideration.
Legal Notice
The investment information, comments, and recommendations contained in this document do not constitute investment advisory services. Investment advisory services are provided by authorized institutions on a personal basis, taking into account the risk and return preferences of individuals. The comments and recommendations contained in this document are of a general nature. These recommendations may not be suitable for your financial situation and risk and return preferences. Therefore, making an investment decision based solely on the information contained in this document may not result in outcomes that align with your expectations.
NOTE: All data used in Ethereum on-chain analysis is based on CryptoQuant.
