BTC/USDT
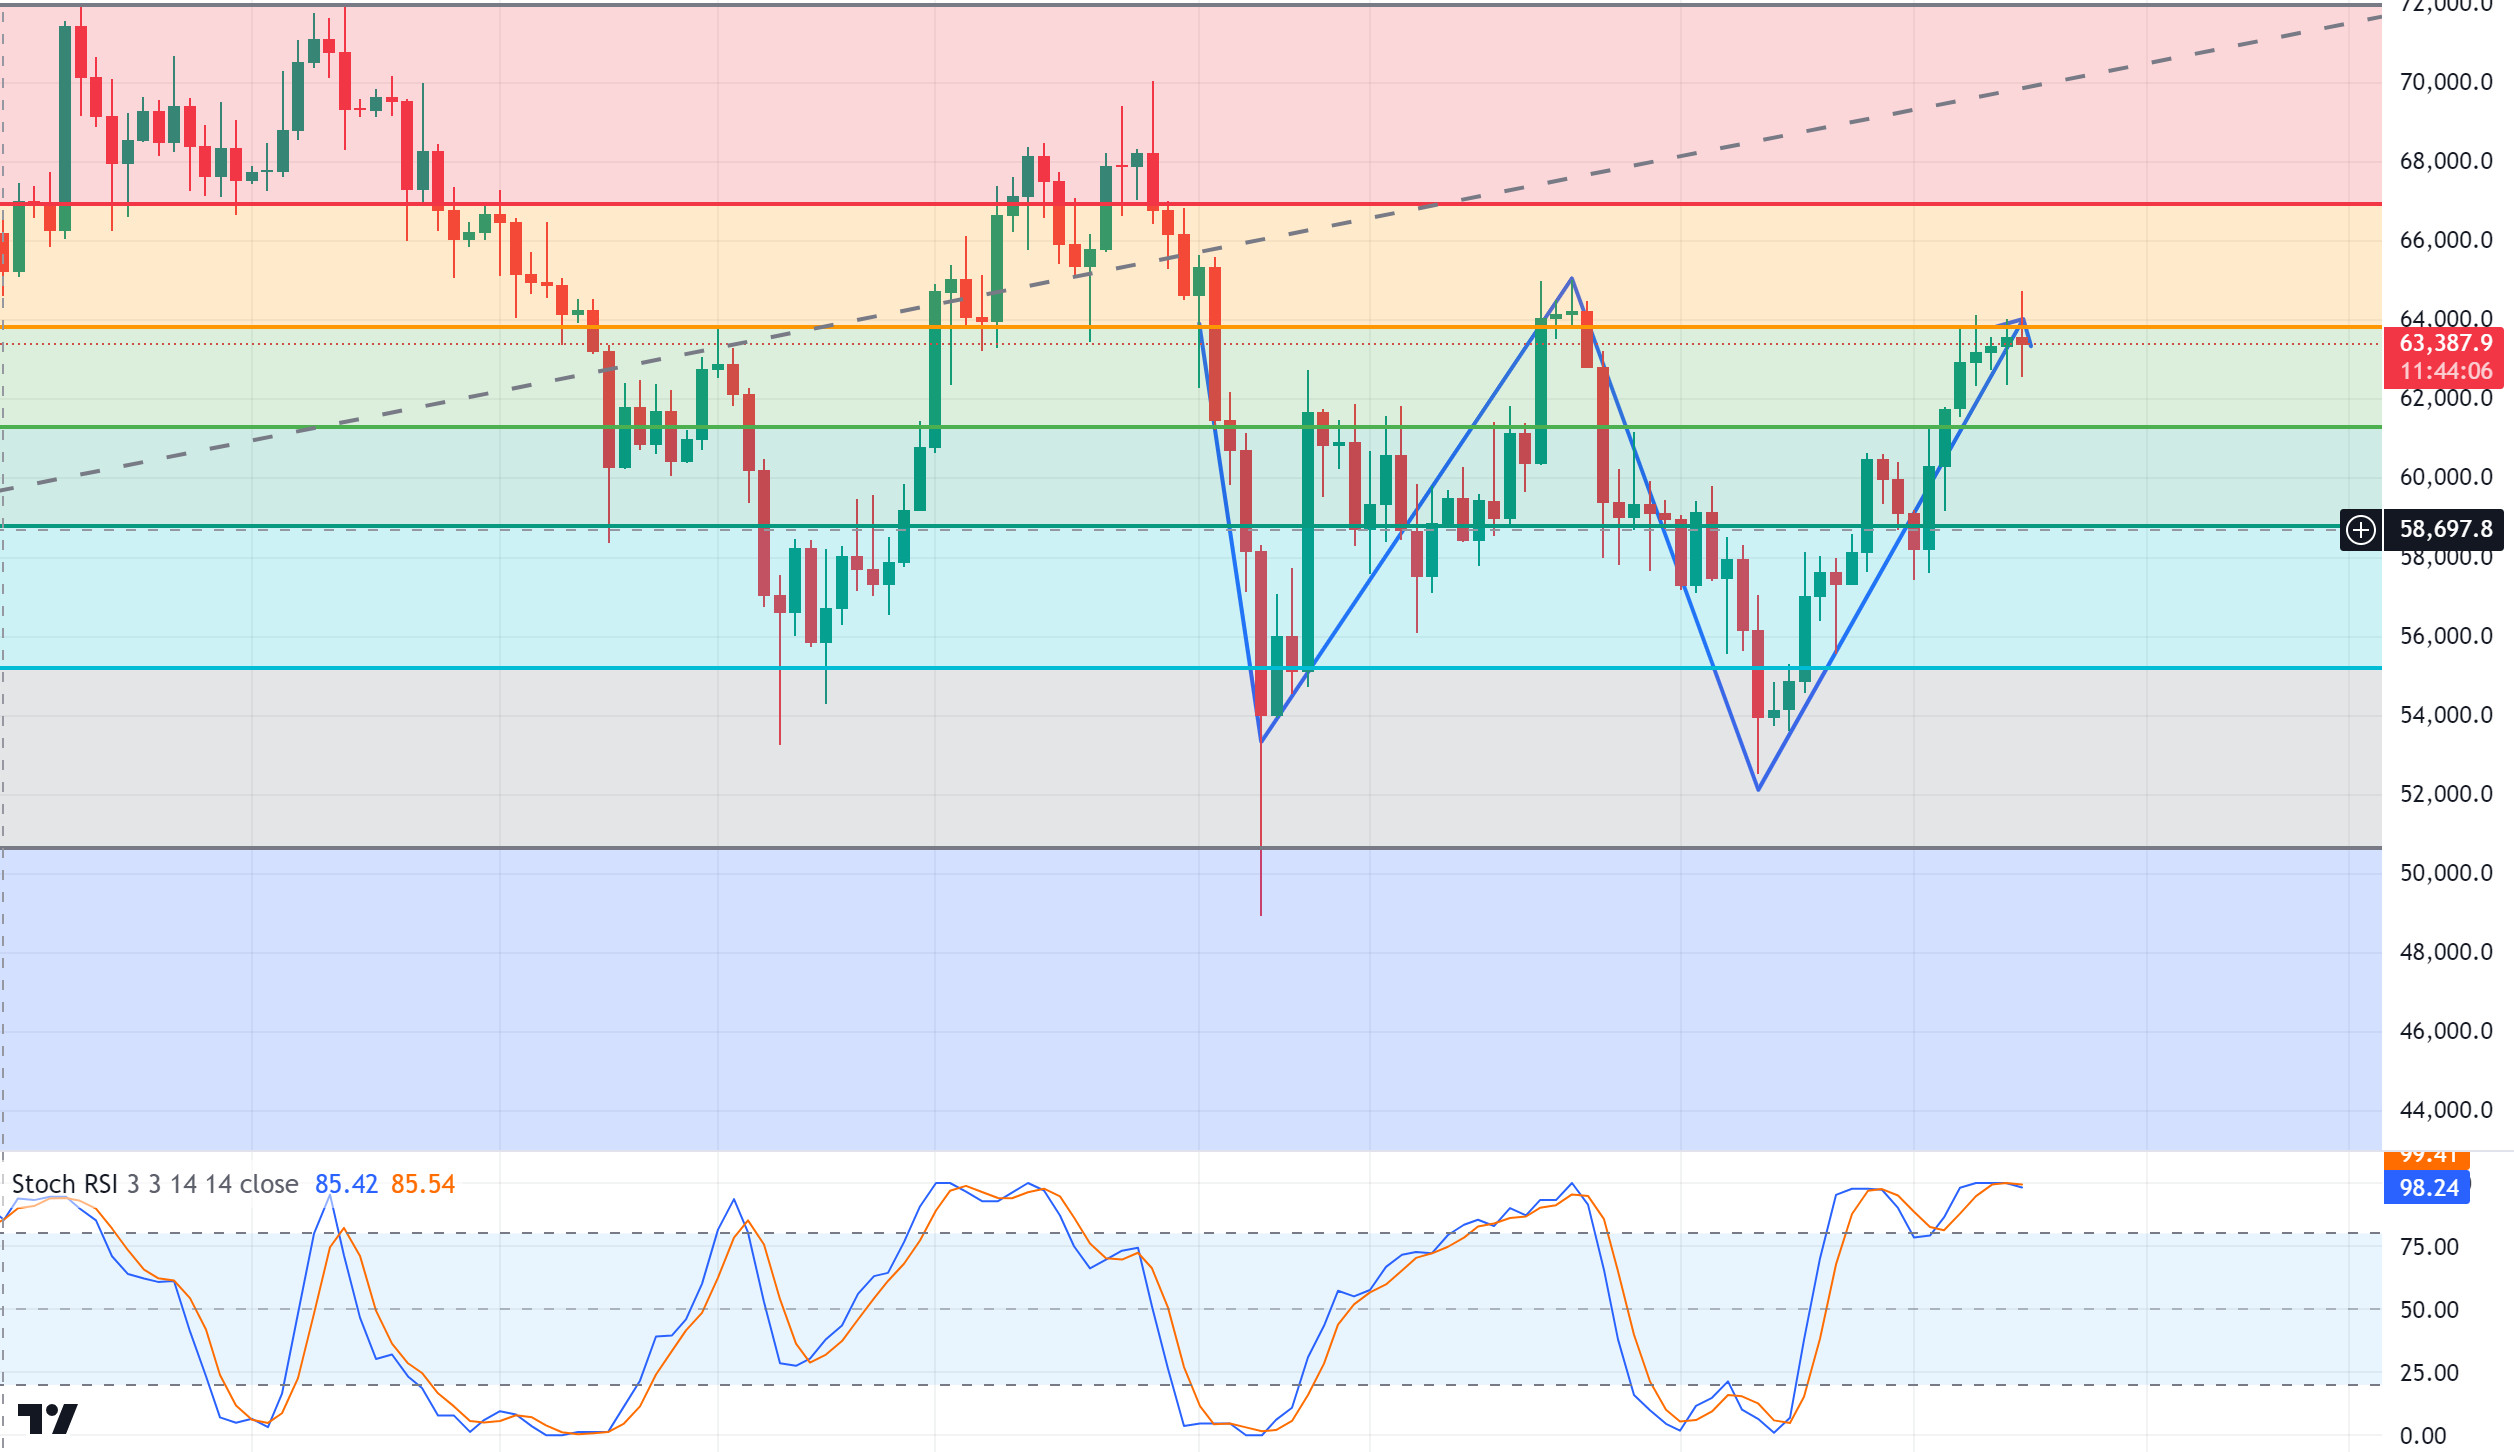
After the FED interest rate decision! If we look at Bitcoin’s weekly performance after the critical FED interest rate cut meeting, we see that the decision had a significant impact on the Bitcoin price, with a rise of about 8%. The FED’s rate cut led to an inflow of 321 million dollars into Bitcoin and cryptocurrency-focused investment products. With these inflows, Bitcoin investments stood out with an increase of $284 million. Other important developments of the week, MicroStrategy, known for its crypto investments, announced that it purchased 7420 Bitcoin after announcing the sale of $ 1 billion in bonds. On the other hand, the crypto market, which has become the focal point of political developments, is experiencing a historical turning point as it turns into an election campaign that directly affects the US elections while going through a hot agenda. The expected response to D. Trump, who reiterated his support for Bitcoin and cryptocurrencies in every meeting he appeared in, was that Kamala Harris, another candidate who had not previously favored the crypto market, said that she would encourage the growth of digital assets by including crypto in her election strategies. If we look at the BTC 1-day technical analysis, we see that the price continues to push the Fibonacci resistance level of 63,850. On our daily chart, the formation of the ‘W’ pattern in BTC price is noteworthy. A chart pattern that resembles the letter “W” with two bottoms and a peak in the middle signals the price’s transition from a downtrend to an uptrend. BTC is on the verge of a breakout and a breakout to the upside could lead to a continuation of the uptrend and target the 67,000 band. The 61,400 level is our support level in case of a pullback as the RSI moves into overbought territory.
Supports 61,400 – 58,850 – 55,300
Resistances 63,850 – 67,000 – 72,000
ETH/USDT
Ethereum, which started to rise after the Fed interest rate decision, continues to increase its momentum with the interest rate decision of the Bank of Japan. After EigenLayer announced and distributed the Season 2 airdrop, it seems that the outflows and selling pressure have decreased. In addition, after the airdrop updates of the Lrt protocols Swell, Etherfi and the synthetic dollar protocol Ethena, the number of Ethereum exiting the platforms seems to have started to decrease.
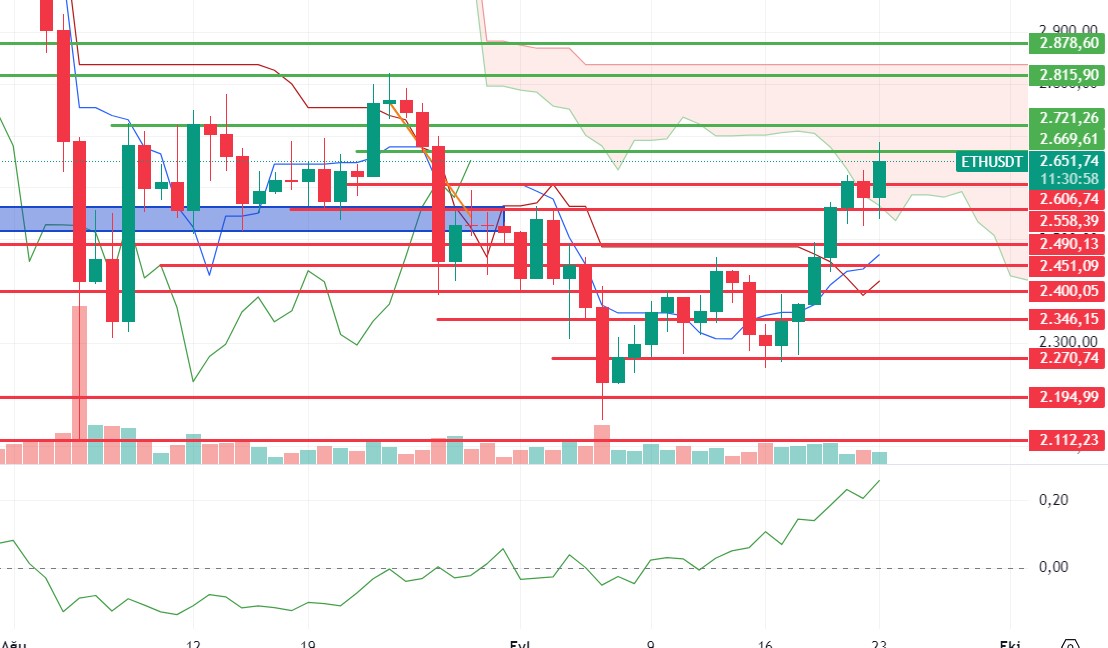
RSI, CMF and MACD remain positive in the one-day timeframe. On the other hand, there is a negative mismatch in momentum. Although the indicators for Ethereum, which entered the Ichimoku kumo cloud and developed a buy signal, look more positive, it would not be surprising to see a small correction in the near future. A correction movement to the range of 2,606 – 2,558 levels may come. The 2,825 level stands out as the main target. Exceeding the 2,685 level may trigger an uptrend.
Supports 2,570 – 2,537 – 2,412
Resistances 2,633 – 2,699 – 2,825
LINK/USDT
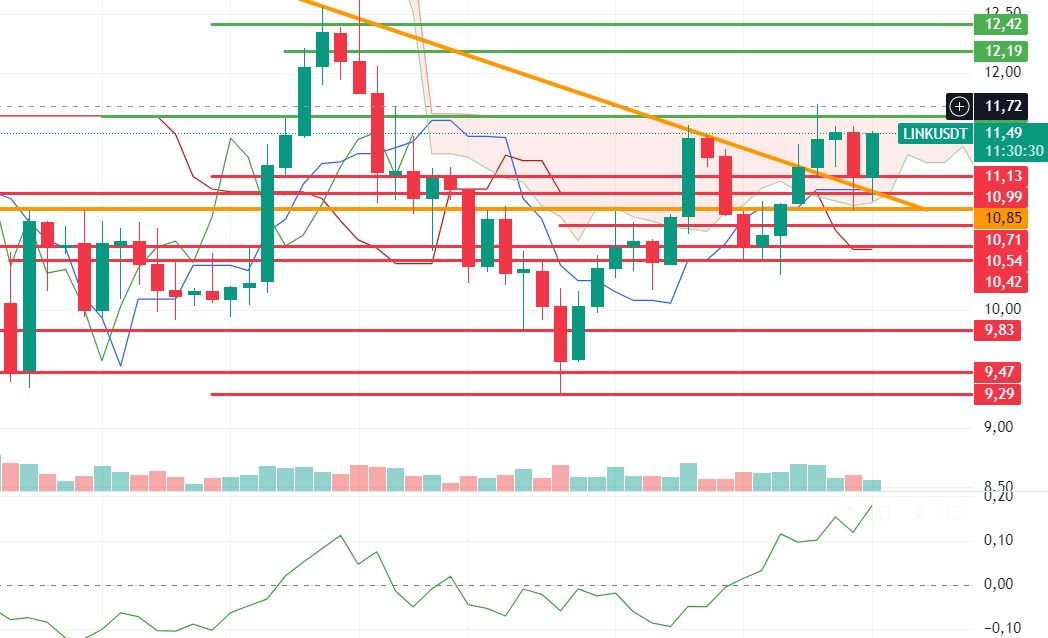
LINK, which continues to rise with the trend break, is trying to break the 11.64 kumo cloud resistance on a daily basis. Breaking this level for LINK, which maintains its positive outlook by all metrics, may accelerate the rise. The most important support level to watch out for is the 11.35 level and if it breaks, declines to 10.85 levels may come. Another important indicator to pay attention to is volume. For LINK, where we see the volume decreasing, it is seen that there is some demand with the number of smart contracts on Ethereum and the increase in gwei. In this period, it can be expected to see Gwei – LINK positive correlation.
Supports 11.13 – 10.85 – 11.54
Resistances 11.64 – 12.49 – 12.71
SOL/USDT
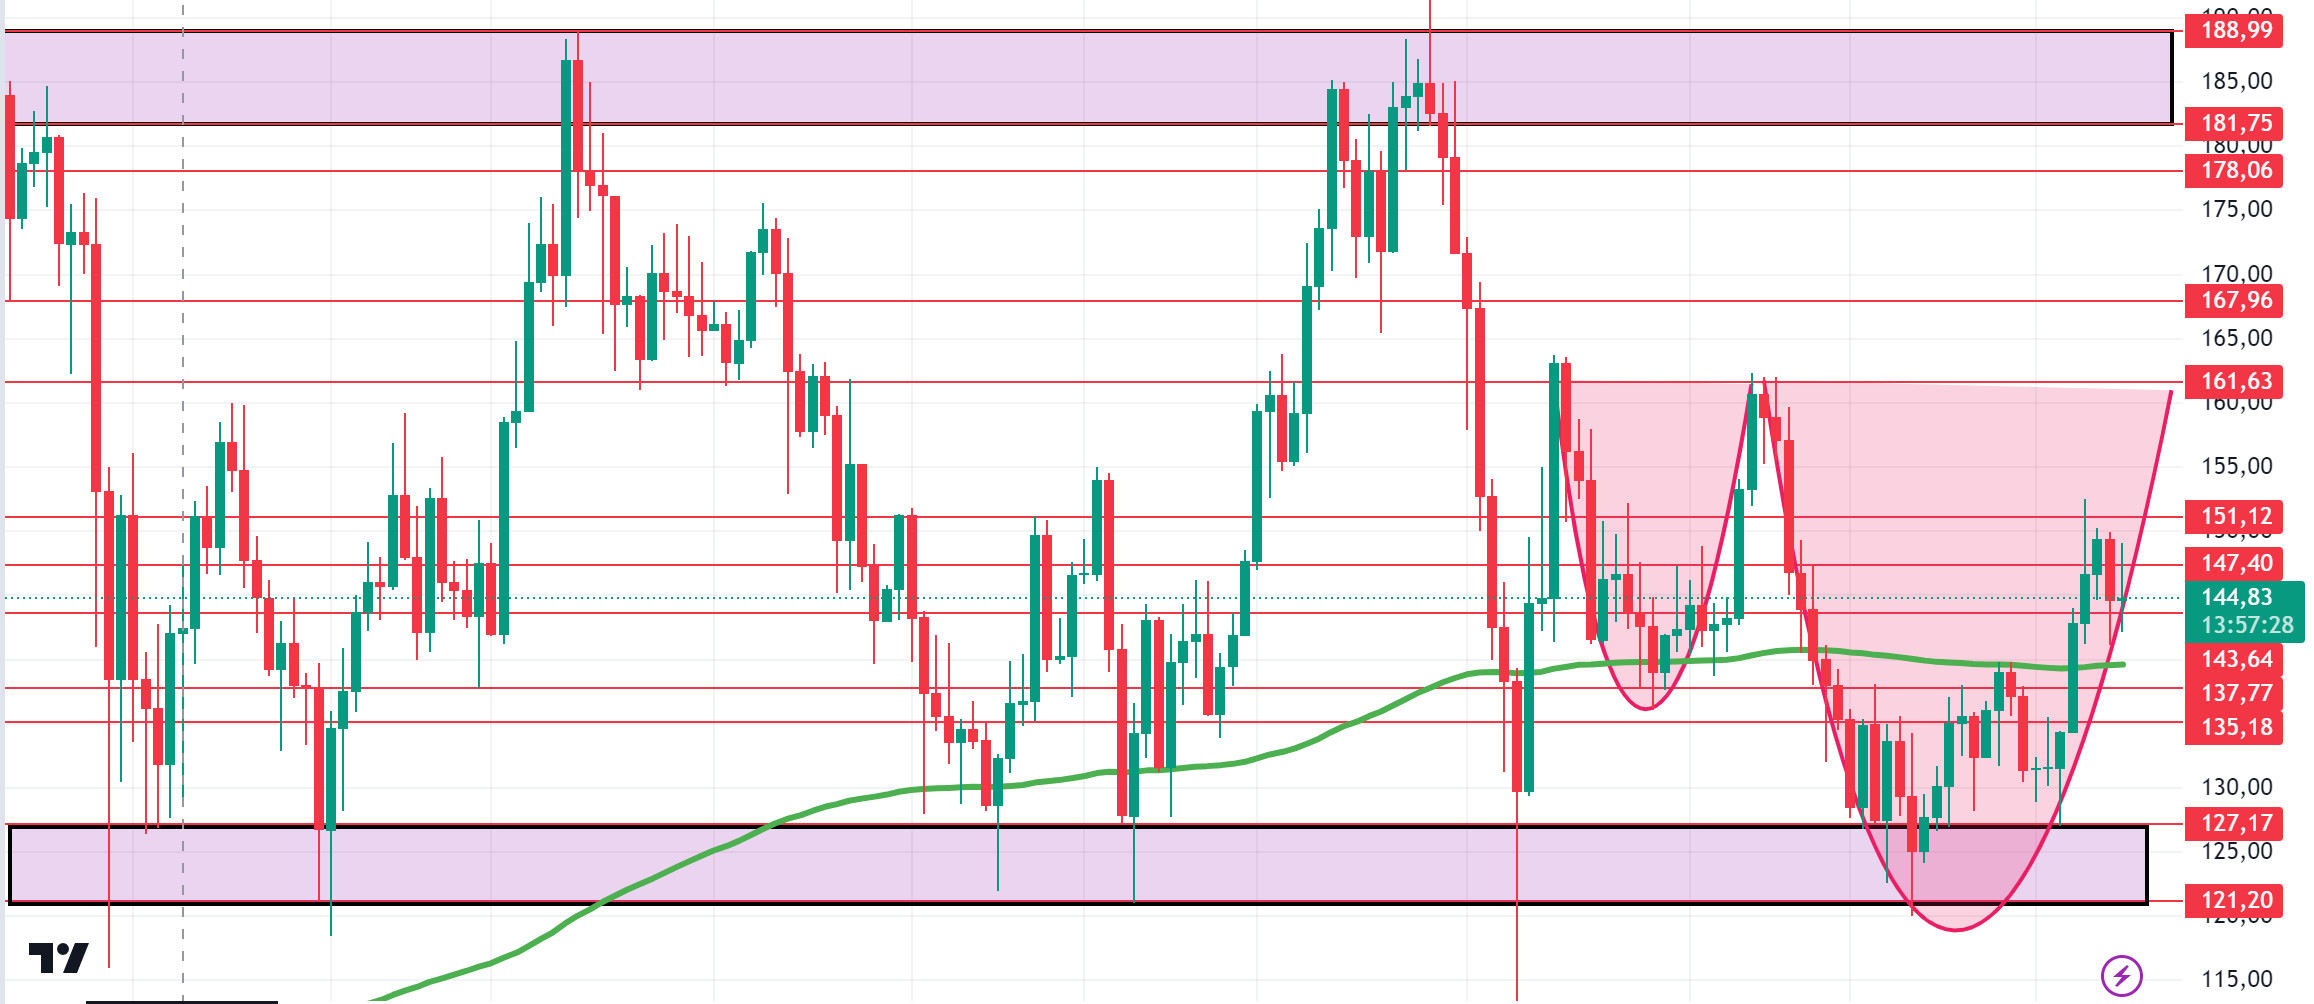
Macroeconomically, last week FED cut interest rates for the first time in 4 years. It cut interest rates by 50 basis points, fulfilling the market’s expectations. The interest rate was 5%. After this news, the cryptocurrency market rose and realized an increase of 8.13%. This brought the total market capitalization to $2.17 trillion. The main reason for the rise was the Fed chairman Powell’s hints that there was a very high probability of continuing the rate cut. According to data from the CME, the probability of a 25 basis point rate cut in November is 50.4%. However, BOJ announced its decisions after the monetary policy meeting. Accordingly, the short-term interest rate was left unchanged at 0.25 percent with a unanimous decision. Bitcoin dominance has reached its highest level in the last 3 years. It rose to 58.61%, its highest level since April 2021. Open interest data continues to rise. The volume of 2.02 billion dollars increased until the last day of the week, reaching 2.51 billion dollars. At the same time, another metric, active addresses, is on the rise. Data from Artemis shows that Solana’s weekly active addresses reached its highest level, reaching $4.2 million. In the Solana ecosystem, Graph announced a series of updates. This means that developers on Solana can now index blockchain data at record speeds without writing a single line of Rust code. These upgrades are said to increase Solana’s speed in the growing Web3 ecosystem and reduce costs. The Solana community also participated in Breakpoint, an annual event organized by the Solana Foundation in Singapore. Highlights of the event included trillion-dollar asset manager Franklin Templeton announcing his intention to launch an investment fund on Solana and a global centralized exchange wanting to add native cbBTC support to the Solana network. Alongside this, Solana introduced Mobile Seeker. With a lower price tag than the Saga and upgraded hardware, the Seeker smartphone aims to take Solana’s mobile ambitions to new heights. This week, the impact of the 50 basis point interest rate cut seems to continue. Although there are pullbacks, if we anticipate that new investors will enter the market, a horizontal market may await us this week. At the same time, GDP data from the US, Powell’s speech and personal consumption expenditure data are among the data to be followed. When we look at the SOL chart, it has been stuck between 121.20 – 188.99 since April 4. If the positive results in macroeconomic data and positive developments in the ecosystem continue, the first resistance levels seem to be 151.12 – 161.63. This positive data may cause the cup handle pattern to form. At the same time, the price is above the 200 EMA on the daily chart, indicating that the uptrend is imminent. In case of a possible profit sale or retracements due to the impact of data from the US, 143.64 – 137.77 levels can be followed, and a buying point can be determined.
Supports 143.64 – 137.77 – 135.18
Resistances 147.40 – 151.12 – 161.63
ADA/USDT
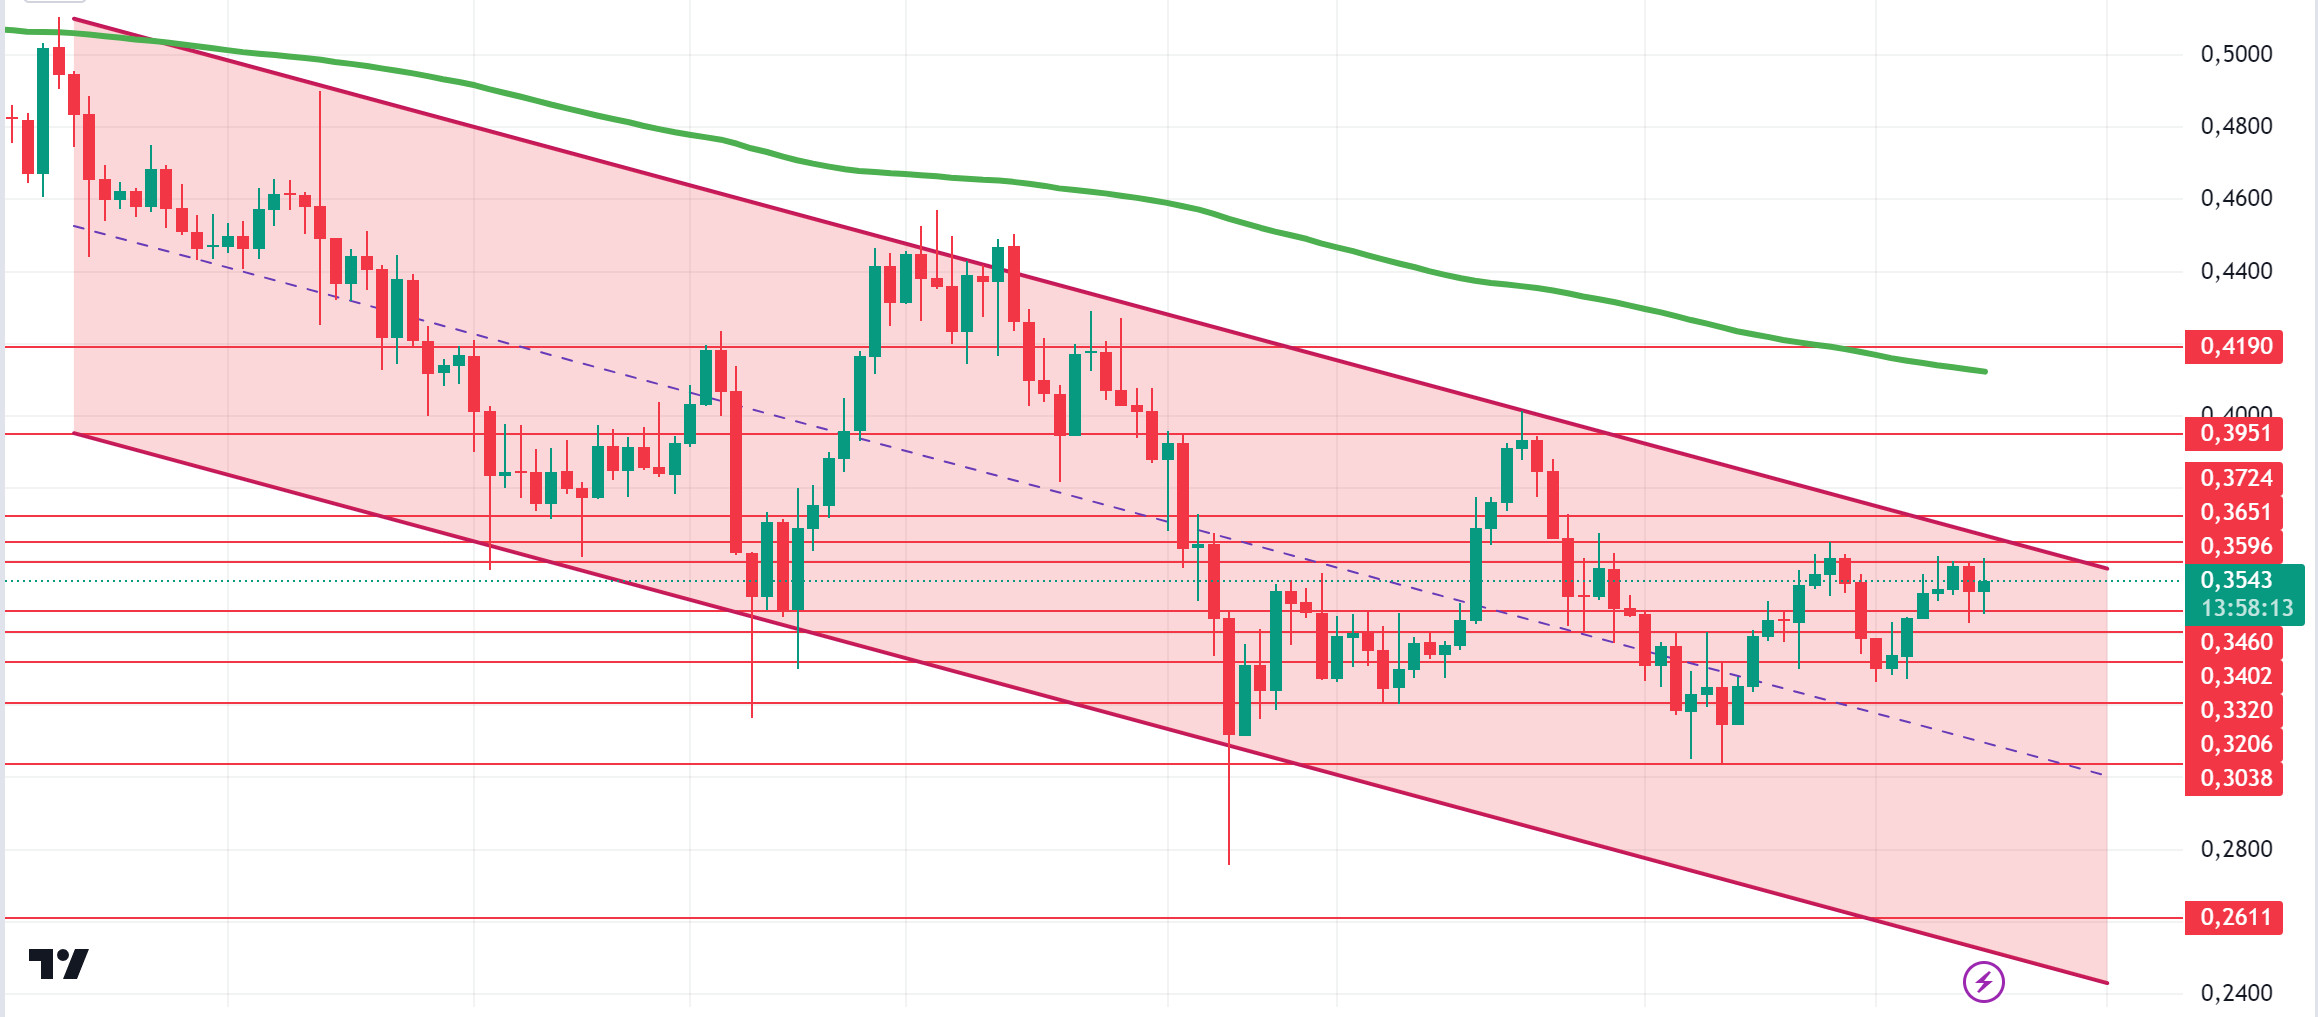
Macroeconomically, last week FED cut interest rates for the first time in 4 years. It cut interest rates by 50 basis points, fulfilling the market’s expectation. The interest rate was 5%. After this news, the cryptocurrency market rose and realized an increase of 8.13%. This brought the total market capitalization to $2.17 trillion. The main reason for the rise was the Fed chairman Powell’s hints that there was a very high probability that the rate cut would continue. According to data from the CME, the probability of a 25 basis point rate cut in November is 50.4%. However, BOJ announced its decisions after the monetary policy meeting. Accordingly, the short-term interest rate was left unchanged at 0.25 percent with a unanimous decision. Bitcoin dominance has reached its highest level in the last 3 years. It rose to 58.61%, its highest level since April 2021. In the Cardano ecosystem, according to data from IntoTheBlock, Cardano Whales bought 19.5 billion ADA tokens worth $ 6.48 billion last week. In addition, the number of investors holding ADA for more than a year continues to increase, increasing confidence in the asset. Cardano’s founder started a new debate by saying that he thought the protocol was superior to Solana because of the Leios protocol. We will see if this will cause tension between Cardano and Solana in the coming days. He also said, “This upgrade will be the second major upgrade since the implementation of the Chang hard fork in early September. On the other hand, Cardano recorded a huge growth with over 70,000 new smart contracts in 2024. This week, the effect of the 50 basis point interest rate cut seems to continue. Although there are pullbacks, if we anticipate that new investors will enter the market, a horizontal market may await us this week. At the same time, GDP data from the US, Powell’s speech and personal consumption expenditure data are among the data to be followed. When we look at the chart, the downtrend continues. The price, which has been below the 200 EMA on the daily chart for a long time, seems to continue to be priced horizontally this week. If it breaks the downtrend, we can identify the 0.3951 level and the 200 EMA as resistance points. In case of possible macroeconomic conditions and negative developments in the Cardano ecosystem, there may be a decline to the middle level of the downtrend.
Supports: 0.3460 – 0.3402 – 0.3320
Resistances: 0.3596 – 0.3651 – 0.3724
AVAX/USDT
AVAX, which started the previous week at 23.80, rose by about 17%, especially after the FED interest rate decision, and closed the week at 27.29. This week in the US, manufacturing purchasing managers’ index, services purchasing managers’ index, new home sales, gross domestic product, unemployment claims and core personal consumption expenditures price index will be released. In addition, FED chair Powell will give a speech on Thursday. The market will continue to search for direction according to these data and Powell’s speech. These data will also affect the market and AVAX. High volatility may occur in the market during and after the data release.
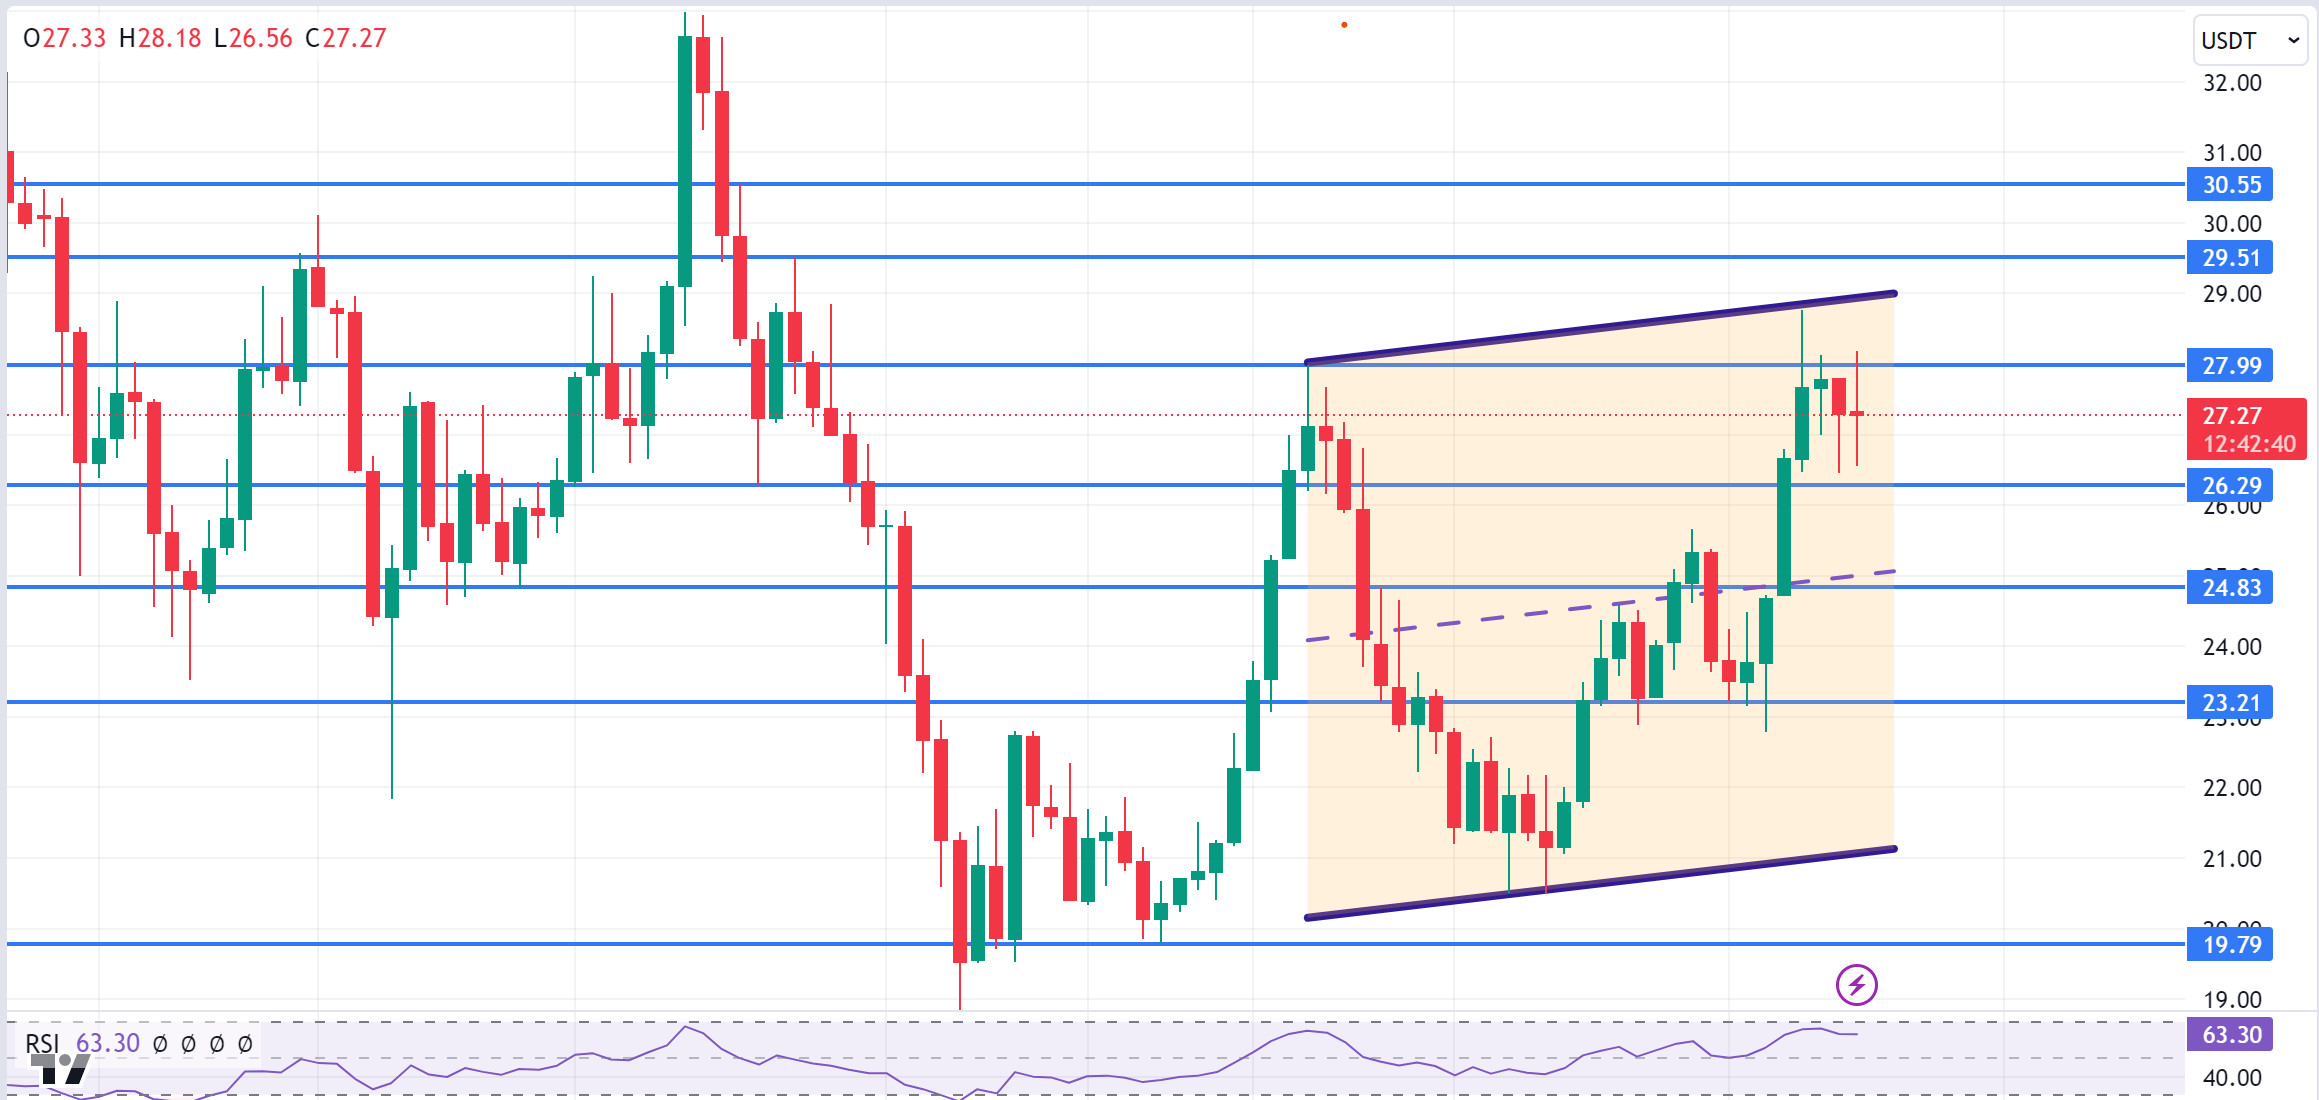
AVAX, which is currently trading at 27.27 and continues its movement within the rising channel on the daily chart, may break the upper band of the channel upwards with the positive perception of the upcoming data by the market. In such a case, it may test the 27.99 and 29.51 resistances. Especially with the candle closure above 29.51 resistance, its rise may accelerate. With the reaction from the upper band of the channel and selling pressure, it may move towards the middle and lower band of the channel and test the 26.29 and 24.83 supports. As long as there is no candle closure below 19.79 support on the daily chart, the upward appetite may continue. The decline may deepen with the candle closure below this support.
Supports 26.29 – 24.83 – 23.21
Resistances 27.99 – 29.51 – 30.55
TRX/USDT
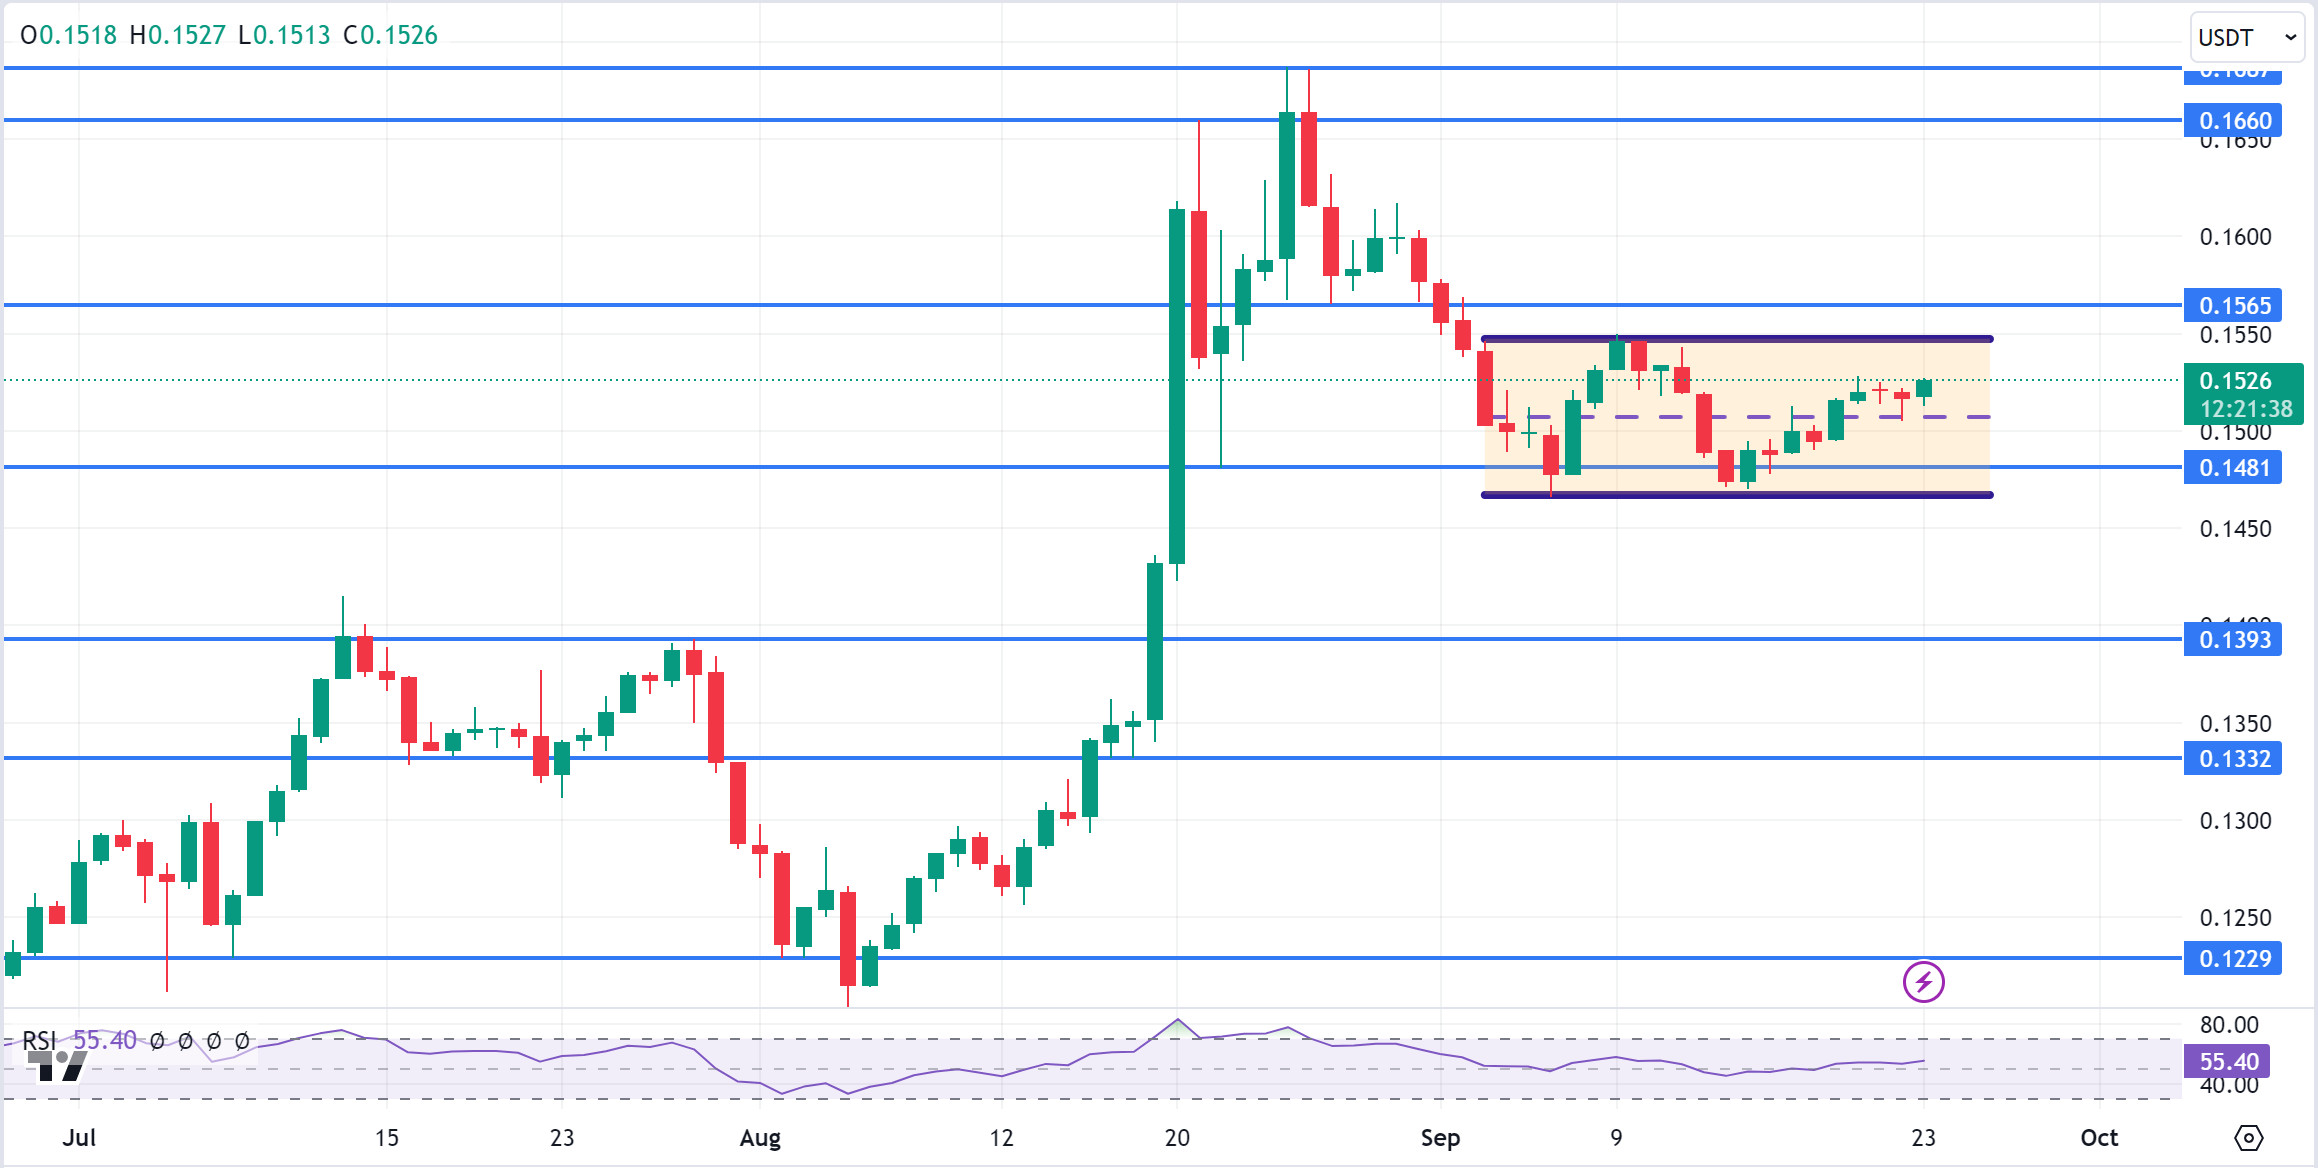
TRX, which started last week at 0.1490, rose about 2% during the week and closed the week at 0.1517.
This week in the US, manufacturing purchasing managers’ index, services purchasing managers’ index, new home sales, gross domestic product, applications for unemployment benefits and core personal consumption expenditures price index will be released. These data are important to affect the market and data to be announced in line with expectations may have a positive impact.
TRX, which is currently trading at 0.1526 and moving in a parallel channel on the daily chart, moves from the middle band of the channel to the upper band. With the positive future data, it may want to break the upper band of the channel. Thus, it can test the 0.1565 and 0.1660 resistances. If it declines with the selling pressure from the upper band of the channel, it may want to test the support of 0.1481. On the daily chart, the bullish demand may continue as long as it stays above 0.1229 support. If this support is broken, selling pressure may increase.
Supports 0.1481 – 0.1393 – 0.1332
Resistances 0.1565 – 0.1660 – 0.1687
XRP/USDT
XRP, which has been on the rise for 2 weeks, rose from 0.52 to 0.61, then fell to the 0.58-0.59 band with the sales. In this process, especially the news that the first US fund for XRP will be launched by Grayscale caused the rise and continued to rise with the FED interest rate decision. In the coming period, the SEC’s response to the court decision regarding the lawsuit with the SEC is expected. The SEC has the right to appeal until October 7. The fact that the SEC has not yet announced a decision on this issue has led to different opinions on whether it will appeal or not and the trend in the XRP price change is uncertain.
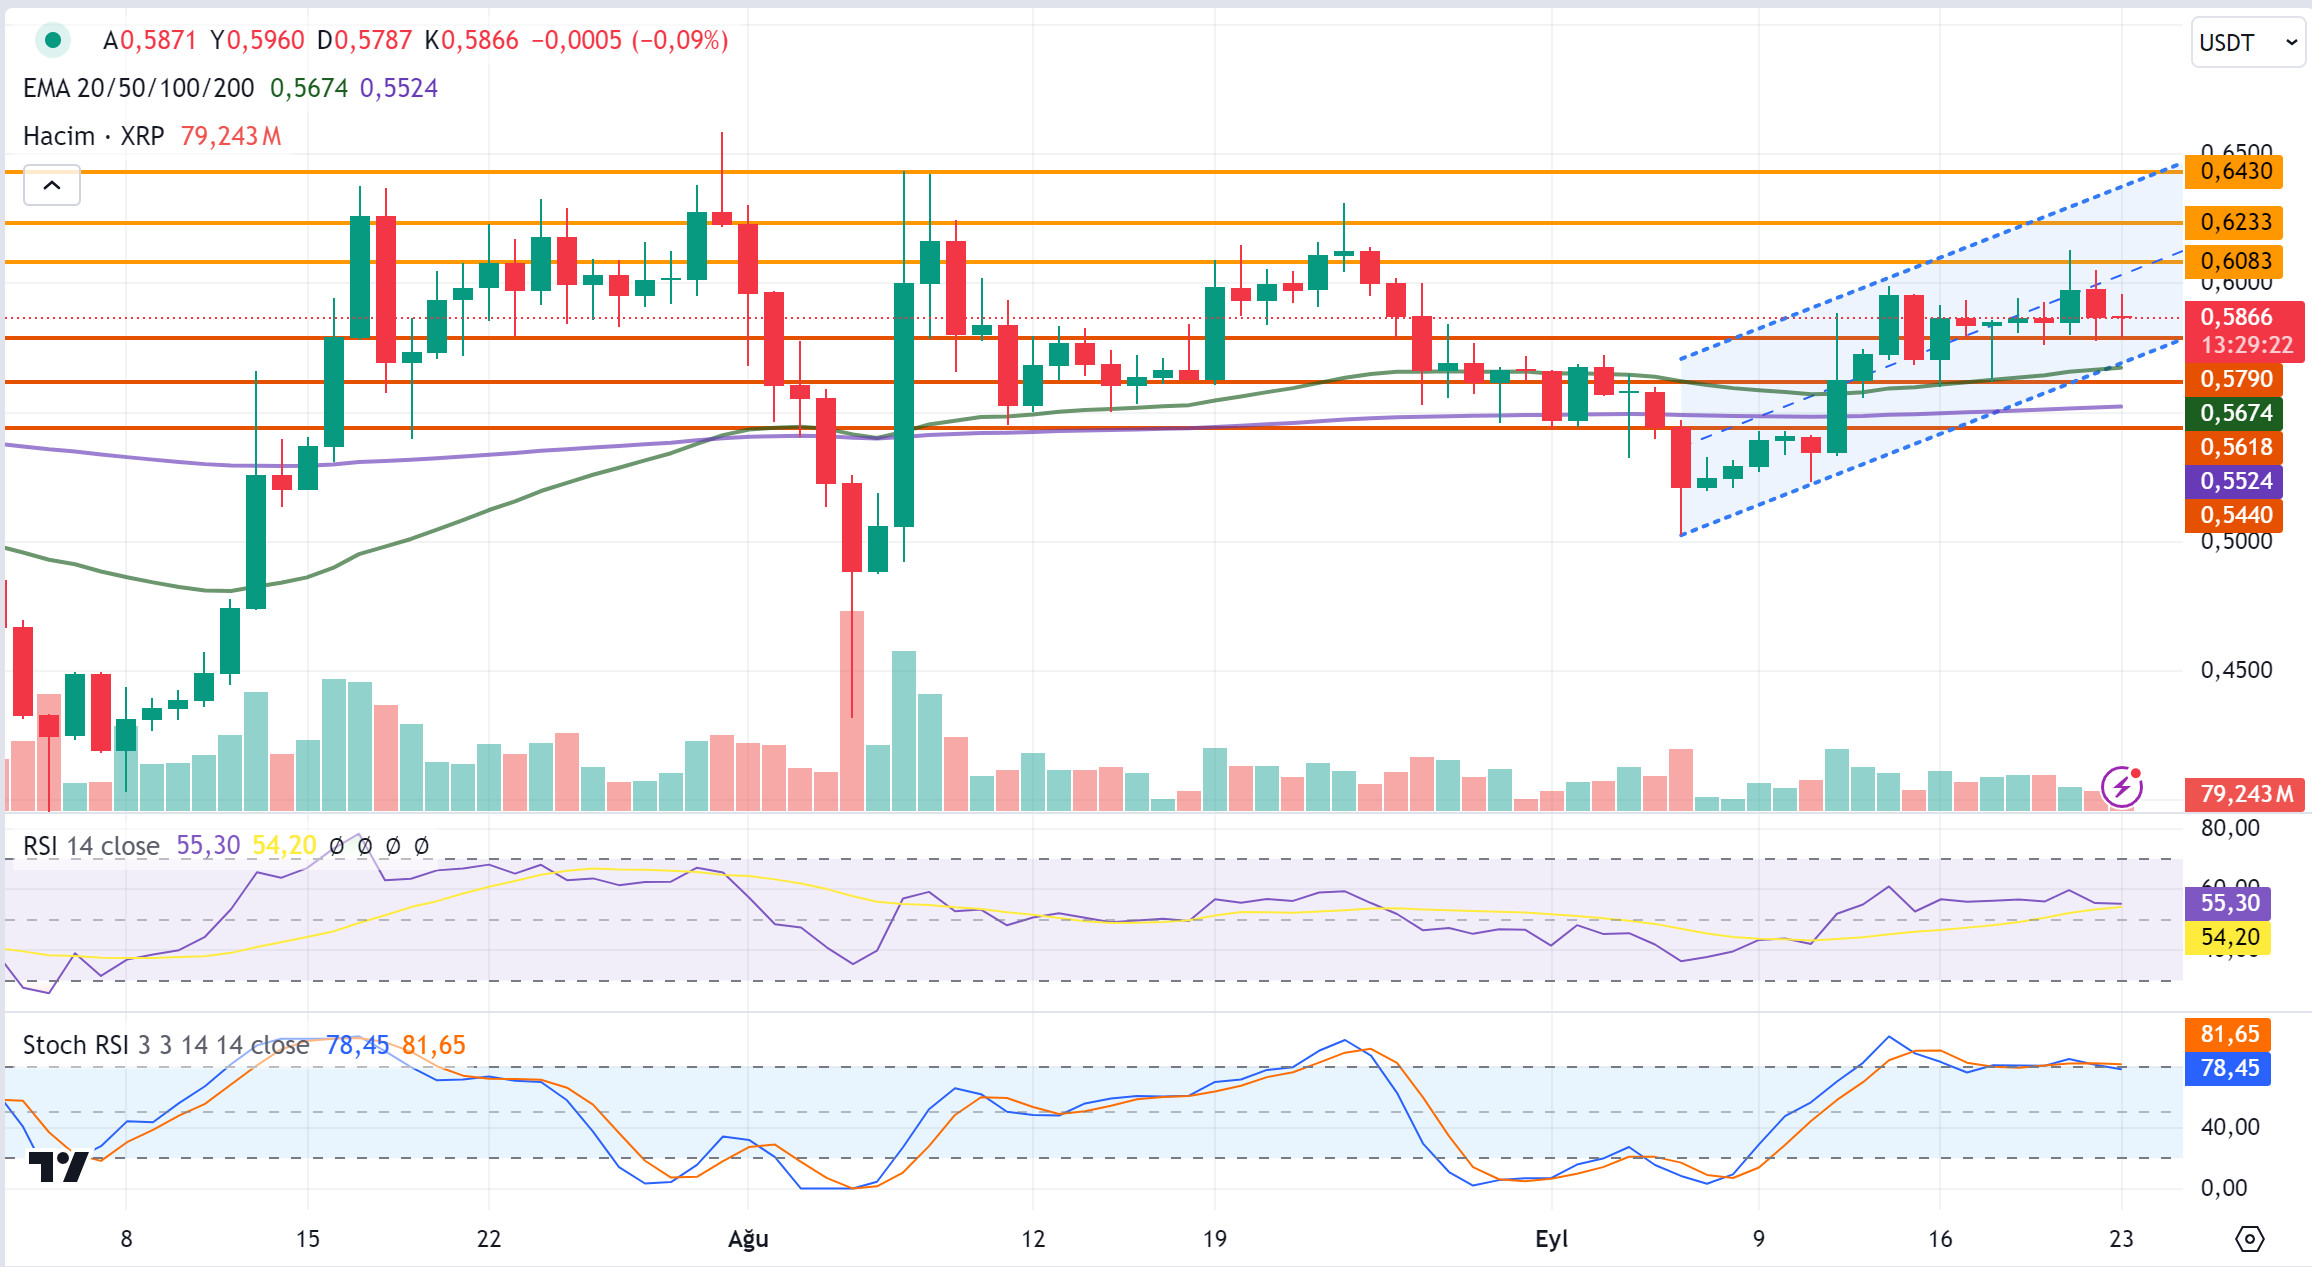
XRP continues to trade in a horizontal band between 0.58 and 0.61 last week. When we look at the RSI data, we can see that it varies in the 50-60 band and is neutral, not in the overbought or oversold zone. Before the SEC’s decision on the case, XRP may experience short-term rises and falls between 0.58 and 0.61 levels. In case of a decline, it may offer a long trading opportunity with possible purchases at 0.58, and in case of a rise, it may offer a short trading opportunity with possible sales at 0.61.
The long-term bullish expectation in XRP attracts investors’ interest. In this process, it may rise to 0.70 levels if the 0.61 resistance zone is broken before the SEC’s decision and a daily close above the 0.64 resistance zone is experienced. In case of a decline with negative developments, if the 0.58 support zone is broken, the 0.54 support zone and the EMA200 level come to the fore, and if it closes below these levels, a decline to 0.50 levels may occur.
Supports 0.5790 – 0.5618 – 0.5440
Resistances 0.6083 – 0.6233 – 0.6430
DOGE/USDT
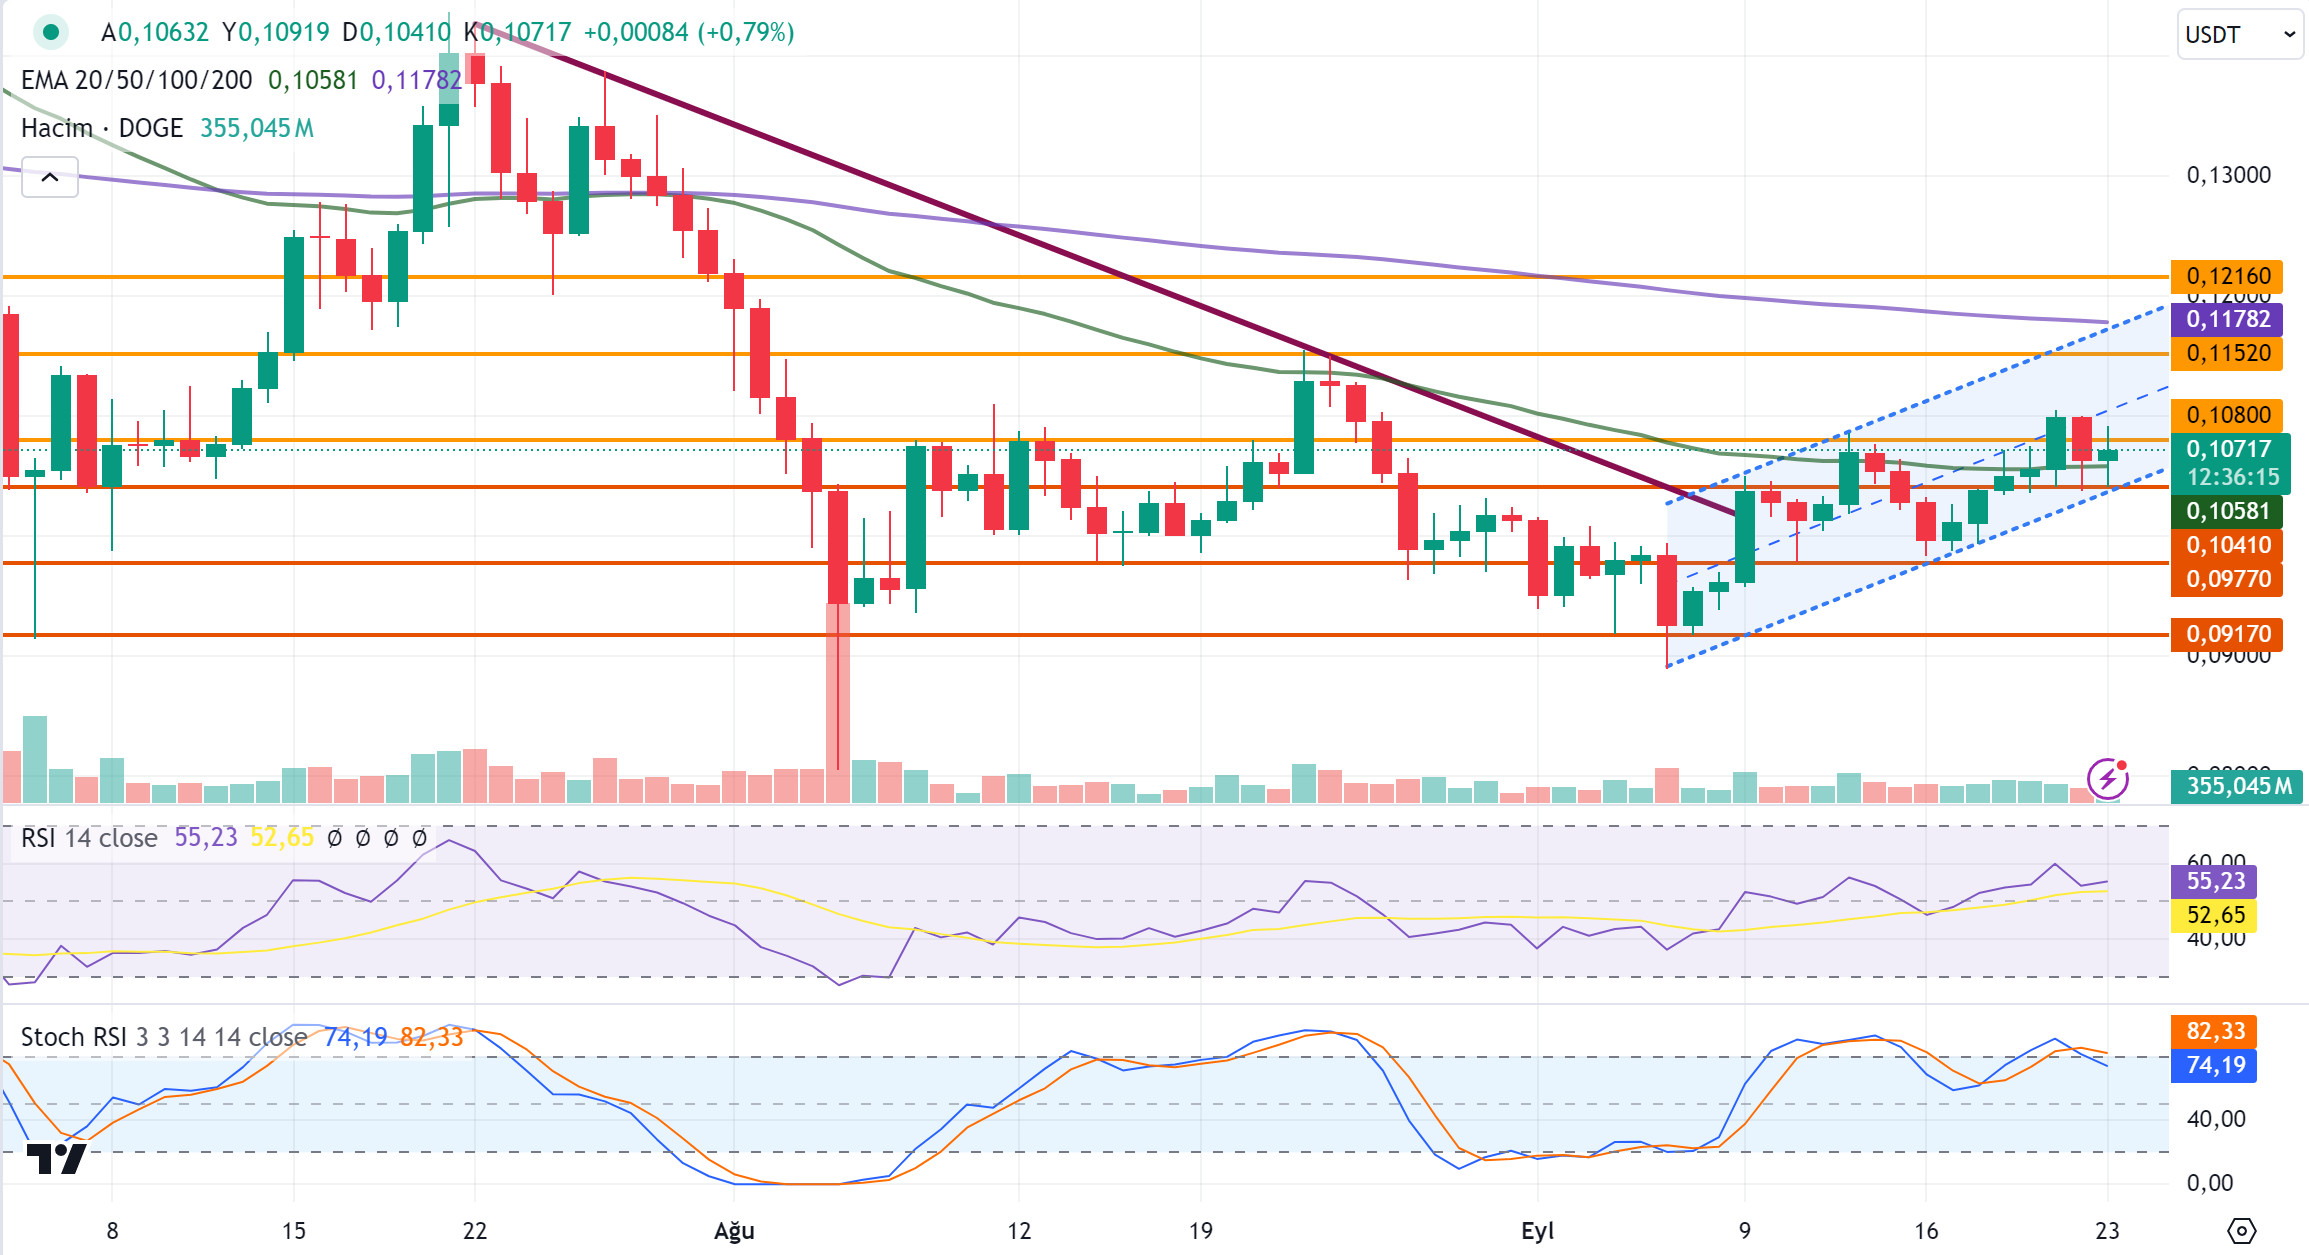
DOGE continues to trade in a horizontal band between 0.1040 and 0.1080 levels after the sales after rising to 0.1104 after the FED interest rate decision. We can state that the downtrend for DOGE has ended and it is trading within the rising channel. Especially the fact that nearly 2 million transactions were realized on the DOGE network last week shows that demand is increasing and the market is reviving on behalf of DOGE. This situation may lead investors to buy DOGE due to the increased expectation of a rise in the long term.
DOGE started to rise with the purchases at the EMA50 level during the declines in the rising channel. The 0.1150 resistance zone and then the EMA200 level are important in the DOGE rise, which continues to be traded within the horizontal band. In case of a close above these levels, DOGE may continue its rise and may rise to 0.1400 levels. In case of a decline, if a close below the 0.0977 support level is seen, the decline may deepen and the 0.0917 support level may be tested.
DOGE, which is trading within the horizontal band, is not in the overbought or oversold zone according to the RIS data. According to the Stochastic RSI data, it is trading close to the overbought zone. It can be predicted to continue its movement within the horizontal band in the process when there are no major movements in the markets with a positive or negative development. Rise and fall within the horizontal band may offer short-term trading opportunities.
Supports 0.1041 – 0.0977 – 0.0917
Resistances 0.1080 – 0.1152 – 0.1216
DOT/USDT
Last week, Polkadot relaunched its decentralized Ambassador program, which allows the community to elect their Chief Ambassadors through voting. William, one of the new Chief Ambassadors, focused on encouraging institutional adoption. Additionally, Polkadot and WalletConnect partnered to launch the DOTphin NFT project to protect marine life at the Token 2049 event in Singapore. The NFT XCM technology, which enables cross-chain transfer of NFTs in the Polkadot ecosystem, was also announced, offering new opportunities for developers and users.
Polkadot (DOT) chart shows that the price is hovering above the 4,226-support band. In case the EMA50 breaks the EMA200 upwards (Golden Cross), the price may move towards the 4.918 resistance level, which is both the first resistance level and the upper band of the falling channel. When we analyze the MACD oscillator, we see that the selling pressure has increased compared to the previous hour. In the event that the price persists below the 4.226 support band, the first reaction may be the 3.713 support band.
Supports 4,226 – 3,713 – 3,551
Resistances 4.918 – 5.889 – 6.684 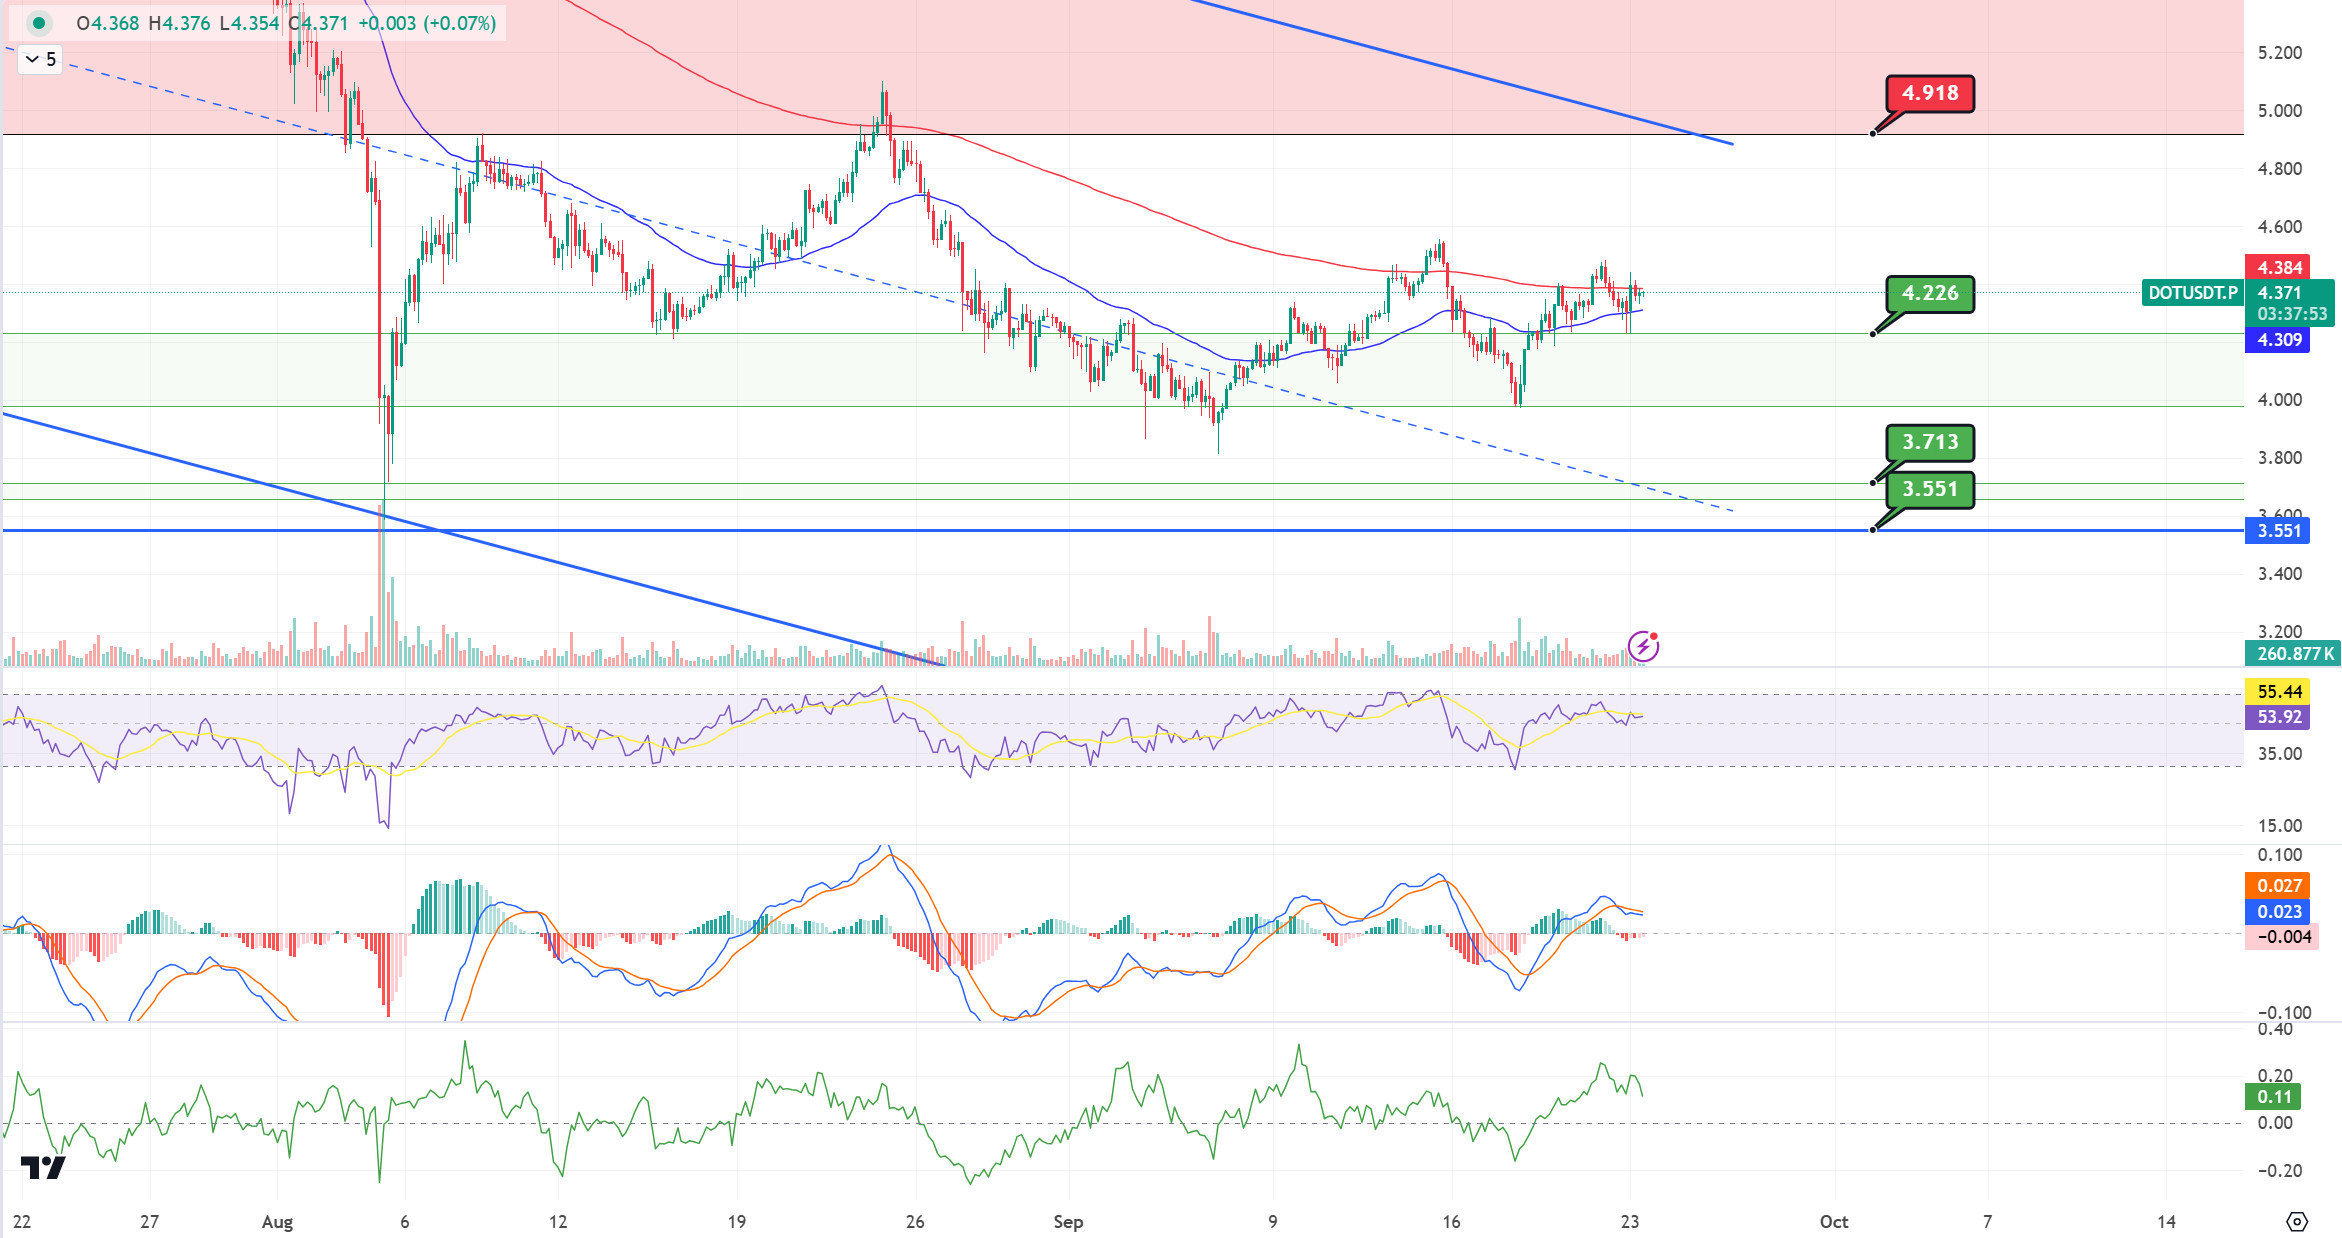
SHIB/USDT
Last week, Shiba Inu’s burn rate increased by 340%, resulting in 11 million SHIBs being burned. The low trading volume on Shibarium affected the burn rate, while the community is disappointed that BONE is not listed on Binance. Additionally, the Shiba Inu team supported ALS patients by donating to the Seungil Hope Foundation and launched a liquid staking protocol on the Shibarium network.
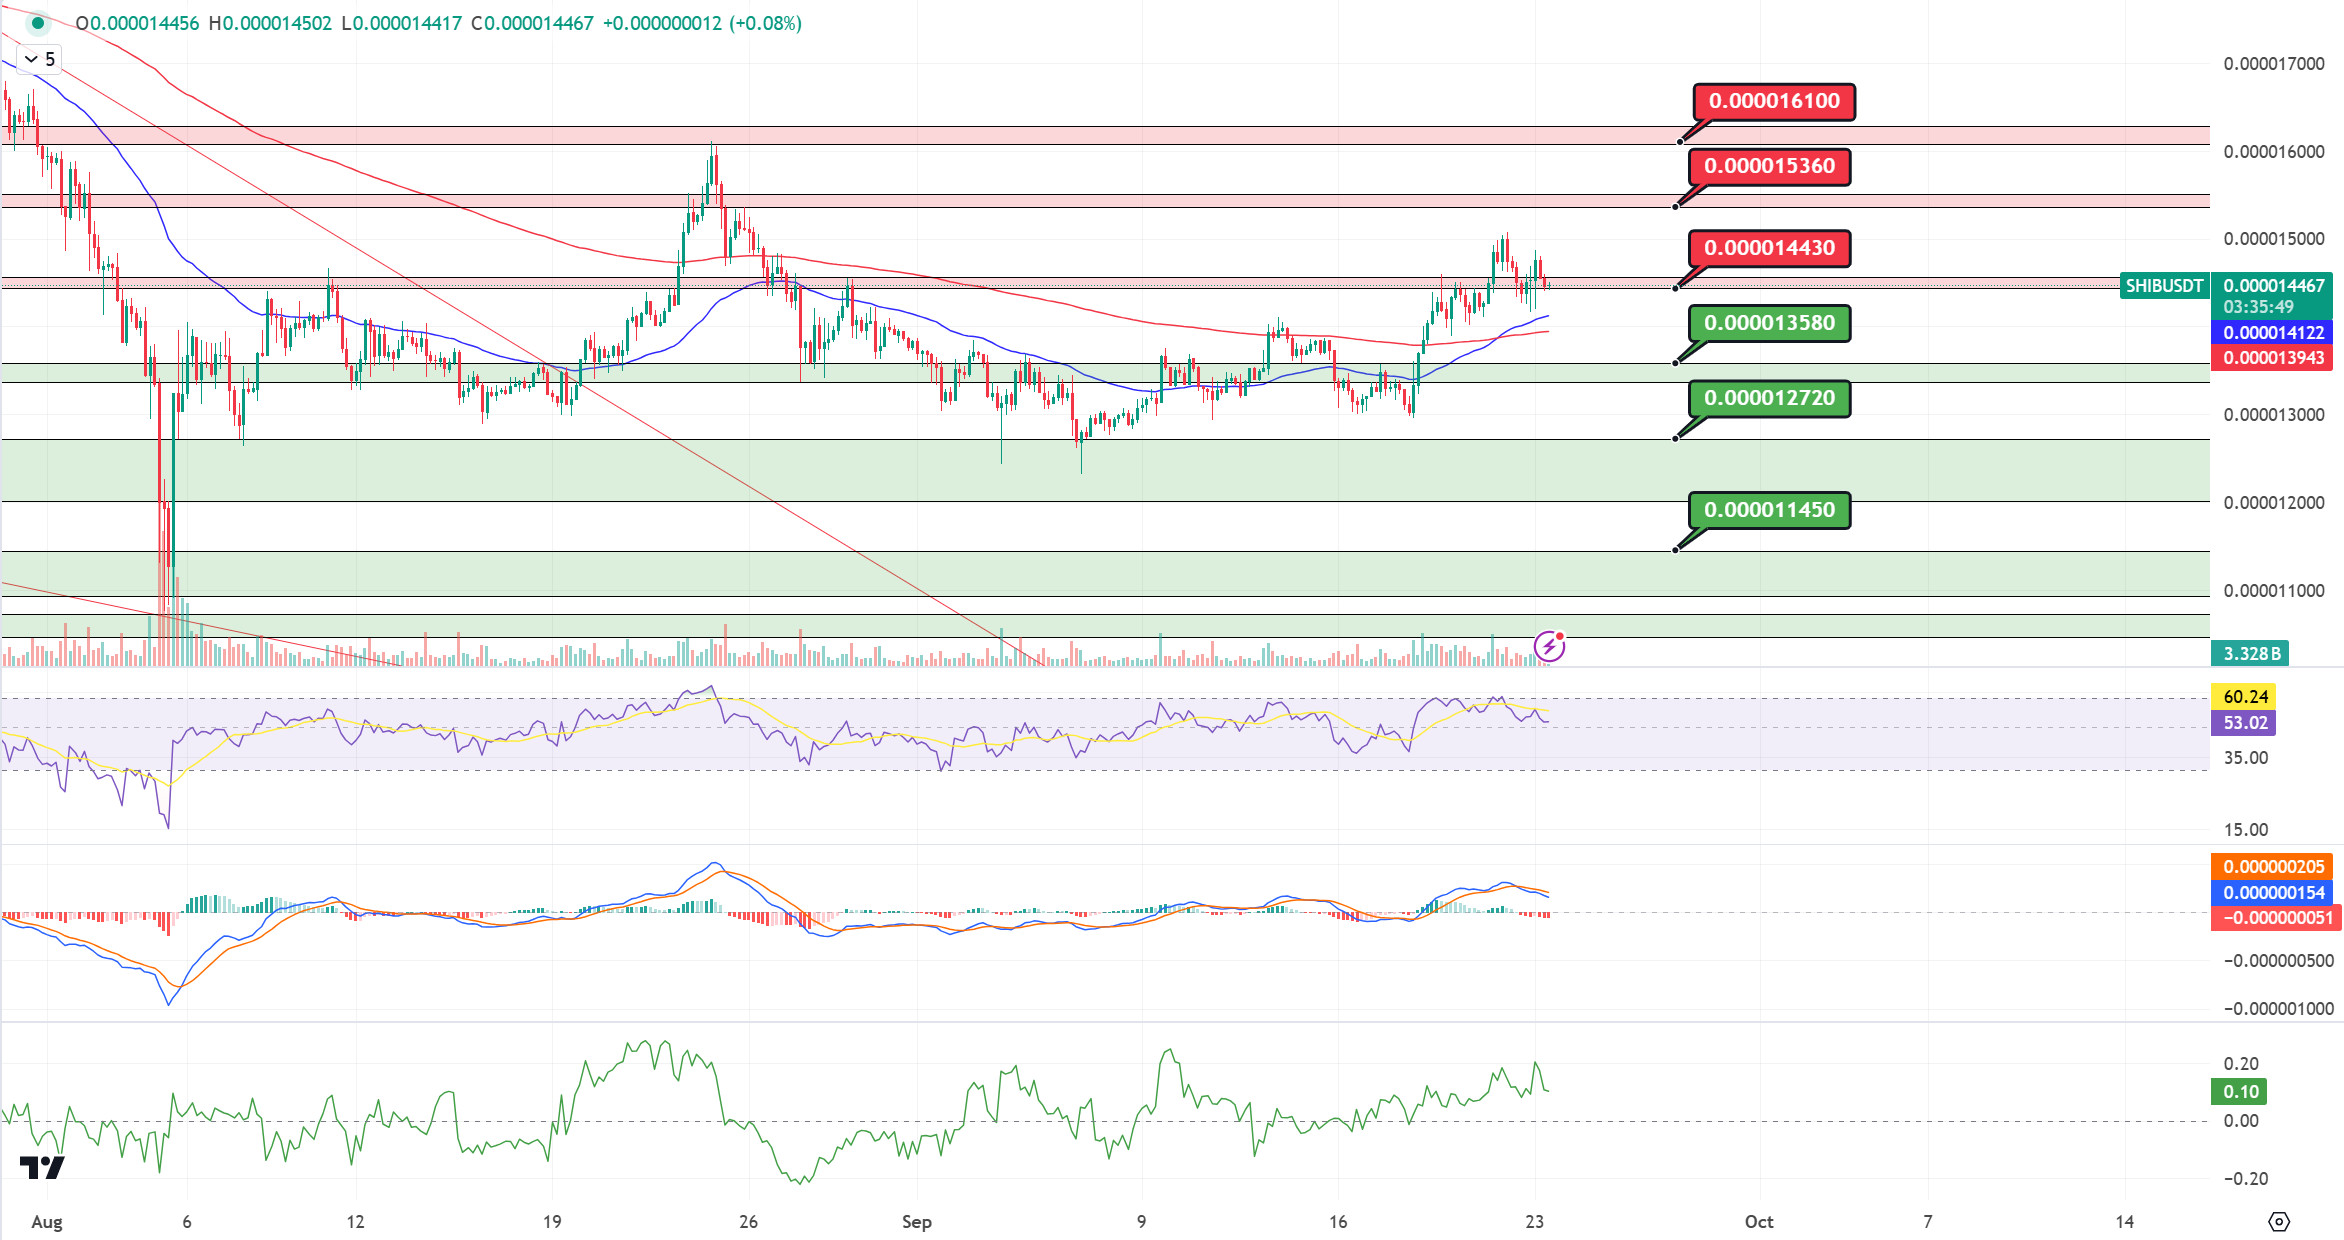
When we examine the chart of Shib Inu (SHIB), we see that the EMA50 broke the EMA200 upwards (Golden Cross). The price, which broke the 0.00001358 resistance upwards, also broke the 0.00001443 resistance upwards and seems to have made its correction. When we examine the MACD oscillator, we can say that the selling pressure is increasing. If the price cannot maintain above 0.00001443, its next target may be 0.00001358. In case the price maintains above the critical resistance level of 0.00001443, its next target may be the resistance level of 0.00001536.
Supports 0.00001358 – 0.00001272 – 0.00001145
Resistances 0.00001443 – 0.00001536 – 0.00001610
LEGAL NOTICE
The investment information, comments and recommendations contained in this document do not constitute investment advisory services. Investment advisory services are provided by authorized institutions on a personal basis, taking into account the risk and return preferences of individuals. The comments and recommendations contained in this document are of a general type. These recommendations may not be suitable for your financial situation and risk and return preferences. Therefore, making an investment decision based solely on the information contained in this document may not result in results that are in line with your expectations.


