Technical Analysis – January 07, 2026
BTC/USDT
As geopolitical and economic issues intertwine on the global agenda, the US’s energy-focused influence over Venezuela is becoming increasingly apparent. While oil diplomacy brings a new search for harmony between Caracas and Washington to the forefront, the Trump administration’s more expansionist foreign policy rhetoric is raising tensions from the Arctic to Latin America. Trump also announced that he would step down if Republicans failed to win the midterm elections. On the economic front, divisions within the Fed are deepening, while trade, energy, and security-focused decisions continue to shape global markets.
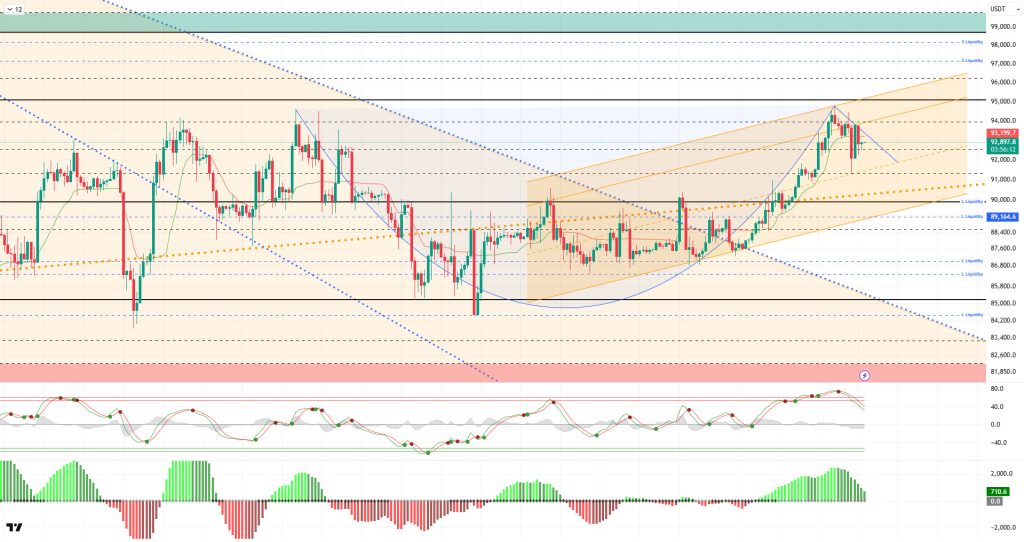
From a technical perspective, BTC paused its relentless rise after breaking out of the falling band. The patterns formed in the price structure justified our short-term consolidation scenario. In this context, the attempt to complete the handle part of the cup pattern and the flag part of the flag pattern continues in a broader context. Testing the 91,400 support level with yesterday’s spike movement, the price quickly recovered from there and rose above the 92,600 resistance level again. While the price holding above this level is expected to lay the groundwork for a new upward movement, the 91,000 level, where the major upward line passes, can be monitored as a barrier to remaining in positive territory and against possible sharp selling pressure.
Technical indicators, such as the Wave Trend (WT) oscillator, attracted attention with its buy signals in the overbought zone, but it has now switched to a sell signal. The histogram on the Squeeze Momentum (SM) indicator has started to lose momentum within the positive zone. The Kaufman Moving Average (KAMA) is currently trading above the price level at $93,200.
When examining liquidation data, buy-side transactions show intense accumulation in the short term at the 89,000 – 90,000 level, while accumulation continues in the long term at the 86,000 – 87,000 level. In contrast, sell orders are accumulating again at the 95,000 level in the short term, while intense sell clusters continue above the 97,000 level in the monthly timeframe.
In summary, while Venezuela’s interim government complies with US demands on oil and trade, Trump’s expansionist foreign policy messages continue. European leaders call on Trump to respect Greenland’s borders and status, while Russia and Ukraine reach a military agreement. On the Fed front, Trump-friendly members are calling for interest rate cuts, while more realistic members tend to make data-driven decisions. Looking at liquidity data, after areas of intense short-term trading, long-term trades were liquidated with the price breakout, and the buying level gained weight in the short term. In technical terms, BTC started the new year with positive momentum, continuing its parallel movement with the upward channel and rising to 94,800 levels. With limited profit-taking from this point, the price retreated to the 91,400 region.In the next phase, 92,600 stands out as a critical support area, and the major uptrend will be followed with the cup and flag pattern that has formed. Closings above this line will allow the technical structure to regain strength, while the breakout will determine whether it will hold above the 90,000 reference area.
Supports: 92,600 – 91,400 – 90,000
Resistances: 94,000 – 95,000 – 98,000
ETH/USDT
The ETH price experienced volatility yesterday evening, in line with the expected scenario. With weaknesses in technical indicators coming to the fore, the price quickly fell to around $3,190. Buying from this region was strong, and the rebound quickly pushed the price back up to around $3,300. By the morning hours, however, light selling pressure emerged following this rise, and the price retreated back to around $3,250. This intraday flow indicates that the market is still in a decision phase and that sharp shifts between buyers and sellers are occurring.
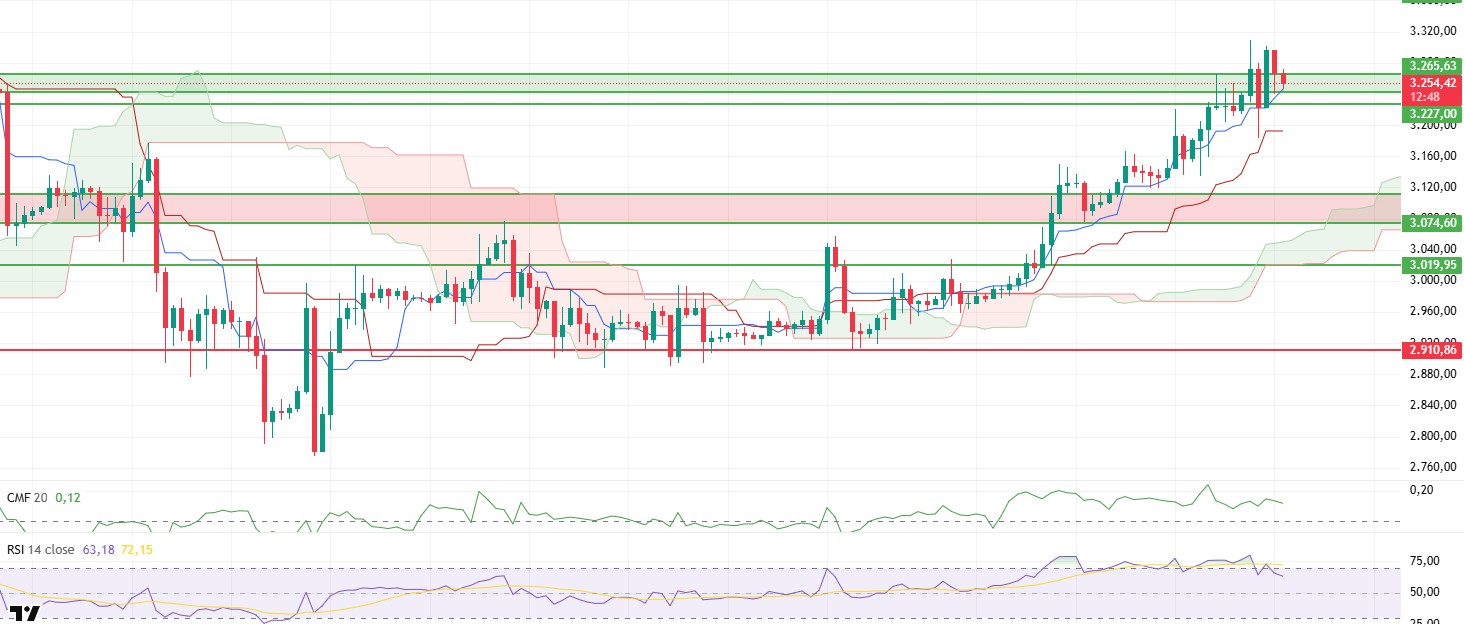
The resistance area indicated by the green rectangle in the chart has not yet been permanently broken. Although the price has repeatedly returned to this area, its inability to hold above it indicates that upward demand remains intact, but selling pressure also remains strong at this point. Therefore, price action is still moving within a decision zone, and a volatile trend may continue until the direction becomes clear.
The liquidity outlook is balanced. Chaikin Money Flow (CMF) maintained its horizontal course in positive territory throughout this process. This picture shows that despite sharp price movements, there has been no significant outflow of money from the market and that liquidity inflows and outflows have balanced out. It can be said that the pullback was not panic-driven, but rather a correction as the price sought its own internal equilibrium.
On the momentum side, the picture is clearer. The Relative Strength Index (RSI) has started to move downward from the overbought zone. This outlook suggests that a classic cooling-off period has begun following the recent rise. This unwinding in the RSI is progressing in line with the price pullback and indicates that the move is more of a technical correction than a trend reversal.
The technical structure is protected from the Ichimoku indicator perspective. The price continues to remain above the kumo cloud, and the Tenkan and Kijun levels are still below. This structure indicates that the main trend continues to be upward and that recent fluctuations have not disrupted this structure.
In the overall assessment, two levels stand out for the price during the day. If the $3,227 support level is lost, downward movement may accelerate somewhat. Conversely, breaking above the $3,265 level could produce an important signal for the continuation of the uptrend, as it would mean leaving behind the area marked with a green rectangle. In the current scenario, the ETH price maintains its strong trend, but a sharp and volatile pricing process specific to the decision phase is prominent in the short term.
Below the Form
Supports: 3,227 – 3,074 – 3,019
Resistances: 3,265 – 3,368 – 3,478
XRP/USDT
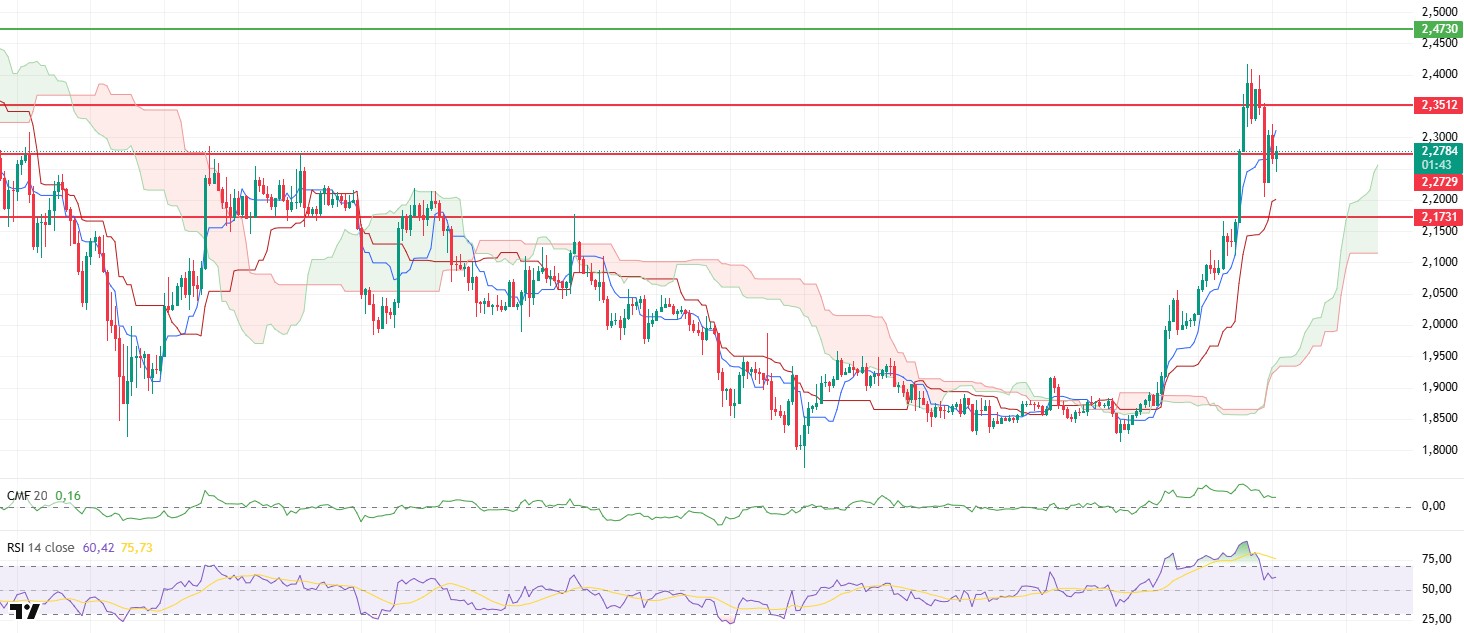
The XRP price experienced a sharp decline yesterday evening, retreating to the $2.20 level. Buying activity from this area halted the decline, and the price rebounded, reclaiming the $2.27 level. The swift reaction indicates that selling pressure has weakened in this region and buyers have re-entered the market. However, the effort to stabilize at lower levels compared to previous peaks suggests the market is still proceeding cautiously.
The liquidity outlook is not completely deteriorated, but it is weaker compared to previous days. The Chaikin Money Flow (CMF) remains in positive territory, but the downward slope is noteworthy. This structure suggests that there is no strong outflow of money from the market, but liquidity inflows have slowed down. Therefore, upward moves may find it harder to progress as smoothly as before.
There is also a similar cooling on the momentum side. The Relative Strength Index (RSI) has moved out of the overbought zone and continues its downward movement. This weakening in momentum does not indicate that the upward momentum has completely disappeared, but rather that the overheating has been balanced out. From this perspective, the current pullback can be interpreted as a technical correction rather than a signal that disrupts the structure.
From a technical perspective, the Ichimoku indicator appears more balanced. Although the price has fallen below the Tenkan level, it remains above the Kumo cloud and Kijun levels. This positioning indicates that the medium-term positive structure remains intact, even if short-term volatility occurs. For technical pressure to increase, these areas must also be lost in a downward direction.
The critical level of $2.17 stands out in the overall picture. As long as the price remains above this level during the day, upward attempts are expected to continue. If it falls below $2.17, selling pressure may become more pronounced and the decline could deepen. The current structure indicates that the correction is continuing but the main trend has not yet turned downward.
Supports: 2.2729 – 2.1731 – 2.0513
Resistances: 2.3512 – 2.4730 – 2.5614
SOL/USDT
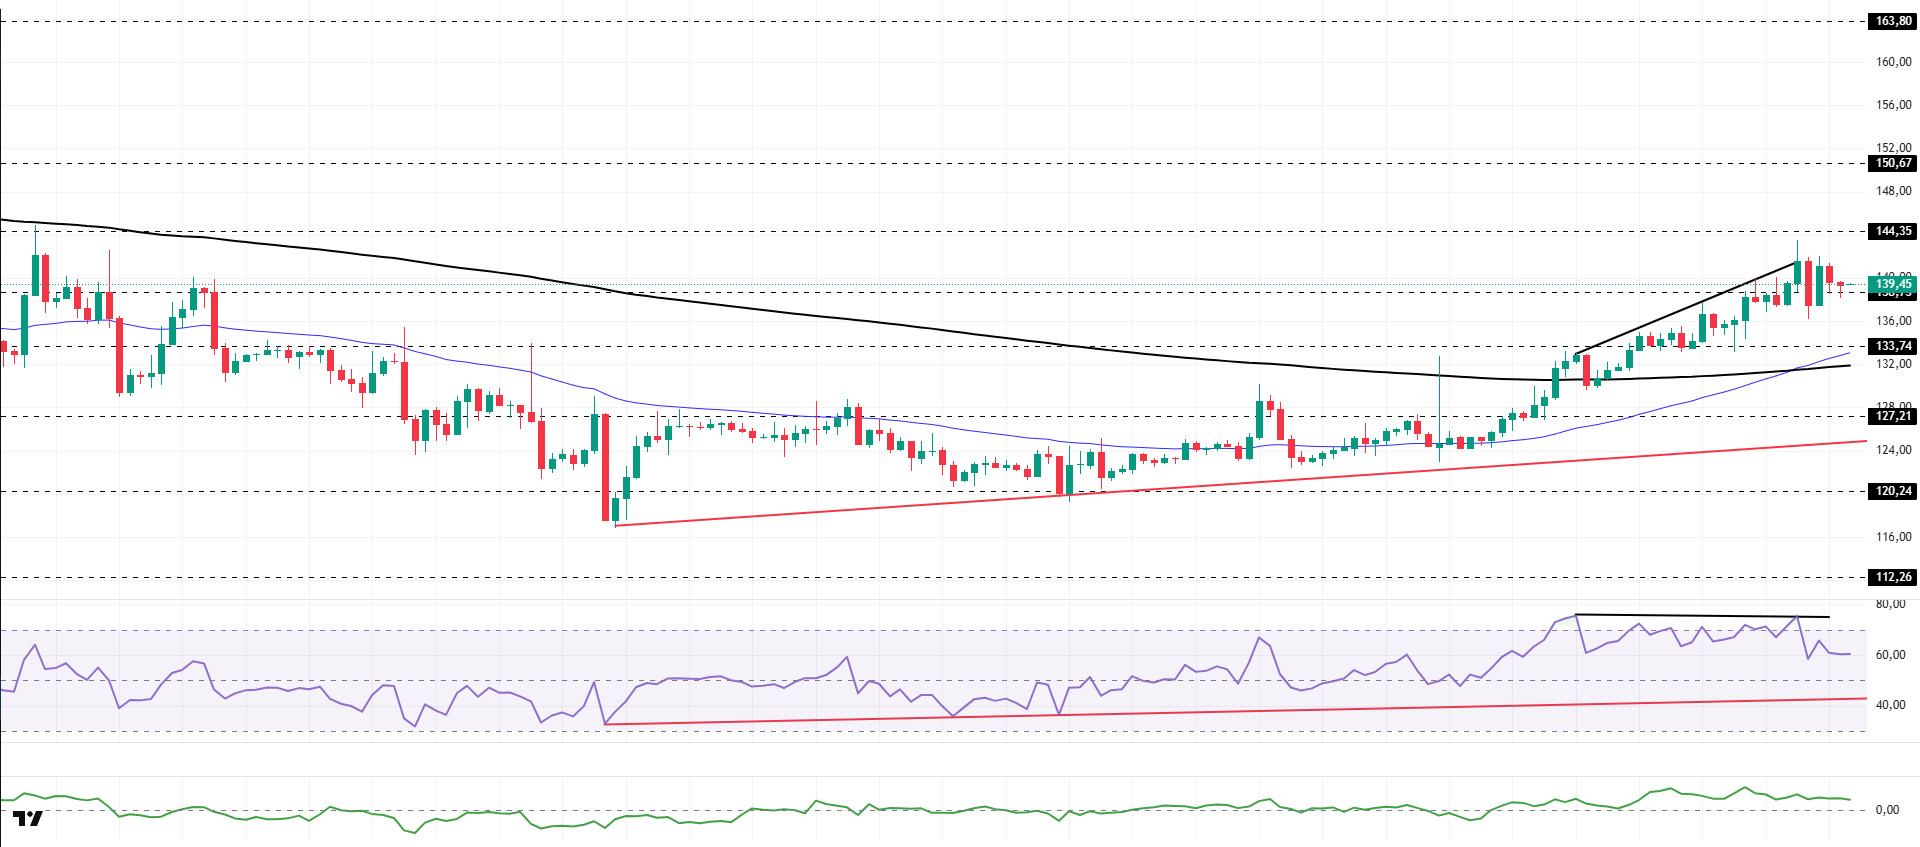
The SOL price experienced a slight pullback. The asset remained in the upper region of the rising line that began on December 18. Gaining momentum from the strong support level of $133.74, the price continued to rise and is currently trading above the strong resistance level of $138.73. If it manages to hold above this level, it could test the $144.35 level as resistance. In the event of a pullback, it could test the 200 EMA (Black Line) moving average as support.
The price has crossed above the upper region of the 50 EMA (Exponential Moving Average – Blue Line) and 200 EMA (Black Line) on the 4-hour chart. This indicates that an uptrend may begin in the medium term. At the same time, the price being above both moving averages signals that the asset is trending upward in the short term. The Chaikin Money Flow (CMF-20) is in positive territory. However, a decrease in money inflows could push the CMF back into negative territory. The Relative Strength Index (RSI-14) has retreated from overbought levels to the middle of positive territory. It also remained above the rising line that began on December 18. This signaled that buying pressure continued. On the other hand, the negative divergence remains significant. If there is an uptrend due to macroeconomic data or positive news related to the Solana ecosystem, the $150.67 level stands out as a strong resistance point. If this level is broken upwards, the uptrend is expected to continue. If pullbacks occur due to developments in the opposite direction or profit-taking, could test the $127.21 level. A decline to these support levels could increase buying momentum, presenting a potential upside opportunity.
Supports: 138.73 – 133.74 – 127.21
Resistances: 144.35 – 150.67 – 163.80
DOGE/USDT
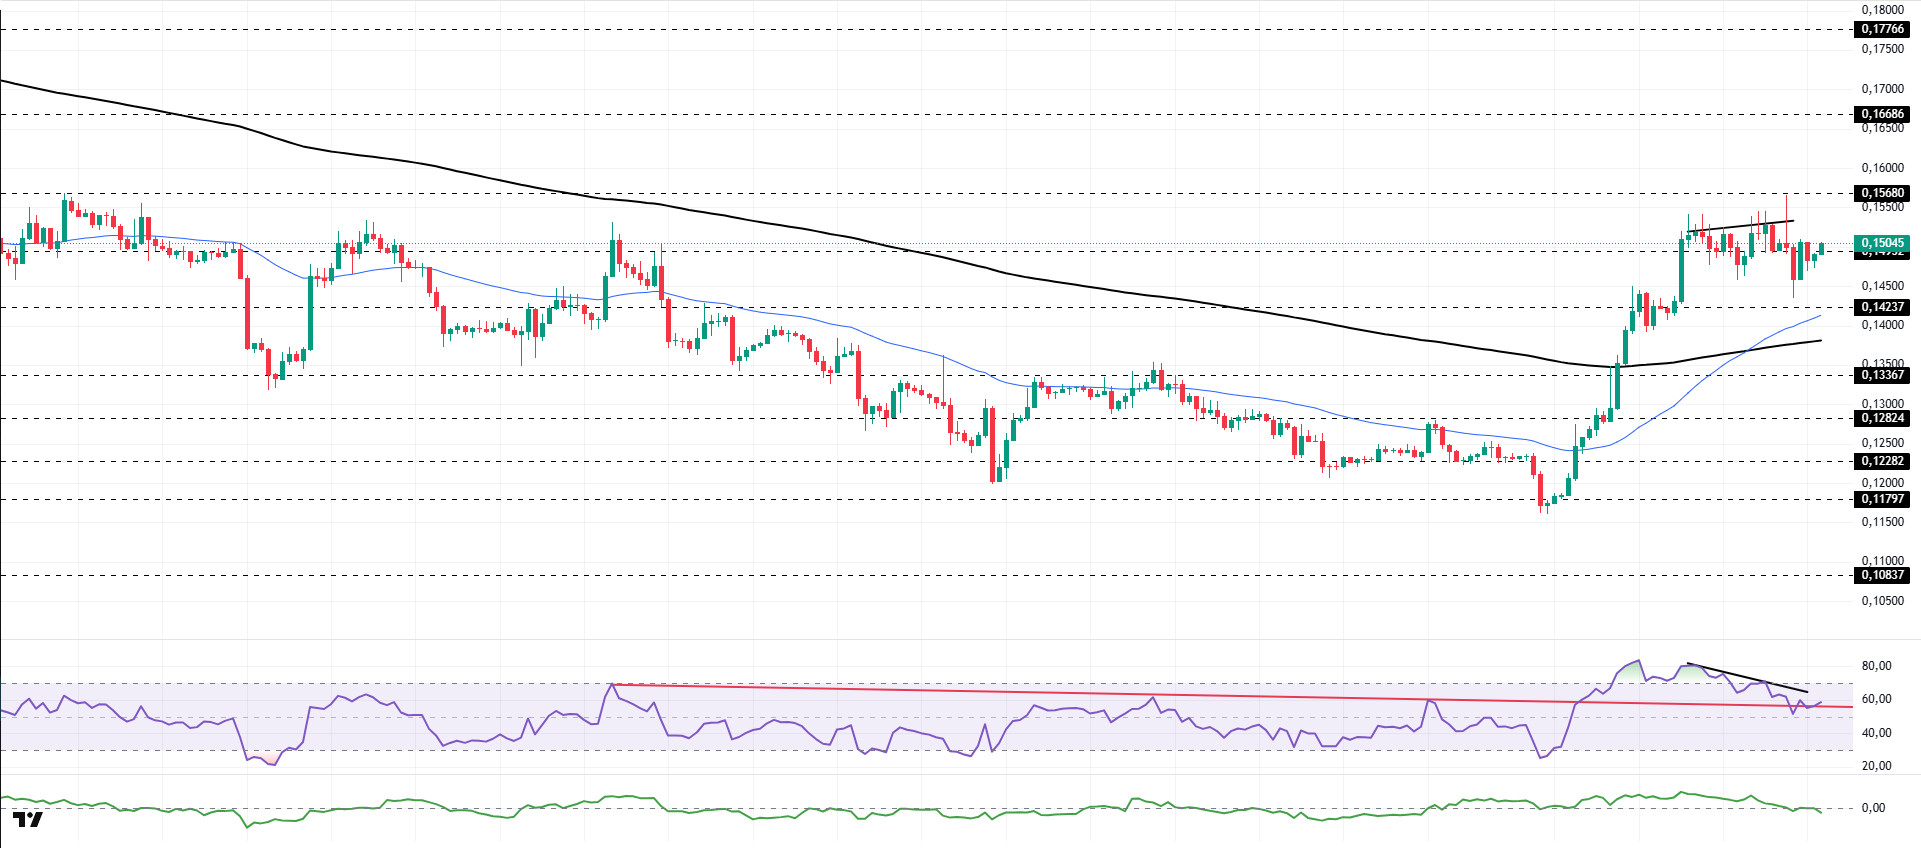
The DOGE price experienced a slight pullback. The asset pulled back after finding support at the $0.15680 level but continued to trade above the strong support level of $0.14237. Currently maintaining a sideways trend, the price may test the $0.14237 level as support in case of a pullback. If the uptrend resumes, it may test the $0.15680 level as resistance.
On the 4-hour chart, the 50 EMA (Exponential Moving Average – Blue Line) remained above the 200 EMA (Black Line). This indicated that an uptrend was forming in the medium term. The price being above both moving averages indicates that the price is trending upward in the short term. The Chaikin Money Flow (CMF-20) has retreated to a neutral level. Additionally, a decrease in money inflows could push the CMF into negative territory. The Relative Strength Index (RSI-14) retreated from the overbought level to the middle of the positive zone. At the same time, it crossed below the downward trend line that began on December 9, signaling that selling pressure could build. On the other hand, the negative divergence remains significant. In the event of an uptrend driven by political developments, macroeconomic data, or positive news flow in the DOGE ecosystem, the $0.16686 level stands out as a strong resistance zone. Conversely, in the event of negative news flow, the $0.13367 level could be triggered. A decline to these levels could increase momentum and initiate a new wave of growth.
Supports: 0.14237 – 0.13367 – 0.12824
Resistances: 0.14952 – 0.15680 – 0.16686
BNB/USDT
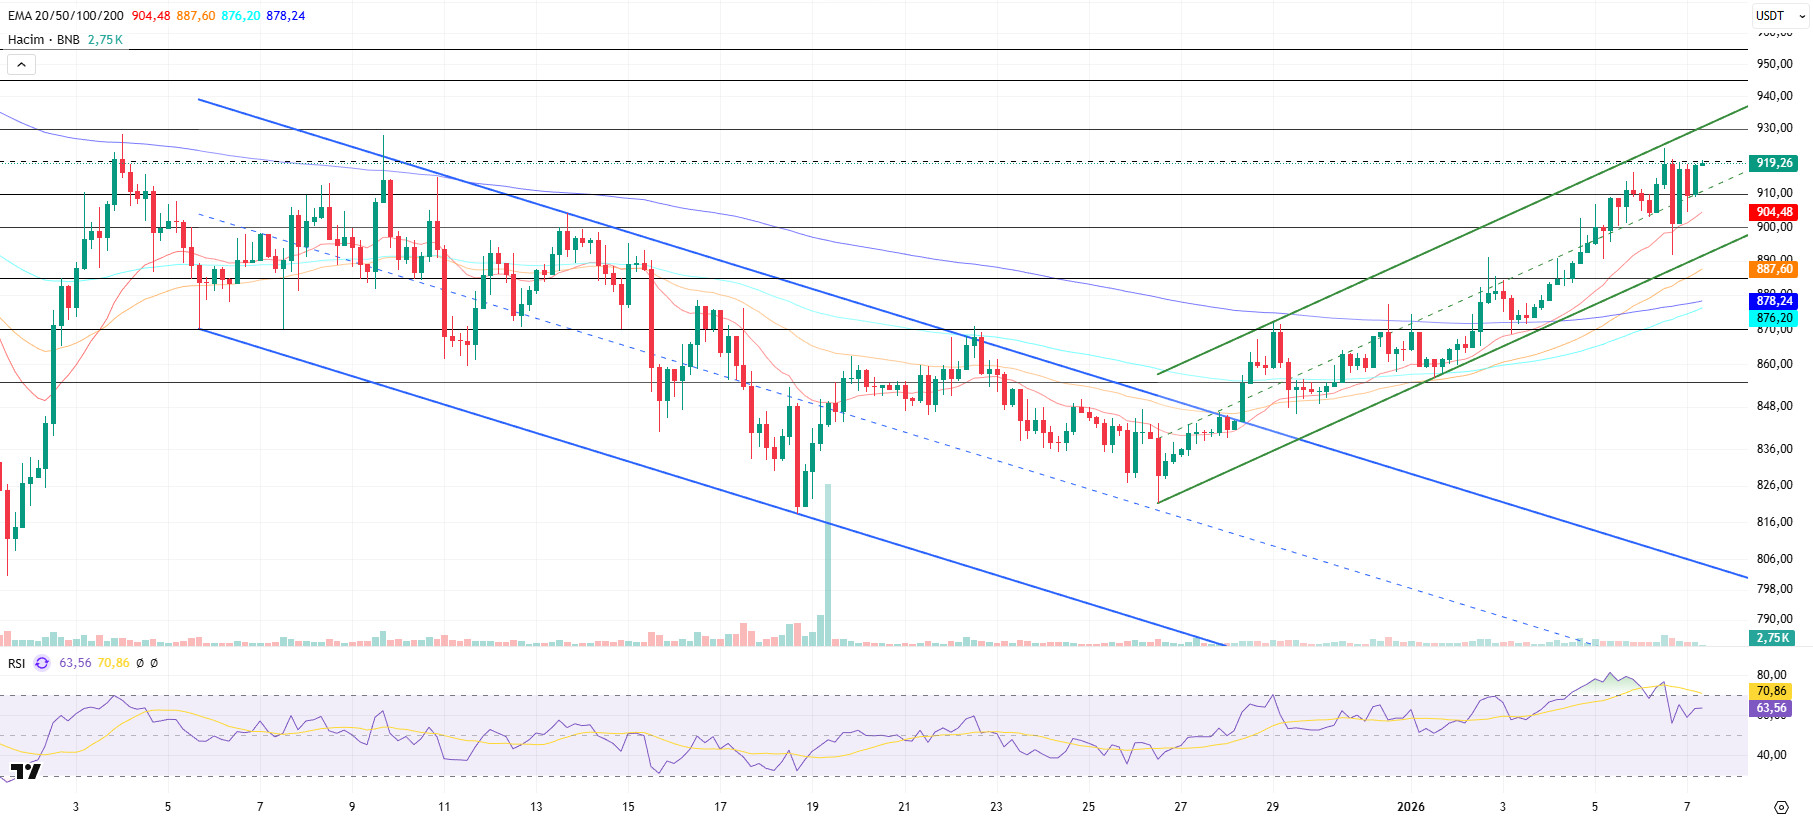
From a technical perspective, BNB/USDT gained positive momentum with the support provided by new candlestick formations at the beginning of last December, rising to the $930 level. However, it was observed that selling pressure intensified in this region due to general market conditions, and as a result of this pressure, it continued its movement within a falling channel formation for some time.
However, BNB, which reversed its direction upward with support from the middle band of the descending channel, strengthened its upward momentum by breaking above the upper band of the channel. In this direction, the asset exceeded its previously set target levels and rose above the $900 level. The asset, which continues to trade above these levels, is observed to maintain its overall positive structure within the current ascending channel.
The text you shared required some grammatical adjustments in terms of interpreting technical indicators and flow. Below, you can find the text in a professional language, free of short sentences and in line with financial analysis standards:
Technical indicators for the asset, currently trading in the $910-$930 range, show that the increasing positive trading volume supports the upward momentum. In addition, the Relative Strength Index (RSI) has risen above the 70 reference level with the recent increases and has undergone the expected technical correction in this region. Following the short-term correction, the RSI has turned upward again as buying appetite in the market continues.
Within the technical outlook, if buying appetite is maintained and market momentum strengthens, BNB is expected to retest the $930 resistance level in the first stage. Breaking above this level could lead to a move above the descending trend line. If the trend breakout is confirmed and the price manages to hold above this level, a rise towards the $945 and $955 levels is technically possible.
On the other hand, if selling pressure increases, the price is expected to retest the support levels of $ , $910, and $ . If this level is broken downward, a pullback towards the support zones of $900 and $885 may come into play.
Supports: 910 – 900 – 885
Resistances: 930 – 945 – 955
Legal Notice
The investment information, comments, and recommendations contained herein do not constitute investment advice. Investment advisory services are provided individually by authorized institutions taking into account the risk and return preferences of individuals. The comments and recommendations contained herein are of a general nature. These recommendations may not be suitable for your financial situation and risk and return preferences. Therefore, making an investment decision based solely on the information contained herein may not produce results in line with your expectations.