Technical Analysis
BTC/USDT
As conflicts escalate in the Middle East, Israeli airstrikes against Iran continue unabated. While it is stated that the operations may last for weeks, it is reported that Iran’s nuclear facilities are among the targets. Along with the harsh statements from Iran, the role of the US in these attacks has also become a subject of debate. While the Iranian government argued that the operation could not take place without US authorization, Trump announced that he supported the attacks and that the time given to Iran had expired. The meeting between Trump and Netanyahu later in the day may also shape the diplomatic dimension of the crisis.
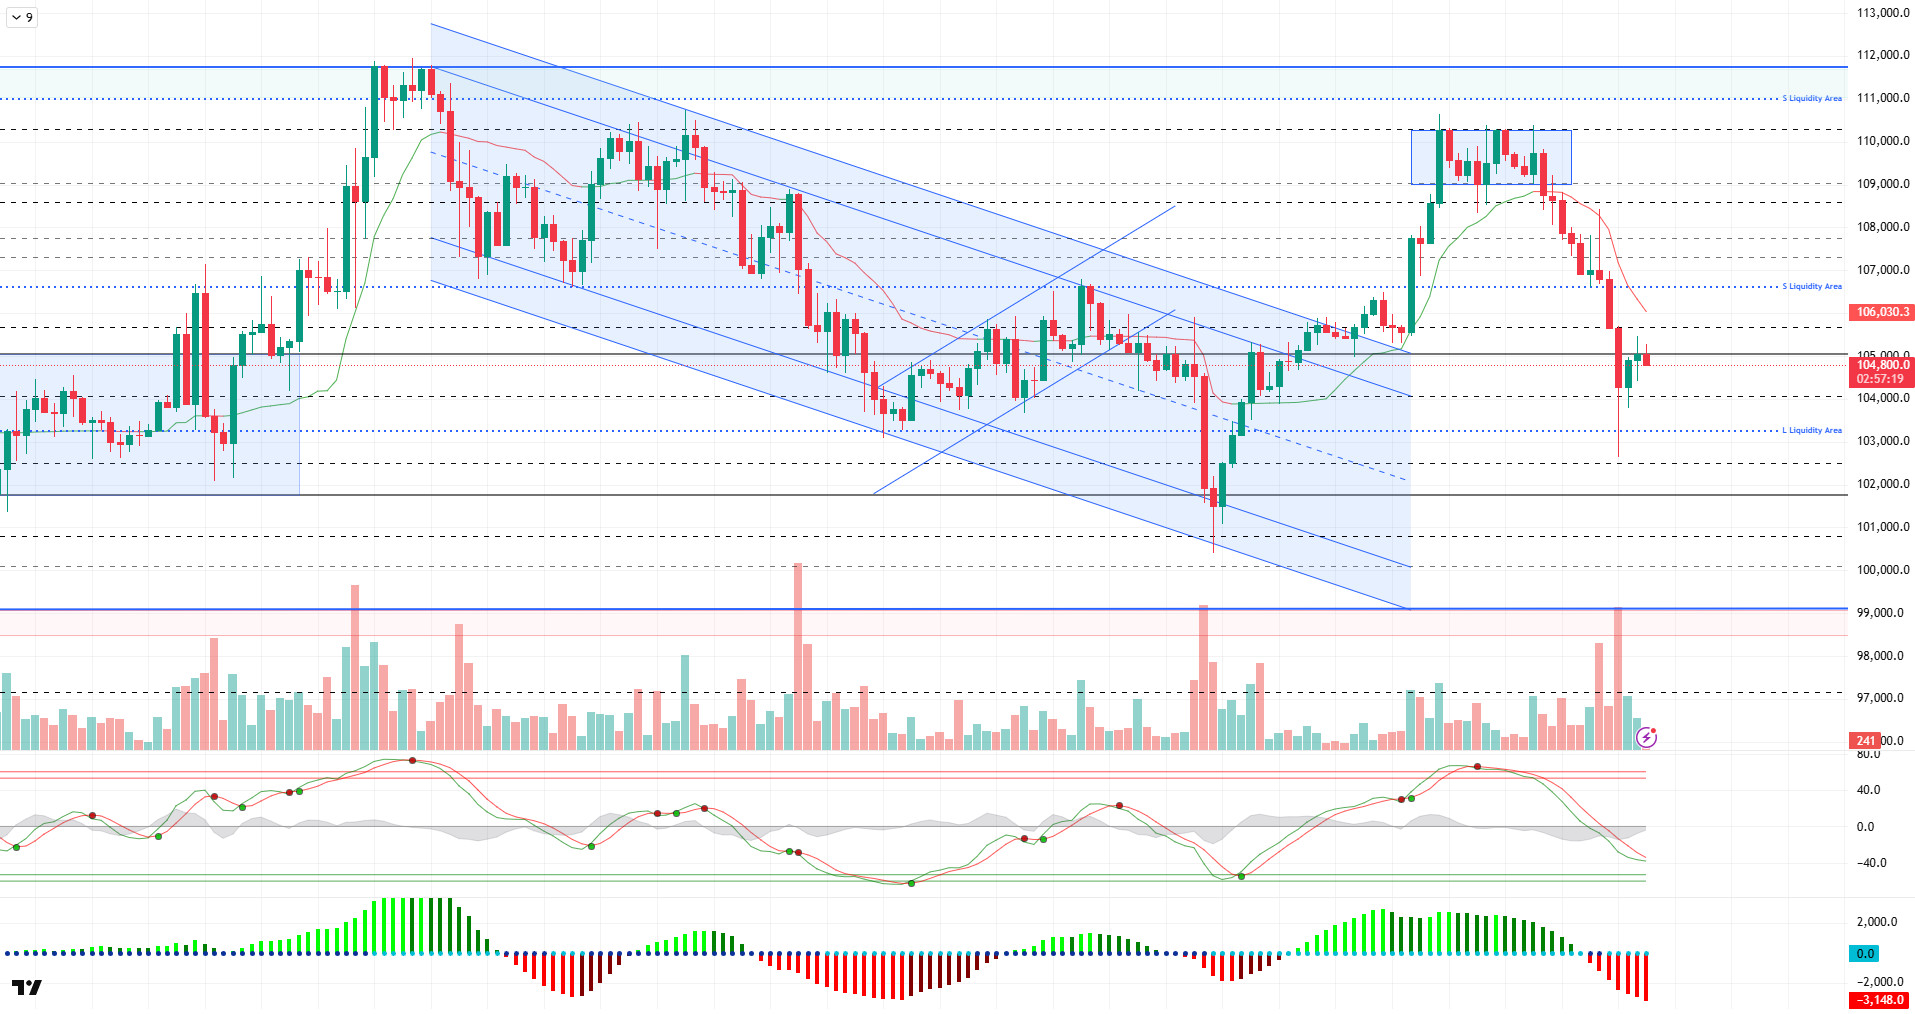
When we look at the technical outlook with the latest developments, it is seen that the BTC price recovered a little more during the day. With the correction following the decline, BTC tested the 105,000 resistance level, but has not yet been able to persist above this level. At the time of writing, the price continues to trade at 104,800 just below the resistance level.
Looking at the technical indicators, the bearish signal on the wave trend oscillator has weakened and the probability of a buy signal for the rest of the day has increased. However, the momentum indicator is still in negative territory, signaling maximum weakness. The Kaufman moving average is positioned just above the price at 106.030, supporting the resistance area.
When the liquidation data is analyzed, it is seen that after the intense liquidation in the last 24 hours, buying transactions have started to reappear. If the price continues its short-term upward trend, it can be expected to test the areas where selling positions are concentrated in the 105,700 – 107,000 band.
As a result, it appears that BTC has left the worst-case scenario behind for now and the current recovery is supported by technical indicators. Hourly closes above 105,000 are critical for the uptrend to turn into a sustainable trend. In this direction, the price’s reactions to liquidity levels will be monitored in its upward movement. On the other hand, if geopolitical developments escalate tensions again, BTC may retreat towards the levels where it has previously shot a needle. In this scenario, the 104,000 level will continue to be followed as the first support.
Supports 104,000 – 103,300 – 102,400
Resistances 105,850 – 106,600 – 107,300
ETH/USDT
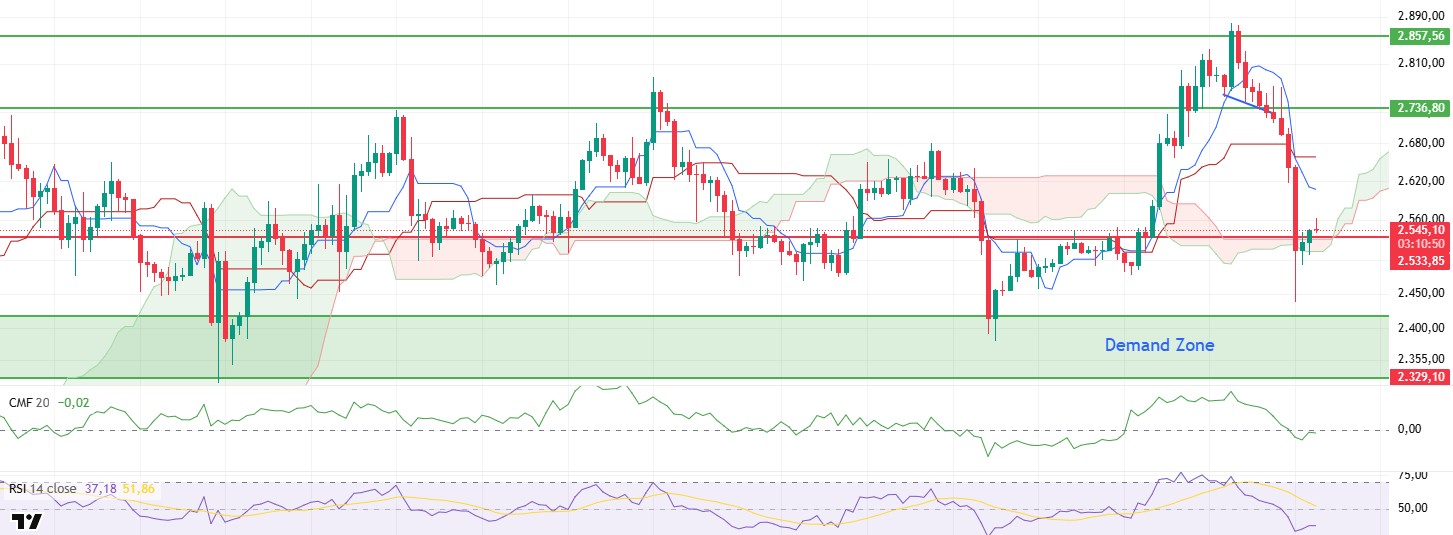
ETH has managed to hold above the kumo cloud, which is an important technical threshold after yesterday’s decline in the evening hours, and is currently priced at $2,546. The fact that the price is holding above the cloud indicates that a negative transformation has not yet occurred in terms of the overall trend. The recovery signals in technical indicators also support this situation.
Cumulative Volume Delta (CVD) data suggest that buying trades have started to dominate in the spot market, which is also confirmed by the Chaikin Money Flow (CMF) indicator. The rise in CMF towards the zero line suggests that liquidity inflows to the market have increased and institutional or large-scale investors may have started to reopen positions. This outlook can be considered as a positive signal, especially in terms of short-term price movements.
When the Ichimoku indicator is analyzed, as mentioned in the morning analysis, the tenkan level is still below the kijun level, indicating that the short-term risks have not disappeared and the market has not yet fully entered an upward trend. However, despite all this, the fact that the price was able to close above the kumo cloud means that a possible downtrend has not been confirmed for now, suggesting that a neutral to slightly positive structure has formed in technical terms.
On the other hand, the fact that the Relative Strength Index (RSI) indicator recovered from the oversold zone and exhibited an upward momentum reveals that the price gained momentum by reacting from the lows. This can be read as another sign that the buying appetite is reviving.
In general terms, with the recovery in technical indicators, the probability of ETH continuing its upward movement in the evening hours has increased. However, the high uncertainty of the current geopolitical environment should not forget that news flows that may cause sudden changes in direction in the market may come into play at any time. In particular, a downward break of the $2,533 support may cause the price to retreat to the area defined as the demand zone and remain under pressure until the reactions from this region. Therefore, it is critical for investors to closely monitor both technical levels and macro and geopolitical developments.
Supports 2,533 – 2,329 – 2,130
Resistances 2,736 – 2,857- 3,062
XRP/USDT
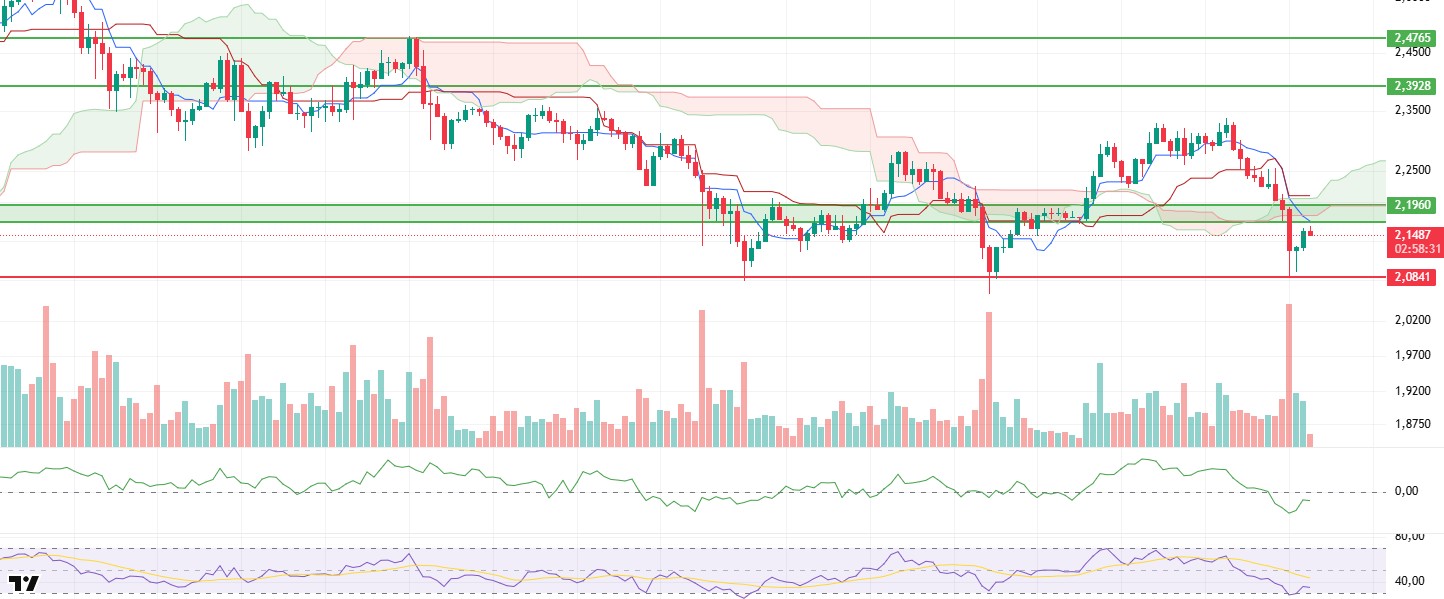
With the selling pressure experienced yesterday, XRP retreated to the previously tested and frequently emphasized level of $2.08. With the reaction purchases from this region, the price managed to recover up to $2.15. In this period of intense geopolitical risks and uncertainties, the fact that the price can hold at this level can be considered as a positive signal in terms of the short-term outlook.
When technical indicators are analyzed, the convergence towards the zero line is noteworthy, especially after the sharp retracement in the Chaikin Money Flow (CMF) indicator. This outlook indicates that the intense liquidity outflows in the market have started to diminish, and the buy side is regaining strength. CMF’s recovery trend can also be interpreted as a reflection that market participants have started to take risks again.
The upward reaction movement of the price from the $2.08 level has also been supported by volume. The fact that the Relative Strength Index (RSI) indicator moved out of the oversold zone and converged towards the MA line also confirms this recovery from a technical perspective. This rise in the RSI suggests that momentum is regaining strength in the market and the buy side is becoming dominant.
However, the Ichimoku indicator indicates that the negative technical structure still persists. In particular, the fact that the price is still pricing below the kumo cloud level suggests that the trend has not yet turned fully positive and bearish risks remain. This means that short-term gains may remain limited and upside moves may require further confirmation.
As a result, the XRP price breaking above the $2.1960 level, the lower band of the kumo cloud in the evening, stands out as a critical technical threshold for the continuation of the rise. If it can be sustained above this level, the potential for the price to head higher in the short term may increase. However, in the current environment of high uncertainty, negative news flows, especially due to geopolitical developments, may cause the price to sag below the main support level of $2.08 again and as a result, it may pave the way for sharp retracements that may lead to deeper corrections.
Supports 2.0841 – 2.0402 – 1.6309
Resistances 2.1960 – 2.3928 – 2.4765
SOL/USDT
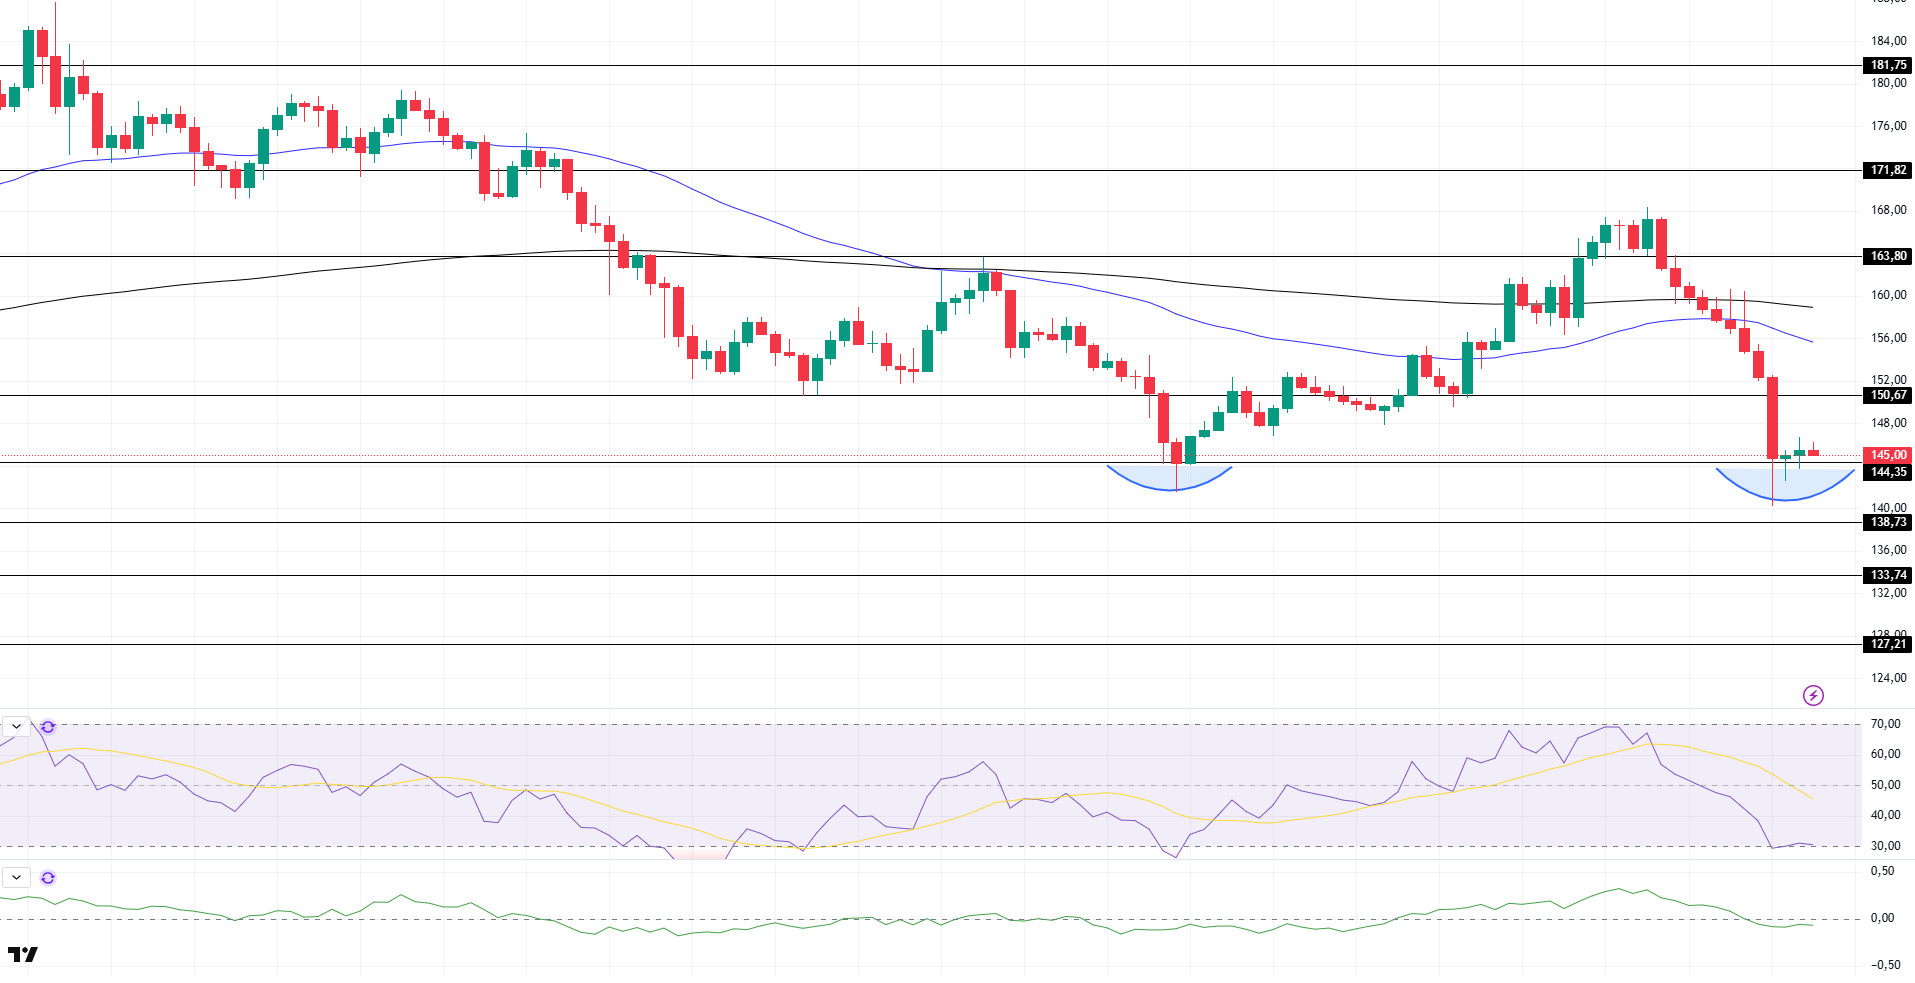
SOL price was slightly bullish during the day. The asset managed to stay above the strong support at $144.35 and accelerated to the upside. However, the double bottom pattern remains valid. This could be a bullish harbinger.
On the 4-hour chart, the 50 EMA continued to be below the 200 EMA. This suggests that the bearish trend may continue in the medium term. At the same time, the fact that the price is below both moving averages suggests that the market is currently bearish in the short term. However, the large difference between the price and the 50 EMA could be a sign of a rebound. Chaikin Money Flow (CMF-20) continued to be in negative territory; in addition, the decline in daily inflows may push CMF deeper into negative territory. Relative Strength Index (RSI-14) remained in oversold territory. This could lead to a rebound. The $150.67 level stands out as a strong resistance point in the event of a rally on the back of macroeconomic data or positive news on the Solana ecosystem. If this level is broken upwards, the rise can be expected to continue. If there are pullbacks due to contrary developments or profit realizations, the $138.73 level may be retested. In case of a decline to these support levels, the increase in buying momentum may offer a potential bullish opportunity.
Supports 144.35 – 138.73 – 133.74
Resistances 150.67 – 163.80 – 171.82
DOGE/USDT
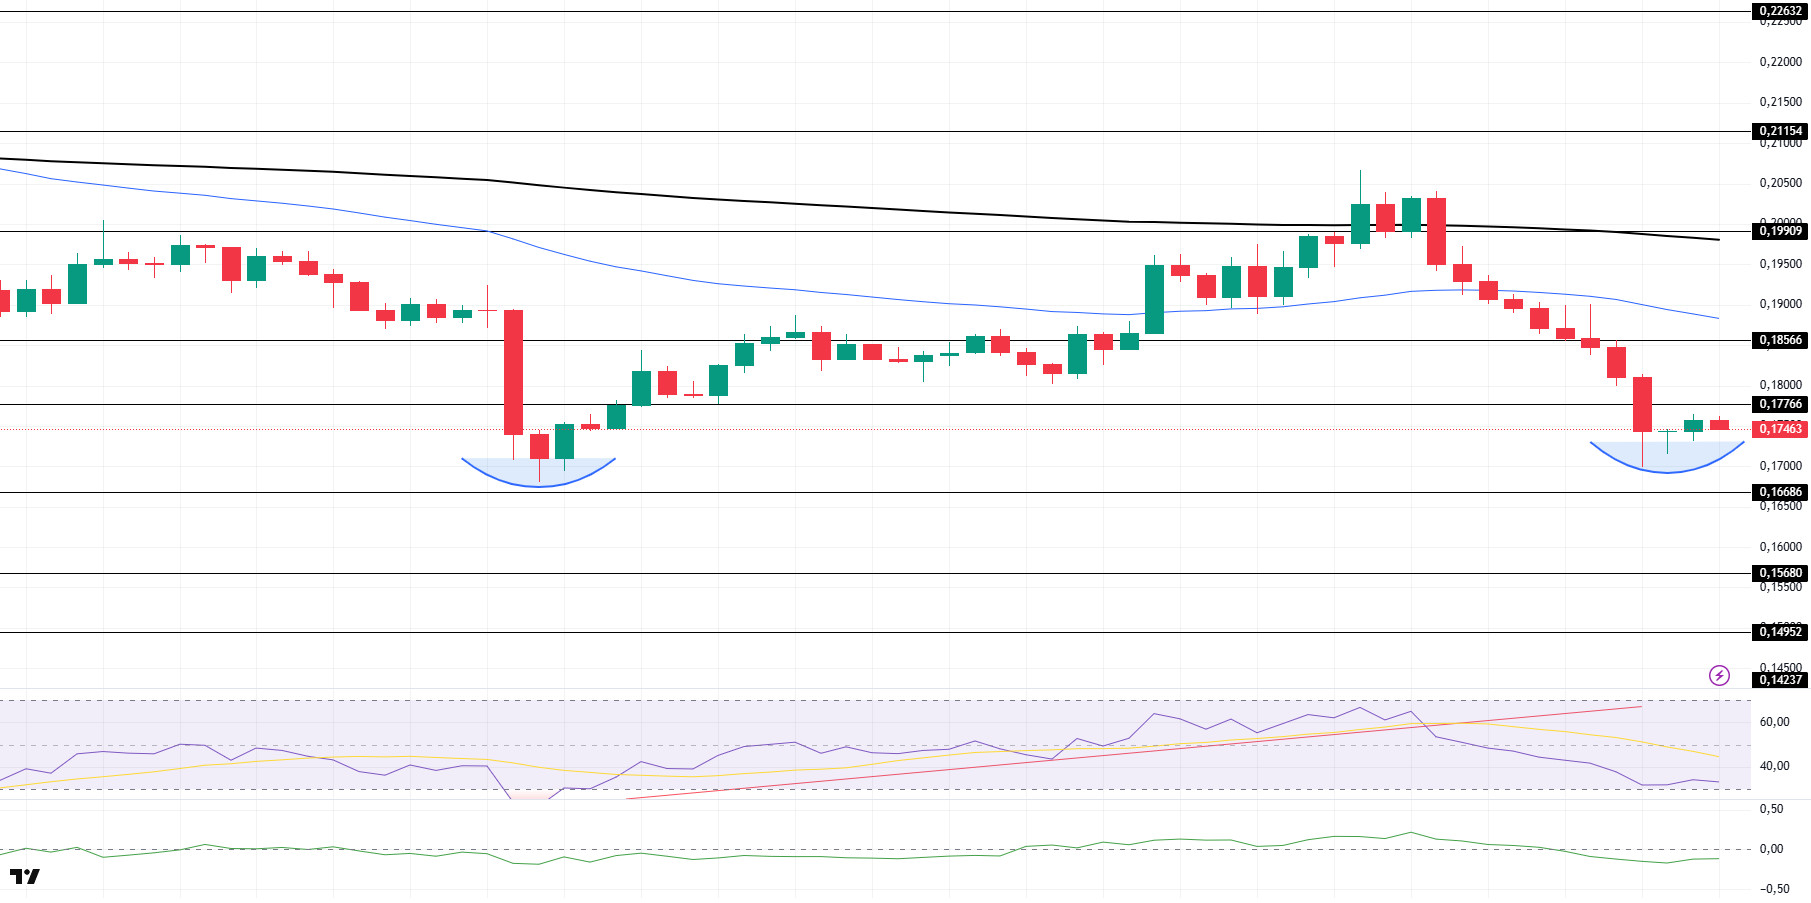
DOGE price was slightly higher during the day. Accelerating towards the strong resistance at $0.17766, the asset may test the 50 EMA (Blue Line) if it breaks there. On the other hand, the double bottom formation remains valid.
On the 4-hour chart, the 50 EMA (Blue Line) continues to be below the 200 EMA (Black Line). This shows us that the asset is bearish in the medium term. The fact that the price is below two moving averages signals that the asset is bearish in the short term. At the same time, the fact that the price is away from the moving averages may cause a rebound. The Chaikin Money Flow (CMF-20) indicator continued to be in the negative territory. In addition, negative inflows could push CMF deeper into the negative territory. Relative Strength Index (RSI-14), on the other hand, remained in the negative territory and slightly rose from the oversold zone. Although this may allow the price to rebound, selling pressure remains. The $0.18566 level stands out as a strong resistance zone in case of a rally in line with political developments, macroeconomic data or positive news flow in the DOGE ecosystem. In the opposite case or possible negative news flow, the $0.16686 level may be triggered. In case of a decline to these levels, the increase in momentum may start a new bullish wave.
Supports 0.16686 – 0.15680 – 0.14952
Resistances 0.17766 – 0.18566 – 0.19909
Legal Notice
The investment information, comments and recommendations contained herein do not constitute investment advice. Investment advisory services are provided individually by authorized institutions taking into account the risk and return preferences of individuals. The comments and recommendations contained herein are of a general nature. These recommendations may not be suitable for your financial situation and risk and return preferences. Therefore, making an investment decision based solely on the information contained herein may not produce results in line with your expectations.


