
BTC/USDT
Ahead of the FOMC minutes, markets largely expect the Fed to keep rates steady at its March meeting, while expectations are growing that gradual rate cuts could begin under the new Fed chair as we head into the summer months. On the Asian front, messages from the Bank of Japan suggest that March may be too early, but a new tightening step could be on the table as of April. On the geopolitical front, Iran has launched military exercises in the Strait of Hormuz, and the second round of talks between the US and Iran will be closely watched.
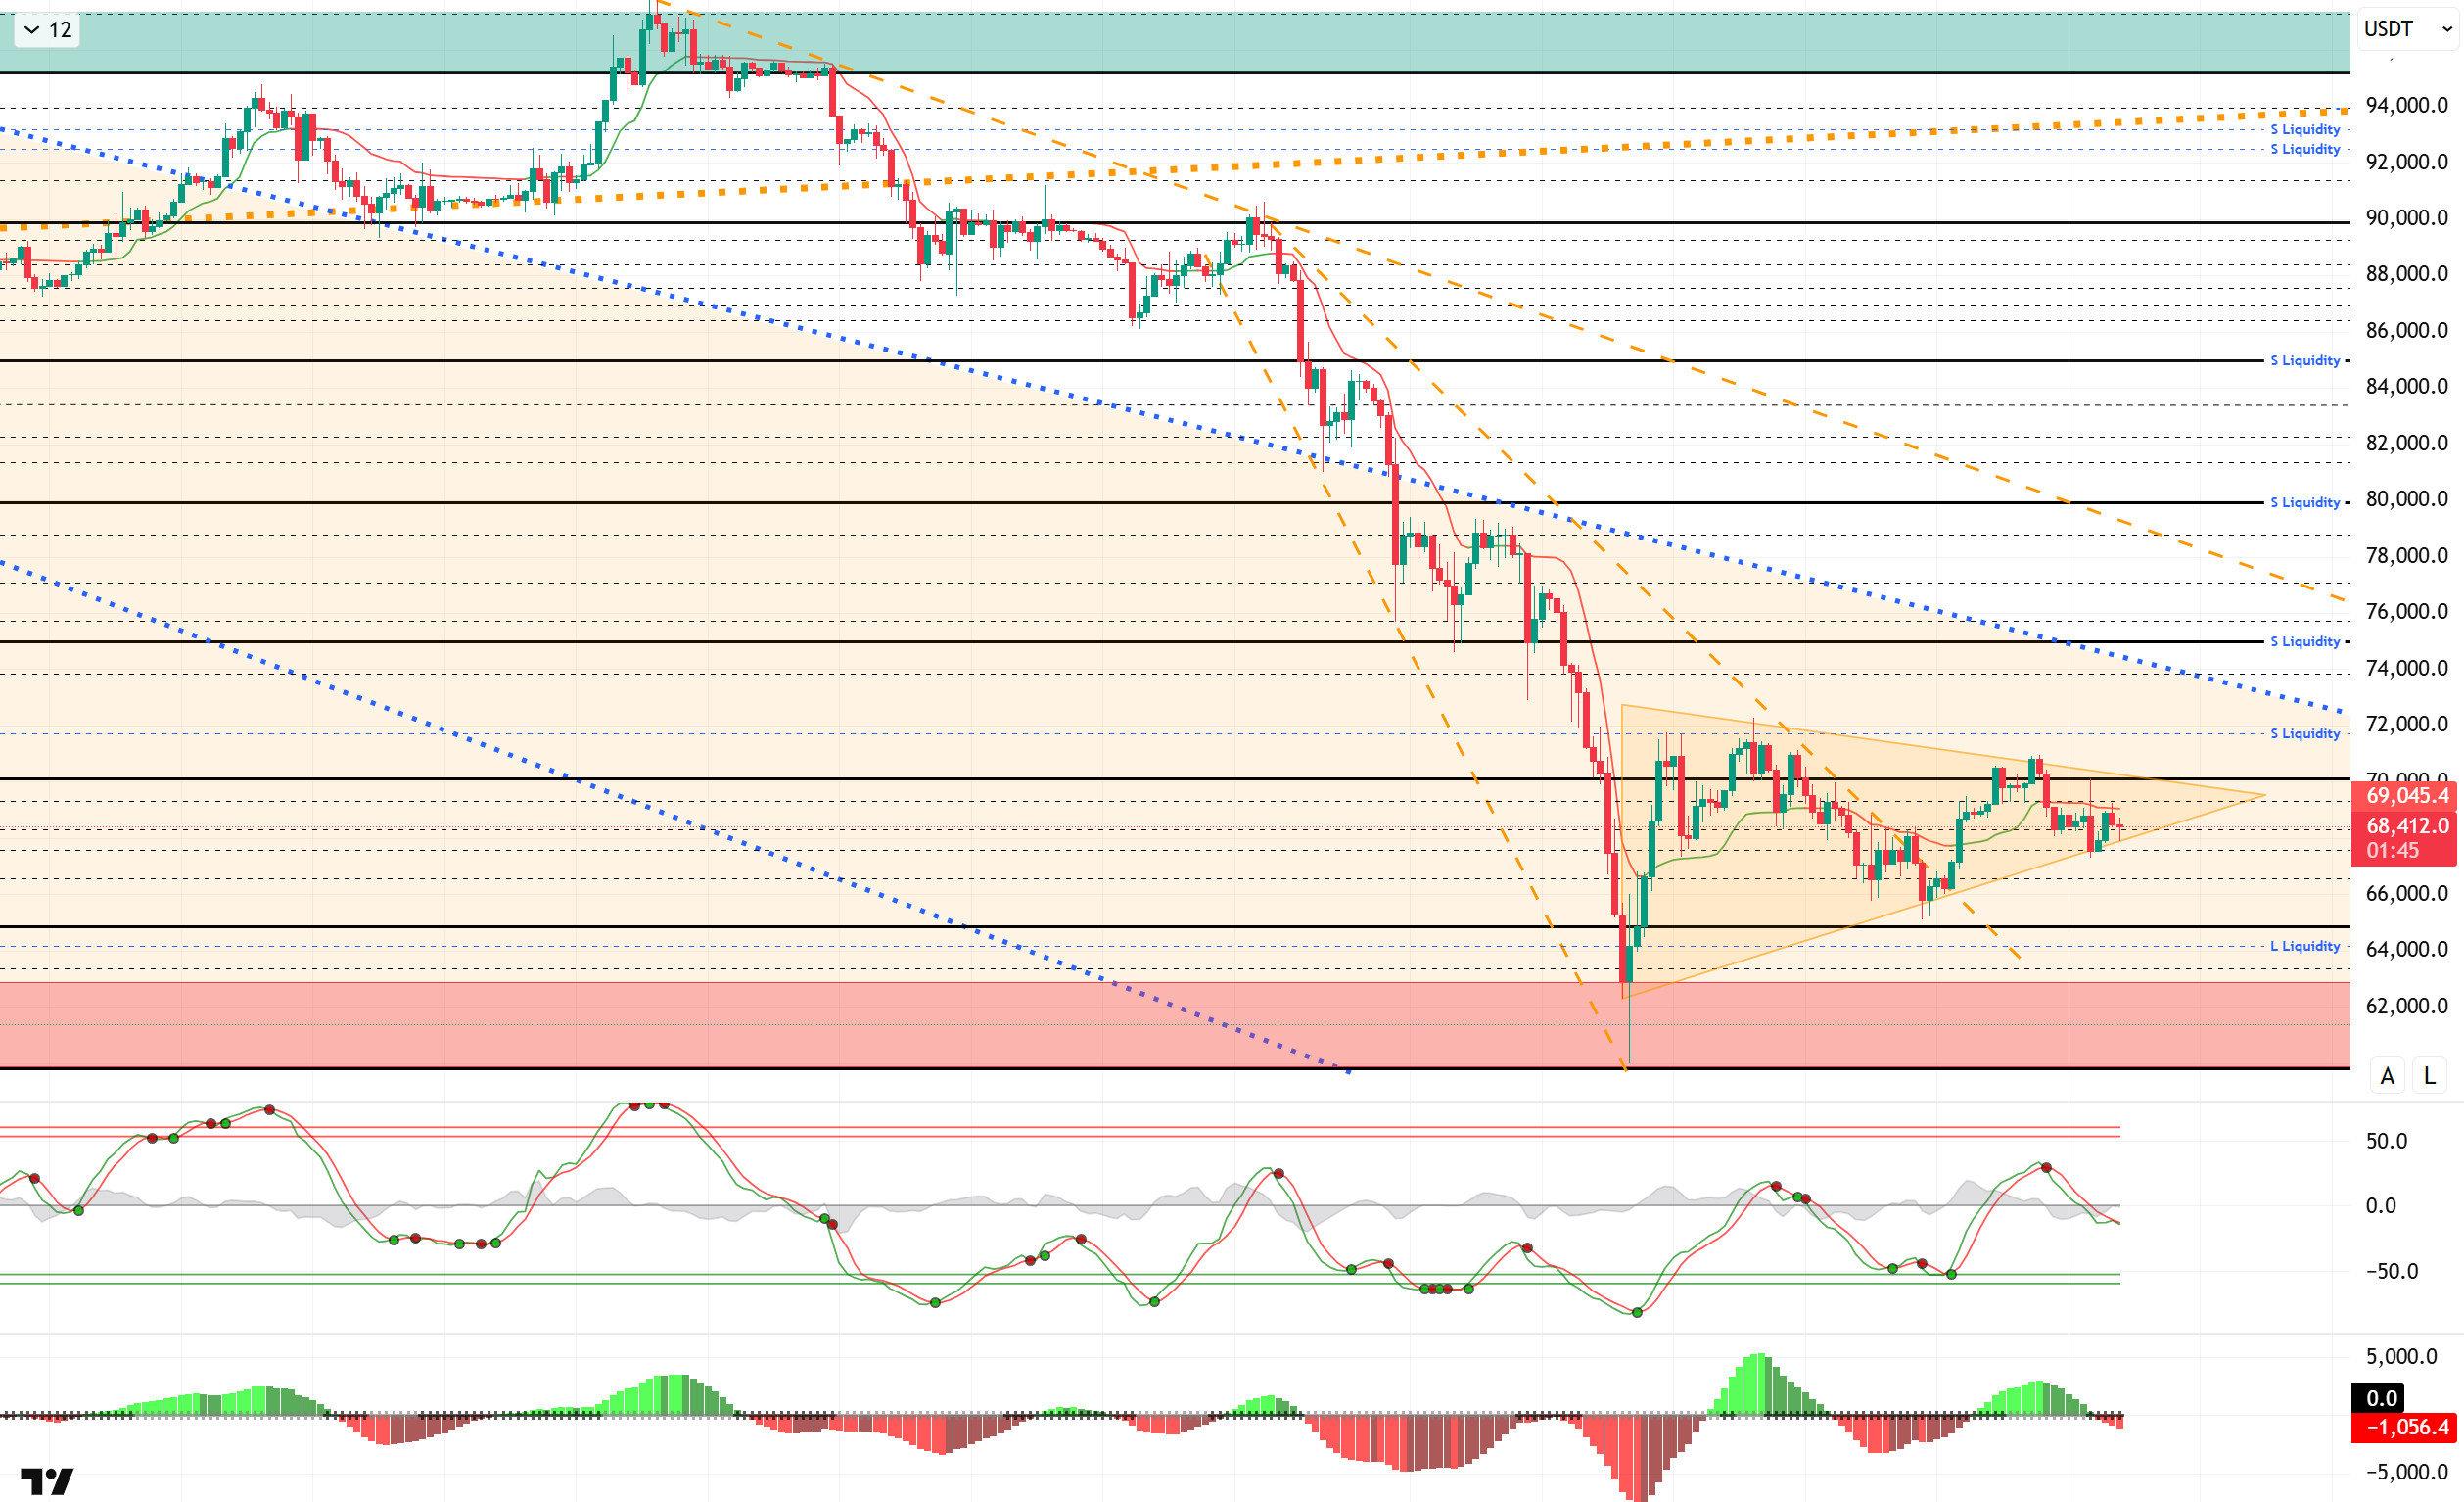
From a technical perspective, BTC continues to move within a symmetrical triangle pattern. In the previous analysis, the price reached the 70,000 level, was rejected from there, and fell below the 68,000 level. The price, which is attempting to recover, continues to search for direction in the short term. In this context, a break above the 70,000 level would be positive, while a break below would bring the 66,500 level into focus as a test area.
Technical indicators show indecisive buy/sell signals on the Wave Trend (WT) oscillator in the middle band of the channel. The histogram on the Squeeze Momentum (SM) indicator has moved back into negative territory. The Kaufman Moving Average (KAMA) is currently trading above the price at $69,048.
When examining liquidation data, the short-term range of 71,000–72,000 stands out on the selling side, while the buying side shows fragmented density within the 65,000–67,000 range.
In summary, on the geopolitical front, the second round of US-Iran nuclear talks will take place in Geneva, and there is talk that Israel may launch an attack on Iran if the negotiations fail. While short-term buying and selling levels are targeted in liquidity data, long-term selling-oriented transactions remain intense.In technical terms, BTC started the new year with strong momentum, tested the 98,000 level, and then encountered heavy selling pressure, retreating to the 60,000 level. Following this movement, all monthly closings after September were negative, and BTC, which historically did not close negatively in January and February, continues its negative performance in February.Looking at the current technical structure, after forming a rising bottom at the 65,000 level, the price tested the 70,000 levels. In the next phase, the breakout in the price within the symmetrical triangle structure will give us an idea about the direction.
Supports: 67,400 – 66,500 – 65,000
Resistances: 68,600 – 70,000 – 71,600
ETH/USDT
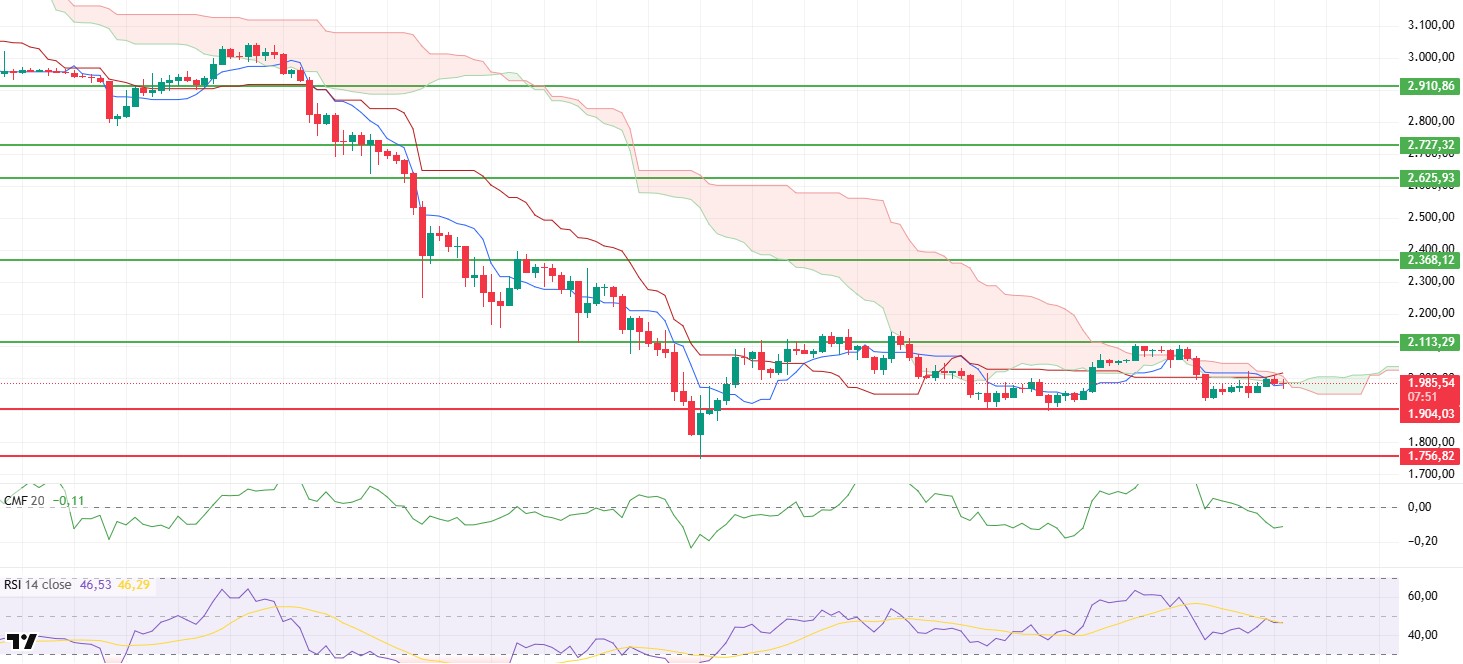
The ETH price managed to rise to $2,022 yesterday with a limited recovery. However, this attack did not find strong liquidity support, and the price fell back again with the incoming sales. ETH, currently trading around $1,980, still shows fragile upward attempts. The price remaining below the critical threshold indicates that the cautious mood in the market persists.
Weakness on the liquidity side has become apparent. The Chaikin Money Flow (CMF) continued its decline, retreating into negative territory. This picture indicates that money outflows from the market have accelerated again and that buying appetite remains weak on the spot side. Without a clear recovery on the liquidity side, it seems difficult for the uptrend to be sustained.
Although the Relative Strength Index (RSI) rose to the MA line, it failed to gain strength above this region and maintained its weak appearance. This structure confirms that buyers have not yet established a decisive advantage in the market. Upward movements are likely to remain limited without a clearer momentum forming on the RSI side.
The picture is mixed on the Ichimoku indicator. While the price regaining the Tenkan level indicates that pressure has eased somewhat in the short term, the price being stuck between Tenkan and Kijun and remaining at the edge of the kumo cloud signals that uncertainty persists. A clear improvement in the main trend has not yet been confirmed.
The $2,000 level remains a critical threshold in the overall outlook. Sustained movement above this area could weaken the negative structure and bring new upward attempts. Conversely, as long as prices remain below $2,000, risks remain elevated. In potential pullbacks, the $1,904 level stands out as short-term support.
Supports: 1,756 – 1,539 – 1,290
Resistances: 2,002 – 2,113 – 2,368
XRP/USDT
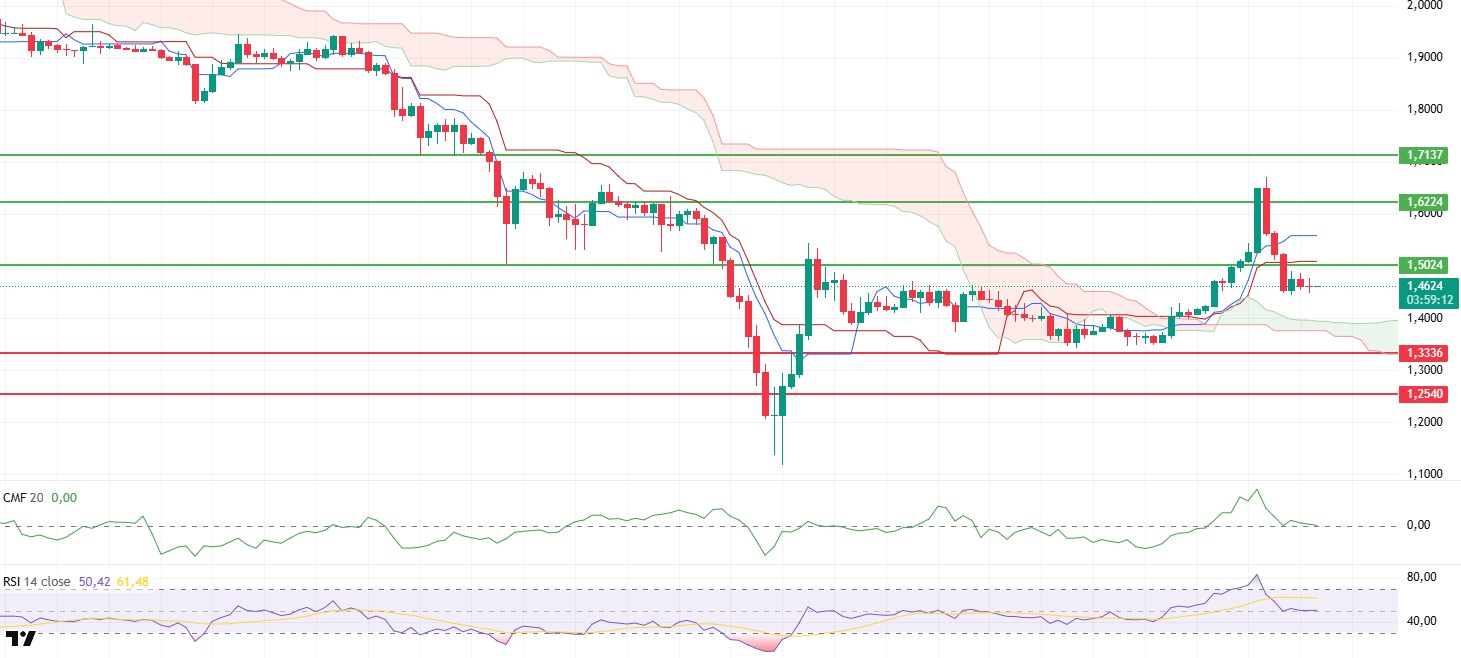
The XRP price attempted to break above the $1.50 level again after the sharp fluctuations over the weekend but failed to maintain its position in this region. With the incoming sales, the price appears to have moved into a sideways trend below the critical resistance level. The current structure indicates that despite attempts by buyers, the cautious stance in the market persists and the upward movement has yet to gain momentum.
Weakness on the liquidity side has become more pronounced. The Chaikin Money Flow (CMF) continues to decline in negative territory, signaling continued outflows from the market. This outlook reveals that buying appetite remains limited on the spot side and that upward attempts have failed to find strong capital support.
The momentum picture remains neutral to weak. The Relative Strength Index (RSI) is moving sideways around the 50 level. This structure indicates that no clear direction has emerged in the market and that buyers have not yet gained a clear upper hand. It is difficult to speak of a strong uptrend without a clear upward momentum on the RSI side.
Although the price managed to stay above the cloud, the Tenkan line cutting below the Kijun line produces a short-term sell signal. This crossover indicates that the current sideways trend carries the risk of a downward breakout.
The $1.50 level continues to be decisive in the overall picture. If this level cannot be broken, selling pressure is likely to increase and a downward movement may begin. Conversely, a strong break above $1.50 could disrupt the current weak structure and allow upward attempts to regain momentum. On the downside, the $1.33 level remains a key support.
Supports: 1.3336– 1.2540 – 1.0694
Resistances: 1.5024 – 1.6224 – 1.7137
SOL/USDT
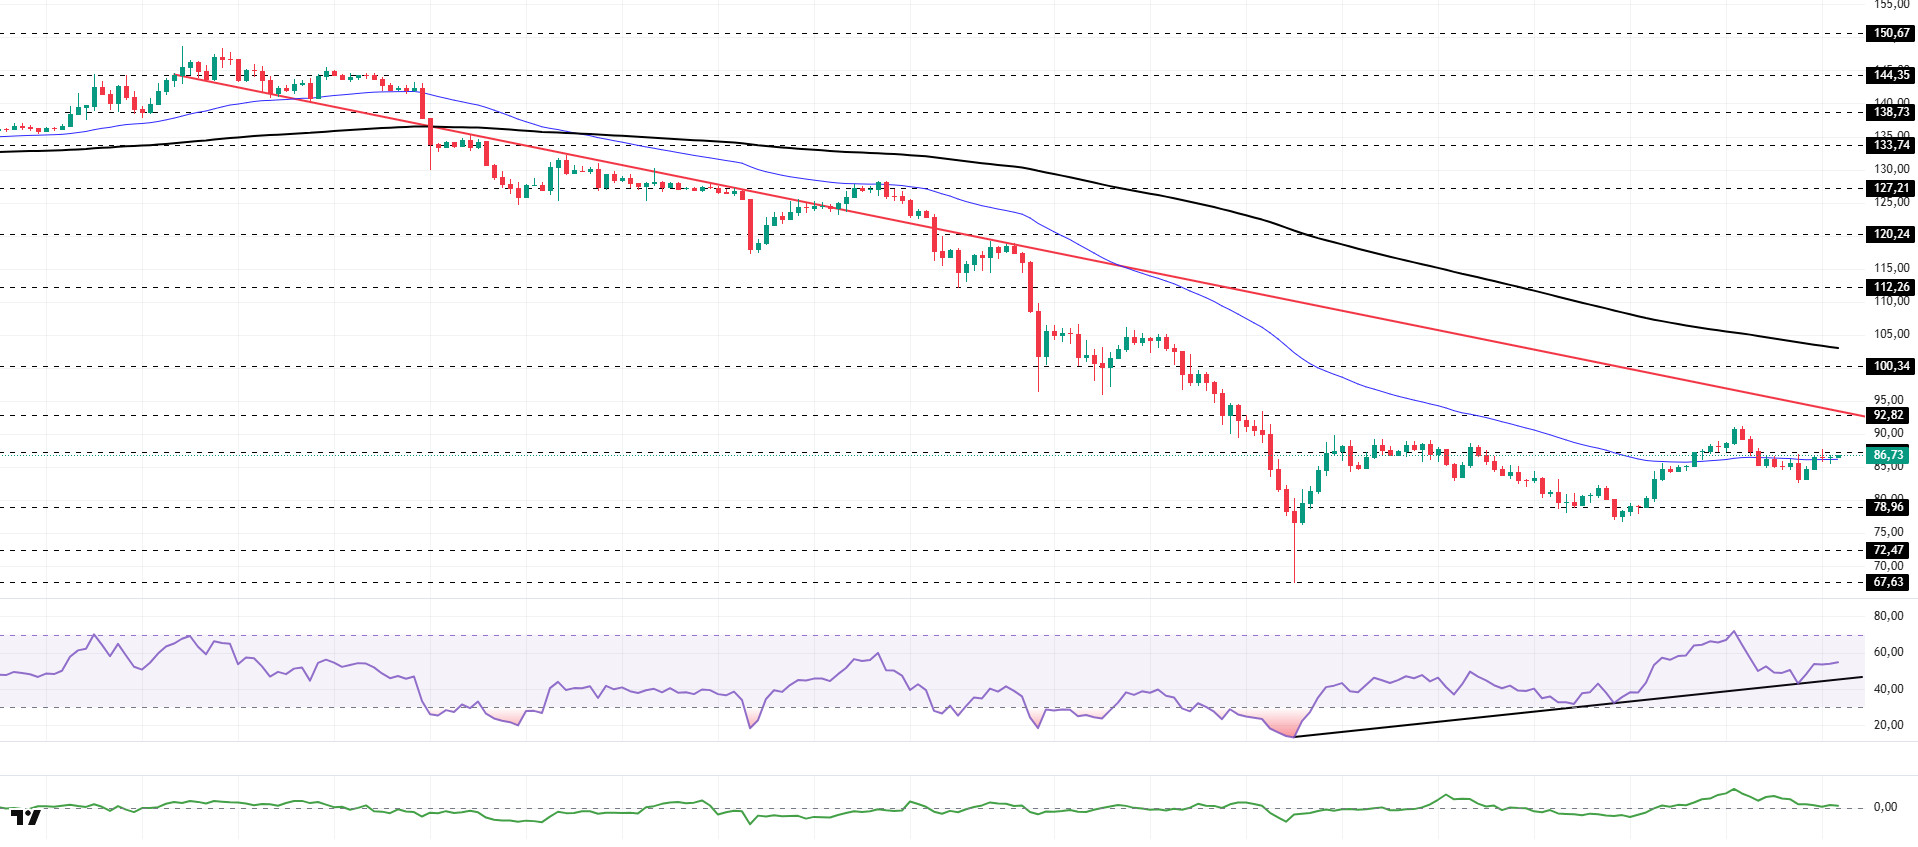
The SOL price continued its horizontal trend. The asset remained in the lower region of the downward trend that began on January 13, indicating that selling pressure persisted. The price, which is currently testing the 50 EMA (Blue Line) moving average as support, a strong support level, could test the $78.96 level as support if it closes below this level. If it experiences an uptrend, it could test the downward trend as resistance.
On the 4-hour chart, the 50 EMA (Exponential Moving Average – Blue Line) continues to remain below the 200 EMA (Black Line). This indicates that the downtrend is continuing in the medium term. At the same time, the asset trading between the two moving averages shows that it is in a decision phase in the short term. The Chaikin Money Flow (CMF-20) remained in positive territory. However, the increase in cash inflows may keep the CMF in positive territory. The Relative Strength Index (RSI-14) rose from neutral levels to the middle of positive territory. It also tested the rising trend that began on February 6 as support and experienced an uptrend. This signaled that buying pressure continued. If an uptrend occurs due to macroeconomic data or positive news related to the Solana ecosystem, the $100.34 level stands out as a strong resistance point. If this level is broken upwards, the uptrend is expected to continue. In the event of pullbacks due to adverse developments or profit-taking, it may test the $67.63 level. A decline to these support levels could increase buying momentum, presenting a potential upside opportunity.
Supports: 78.96 – 72.47 – 67.63
Resistances: 87.23 – 92.82 – 100.34
DOGE/USDT
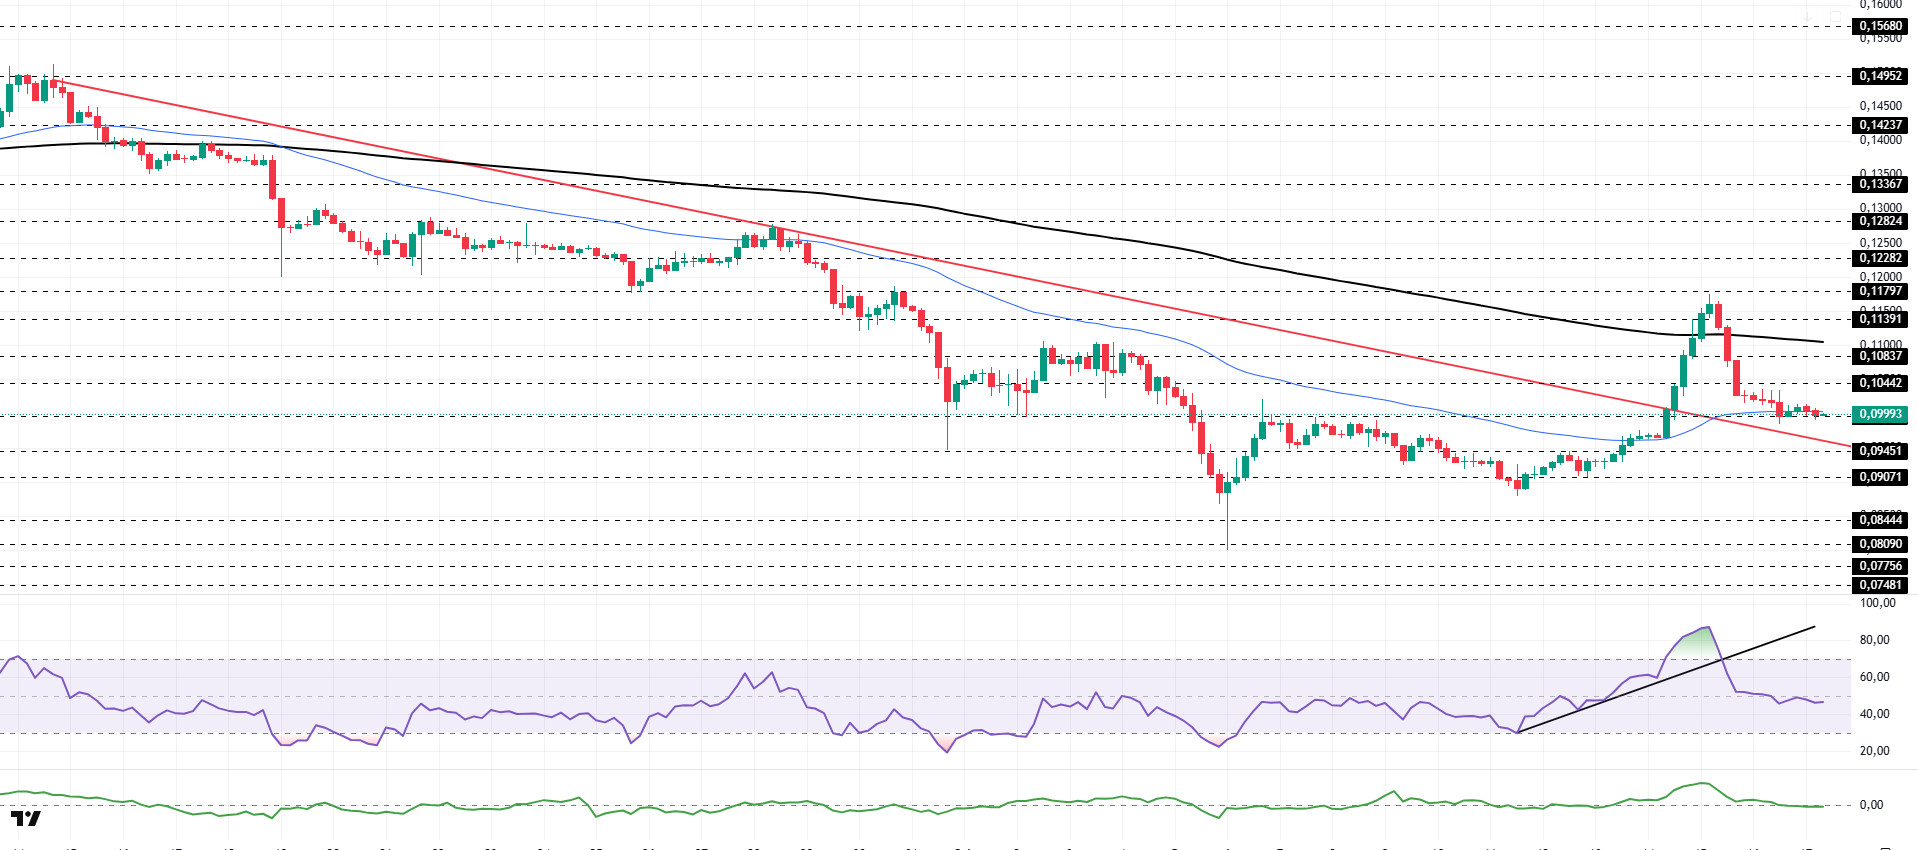
The DOGE price traded sideways. The asset remained in the upper region of the downtrend that began on January 14 and managed to hold there. The price, which experienced a pullback from the strong resistance level of $0.11797, deepened its decline by breaking below the 200 EMA (Black Line) moving average. Currently testing the 50 EMA (Blue Line) moving average as support, the asset may test the downward trend as support if it closes below the 50 EMA moving average. If it rises from here, the 200 EMA moving average may act as resistance.
On the 4-hour chart, the 50 EMA (Exponential Moving Average – Blue Line) remained below the 200 EMA (Black Line). This indicated a downtrend forming in the medium term. The price being below both moving averages suggests a downward trend in the short term. The Chaikin Money Flow (CMF-20) is at a neutral level. Additionally, the balance between inflows and outflows of money may keep the CMF at a neutral level. The Relative Strength Index (RSI-14) fell from a neutral level to a negative level. At the same time, it remained below the upward trend that began on February 11, indicating that selling pressure may occur. In the event of an uptrend driven by political developments, macroeconomic data, or positive news flow in the DOGE ecosystem, the $0.11797 level stands out as a strong resistance zone. Conversely, in the event of negative news flow, the $0.08090 level could be triggered. A decline to these levels could increase momentum and initiate a new wave of growth.
Supports: 0.09962 – 0.09451 – 0.09071
Resistances: 0.10442 – 0.10837 – 0.11391
SUI/USDT
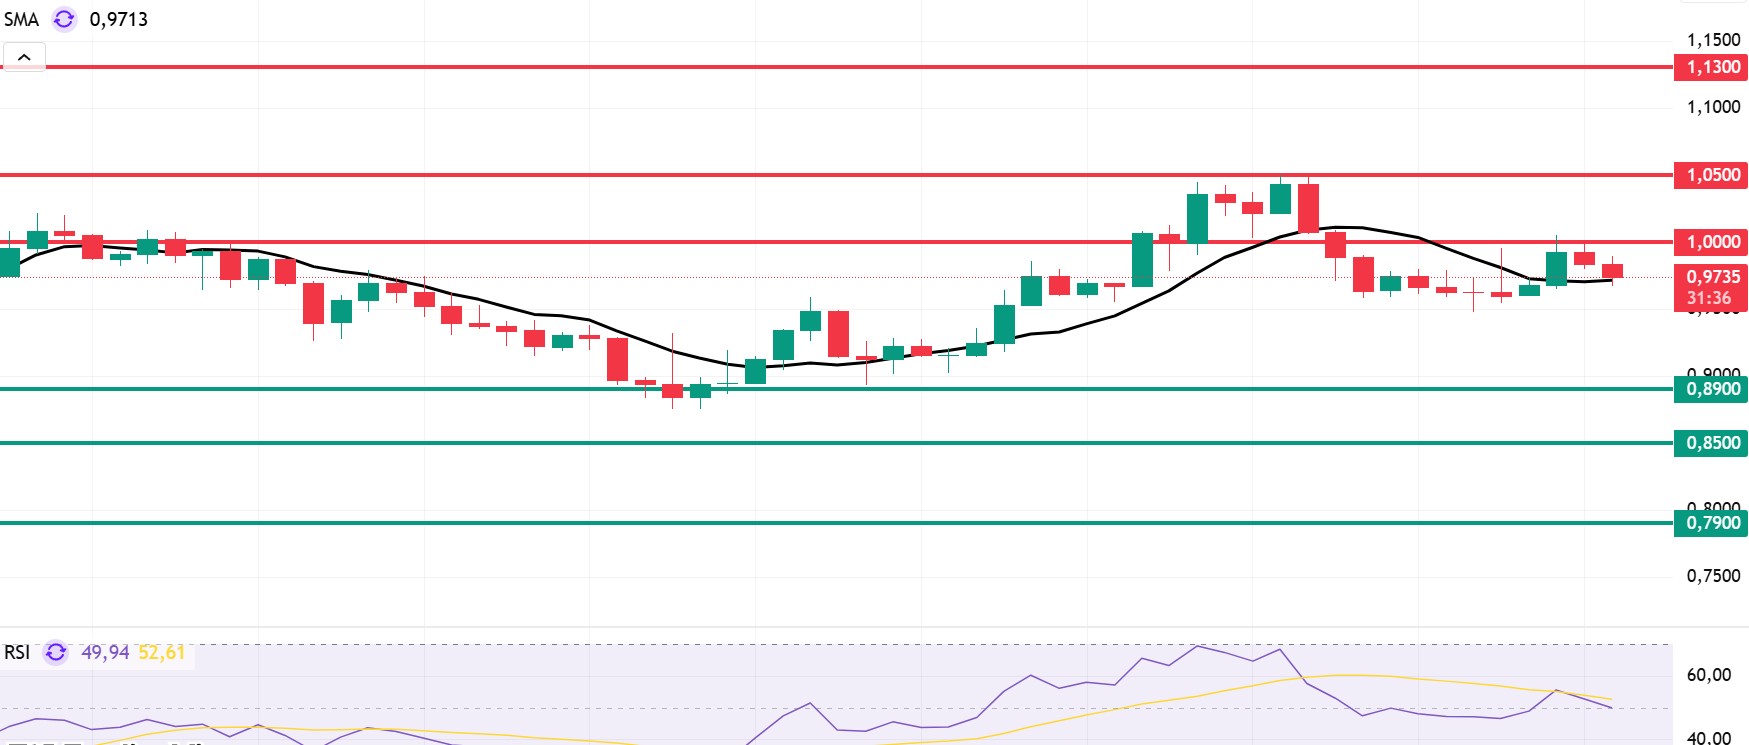
Looking at Sui’s technical outlook, we see that the price has fallen over the past 4 hours and is now moving sideways at around $0.97, influenced by fundamental developments. The Relative Strength Index (RSI) is currently in the range of 49.94 – 52.61. This range indicates that the market is trading at a point suitable for buying; however, if the RSI weakens and falls to the 35.00 – 40.00 range, it could signal a potential buying point. If the price moves upward, the resistance levels of $1.00, $1.05, and $1.13 can be monitored. However, if the price falls to new lows, it could indicate that selling pressure is intensifying. In this case, the $0.89 and $0.85 levels stand out as strong support zones. Based on the trend line, a pullback to $0.79 appears technically possible. According to Simple Moving Averages (SMA) data, Sui’s average price is currently at $0.97. If the price remains below this level, it could signal that the current upward trend may not continue technically. The downward trend of the SMA also supports this scenario.
Supports: 0.79 – 0.85 – 0.89
Resistances: 1.00 – 1.05 – 1.13
Legal Notice
The investment information, comments, and recommendations contained herein do not constitute investment advice. Investment advisory services are provided individually by authorized institutions taking into account the risk and return preferences of individuals. The comments and recommendations contained herein are of a general nature. These recommendations may not be suitable for your financial situation and risk and return preferences. Therefore, making an investment decision based solely on the information contained herein may not produce results in line with your expectations.
