
BTC/USDT
The US administration’s stance of not backing down on tariffs is dampening risk appetite. Trump’s positioning of global customs duties as a permanent revenue model and his continuation of the process with new legal grounds despite the Supreme Court ruling has increased expectations that trade wars could deepen. Cautious messages from the Fed weaken the possibility of an interest rate cut in the near term, while the US-Iran talks in Geneva signal that the diplomatic channel will remain open.
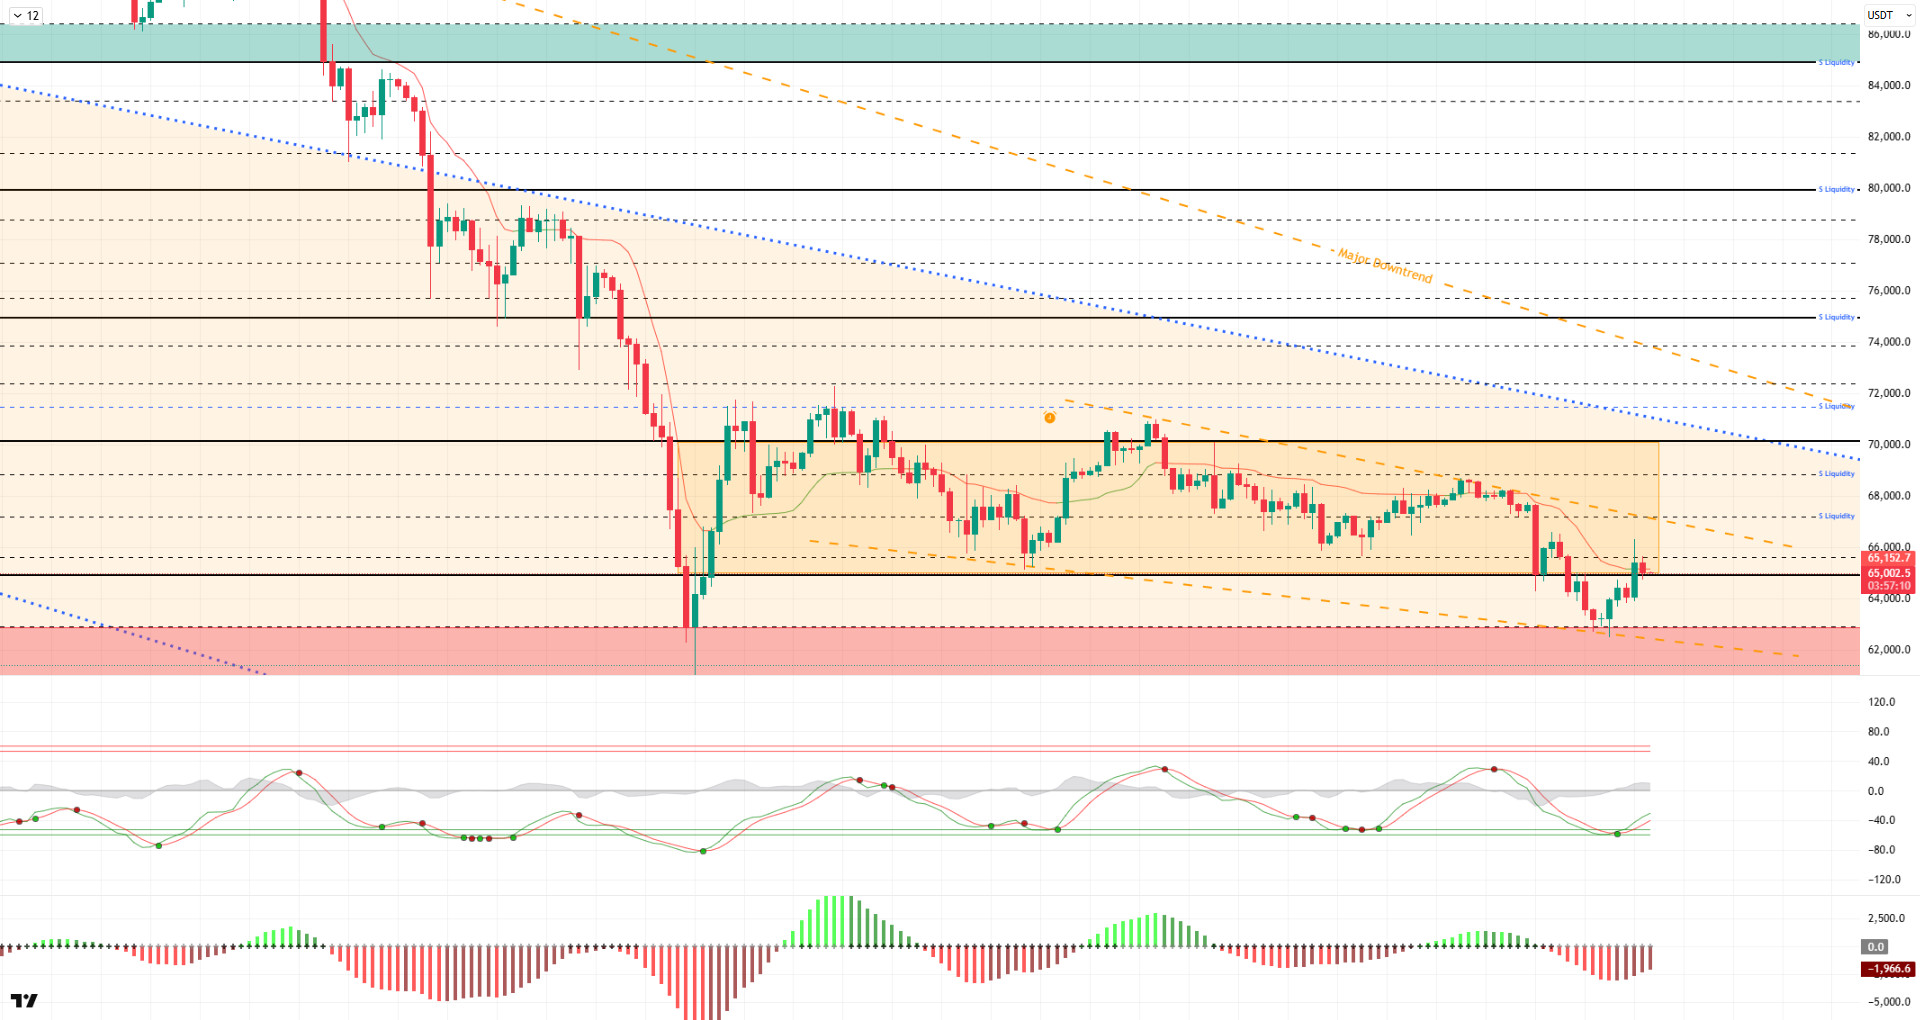
Technically speaking, after a sharp decline, BTC formed a horizontal structure and then fell below the 63,000 level, giving way to a downward channel. Rebounding from this point, the price rose above the 65,000 level again and tested the 66,300 level. Unable to hold this level, the price fell back to the critical 65,000 level. If this level is not lost, we will follow the 67,000 level, where the minor descending trend line passes.
Technical indicators confirm the uptrend with the Wave Trend (WT) oscillator giving a buy signal in the oversold zone. The histogram on the Squeeze Momentum (SM) indicator is trying to gain momentum within the negative zone. The Kaufman Moving Average (KAMA) is currently trading above the price at the $65,152 level.
When examining liquidation data, the short-term buy level recorded fragmented density at the 62,300 level again after the last decline. The sell level, on the other hand, has become a liquidity zone, recording density at the 66,700 level in the short term.
In summary, while tariff tensions in the US continue to weigh on the markets, Trump appears unwilling to back down on this issue. While the Fed continues to send cautious messages on interest rates, all eyes will be on tomorrow’s US-Iran negotiations.Technically, BTC started the new year with strong momentum, tested the 98,000 level, and then faced heavy selling pressure, retreating to the 60,000 level. Following this move, all monthly closes since September have been negative. Historically, BTC has not had consecutive negative closes in January and February, but it continues its negative performance in February.Looking at the current technical structure, it appears to have formed a lower low by losing the 65,000 level. In the next phase, closes above the 65,000 level will be monitored for renewed upward movements, and if lost, selling pressure may continue.
Supports: 64,000 – 62,800 – 61,400
Resistances: 65,000 – 65,800 – 67,000
ETH/USDT
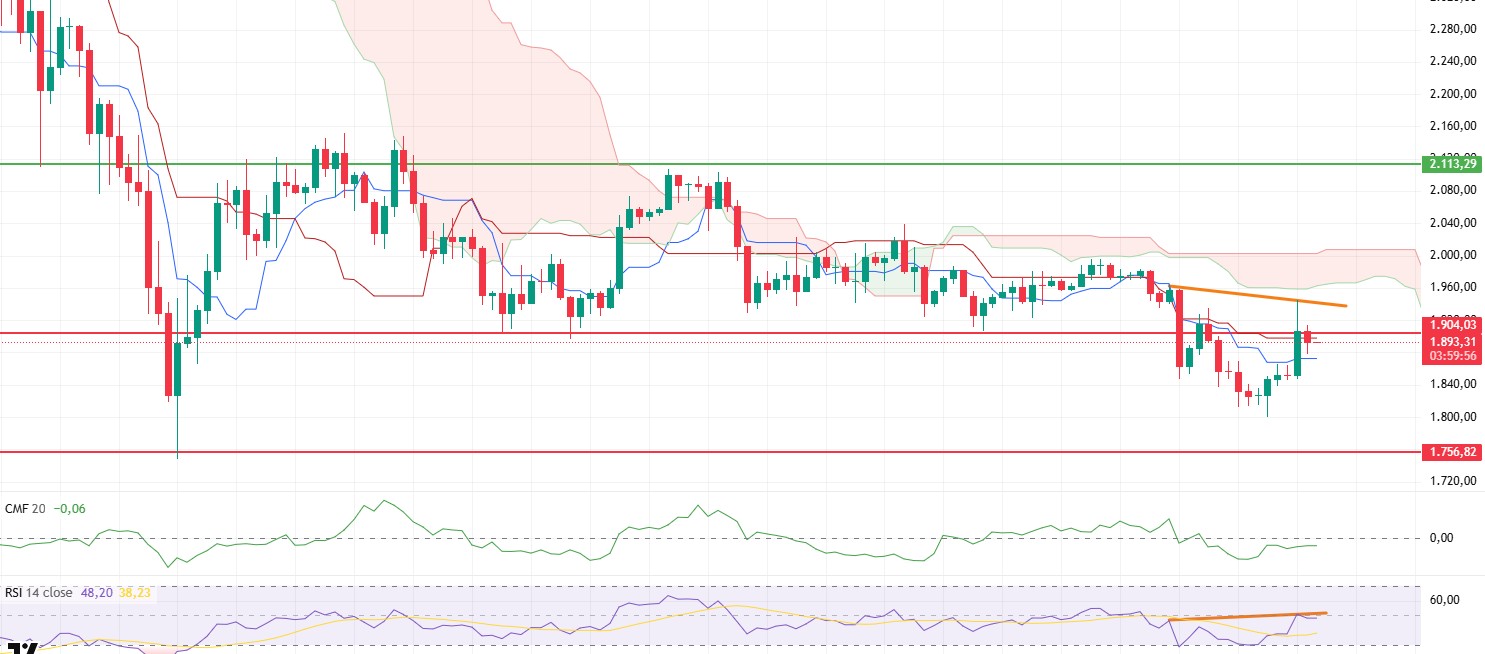
The ETH price fell to the $1,800 level yesterday evening due to weakness in technical indicators. With buying from this area, the $1,904 threshold was regained in the morning, but the price struggled to hold at this level and is stabilizing around $1,890. The current pricing indicates that seller pressure has not completely disappeared, but buyers are starting to re-enter at the bottom levels.
There are limited signs of recovery on the liquidity side. Although the Chaikin Money Flow (CMF) remains in negative territory, it has lost its downward momentum and formed a slight upward slope. This structure indicates that the outflow of money from the market has slowed down. However, it is difficult to speak of a strong and sustained recovery until the CMF moves into positive territory.
The Relative Strength Index (RSI) rose sharply, managing to exceed both the base MA level and the 50 threshold. This development indicates that momentum has entered a recovery phase in the short term and that buyers are beginning to gain strength. However, the negative divergence structure in the RSI indicator has created a signal for a decline or correction.
The Ichimoku indicator is signaling an improvement in the short-term outlook. The price rising above the Tenkan and Kijun levels indicates that technical pressure has eased. Nevertheless, the kumo cloud has not yet been broken. Therefore, a cautious stance persists regarding the main trend, and it cannot be said that the structure has completely turned positive.
In the overall assessment, the $1.904 level remains a critical threshold. If this region is broken through with volume and sustained above, upward movements are expected to gain strength. Conversely, if the price continues to remain below this level, selling pressure is likely to increase again, and downside risks are likely to remain.
Supports: 1,756 – 1,539 – 1,290
Resistances: 1,904 – 2,113 – 2,368
XRP/USDT
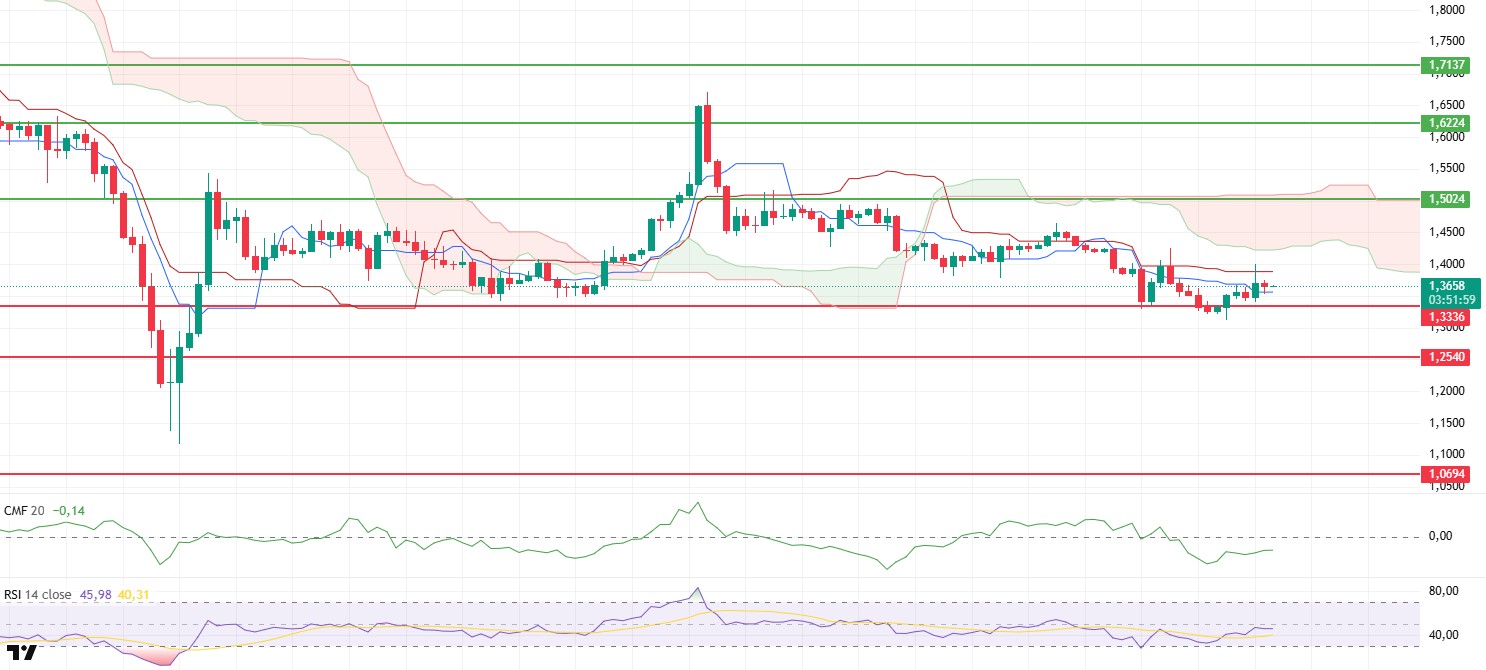
After yesterday’s dip to the $1.33 level, the XRP price regained this area and rose to the $1.40 level with rebound buying. With limited selling in recent hours, the price appears to have stabilized around $1.36. Although the recovery of the support area indicates that selling pressure has weakened in the short term, it cannot be said that the upward movement has yet turned into a strong trend.
The weak liquidity structure has not completely disappeared, but the deterioration appears to have stopped. Although the Chaikin Money Flow (CMF) remains in negative territory, it has ended its downward trend and moved sideways. This suggests that the outflow of money from the market has slowed and selling pressure has weakened compared to the previous period. If the CMF moves into positive territory, upward attempts could be based on a healthier foundation.
The Relative Strength Index (RSI) rose to the 50 level, indicating that momentum is beginning to gain strength. While this movement signals that buyers are back in the game, the RSI’s ability to remain above 50 will be important for the short-term outlook.
Regaining the Tenkan level indicates that short-term pressure has eased. The price being stuck between Tenkan and Kijun, however, signals that the market is still searching for direction. For a clear short-term direction to form, one of these two levels will need to be broken.
In the overall assessment, the $1.33 level is once again a critical defense line. As long as this area is maintained, the price is expected to remain open to upward attempts. Conversely, if $1.33 is lost again, selling pressure could accelerate and a downside scenario could return to the agenda.
Supports: 1.3336– 1.2540 – 1.0694
Resistances: 1.5024 – 1.6224 – 1.7137
SOL/USDT
Butan introduced a digital nomad visa using the Solana blockchain platform.
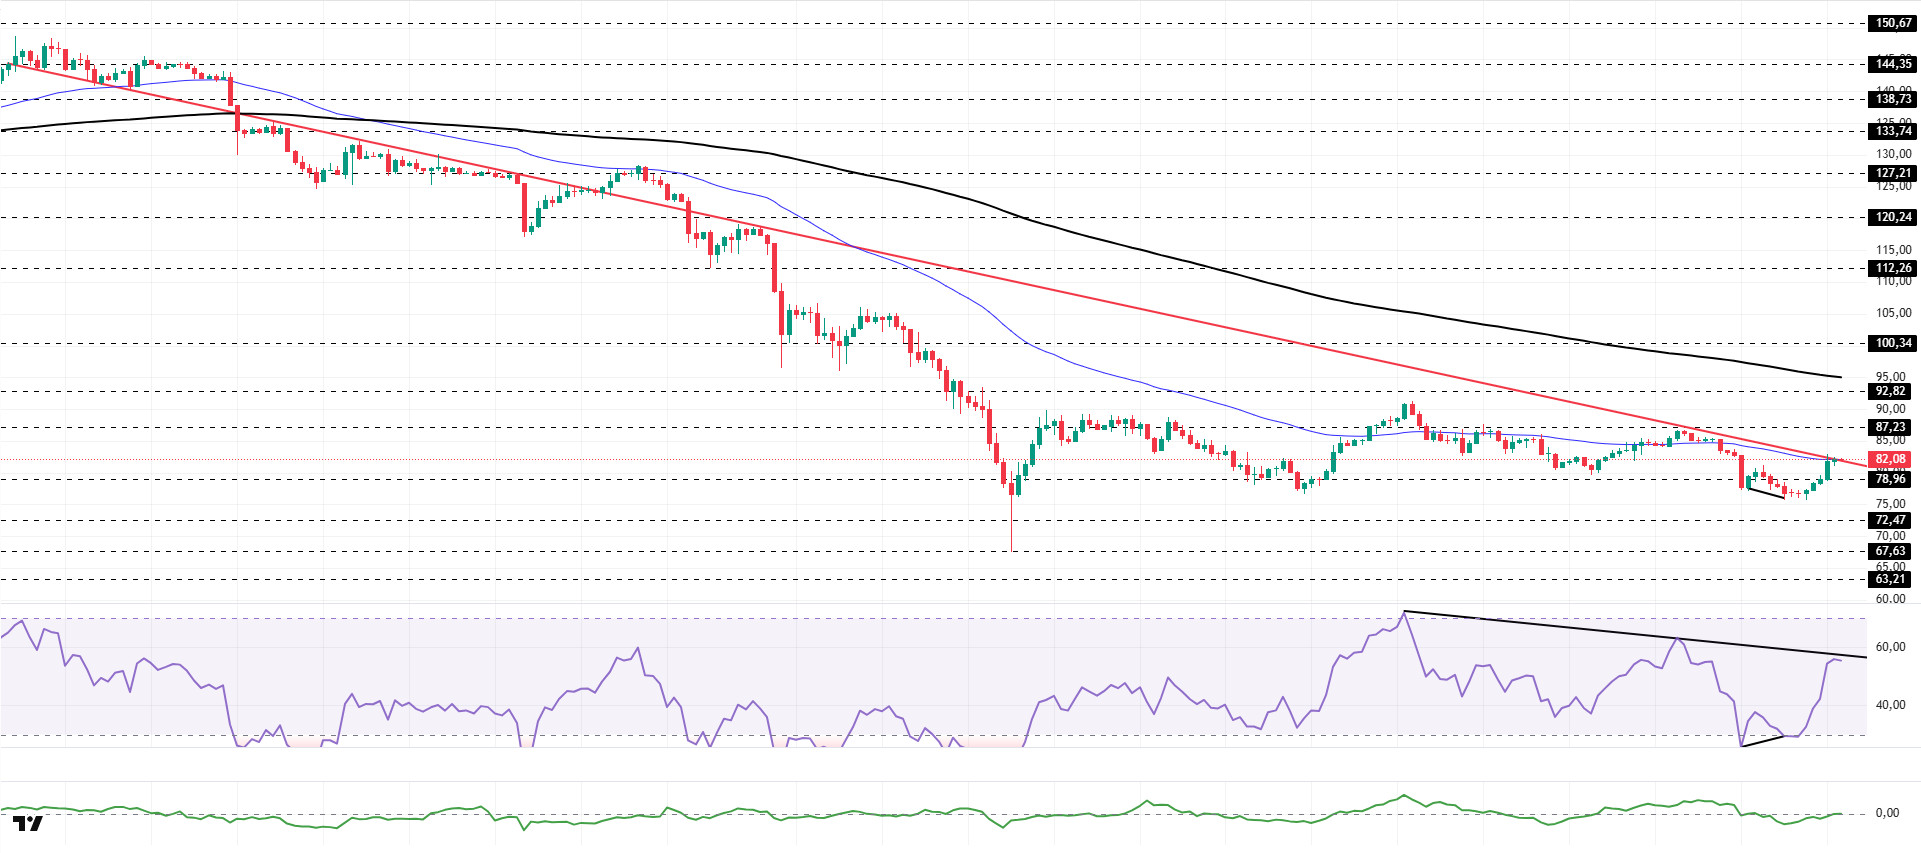
The SOL price showed an upward trend. The asset remained in the lower region of the downward trend that began on January 13. Breaking through the strong resistance level of $78.96 with a strong candle, the asset is currently testing the downward trend and the 50 EMA (Blue Line) moving average as resistance. If the price closes above this level, the 200 EMA (Black Line) moving average could act as resistance. In the event of a pullback, the $72.47 level could be tested as support.
On the 4-hour chart, the 50 EMA (Exponential Moving Average – Blue Line) continues to remain below the 200 EMA (Black Line). This indicates that the downtrend is continuing in the medium term. At the same time, the asset trading below both moving averages suggests that the asset is trending downward in the short term. The Chaikin Money Flow (CMF-20) has risen from negative territory to neutral levels. However, an increase in money inflows could push the CMF into positive territory. The Relative Strength Index (RSI-14) has risen from oversold territory to positive territory. At the same time, it is currently testing the resistance level of the downward trend that began on February 15. If it breaks through this level, buying pressure may increase. In the event of an uptrend due to macroeconomic data or positive news related to the Solana ecosystem, the $92.82 level stands out as a strong resistance point. If this level is broken upwards, the uptrend is expected to continue. In the event of pullbacks due to adverse developments or profit-taking, it may test the $67.63 level. A decline to these support levels could increase buying momentum, presenting a potential upside opportunity.
Supports: 78.96 – 72.47 – 67.63
Resistances: 87.23 – 92.82 – 100.34
DOGE/USDT
The DOGE price experienced a slight increase. The asset, which retreated after encountering resistance at the strong resistance level of the 50 EMA (Blue Line) moving average, tested the rising trend that began on February 5 as a support level, experienced a slight increase, and is preparing to retest the 50 EMA moving average. If it breaks above this level, the $0.09962 level can be monitored as a resistance level. If it experiences a pullback, it may follow the upward trend again.
On the 4-hour chart, the 50 EMA (Exponential Moving Average – Blue Line) remained below the 200 EMA (Black Line). This indicates that a medium-term downtrend is forming. The price being below both moving averages indicates a downward trend in the short term. The Chaikin Money Flow (CMF-20) remained in negative territory. Additionally, the balance of money inflows and outflows may keep the CMF in negative territory. The Relative Strength Index (RSI-14) rose from the oversold zone to the middle of the negative zone. At the same time, it crossed above the upper region of the downward trend that began on February 15, signaling a decrease in selling pressure. On the other hand, positive divergence should be monitored. In the event of potential increases driven by political developments, macroeconomic data, or positive news flow within the DOGE ecosystem, the $0.10442 level stands out as a strong resistance zone. Conversely, in the event of negative news flow, the $0.08090 level could be triggered. A decline to these levels could increase momentum and initiate a new wave of growth.
Supports: 0.09071 – 0.08444 – 0.08090
Resistances: 0.09451 – 0.09962 – 0.10442

BNB/USDT
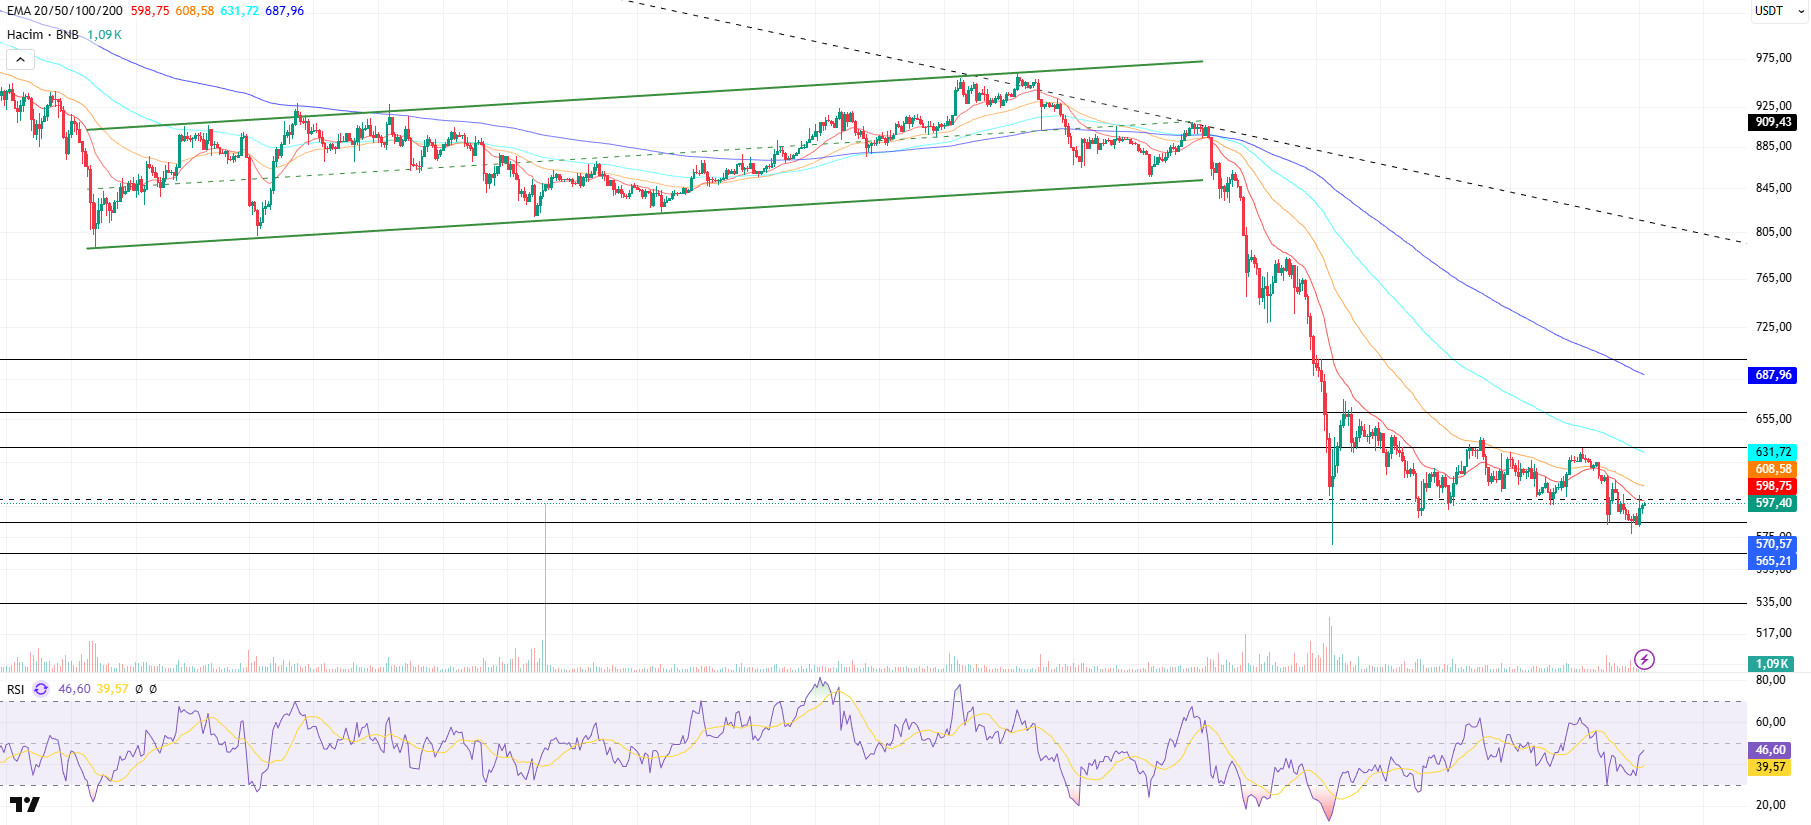
From a technical perspective, BNB, which has been strengthening its upward momentum for some time, has surpassed its previously set target levels and reached the $950 threshold. However, it has begun to retreat, remaining below the downward trend due to the selling pressure encountered in this resistance zone. Furthermore, the decline in the asset’s value has accelerated with the downward break of the current ascending channel.
Technical indicators for the asset, currently trading in the $585-$635 range, show that the declining trading volume is supporting the pullback momentum. In addition, the Relative Strength Index (RSI) moving slightly above the 30 level is considered critical data confirming the current technical outlook.
Accordingly, if selling pressure intensifies, the price is expected to test the $585 support level first. If this level is broken downwards, the possibility of a pullback towards the $565 and $535 support zones will remain on the agenda.
If buying appetite continues and market momentum strengthens, the asset is expected to retest the $635 resistance level in the first stage. If this level is exceeded, it appears technically possible to break above the falling trend line. If the trend breakout is confirmed and the price maintains its position above this zone, the $660 and $700 levels can be tracked as the next upside targets.
Supports: 585 – 565 – 535
Resistances: 635 – 660 – 700
Legal Notice
The investment information, comments, and recommendations contained herein do not constitute investment advice. Investment advisory services are provided individually by authorized institutions taking into account the risk and return preferences of individuals. The comments and recommendations contained herein are of a general nature. These recommendations may not be suitable for your financial situation and risk and return preferences. Therefore, making an investment decision based solely on the information contained herein may not produce results in line with your expectations.
