
Technical Analysis
BTC/USDT
U.S. Treasury Secretary Bessent announced that more than half of the interviews for the Fed chair position have been completed and the first round will conclude next week. Donald Trump Jr. stated that his father has no interest in stablecoin or blockchain ledger transactions and that WLFI ventures are not connected to the administration. In Japan, Metaplanet increased its revenue by 100% and operating profit by 88% in the third quarter; Bitcoin revenue recorded a 115.7% increase on a quarterly basis at 2.4 billion yen. In Sweden, lawmakers proposed adding Bitcoin to national reserves as “digital gold.”
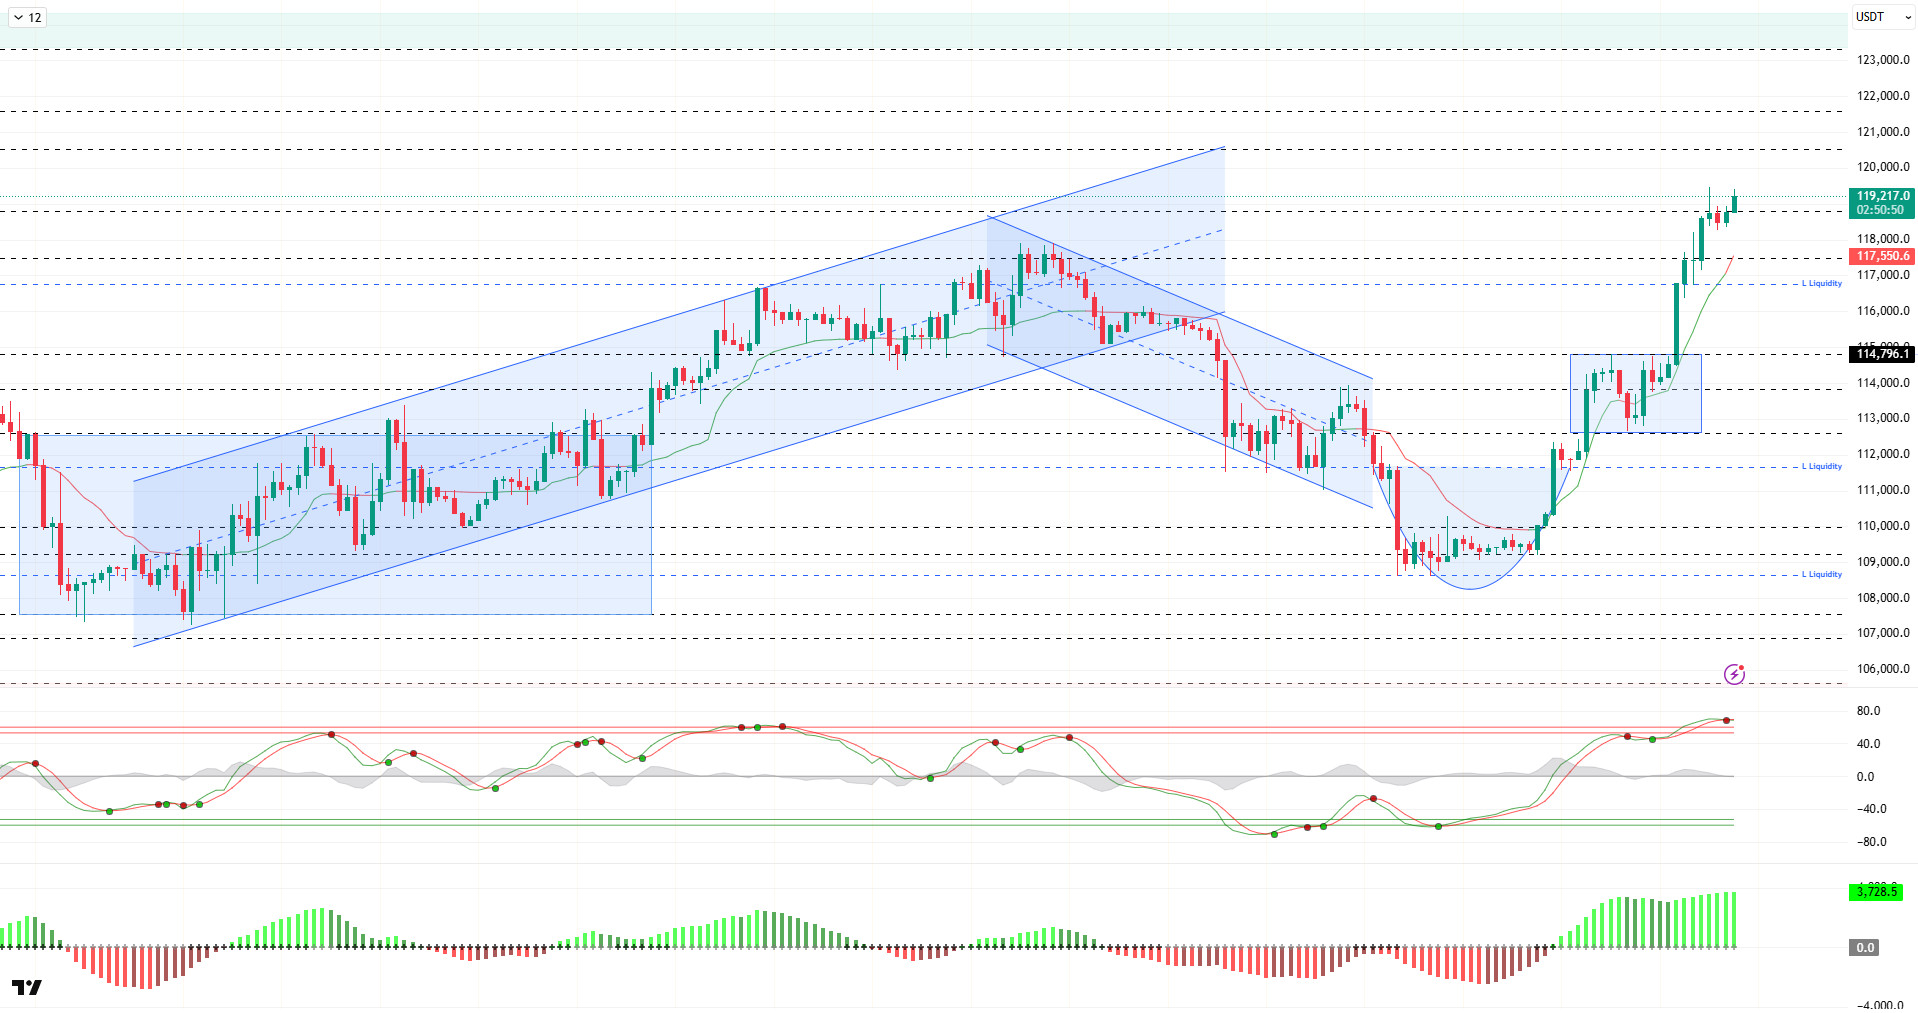
Looking at the technical picture, BTC continues to carry its upward momentum captured with the cup formation. The “W” formation in the broader time frame is completing at the 123,400 level. BTC, which was moving at the 118,500 level in the previous analysis, regained momentum and reached the 119,400 level.
Technical indicators signaled a trend reversal parallel to the short-term sell signal given by the Wave Trend oscillator (WT) in the overbought zone. Then, the oscillator, which gave a buy signal again, turned upward once more, rose above the overbought zone, and produced a sell signal. The Squeeze Momentum (SM) indicator’s histogram continues its momentum within the positive zone. The Kaufman moving average is currently trading below the price at the 117,500 level.
Upon examining the liquidation data, the 118,800 level, which has long been highlighted as a liquidity zone, was breached along with the recent upward movement, resulting in the liquidation of positions in this zone. This development led to a strengthening of the buying tiers despite the thinning of the selling tiers. In the short term, the 116,600 level stands out as the first buying level, while in a broader time frame, the 112,200 level is noteworthy as an accumulation zone. Looking at the last 24 hours, $236 million worth of BTC short positions were liquidated, while $24.84 million worth of long positions were liquidated. Thus, the total liquidation amount in the market reached approximately $600 million.
In summary, while the US government shutdown had no significant impact on the markets, Fed members’ differing views on interest rate cuts and the return of tariffs to the agenda were among the key developments. The negative outlook for short-term interest rate cuts regained momentum with interest rate cut expectations rising to 98%. On the BTC side, it made a strong entry into October, which saw double-digit averages in terms of cyclical movements, with a 4% increase. The cup formation in the technical outlook supports the price’s recovery trend, while liquidity data continues to point to the target zone. In this context, if the 119,000 level is surpassed, the 123,400 level could complete the W structure. On the other hand, the 115,000 level will be monitored as a reference zone in the event of potential selling pressure.
Supports 116,000 – 117,400 – 115,000
Resistances 119,000 – 117,400 – 115,000
ETH/USDT
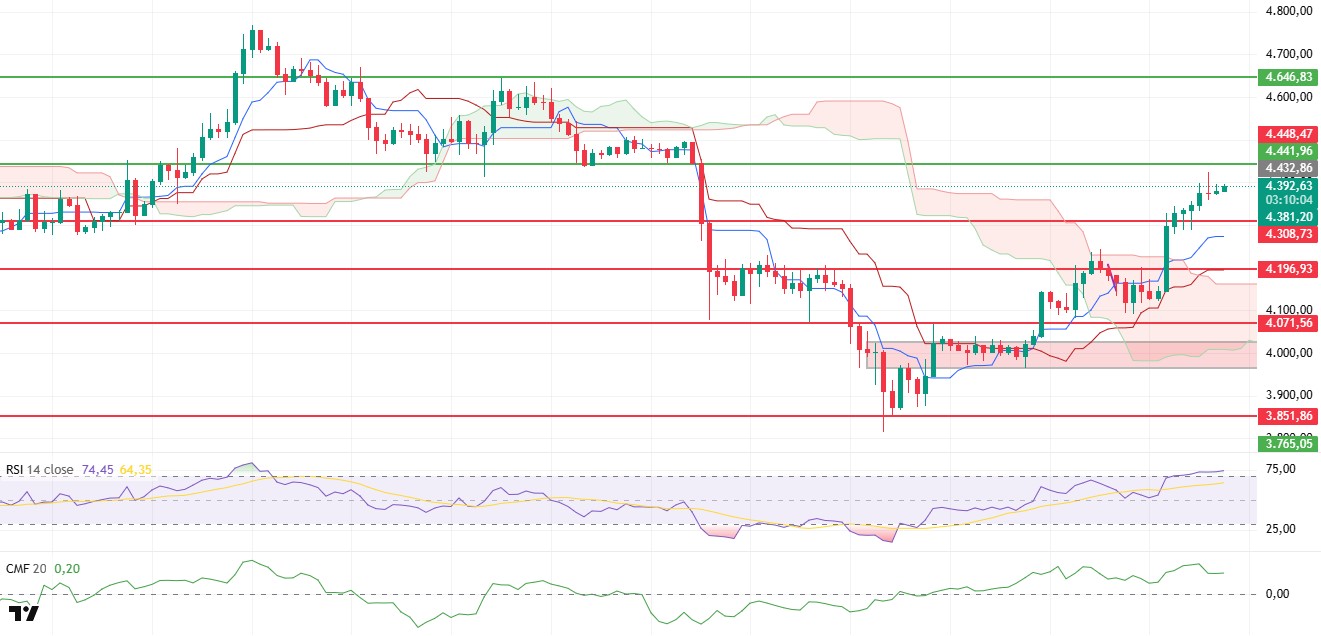
Following yesterday’s strong rally, the ETH price is currently stuck in the $3,380 – $3,400 range today. Although the short-term outlook is flat, technical indicators maintaining their positive trend suggests that buyer appetite in the market continues. This points to the possibility of a new upward movement following the consolidation process.
Although the Chaikin Money Flow (CMF) indicator shows a slight pullback, it remains in positive territory. This indicates that liquidity entering the market remains strong and buyers continue to support the market. The Cumulative Volume Delta (CVD) indicator also shows that the intensity of long positions opened, particularly on the futures side, is being maintained. This structure confirms that the uptrend is being fueled by both leveraged trading and the spot side.
The Ichimoku indicator clearly shows that the price remaining above the Kumo cloud maintains the positive trend. The price trading above the Tenkan and Kijun levels indicates that buyers continue to hold a technical advantage. The Relative Strength Index (RSI) indicator is still in the overbought zone. While this increases the possibility of short-term consolidation, it should be noted that in strong trends, the RSI can remain in this zone for a long time.
In general, the ETH price is expected to test the $3,441 level. If this resistance is broken, the upward movement is likely to gain momentum and move towards higher levels. On the other hand, the $3,308 level stands out as critical support. If the price falls below this level, selling pressure may increase and short-term pullbacks may occur.
Supports: 4,308 – 4,196 – 4,071
Resistances: 4,441 – 4,646 – 4,857
XRP/USDT
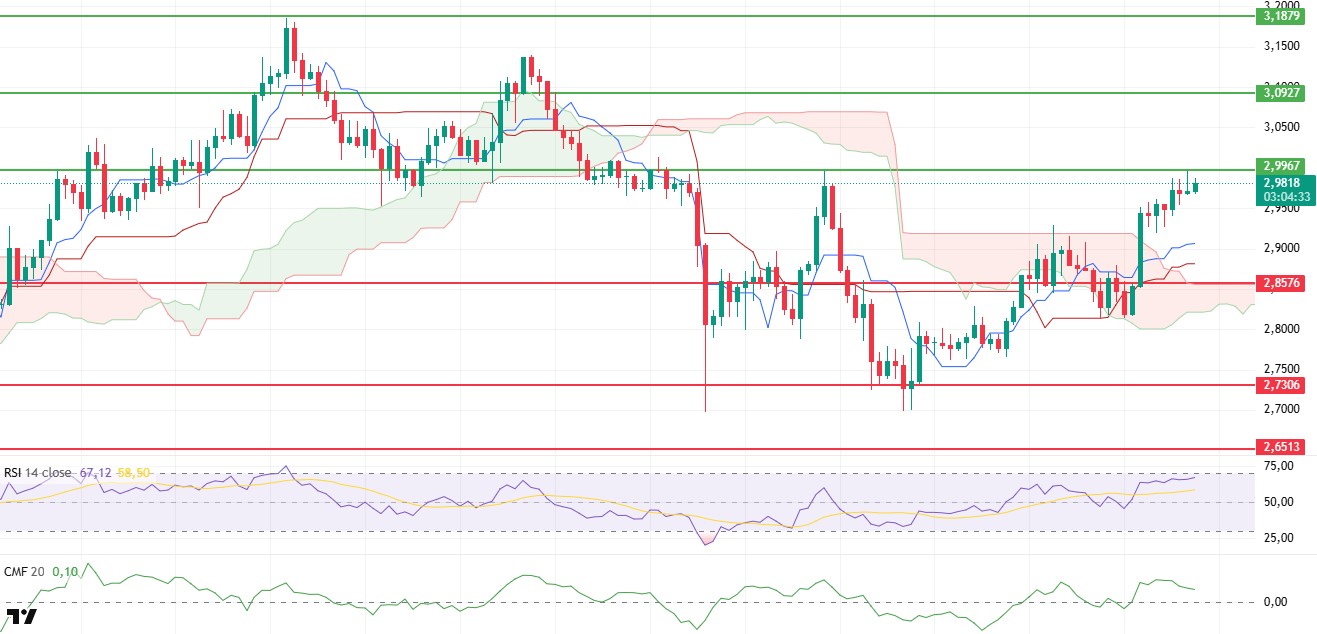
The XRP price strengthened its upward trend yesterday by surpassing the $2.8570 level and reached the critical resistance level of $2.99 today. This movement clearly demonstrates that buyers continue to dominate the market and that the trend remains positive in the short term. In particular, holding above $2.90 facilitates the price’s gradual targeting of higher levels.
The Chaikin Money Flow (CMF) indicator remaining in positive territory signals that new capital inflows into the market are continuing and that strong liquidity flows are persisting. This indicates that the uptrend is not merely short-term speculative activity, but that buyers’ steady demand is supporting the market. The upward trend in the Relative Strength Index (RSI) confirms that momentum remains strong and buyers maintain their dominance.
Closings above the Kumo cloud in the Ichimoku indicator clearly show that the trend has turned positive. Remaining above the Tenkan and Kijun levels is also an important signal indicating that buyers maintain their technical advantage. This structure stands out as one of the strong technical indicators supporting the short-term bullish scenario.
In the coming period, the $2.99 level should be closely monitored as a critical resistance. If this level is broken, the price is expected to rise rapidly towards $3.09, and buyers’ momentum may strengthen further. However, if this resistance cannot be broken, the price is likely to experience a short-term consolidation process in the $2.93–$2.90 range. On the other hand, the $2.8576 level is a strong support. Losing this level could increase selling pressure and cause the price to retreat back towards the $2.73 level.
Supports: 2.8576 – 2.7306 – 2.6513
Resistances: 2.9967 – 3.0927 – 3.1879
SOL/USDT
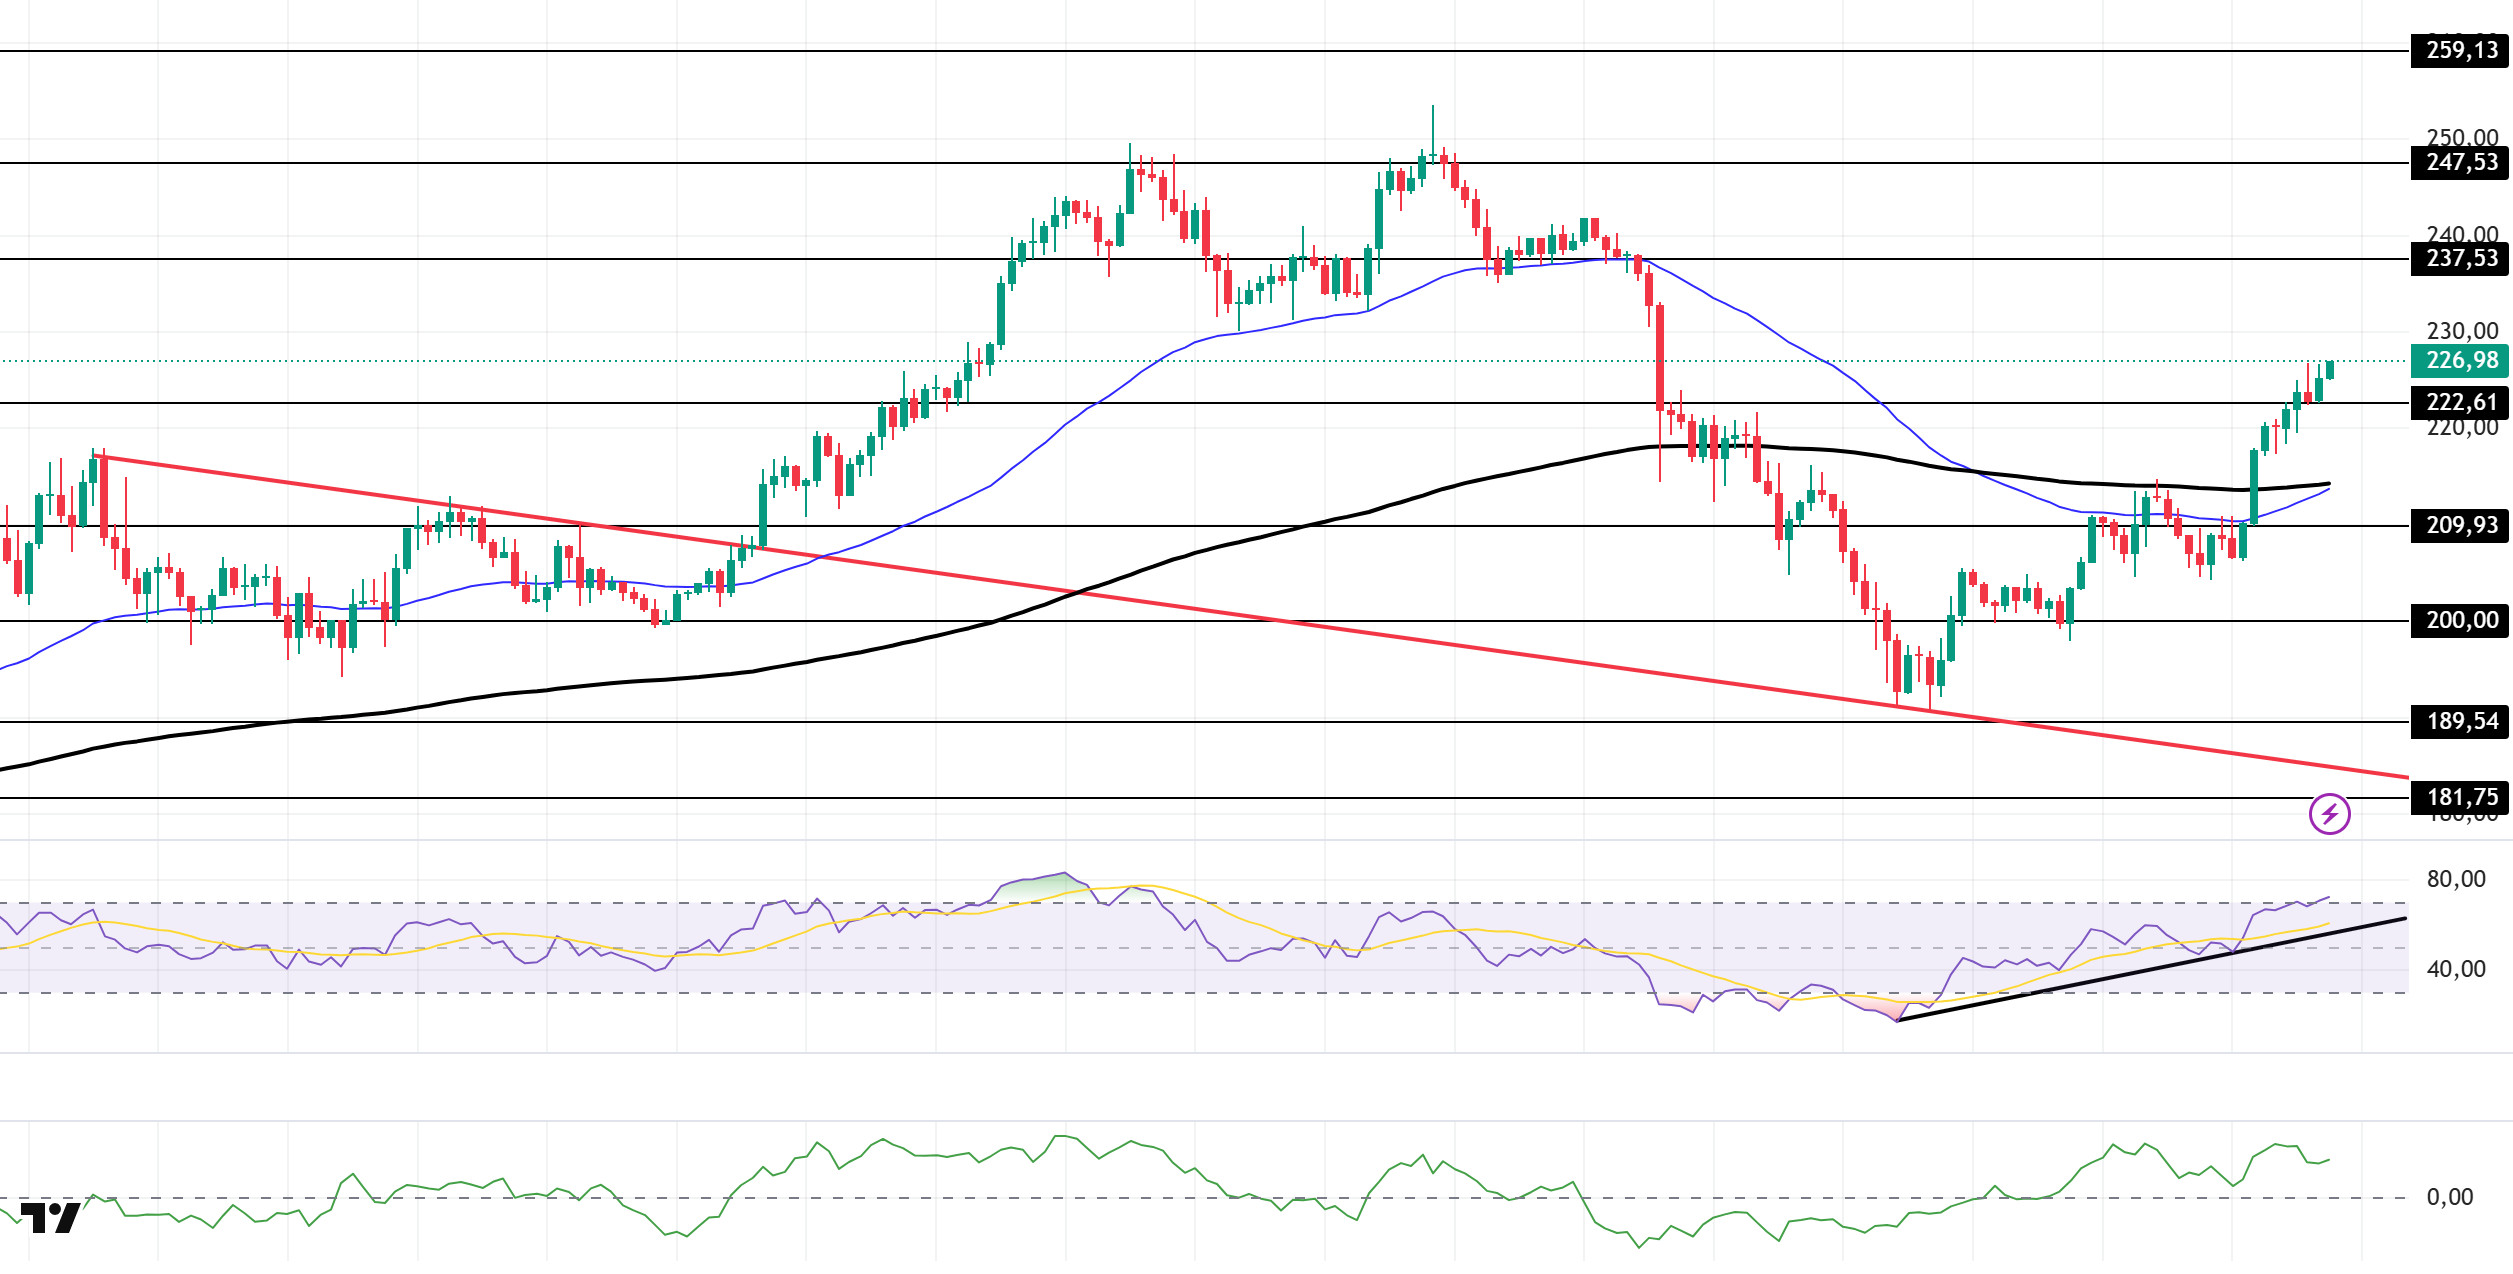
The SOL price remained flat during the day. The asset continues to trade in the upper region of the descending trend that began on August 29. The price, which broke above the 50 EMA (Blue Line) moving average and the 200 EMA (Black Line) moving average with a strong bullish candle, continues to trade above the strong resistance level of $222.61, maintaining its momentum. If the upward trend continues, it could test the $237.53 level. In case of pullbacks, the $209.93 level can be monitored.
On the 4-hour chart, it continues to remain below the 50 EMA (Exponential Moving Average – Blue Line) and 200 EMA (Black Line). This indicates a possible downward trend in the medium term. At the same time, the price being above both moving averages shows us that the asset is trending upward in the short term. The Chaikin Money Flow (CMF-20) remained in positive territory. However, an increase in cash inflows could push the CMF to the upper levels of the positive zone. The Relative Strength Index (RSI-14) also remained in positive territory. It also continued to be in the upper region of the upward trend that began on September 25. This signaled that the upward pressure was continuing. However, profit-taking in the overbought zone could pull the price back. If there is an upward movement due to macroeconomic data or positive news related to the Solana ecosystem, the $237.53 level stands out as a strong resistance point. If this level is broken upwards, the uptrend is expected to continue. If pullbacks occur due to developments in the opposite direction or profit-taking, the $200.00 level could be tested. A decline to these support levels could increase buying momentum, presenting a potential upside opportunity.
Supports: 222.61 – 209.93 – 200.00
Resistances: 237.53 – 247.53 – 259.13
DOGE/USDT
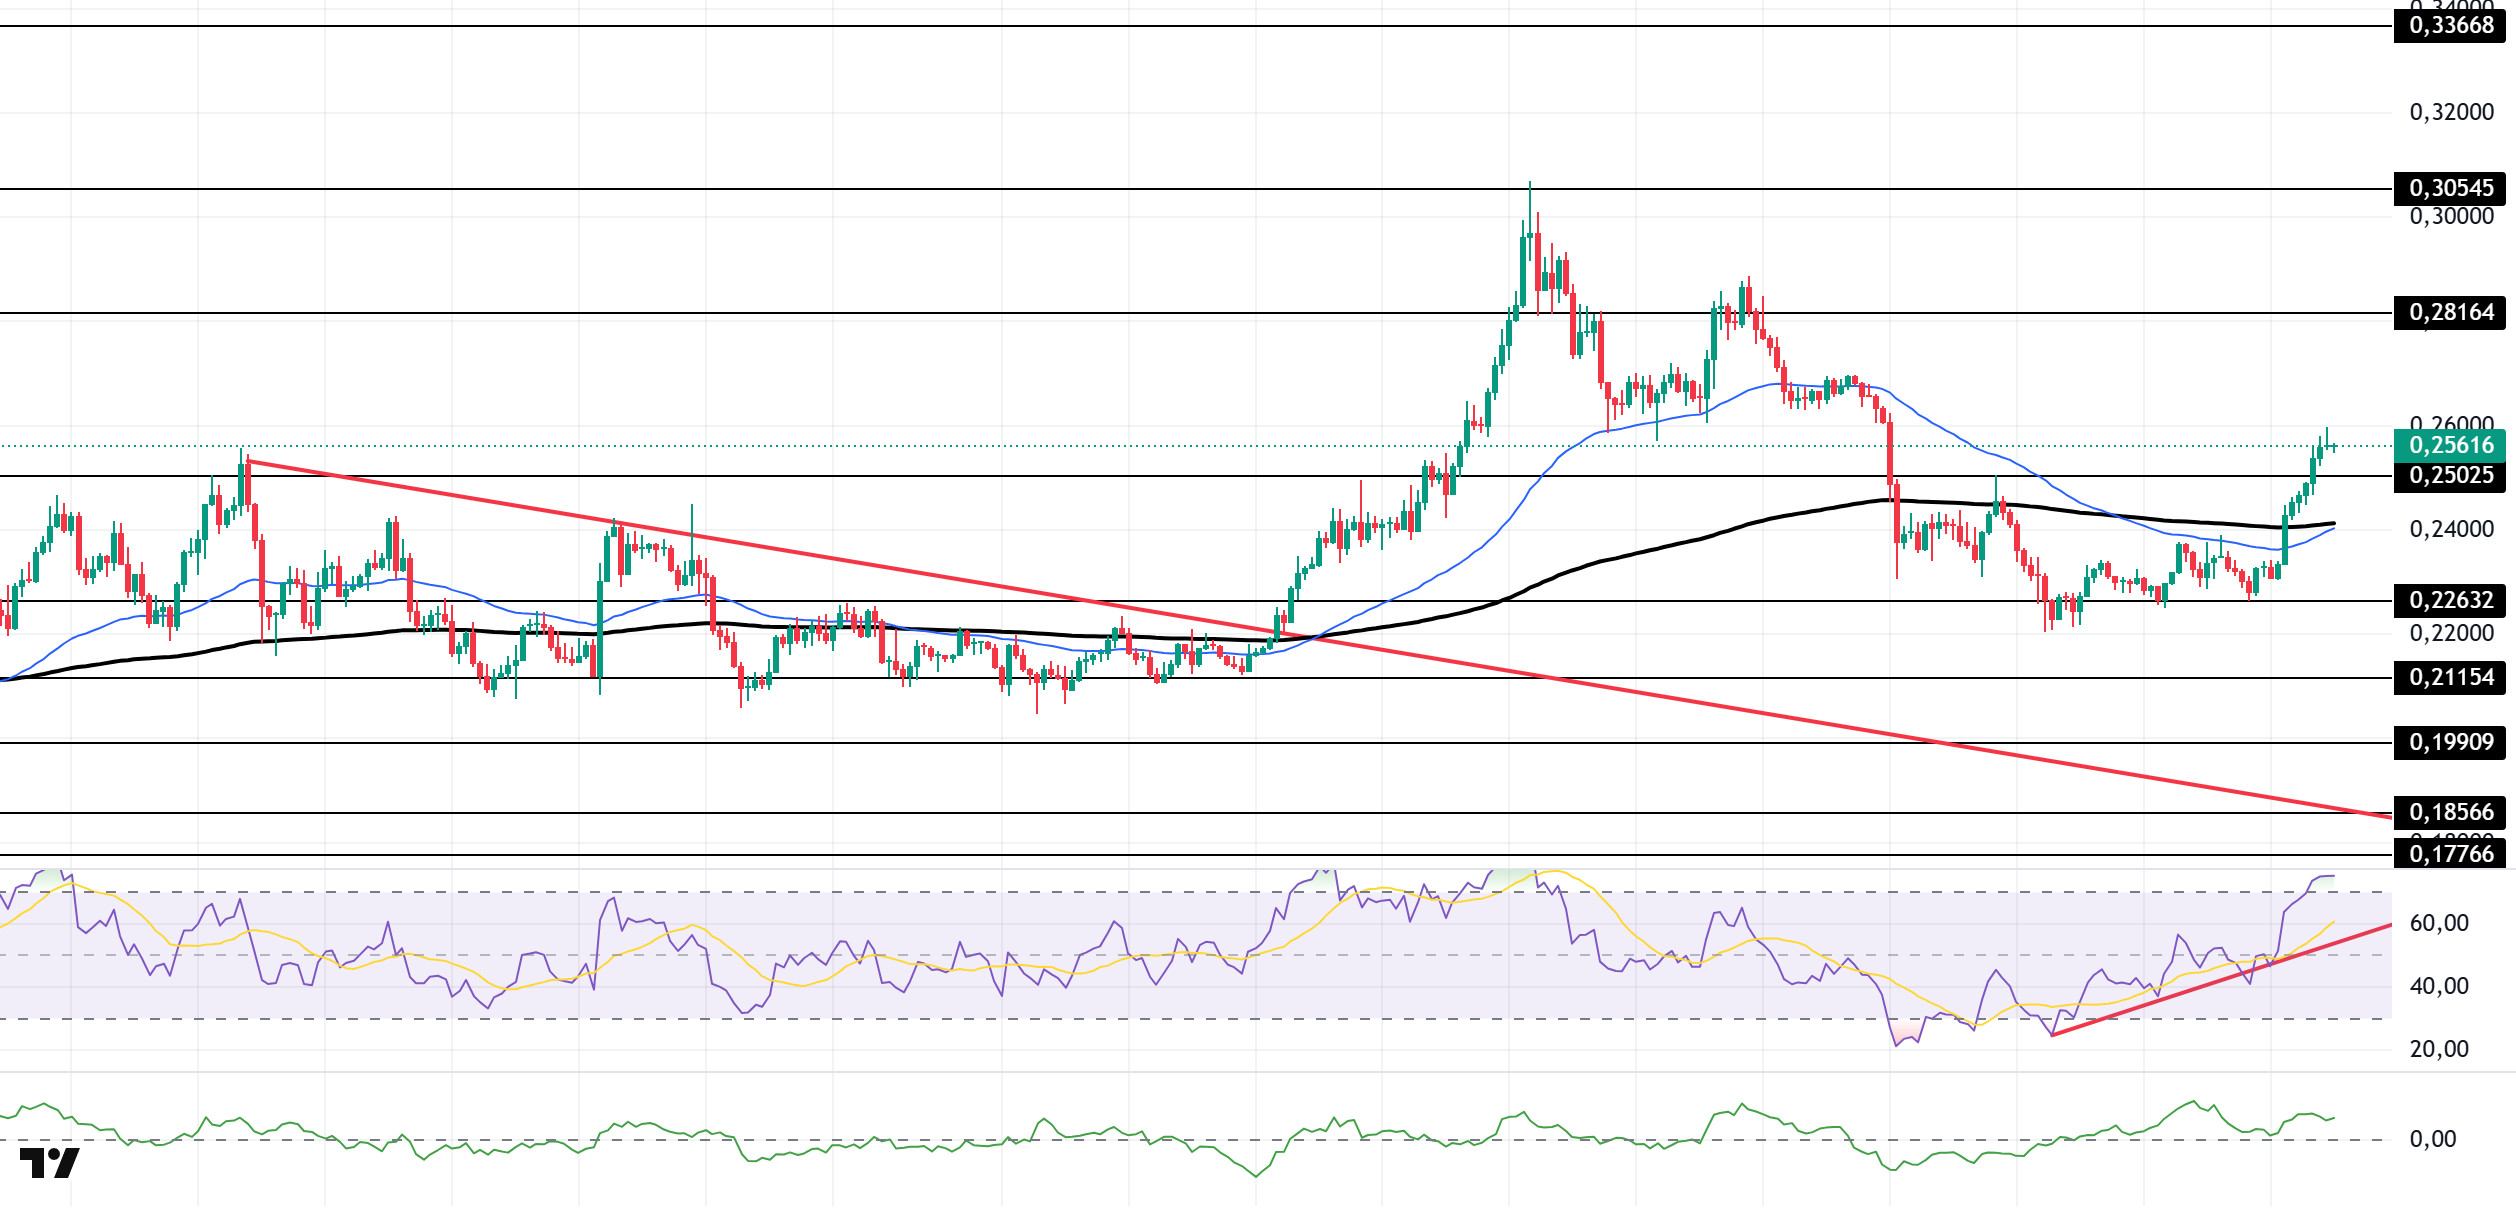
The DOGE price traded sideways during the day. The asset remained above the downward trend that began on August 14. Breaking above the strong resistance level of the 200 EMA (Exponential Moving Average – Black Line), the price managed to stay above the strong resistance level of $0.25025 while maintaining its momentum. If the upward trend continues, it may test the $0.28164 level as resistance. In the event of a pullback, it may test the $0.22632 level as support in the event of candle closes below the moving average.
On the 4-hour chart, the 50 EMA (Exponential Moving Average – Blue Line) remained below the 200 EMA (Black Line). This indicates a downward trend in the medium term. The price being above both moving averages indicates a short-term upward trend. The Chaikin Money Flow (CMF-20) managed to stay in positive territory. Additionally, balanced cash inflows could keep the CMF in positive territory. The Relative Strength Index (RSI-14) gained upward momentum from the rising direct support that began on September 25 and rose to the overbought level. This could bring profit-taking. In the event of potential increases driven by political developments, macroeconomic data, or positive news flow within the DOGE ecosystem, the $0.28164 level stands out as a strong resistance zone. Conversely, in the event of negative news flow, the $0.22632 level could be triggered. A decline to these levels could increase momentum and potentially initiate a new upward wave.
Supports: 0.25025 – 0.22632 – 0.21154
Resistances: 0.28164 – 0.30545 – 0.33668
TRX/USDT
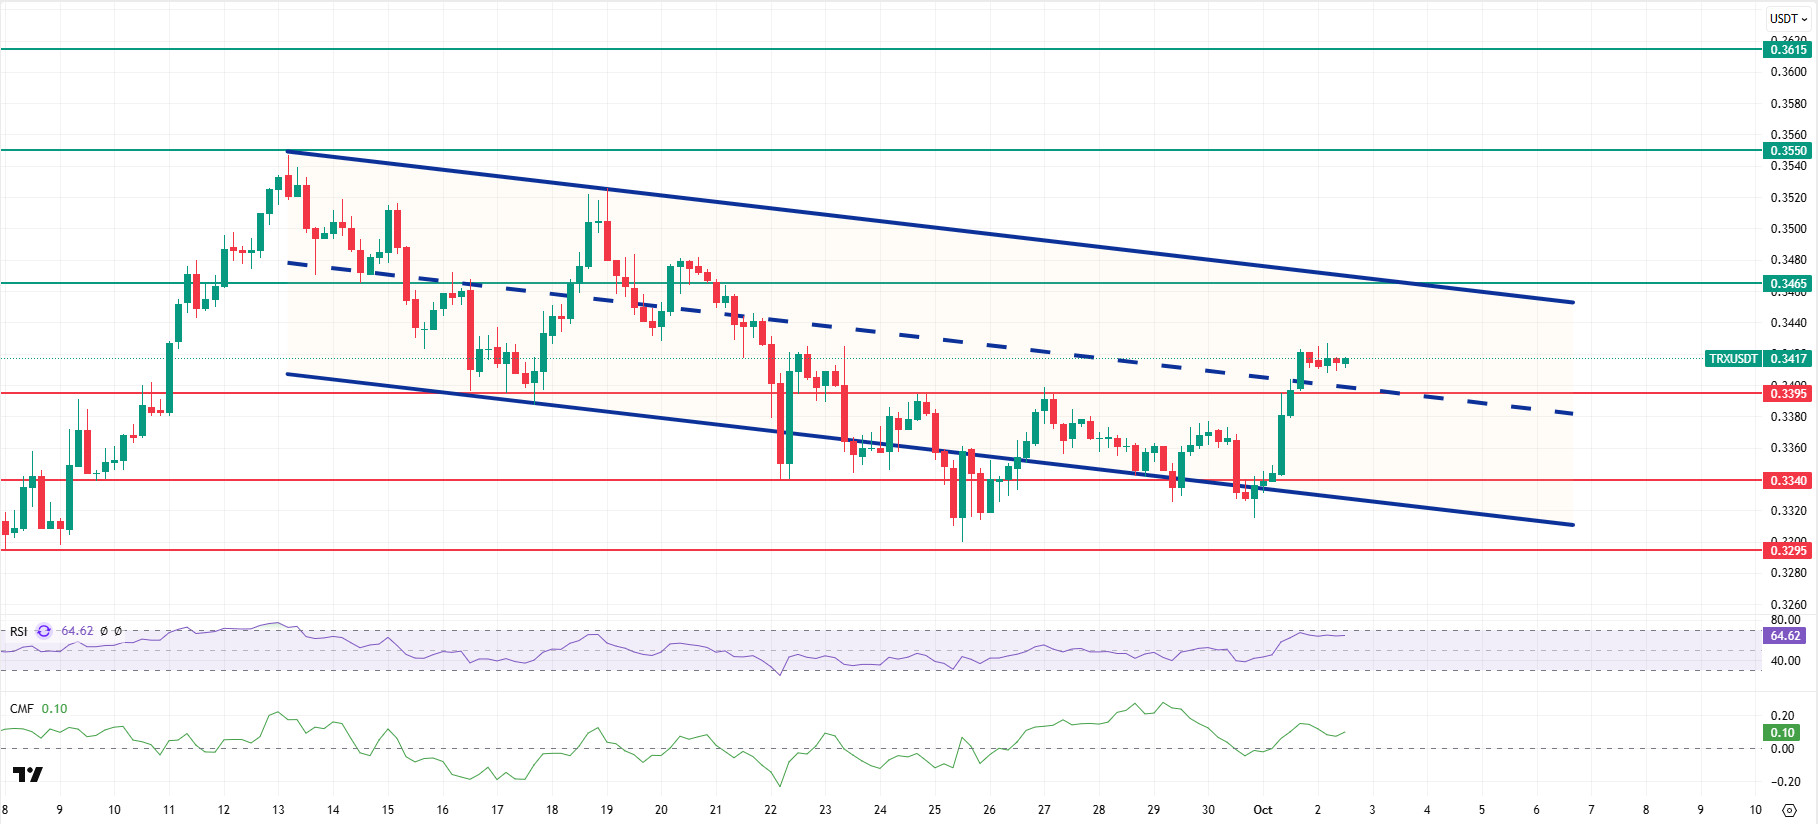
As mentioned in this morning’s analysis, TRX managed to stay above the 0.3395 support level after the decline and continues to move within the bearish channel, currently trading at 0.3417. Currently in the middle of the bearish channel, TRX is trading very close to the 0.3395 support level on the 4-hour chart. The Relative Strength Index (RSI) value is seen to be close to the overbought zone at 64. In addition, the Chaikin Money Flow (CMF) indicator continues to remain above the zero level at a value of 0.10, indicating that money inflows are continuing. The CMF remaining in positive territory can be considered an indicator that the price may experience an increase.
In light of all these indicators, TRX may rise slightly in the second half of the day and move towards the upper band of the bearish channel. In such a case, it may test the 0.3465 resistance level. With a candle close above the 0.3465 resistance level, the rise may continue and it may test the 0.3550 resistance level. If the 0.3465 resistance level is not closed with a candle, money inflows may weaken as the CMF also moves into negative territory, and the price may test the 0.3395 and 0.3340 support levels in succession after a possible decline.
On the 4-hour chart, 0.3295 is an important support level, and as long as it remains above this level, the upward trend is expected to continue. If this support level is broken, selling pressure may increase.
Supports 0.3395 – 0.3340 – 0.3295
Resistances 0.3465 – 0.3550 – 0.3615
SHIB/USDT
The latest data flow in the Shiba Inu ecosystem shows that participant interest remains limited and that a clear expansion in volume is needed for strong momentum. According to Coinglass data, daily trading volumes averaged around $200 million in September, while at the beginning of October, they remained around $150 million, close to CoinMarketCap’s spot volume estimate of $206 million. Historically, the largest rallies occurred alongside high volume spikes in 2021 and 2024, and the current level of participation does not yet appear sufficient for a strong trend. However, the decline in SHIB balances on exchanges to their lowest levels since 2023 indicates a decrease in supply ready for sale and that investors are waiting for better conditions, creating a structural support factor. In the broader context, a sustained increase in trading volume and a continued decline in exchange reserves stand out as two key variables that strengthen the ecosystem’s potential for sustainable recovery.
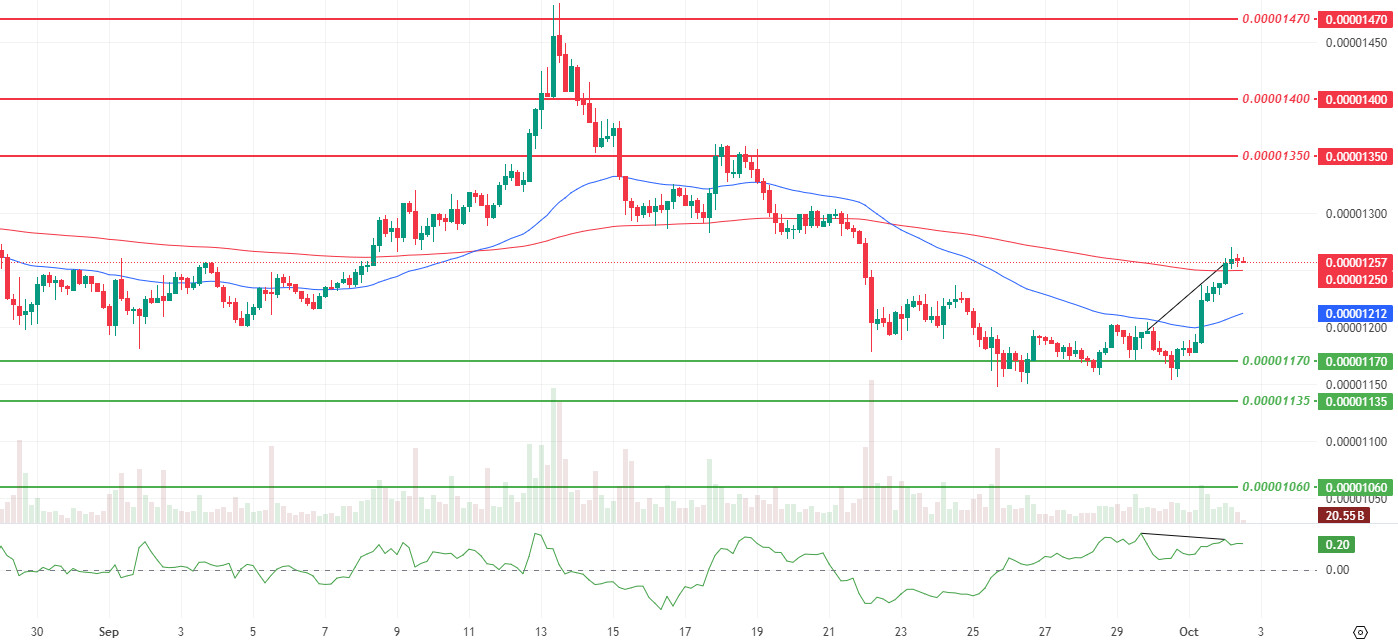
In the technical outlook, short-term strength is giving way to a cautious balance, with volatility declining amid a slowdown in momentum and no significant change in volume, pulling price behavior into a tight band. The persistence above the 200 Exponential Moving Average (EMA), which we highlighted in our last assessment, is maintained, and the price is hovering around the $0.00001260 level. Following the negative divergence (Black Line) between the Chaikin Money Flow (CMF) and the price, a horizontal trend has become apparent, indicating that upward momentum may be limited. While the $0.00001270 and $0.00001350 levels continue to be monitored as intermediate resistance levels, while on the downside, the $0.00001224 level is the first support, and below this level, the $0.00001190 and $0.00001170 levels maintain their current defensive line position.
In summary, while the placement above the EMA 200 remains positive, the weakening momentum, stagnant volume, and subsequent horizontal movement following the negative divergence from the CMF indicate that the sustainability of the upward movement requires repeated closes above the moving averages and a convincing revival in volume. (EMA50: Blue line, EMA200: Red line)
Supports 0.00001170 – 0.00001135 – 0.00001060
Resistances: 0.00001350 – 0.00001400 – 0.00001470
Legal Notice
The investment information, comments, and recommendations contained herein do not constitute investment advice. Investment advisory services are provided individually by authorized institutions taking into account the risk and return preferences of individuals. The comments and recommendations contained herein are of a general nature. These recommendations may not be suitable for your financial situation and risk and return preferences. Therefore, making an investment decision based solely on the information contained herein may not produce results in line with your expectations.

